the economic and societal impact of motor vehicle crashes
TRANSCRIPT

THE ECONOMIC AND SOCIETAL IMPACT OF MOTOR VEHICLE CRASHESLarry Blincoe, National Highway Traffic Safety Administration
CompanyLogo Here

SAE INTERNATIONAL
2010 2000Fatalities 32,999 41,821Nonfatal Injuries 3.9 million 5.3 millionDamaged Vehicles 24 million 28 millionEconomic Cost $277 billion $231 billionSocietal Harm $871 billion NA
Basic Findings
Paper # (if applicable) 2

SAE INTERNATIONAL
Many Crashes are Unreported
Paper # (if applicable) 3
0%
10%
20%
30%
40%
50%
60%
70%
80%
90%
100%
PDO MAIS0 MAIS1 MAIS2 MAIS3 MAIS4 MAIS5 Fatal
Distribution of Police Reported/Unreported Injuries
Police Reported Unreported

SAE INTERNATIONAL
Medical CareEmergency ServicesMarket ProductivityHousehold ProductivityLegal CostsInsurance Administrative CostsWorkplace CostsProperty DamageCongestion
Economic Cost Components
Paper # (if applicable) 4

SAE INTERNATIONAL
Which Impacts are the Most Costly?
Paper # (if applicable) 5

SAE INTERNATIONAL
Comprehensive Impacts
Paper # (if applicable) 6
Medical4%
EMS0% Market Productivity
8% HH Prod3%
Insurance3%
Workplace0%
Legal2%
Congestion3%
Prop. Damage9%
Lost Quality of Life68%
Components of Comprehensive Costs

SAE INTERNATIONAL
Who Pays the Costs?
Paper # (if applicable) 7
9%
52%
14%
25%
Source of Payment for Motor Vehicle Crash Costs
Government
Private Insurer
Other
Self

SAE INTERNATIONAL
Alcohol useSpeedingDistracted DrivingMotorcycle Helmet non-useSeat Belt non-use
Costs of Behavioral Risk Factors
Paper # (if applicable) 8

SAE INTERNATIONAL
Alcohol involvement by crash severity
Paper # (if applicable) 9
0%
10%
20%
30%
40%
50%
60%
70%
80%
90%
100%
PDO MAIS0 MAIS1 MAIS2 MAIS3 MAIS4 MAIS5 Fatal
No Alcohol
.01‐.07 BAC
>=.08 BAC

SAE INTERNATIONAL
Crash risk rises dramatically when BAC exceeds .08
Paper # (if applicable) 10

SAE INTERNATIONAL
Alcohol is not necessarily the cause of the crash
Paper # (if applicable) 11
0.00%
10.00%
20.00%
30.00%
40.00%
50.00%
60.00%
70.00%
80.00%
90.00%
100.00%
BAC = .01‐.04 BA =.05‐.07 BAC = .08+ BAC = .01+
SAE INTERNATIONAL
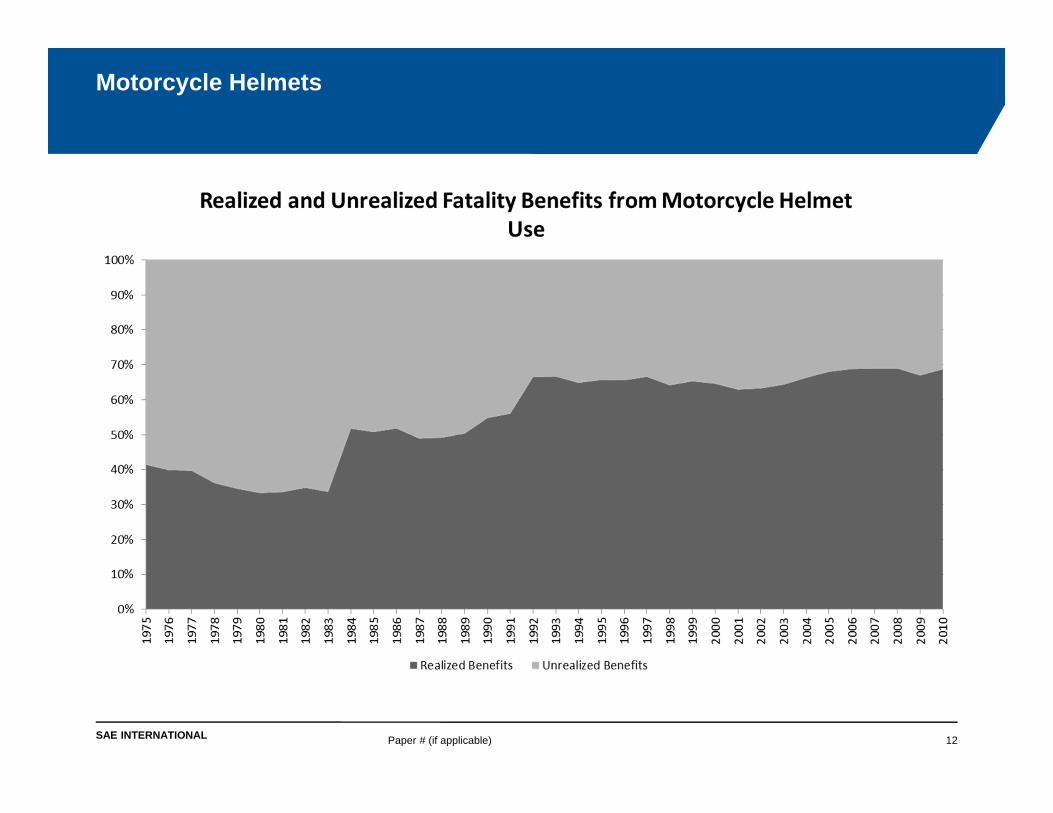
Motorcycle Helmets
Paper # (if applicable) 12

SAE INTERNATIONAL
Saved Lost % Realized
Lives (annual) 1,556 708 69%
Lives 1975-2010 33,544 28,878 54%
Economic B$ (annual) $3 $1 68%Economic B$ 1975-2010 $62 $49 56%
Harm B$ (annual) $17 $8 69%
Harm B$ 1975-2010 $370 $300 55%
Impacts of Motorcycle Helmet Use
Paper # (if applicable) 13

SAE INTERNATIONAL
Seat Belts
Paper # (if applicable) 14

SAE INTERNATIONAL
Saved Lost % Realized
Lives (annual) 12,500 3,350 79%
Lives 1975-2010 280,000 367,000 43%
Economic B$ (annual) $69 $14 83%Economic B$ 1975-2010 $1,610 $1,490 52%
Harm B$ (annual) $349 $72 83%
Harm B$ 1975-2010 $8,066 $7,776 51%
Impacts of Seat Belt Use
Paper # (if applicable) 15

SAE INTERNATIONAL
Relative Impact of Behavioral Risk Factors, Economic Costs
Paper # (if applicable) 16
$0
$10
$20
$30
$40
$50
$60
AlcoholInvolvement
Alcohol Causation Speed Distraction Belt Non-Use Helmet Non-use
Economic Cost of Behavioral Risk Factors($B)

SAE INTERNATIONAL
Relative Impact of Behavioral Risk Factors, Societal Harm
Paper # (if applicable) 17
$0
$50
$100
$150
$200
$250
AlcoholInvolvement
Alcohol Causation Speed Distraction Belt Non-Use Helmet Non-use
Comprehensive Cost of Behavioral Risk Factors($B)

SAE INTERNATIONAL
Cost Summary
Paper # (if applicable) 18

SAE INTERNATIONAL
Incidence Summary
Paper # (if applicable) 19