table of contents: - clo - central legal office · web viewclinical negligence and other risks...
TRANSCRIPT
NHS National Services Scotland — Supporting Scotland's Health
Clinical Negligence & Other Risks Indemnity Scheme (CNORIS)
Annual Report 2016-2017
Scheme Director: David Knowles
NHS National Services Scotland
Date Published: July 2017
[For all enquiries please contact the Scheme Manager, Irene A Hallett (Email: [email protected] - Tel No: 0131 275 7549]

CNORIS Annual Report 2016-2017
Table of Conten ts:
Introduction........................................................................................................................................ 3Outturn for 2016-17............................................................................................................................ 4
Table 1: CNORIS Payments by Members 2016-17...........................................................4
Incident Timeline................................................................................................................................5Graph 1: Claims Paid 2016-17 by Year of Incident........................................................... 5
Trends in Payments........................................................................................................................... 6Table 2: Payments made since 2005-06.............................................................................................. 6
Graph 2: Value of Claims Paid during 2014-15, 2015-16 & 2016-17...................................................7Graph 3: Number of Claim Payments made during 2014-15, 2015-16 & 2016-17.............................. 8
Periodic Payment Orders and Structured Settlements 2016-17.................................................... 9Contributions and Claims Paid.........................................................................................................9
Graph 4: Contributions & Claims Paid – 3 Year Total....................................................... 10Analysis of Claims by Year of Incident and Year Received........................................................... 11Graph 5: Breakdown of No. of All Claims............................................................................................. 11Graph 6: Breakdown of CNORIS Payments 2007-08 to 2016-17........................................................12
Graph 7: CNORIS Payments made 2007-08 to 2016-17 by Speciality Group.....................................13Graph 8: CNORIS Payments by Years of Incidents and Claims Received..........................................14
Pipeline Analysis................................................................................................................................ 15Graph 9a: Pipeline Analysis of Open Claims....................................................................................... 15
Graph 9b: Pipeline Analysis of Open claims (adjusted for risk)........................................................... 15Appendix 1: Background, Definitions, and Key Delivery Partners………………………............... 16Appendix 2: Organisations covered by CNORIS............................................................................ 17Notes ................................................................................................................................................. 18
Version: 1.0 (July 2017) Page: 2 of 20Author: NHS National Services Scotland
CNORIS Annual Report 2016-2017
IntroductionClinical Negligence and Other Risks Indemnity Scheme (CNORIS) is a risk transfer and financing scheme for Health and Social Care across Scotland and was first established in 1999 by the Scottish Government Health Directorates in partnership with Willis Limited. The primary objective is to provide cost-effective risk pooling and claims management arrangements for members of the Scheme who include: NHS Health Boards, Special Health Boards and Health & Social Care Integration Joint Boards from across Scotland1.
With effect from the 1st September 2013 NHS National Services Scotland (NSS) took over responsibility for managing the Scheme from Willis Limited, with the NHS Central Legal Office continuing to provide legal advice and guidance to members in relation to negligence claims.
This year’s annual report provides summary details of the number and value of claims made during the financial year 2016-17, and gives an insight into arrangements for payment of clinical negligence claims and the impact on NHS Scotland2. The NHS in Scotland treats some 4.5 million outpatients and 1.6 million inpatients each year in hospitals in Scotland3. There is a very high standard of care and patient safety. The total number of claims upheld for clinical negligence4 each year is small although the financial value can be high depending on the nature of the claim and the impact on the patient.
The CNORIS scheme covers both clinical and non clinical claims5. In 2016-17 there were 424 claim payments made; a 45.7% increase on the number of payments made in 2015-16 (291). However, although there was an increase in the number of payments made there was a 23.8% decrease in the value of payments, £40.3 million compared with £52.8 million paid in 2015-16. The division of 2016-17 payments between clinical and non-clinical claims was 342 payments totalling £38.3 million for clinical claims and 82 payments totalling £2.0 million for non-clinical claims. The highest settlement payments related to claims for obstetric care and, as illustrated in Graph 2 below, these types of claims can, due to a number of factors, take many years to conclude.
It should be noted that although a claim may have been received in 2016-17 it often related to an incident that occurred many years previously. This is highlighted by the fact that of the claims received in 2016-17 there were only 14 of the 424 where the incident date was between 2014-15 and 2016-17; value of payments totalled £0.69 million. This is analysed in greater detail in graph 1 below.
Version: 1.0 (July 2017) Page: 3 of 20Author: NHS National Services Scotland

CNORIS Annual Report 2016-2017
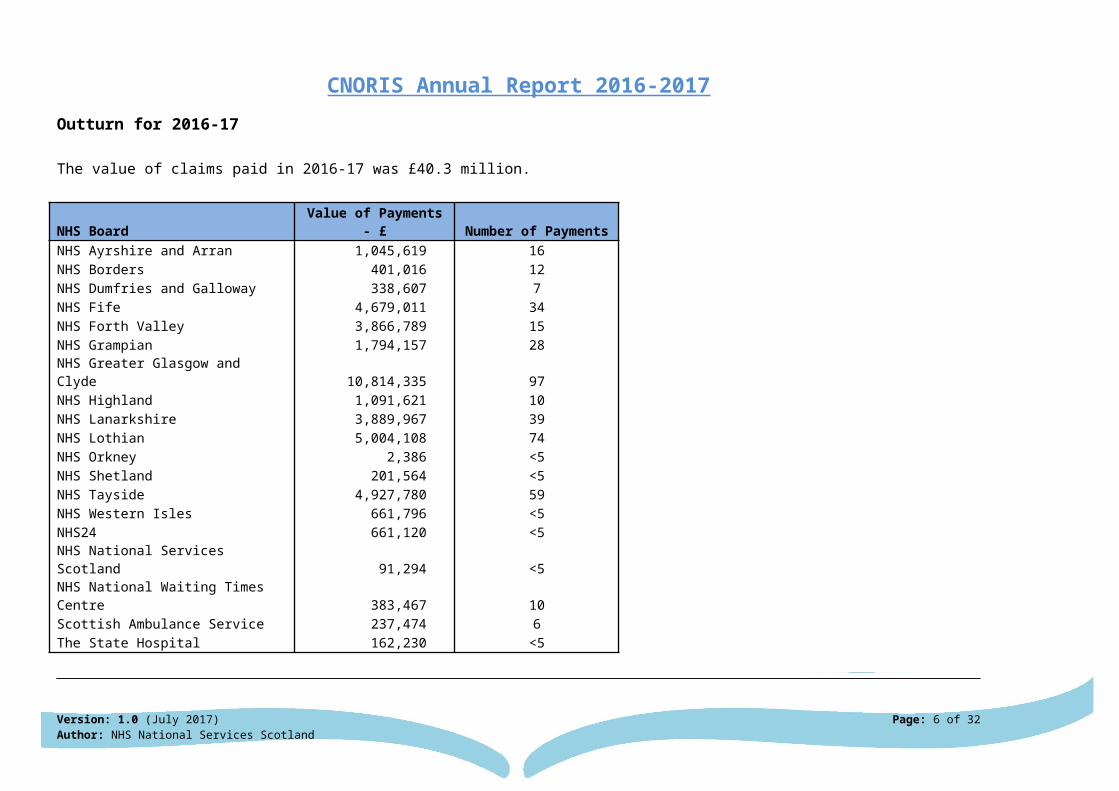
Outturn for 2016-17
The value of claims paid in 2016-17 was £40.3 million.
NHS Board Value of Payments - £ Number of PaymentsNHS Ayrshire and Arran 1,045,619 16NHS Borders 401,016 12NHS Dumfries and Galloway 338,607 7NHS Fife 4,679,011 34NHS Forth Valley 3,866,789 15NHS Grampian 1,794,157 28NHS Greater Glasgow and Clyde 10,814,335 97NHS Highland 1,091,621 10NHS Lanarkshire 3,889,967 39NHS Lothian 5,004,108 74NHS Orkney 2,386 <5NHS Shetland 201,564 <5NHS Tayside 4,927,780 59NHS Western Isles 661,796 <5NHS24 661,120 <5NHS National Services Scotland 91,294 <5NHS National Waiting Times Centre 383,467 10Scottish Ambulance Service 237,474 6The State Hospital 162,230 <5The breakdown of the number and value of claim payments made during 2016-17 is detailed in Table 1 below. Of these payments, 31 related to high value cases (where settlement was over £1 million) and of these, 8 payments, all of which related to clinical claims, were in excess of £1 million.
Table 1: Number & Value of 2016-17 Payments
Version: 1.0 (July 2017) Page: 4 of 20Author: NHS National Services Scotland

CNORIS Annual Report 2016-2017
Incident Timeline
Graph 1 below provides a breakdown of all claims paid in 2016-17 by the value and number of payments attributed by the financial year of the incident. The majority of payments related to claims settled more than 5 years after the incident occurred, with some settlements taking considerably longer.
Graph 1: Claims Paid 2016-17 by Year of Incident
Version: 1.0 (July 2017) Page: 5 of 20Author: NHS National Services Scotland
CNORIS Annual Report 2016-2017
0
10
20
30
40
50
60
0.00
1.00
2.00
3.00
4.00
5.00
6.00
7.00
Num
ber o
f Pay
men
ts
Cla
im V
alue
s ( £
mill
ion
)
Incidence Date
Number of Payments Value of Payments
Trends in Payments
Table 2 below shows the change in the number and value of CNORIS payments over the last 10 years. It highlights the variation in values and how increasing payment numbers has not necessarily correlated to an increased value in payments. What can be seen however is the general trend of increasing claim numbers, which is in part due to the increase number of interim payments being reclaimed by health boards.
Table 2: Payments made since 2005-06*
Version: 1.0 (July 2017) Page: 6 of 20Author: NHS National Services Scotland
CNORIS Annual Report 2016-2017
Financial YearValue of Payments No of Payments
Clinical (£ million)
Non-Clinical (£ million)
Total (£ million) Clinical Non-Clinical Total
2007-08 18.31 0.63 18.93 95 28 1232008-09 27.09 1.34 28.42 66 21 872009-10 30.80 0.32 31.12 89 14 1032010-11 57.38 0.87 58.24 123 24 1472011-12 27.15 2.05 29.19 126 36 1622012-13 33.13 1.85 34.98 168 49 2172013-14 34.87 3.53 38.40 160 41 2012014-15 36.96 1.62 38.57 193 61 2542015-16 49.70 3.10 52.81 235 56 2912016-17 38.29 1.97 40.25 342 82 424
Total 353.66 17.26 370.93 1,597 412 2,009
* Values relate to reimbursements made from CNORIS and not payments to claimants and their legal representatives.
Of the 424 payments made in 2016-17, there were 8 in excess of £1 million and 31 related to 26 claims where the total value of the claim was in excess of £1 million.
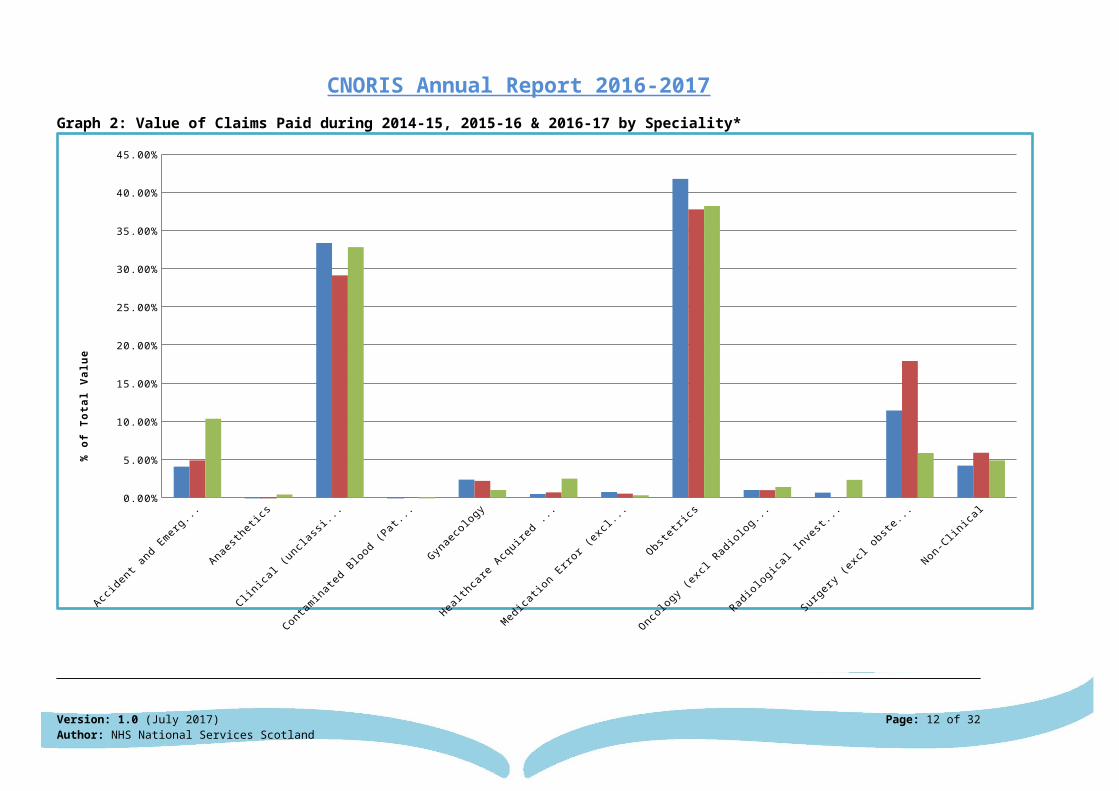
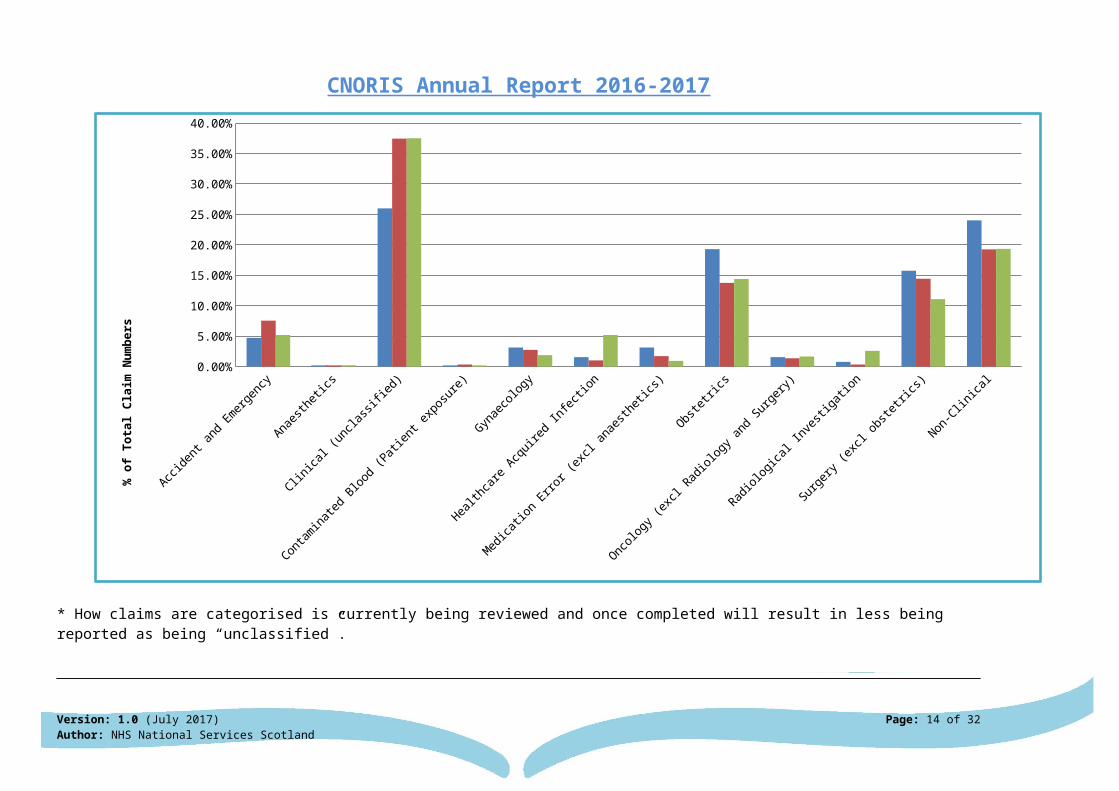
The breakdown, by percentage, of the number and value of claims over the last 3 financial years (2014-15, 2015-16 and 2016-17), by speciality, is provided in graphs 2 and 3 below. The graphs highlight that although obstetrics claims account on average for only 15.8% of the number of claims they account on average for 39.3% of the total value of claims over these years.
Version: 1.0 (July 2017) Page: 7 of 20Author: NHS National Services Scotland

CNORIS Annual Report 2016-2017
Graph 2: Value of Claims Paid during 2014-15, 2015-16 & 2016-17 by Speciality*
0.00%
5.00%
10.00%
15.00%
20.00%
25.00%
30.00%
35.00%
40.00%
45.00%
% o
f Tot
al V
alue
* How claims are categorised is currently being reviewed and once completed will result in less being reported as being “unclassified”.
Version: 1.0 (July 2017) Page: 8 of 20Author: NHS National Services Scotland

CNORIS Annual Report 2016-2017
Graph 3: Number of Claim Payments made during 2014-15, 2015-16 & 2016-17 by Speciality*
Accide
nt and
Emer
genc
y
Anaes
thetic
s
Clinica
l (unc
lassif
ied)
Contam
inated
Blood
(Pati
ent e
xpos
ure)
Gynae
colog
y
Health
care
Acq
uired
Infec
tion
Medica
tion E
rror (
excl a
naesth
etics
)
Obstet
rics
Oncolo
gy (e
xcl R
adiol
ogy a
nd S
urger
y)
Radiol
ogica
l Inve
stiga
tion
Surge
ry (e
xcl o
bstet
rics)
Non-C
linica
l0.00%
5.00%
10.00%
15.00%
20.00%
25.00%
30.00%
35.00%
40.00%
% o
f Tot
al C
laim
Num
bers
* How claims are categorised is currently being reviewed and once completed will result in less being reported as being “unclassified”.
Version: 1.0 (July 2017) Page: 9 of 20Author: NHS National Services Scotland

CNORIS Annual Report 2016-2017
Periodic Payment Orders (PPOs) and Structured Settlements6 2016-17
PPO payments are paid to claimants in advance and, for most settlements, paid annually beginning December each year, with payments to health boards generally made within the following few months. During 2016-17 there were 13 PPOs and 4 older structured settlements paid across 6 NHS Boards; one paid quarterly and the others annually. The values reclaimed by health boards from CNORIS during 2016-17 totalled £3.17 million, which included a pro-rata refund of £0.23 million when a PPO ceased earlier than expected. The increasing number of PPOs will continue to affect the future profile of payments by CNORIS, with future year’s payments being subject to inflationary changes.
Contributions and Claims Paid
Contributions and claims paid in the last 3 years are illustrated in Graph 4 below. Contributions are set based upon a formula that includes: claim history; more recent claims; and an assessment of the risks of incidents occurring. Contributions do not therefore necessarily equal payments in any particular year, although over time the total contributions paid by health boards should match payments reclaimed by them from CNORIS.
Graph 4: Contributions & Claims Paid – 3 Year Total
Version: 1.0 (July 2017) Page: 10 of 20Author: NHS National Services Scotland
CNORIS Annual Report 2016-2017
NHS Ayrs
hire an
d Arran
NHS Borders
NHS Dumfri
es an
d Galloway
NHS Fife
NHS Forth
Valley
NHS Gram
pian
NHS Grea
ter Glas
gow & Clyd
e
NHS High
land
NHS Lan
arksh
ire
NHS Lothian
NHS Orkn
ey
NHS Shetl
and
NHS Tay
side
NHS West
ern Isl
es
Mental
Welf
are Commiss
ion
National
Waiting T
imes
Centre
NHS24
NHS Educati
on
NHS Heal
th Scotla
nd
NHS Heal
thcare I
mprovem
ent S
cotla
nd
NHS Nati
onal Ser
vices
Scotla
nd
Scottish Ambulan
ce Ser
vice
The S
tate H
ospita
l0.00
5.00
10.00
15.00
20.00
25.00
30.00
35.00
40.00
45.00
3 Years Contributions vs Claims
3 Year Contributions 3 Year Claim Values
CNORIS Member
Valu
e (£
mill
ion)
Version: 1.0 (July 2017) Page: 11 of 20Author: NHS National Services Scotland
CNORIS Annual Report 2016-2017
Analysis of Claims by Year of Incident and Year
Graph 5 below provides a breakdown of the total number of medical and nursing (clinical) claims for compensation together with all other compensation claims, received by NSS CLO in each financial year. The graph also details the number of those claims where the total costs, as at 31 Mar 2017, exceeded the CNORIS deductibles threshold of £25,000, irrespective of whether these costs have been reclaimed from CNORIS by heath boards.
It is important to bear in mind that, although there has been a further decrease in the number of claims being received, this graph relates to the number of claims received each year regardless of value and merit, and does not indicate the number of claims that may eventually be a call on the CNORIS scheme, generally those in excess of £25,000 where responsibility is accepted or judgement is awarded.
Graph 5 - Breakdown of No. of All Claims Received by NSS CLO
0
200
400
600
800
1000
1200
1400
2000-
01
2001-
02
2002-
03
2003-
04
2004-
05
2005-
06
2006-
07
2007-
08
2008-
09
2009-
10
2010-
11
2011-
12
2012-
13
2013-
14
2014-
15
2015-
16
2016-
17
No o
f Cla
ims
Financial Year
Breakdown of Claims Received by NSS CLO (by the financial year the claim was received)
Medical & Nursing Claims Other Claims Claims > £25K*
Version: 1.0 (July 2017) Page: 12 of 20Author: NHS National Services Scotland

CNORIS Annual Report 2016-2017
Graphs 6 and 7 below provides a breakdown of payments made by the CNORIS scheme between 2007-08 and 2016-17 (total value of net payments made was £370.93 million), in relation to whether the claim related to an obstetrics & gynaecology incident, another type of clinical incident or an non-clinical incident. Graph 6 is in monetary terms and graph 7 in percentage terms.
Graph 6 – Breakdown of CNORIS Payments (£370.93 million, net of deductibles), made between 2007-08 and 2016-17
2007-08 (£000s)
2008-09 (£000s)
2009-10 (£000s)
2010-11 (£000s)
2011-12 (£000s)
2012-13 (£000s)
2013-14 (£000s)
2014-15 (£000s)
2015-16 (£000s)
2016-17 (£000s)
Non-Clinical 628 1,337 322 868 2,046 1,849 3,529 1,615 3,101 1,967Other Clinical 3,205 3,685 6,148 16,392 11,132 15,179 16,174 19,944 28,597 22,506Obs & Gynae 15,101 23,402 24,649 40,983 16,016 17,949 18,698 17,012 21,107 15,782
0
10,000
20,000
30,000
40,000
50,000
60,000
70,000
£000
s
Total Value by Claim Type
Version: 1.0 (July 2017) Page: 13 of 20Author: NHS National Services Scotland
CNORIS Annual Report 2016-2017
Graph 7 –CNORIS Payments (£370.93 million, net of deductibles), made between 2007-08 and 2016-17, In Percentage Terms
2007/08 2008/09 2009/10 2010/11 2011/12 2012/13 2013/14 2014/15 2015/16 2016/170%
10%
20%
30%
40%
50%
60%
70%
80%
90%
100%
Total Value by Claim Type
Graph 8 profiles the same period of payments, but analyses them by the years in which incidents that led to each claim occurred and also by the years in which these claims were received by CLO; highlighting how some claims can take many years to conclude. For claims paid in 2016-17, where dates are provided, the average period between the date of the incident to the date the claim was received by CLO was 7.97 years, with the average period between CLO receiving the claim to payments being reclaimed by health boards was 4.76 years. The median period between the date of incidents and payments being repaid to health boards was 6.18 years and 3.73 years between CLO receiving the claim and the health board being repaid by CNORIS.
Version: 1.0 (July 2017) Page: 14 of 20Author: NHS National Services Scotland

CNORIS Annual Report 2016-2017
Graph 8: CNORIS Payments Since 1 April 2007 Analysed by Year of Incident and Year Received by CLO
0
10
20
30
40
50
60
70
No
Clo
Rec
ord
Pre
199
0
1990
-91
1991
-92
1992
-93
1993
-94
1994
-95
1995
-96
1996
-97
1997
-98
1998
-99
1999
-00
2000
-01
2001
-02
2002
-03
2003
-04
2004
-05
2005
-06
2006
-07
2007
-08
2008
-09
2009
-10
2010
-11
2011
-12
2012
-13
2013
-14
2014
-15
2015
-16
2016
-17
(£ m
illio
n)
Financial Year
CNORIS Payments History
Year Paid Year of Incident Year Received
Version: 1.0 (July 2017) Page: 15 of 20Author: NHS National Services Scotland

CNORIS Annual Report 2016-2017
Pipeline Analysis7
A pipeline analysis of the estimated values of all open (unsettled) claims as at year ends for the last 5 financial years (2010-11 to 2016-17), broken down by obstetrics & gynaecology claims, other clinical claims and non-clinical claims, is provided in Graph 9a below. In addition, the graph profiles the years in which the open (unsettled) claims “@ Year End 2017” were estimated to be settled, with almost 60% with an estimated settlement value above the CNORIS £25,000 deductibles threshold.
However, this does not take into account the relevant risk profiles8 evaluating how many of these claims were anticipated to be settled in favour of the claimant. Graph 9b illustrates the significant reduction in estimated values when risk profiles were taken into account. Both risk profiles and estimated settlement values will continue to be revised as claims advance through the legal process and therefore these values do not necessarily reflect CNORIS payments in the future.Graph 9a Graph 9bGraph 9a – Unadjusted* Total Estimated Value of Open Claims Graph 9b – Risk Adjusted* Total Estimated Value of Open Claims
0
100,000,000
200,000,000
300,000,000
400,000,000
500,000,000
600,000,000
700,000,000
800,000,000
900,000,000
2012- 2013 2013- 2014 2014- 2015 2015- 2016 2016- 2017 2017-2018 2018-2019 2019-2020 2020-2021 & Later
Non-Clinical
Other Clinical
Obs & Gynae
Estimated to Settle
*Estimated settlement values have not been adjusted to reflect the risk of settlement.
Bar chart identif ies the number of claims outstanding at the end of each f inancial year by the f inancial year in which the claim was received.Line graph represents the estimated settlement values of those claims open @ Year End 2017, by the year in which they are currently estimated to settle.
0
100,000,000
200,000,000
300,000,000
400,000,000
500,000,000
600,000,000
700,000,000
800,000,000
900,000,000
2012- 2013 2013- 2014 2014- 2015 2015- 2016 2016- 2017 2017-2018 2018-2019 2019-2020 2020-2021 & Later
Non-Clinical
Other Clinical
Obs & Gynae
Estimated to Settle
*Estimated settlement values have been adjusted to reflect the risk of settlement.
Bar chart identif ies the number of claims outstanding at the end of each f inancial year by the f inancial year in which the claim was received.Line graph represents the estimated settlement values of those claims open @ Year End 2017, by the year in which they are currently estimated to settle.
Version: 1.0 (July 2017) Page: 16 of 20Author: NHS National Services Scotland

CNORIS Annual Report 2016-2017
Appendix 1: Background, Definitions, and Key Delivery PartnersBackground to the CNORIS Scheme:
The scheme was established under the Clinical Negligence and Other Risk Indemnity Scheme (CNORIS) Scotland Regulations 2000 as amended9, with effect from 1 April 2000. Participation in the scheme is mandatory for all NHS Boards in Scotland with responsibility for delivering patient care. Private contractors including General Dental Practices and General Medical Practitioners (GPs) are outwith the scheme (they have their own indemnity scheme arrangements). GPs may be covered in instances where they have been directly employed by Health Boards (e.g. out of hours scheme).
With the introduction of the Public Bodies (Joint Working) (Scotland) Act10 from April 2015, the Scheme was broadened to enable Integration Joint Boards and Local Authorities to become Members.
Definitions of the CNORIS Scheme:The Scheme - Clinical Negligence and Other Risks Indemnity Scheme (CNORIS)
Scheme Contractor – NHS National Services Scotland (NSS) manage the scheme on behalf of Scottish Government. Scottish Government Scheme Manager – the lead individual within Scottish Government Health & Social Care Directorates with responsibility for the
policy and operation of the CNORIS scheme NHSScotland – the publicly funded healthcare system for people in Scotland. NHS Boards – the individual territorial and Special Health Boards with direct responsibility for patient care in Scotland and who comprise the scheme
membership. Integration Joint Boards – bodies established to take responsibility for functions delegated by Local Authorities and Health Boards in regard to Health
and Social Care Services.
CNORIS Key Aims & Objectives: To encourage a rigorous and logical approach to risk management in both the clinical and non-clinical sectors of Health and Social Care services in
Scotland; To provide advice on clinical and non-clinical scheme coverage to all parts of Health and Social Care services in Scotland; To support scheme members in an advisory capacity in order to reduce their risks; To indemnify scheme members against losses which qualify for scheme cover; To allocate equitable contributions amongst Members to fund their qualifying losses; To provide Members with scheme financial updates throughout the year to help with planning and forecasting; and To help manage risk by providing Members with clinical and non-clinical loss analysis throughout the year.
Version: 1.0 (July 2017) Page: 17 of 20Author: NHS National Services Scotland
CNORIS Annual Report 2016-2017
Appendix 2: Organisations covered by the CNORIS are as follows*:
NHS 24 NHS HighlandNHS Ayrshire and Arran Argyll and Bute Integration Joint BoardEast Ayrshire Integration Joint Board NHS LanarkshireNorth Ayrshire Integration Joint Board North Lanarkshire Integration Joint BoardSouth Ayrshire Integration Joint Board South Lanarkshire Integration Joint BoardNHS Borders NHS LothianNHS Dumfries and Galloway Edinburgh Integration Joint BoardDumfries and Galloway Integration Joint Board East Lothian Health and Social Care Partnership Integration Joint BoardNHS Education for Scotland Midlothian Integration Joint BoardNHS Fife West Lothian Integration Joint BoardFife Integration Joint Board Mental Welfare Commission for ScotlandNHS Forth Valley The Common Services Agency (National Services Scotland)Clackmannanshire and Stirling Integration Joint Board National Waiting Times CentreFalkirk Integration Joint Board NHS OrkneyNHS Grampian Orkney Health and Care BoardAberdeen City Health and Social Care Partnership Integration Joint Board Healthcare Improvement ScotlandAberdeenshire Integration Joint Board Scottish Ambulance ServiceMoray Integration Joint Board NHS ShetlandNHS Greater Glasgow and Clyde Shetland Islands Integration Joint BoardEast Dunbartonshire Integration Joint Board The State HospitalEast Renfrewshire Integration Joint Board NHS TaysideGlasgow City Integration Joint Board Angus Integration Joint BoardInverclyde Integration Joint Board Dundee City Integration Joint BoardRenfrewshire Integration Joint Board Perth and Kinross Integration Joint BoardWest Dunbartonshire Integration Joint Board NHS Western IslesNHS Health Scotland * As at 31 March 2017
Version: 1.0 (July 2017) Page: 18 of 20Author: NHS National Services Scotland

CNORIS Annual Report 2016-2017
NOTES
Version: 1.0 (July 2017) Page: 19 of 20Author: NHS National Services Scotland

1 Refer to Appendix 2 for a list of all CNORIS members as at 31 March 20172 Through the Clinical Negligence and Other Risks Indemnity Scheme (CNORIS) members
contribute annually to the CNORIS fund for meeting the award costs and legal expenses in regard to any claims for negligence pursued by patients, employees, third parties and members of the public.
Members are reimbursed for the costs incurred, less the relevant deductible value per individual claim, in regard to award payments made to claimants, the claimants’ legal costs and the members’ own legal expenses in any given year. The deductible value for claims raised since 2001 is £25,000 per claim.
The CNORIS Annual Report provides details in regard to the historical reimbursements paid to members of the Scheme from CNORIS in the relevant financial year (1 April to 31 March) together with comparatives and aggregates for prior years. The figures quoted include interim awards where claimants have received payments in advance of settlement and PPO payments, but do not include any costs not reimbursed to members.
The CNORIS Annual Report does not provide information in regard to the total number and value of all claims settled by members. However, the Pipeline Analysis does provide details of all current claims still to be settled.
3 Information based upon Official Statistics provided by NSS / ISD on their website.4 Clinical negligence claims relate to those incidents whereby the care and treatment by
medical, nursing and other healthcare professionals is considered to have been below expected standards and caused harm.
5 The non-clinical areas covered by CNORIS include: employers liability, public liability, product liability and non-clinical professional risks. Refer to the CNORIS website for further details.
6 Periodic Payment Orders (PPOs) and Structured Settlements are where instead of receiving a single lump sum award payment, claimants receive usually a smaller lump sum together with periodic payments (normally annually) for a defined number of years, or life, depending upon what is agreed. PPOs are primarily agreed where there are ongoing costs associated with the care and wellbeing of the claimant and/or their family/guardians, such as the costs associated with the ongoing care of a severely disabled child into adulthood.
7 A Pipeline Analysis is being used in this instance as a method of comparing, on a like for like basis, the number and value of claims over time.
8 All claims are evaluated and allocated a risk rating based upon the probability of the outcome resulting in a settlement being made to a claimant. Risk ratings are re-assessed as claims are progressed and new information reduces the uncertainty of outcomes.
9 For further information refer to the Scottish Government website pages for CNORIS.10 For further information refer to the Government website on legislation