synthesis, structural and antioxidant studies of …
TRANSCRIPT

SYNTHESIS, STRUCTURAL AND ANTIOXIDANT
STUDIES OF SOME NOVEL BENZOFURAN AND
PHTHALIMIDE DERIVATIVES
THEN LI YEE
UNIVERSITI SAINS MALAYSIA
2018

SYNTHESIS, STRUCTURAL AND ANTIOXIDANT
STUDIES OF SOME NOVEL BENZOFURAN AND
PHTHALIMIDE DERIVATIVES
by
THEN LI YEE
Thesis submitted in fulfilment of the requirements for
the degree of
Master of Science
August 2018

ii
ACKNOWLEDGEMENT
I am eternally grateful that there are a lot of people who have guided and helped
me during my research study. Therefore, I would like to grab this opportunity to
express my thankfulness for them throughout this period.
Foremost, I would like to express my deepest respect and gratitude to my
supervisor, Assoc. Prof. Dr. Quah Ching Kheng for his supervision, support and
encouragement throughout the research journey. Besides, I would like to express my
appreciation to Dr. C. S. Chidan Kumar for his assistance and guidance on synthesis
works.
With this opportunity, I would like to thanks Ministry of Higher Education
Malaysia and Universiti Sains Malaysia for financial support under MyBrain 15
scholarship and USM Fellowship scheme, respectively. In addition, I would like to thank
all staffs and labmates from X-ray Crystallography Lab USM for their guidance and
support.
Last but not least, I would like to pay my high regards to my family and friends
for their patience, support and encouragement for all the time.

iii
TABLE OF CONTENTS
ACKNOWLEDGEMENT………………………………………………………… ii
TABLE OF CONTENTS…………………………………………………………. iii
LIST OF TABLES……………………………………………………………….. vii
LIST OF FIGURES……………………………………………………………... viii
LIST OF ABBREVIATIONS…………………………………………………… xiii
ABSTRAK………………………………………………………………………... xiv
ABSTRACT………………………………………………………………………. xv
CHAPTER 1 – INTRODUCTION
1.1 X-ray Crystallography ................................................................................... 1
1.2 Literature Review on Benzofuran Derivatives .............................................. 2
1.3 Literature Review on Phthalimide Derivatives ............................................. 3
1.4 Problem Statement......................................................................................... 4
1.5 Research Objectives ...................................................................................... 5
CHAPTER 2 – THEORY
2.1 X-ray Crystallography ................................................................................... 6
2.1.1 What is a Crystal ................................................................................ 7
2.1.2 How X-ray Diffraction Determines the Crystal Structure ................. 8
2.1.3 The Difference between Real and Reciprocal Space ....................... 10
2.1.4 Atomic Scattering Factors ................................................................ 11
2.1.5 Structure Factors .............................................................................. 12
2.1.6 Where are the Missing Reflections .................................................. 14

iv
2.1.7 Fourier Transform ............................................................................ 15
2.1.8 Structure Solution by Direct Methods ............................................. 16
2.1.9 Crystal Structure Refinement ........................................................... 17
2.1.10 Molecular Disorder .......................................................................... 18
2.2 Spectroscopy ............................................................................................... 19
2.2.1 Fourier Transform Infrared (FT-IR) spectroscopy ........................... 20
2.2.2 Nuclear Magnetic Resonance (NMR) spectroscopy ........................ 22
2.3 Antioxidant .................................................................................................. 26
2.3.1 Diphenyl-2-picrylhydrazyl (DPPH) Radical Scavenging Assay ..... 27
2.3.2 Ferrous Ion Chelating (FIC) Assay .................................................. 28
2.3.3 Hydrogen Peroxide (H2O2) Radical Scavenging Assay ................... 29
CHAPTER 3 – INSTRUMENTATIONS AND METHODOLOGY
3.1 Instrumentations and Software Overview ................................................... 30
3.2 X-ray Diffractometer ................................................................................... 31
3.2.1 Hardware Overview ......................................................................... 31
3.2.2 Software Overview........................................................................... 34
3.2.2 (a) APEX2 Suite ................................................................... 34
3.2.2 (b) SHELXTL Software Package .......................................... 35
3.3 Sample Preparation ...................................................................................... 36
3.3.1 General Procedure for the Synthesis of 2-(Benzofuran-2-yl)-2-
oxoethyl Benzoate (Compounds 1a-1q) .......................................... 37
3.3.2 General Procedure for the Synthesis of 2-((Pyridin-2-ylamino)
methyl)isoindoline-1,3-dione (Compounds 2a-2g) .......................... 37
3.3.3 Crystallization .................................................................................. 37
3.4 Spectroscopic Studies .................................................................................. 38

v
3.5 X-ray Analysis ............................................................................................. 54
3.5.1 Crystal Selection .............................................................................. 54
3.5.2 Crystal Mounting and Alignment .................................................... 55
3.5.3 Data Collection ................................................................................ 56
3.5.4 Data Reduction and Structure Determination .................................. 58
3.6 Antioxidant Studies ..................................................................................... 58
3.6.1 Diphenyl-2-picrylhydrazyl (DPPH) Radical Scavenging Assay ..... 59
3.6.2 Ferrous Ion Chelating (FIC) Assay .................................................. 59
3.6.3 Hydrogen Peroxide (H2O2) Radical Scavenging Assay ................... 60
CHAPTER 4 – RESULTS AND DISCUSSIONS
4.1 Benzofuran Derivatives (Compounds 1a-1q) ............................................. 61
4.1.1 Spectroscopy (FT-IR, 1H-NMR and 13C-NMR) .............................. 61
4.1.2 X-ray Diffraction Data Collection and Refinement ......................... 63
4.1.3 Crystal Structure Description of Compounds 1a-1q ........................ 68
4.1.4 Antioxidant properties ...................................................................... 94
4.2 Phthalimide Derivatives (Compounds 2a-2g) ............................................. 97
4.2.1 Spectroscopy (FT-IR, 1H-NMR and 13C-NMR) .............................. 97
4.2.2 X-ray Diffraction Data Collection and Refinement ......................... 99
4.2.3 Crystal Structure Description for Compounds 2a-2g .................... 101
4.2.4 Antioxidant properties .................................................................... 111
CHAPTER 5 – CONCLUSION AND FURTHER STUDIES
5.1 Benzofuran Moiety .................................................................................... 112
5.2 Phthalimide Moiety ................................................................................... 113

vi
5.3 Further Studies .......................................................................................... 114
REFERENCES…………………………………………………………………... 115
LIST OF PUBLICATIONS

vii
LIST OF TABLES
Page
Table 2.1 The 7 crystal systems and 14 Bravais lattices 8
Table 2.2 Rules for general absences 14
Table 2.3 Absence rules for 21 screw axes 15
Table 2.4 Absence rules for glide planes 15
Table 4.1 Crystal data of benzofuran derivatives (1a-1q) 64
Table 4.2 Torsion angles τ1, τ2 and τ3 for compounds 1a-1q 69
Table 4.3 Hydrogen bond geometries (D—H···A; Å, °) for
compounds 1a-1q
91
Table 4.4 π···π interactions in benzofuran compounds 93
Table 4.5 Inhibition results of benzofuran compounds on different
assays, including the reference drugs
94
Table 4.6 The IC50 values of compounds 1a, 1d, 1g and 1p, with
ascorbic acid as standard drug
95
Table 4.7 Crystal data and structure refinement parameters of
phthalimide derivatives (2a-2g)
99
Table 4.8 Torsion angles τ1, τ2 and τ3 for compounds 2a-2g 102
Table 4.9 Angle between N1—C9—N2 (°) for seven compounds as
compared to previous structures
102
Table 4.10 Hydrogen bond geometries (D—H···A; Å, °) for
compounds 2a-2g
111
Table 4.11 π···π interactions in compounds 2b, 2e, 2f and 2g 111

viii
LIST OF FIGURES
Page
Figure 1.1 Chemical structure of benzofuran 2
Figure 1.2 Chemical structure of phthalimide 3
Figure 2.1 The process of X-ray crystallography (The Structures of
Life, 2011)
6
Figure 2.2 The concept of crystal structure 7
Figure 2.3 An example of unit cell 7
Figure 2.4 Schematic cross section of an X-ray tube (Poppe et al.,
2001)
9
Figure 2.5 X-ray diffraction obeying Bragg's law 10
Figure 2.6 Relationship between real lattice and reciprocal lattice
(Ooi, 2010)
11
Figure 2.7 Atomic scattering factors for (a) stationary atom, fj, θ and
(b) temperature-corrected atom, fj, θ . Tj, θ (Ladd & Palmer,
1993)
12
Figure 2.8 Structure factor, Fhkl is plotted on an Argand diagram in
terms of its amplitude Fhkl (represented by the length OF)
and resultant phase angle (αhkl) (Ladd & Palmer, 1993)
14
Figure 2.9 Fourier connection between real space and reciprocal
space
16
Figure 2.10 An example of disorder is shown with odd orientations
observed in periodic arrangement
19
Figure 2.11 Electromagnetic spectrum and their respective molecular
effects (Wade, 2006)
20
Figure 2.12 The approximate regions where various common types of
bonds absorb (only stretching vibrations included for
clarity) (Pavia et al., 1979)
20
Figure 2.13 Vibrational modes of a chemical bond (Pavia et al., 1979) 21

ix
Figure 2.14 An example of FT-IR spectrum (from own data) 22
Figure 2.15 A simplified correlation chart for proton chemical shift
values (Pavia et al., 1979)
24
Figure 2.16 A simple correlation chart for 13C chemical shift values
(Pavia et al., 1979)
25
Figure 2.17 An example of 1H-NMR (above) and 13C-NMR (below)
spectra (from own data)
26
Figure 2.18 Interactive figure showing difference between normal
atom, free radical and antioxidant (How molecular
hydrogen helps to remove Toxic Free Radicals?, 2017)
27
Figure 2.19 Mechanism of DPPH assay 28
Figure 2.20 Ferrozine binds with ferrous ion (Fe2+) to form ferrozine-
Fe2+ complex (Hirayama & Nagasawa, 2017)
29
Figure 3.1 Flow chart of research methodology 30
Figure 3.2 Schematic diagram of Bruker APEX II diffractometer
(APEX2 User Manual Version 1.27, 2005)
32
Figure 3.3 Goniometer modules (APEX2 User Manual Version 1.27,
2005)
32
Figure 3.4 The APEX2 software diagram (APEX2 User Manual
Version 1.27, 2005)
35
Figure 3.5 Crystals formed in a beaker (naked eyes view) 55
Figure 3.6 Crystal mounted on a copper pin is aligned, with the help
of a video microscope
56
Figure 3.7 Intensity spots of a crystalline sample in a diffraction frame 56
Figure 3.8 The deviation histograms show whether the crystal sample
is single (left hand side) or multiple (right hand side)
57
Figure 4.1 General chemical diagram of seventeen benzofuran
derivatives, showing torsion angles τ1, τ2 and τ3
68
Figure 4.2 ORTEP diagram of compound 1a with 30% ellipsoid
probability and atomic labelling scheme
70
Figure 4.3 Hydrogen bonds (cyan dotted lines) joined molecules into
a wave-like chain in compound 1a
71

x
Figure 4.4 C—H···π interactions (blue double dotted lines) in
compound 1a
71
Figure 4.5 Molecular structures of compounds 1b-1e drawn at 30%
ellipsoid probability with atomic labelling scheme
72
Figure 4.6 Dimeric structure formed by two inversion-related
molecules in compounds 1b and 1c
73
Figure 4.7 Packing diagram of 1b and 1c viewed along a-axis,
showing hydrogen bondings (cyan dotted lines) and π···π
interactions (red dotted lines)
74
Figure 4.8 Molecular structure of compound 1d, with disorder part
shown in purple colour
75
Figure 4.9 Partial packing diagram of 1d view along (a) b-axis and (b)
a-axis with disorder molecules B' presented in purple
colour
76
Figure 4.10 A hydrogen bonded chain of compound 1e directing along
b-axis
77
Figure 4.11 Hydrogen bonds (cyan dotted lines) and π···π interactions
(red dotted lines) stack molecules into two dimensional
plates in compound 1e
77
Figure 4.12 Molecular structure of compounds 1f-1h drawn at 30%
ellipsoid probability with suitable atomic labelling scheme
78
Figure 4.13 Extensive interactions in compounds 1f and 1g, including
hydrogen bonds (cyan dotted lines), C—H···π interactions
(blue dotted lines) and π···π interactions (red dotted lines)
79
Figure 4.14 Molecules in 1g are joined by hydrogen bonds to form one-
dimensional chain, with atom C5 serves as bifurcated
donor
79
Figure 4.15 Partial packing of compound 1h shown along b-axis, with
blue dotted lines indicating C—H···π interactions and red
dotted lines indicating π···π interactions
80
Figure 4.16 Molecular structures of compounds 1i, 1j and 1k in
ORTEP style with 30% ellipsoid probability and atomic
labelling scheme
81
Figure 4.17 An inversion dimer-dimer chain formed by extensive
hydrogen bonds in compound 1i
82

xi
Figure 4.18 Molecular packing of compound 1i participated by
hydrogen bonds (cyan dotted lines), C—H···π interactions
(blue dotted lines) and π···π interactions (red dotted lines)
82
Figure 4.19 Partial packing diagram of compounds 1j and 1k, showing
hydrogen bonds (cyan dotted lines), C—H···π interactions
(blue dotted lines) and π···π interactions (red dotted lines)
83
Figure 4.20 ORTEP structure of compounds 1l, 1m and 1n drawn at
30% ellipsoid probability with suitable atomic labelling
84
Figure 4.21 Molecules in compound 1l are organized into fishbone
sheets in alternate up-down manner
85
Figure 4.22 Molecular packing of compound 1m viewed along [010]
direction
85
Figure 4.23 π···π interactions in compound 1n are displayed in (a) bc-
view and (b) ab-view, showing molecules A (in purple) and
molecules B (in green)
86
Figure 4.24 Compounds 1o-1q are presented in ORTEP style with 30%
ellipsoid probability and atomic labelling scheme
87
Figure 4.25 Compound 1o with a S(6) ring motif formed by
intramolecular hydrogen bond
88
Figure 4.26 Molecular packing of compound 1o, showing hydrogen
bonds (cyan dotted lines) and π···π interactions (red dotted
lines)
88
Figure 4.27 Molecular disorder in compound 1p, showing molecule B
and disordered molecule Y (purple colour)
89
Figure 4.28 Partial packing diagram of compound 1p, showing
disordered molecules (purple colour) and solvent
molecules (green colour), with hydrogen bonds (cyan
dotted lines) and π···π interactions (red dotted lines
89
Figure 4.29 Partial packing of compound 1q as viewed along b-axis 90
Figure 4.30 IC50 values for H2O2 radical scavenging activity of
compounds 1a, 1d, 1g and 1p in comparison with the
standard drug (ascorbic acid)
96
Figure 4.31 General chemical diagram of 2a-2g, showing three
characteristic torsion angles (τ1, τ2 and τ3)
101
Figure 4.32 ORTEP diagram of 2a-2g with 30% ellipsoid probability
and atomic labelling scheme
103

xii
Figure 4.33 Hydrogen bonds connect inversion-related molecules into
dimeric chain in (a) compound 2a and (b) compound 2c
104
Figure 4.34 Packing diagram of (a) compound 2a and (b) compound 2c
as viewed along a-axis
105
Figure 4.35 Hydrogen bonds (cyan dotted lines) and π···π interaction
(red dotted lines) in the molecular packing of compound
2b
106
Figure 4.36 Partial packing diagram of compound 2d as viewed along
a-axis with dimeric structure shown at enlarged view
107
Figure 4.37 Molecular interactions in molecular packing of compound
2e, showing C—H···O hydrogen bonds (cyan dotted
lines), C—H···π interactions (blue dotted lines) and π···π
interactions (red dotted lines)
108
Figure 4.38 Dimers are joined by hydrogen bonds to form column
along [100] direction
108
Figure 4.39 The intermolecular C—H···O hydrogen bonds in
compound 2f join molecules into endless chain
109
Figure 4.40 Partial packing diagram of 2f viewed along a-axis,
showing C—H···π interactions (blue dotted lines) and
π···π interactions (red dotted lines)
109
Figure 4.41 Dimeric structure in compound 2g, showing
intramolecular and intermolecular hydrogen bonds (cyan
dotted lines)
110
Figure 4.42 The packing structure of compound 2g as viewed along b-
axis
110

xiii
LIST OF ABBREVIATIONS
3D Three-dimensional
IUPAC International Union of Pure and Applied Chemistry
CSD Cambridge Structural Database
wR Weighted Reliability Index
R Reliability Index
S Goodness of fit
FT-IR Fourier Transform Infrared
NMR Nuclear Magnetic Resonance
DPPH Diphenyl-2-picrylhydrazyl
FIC Ferrous Ion Chelating
H2O2 Hydrogen peroxide
ATR Attenuated total reflection
SMART Siemens Molecular Analysis Research Tools
CCD Charge-Coupled Device
BIS Bruker Instrument Service
GUI Graphical User Interface
ORTEP Oak Ridge Thermal Ellipsoid Plot
TLC Thin-layer chromatography
IC50 Half maximal inhibitory concentration

xiv
SINTESIS, KAJIAN STRUKTUR DAN ANTIOKSIDAN BEBERAPA
TERBITAN BENZOFURAN DAN FTALIMIDA BARU
ABSTRAK
Dalam projek ini, dua siri analog heterosiklik yang mengandungi bahagian
benzofuran (1a-1q) dan ftalimida (2a-2g) telah disintesis dan dihablurkan. Semua
struktur hablur telah ditunjukkan melalui teknik kristalografi sinar-X hablur tunggal,
disokong oleh analisis spektrum FT-IR dan NMR. Struktur molekul dan interaksi
dalam sebatian ini telah dikaji dan dianalisis. Selain itu, potensi antioksidan semua
sebatian telah dinilai menggunakan asai antioksidan yang berlainan. Dalam siri
benzofuran, lapan daripada tujuh belas sebatian terbentuk dalam kumpulan ruang
triklinik 𝑃1̅, lima dalam monoklinik P21/n, dua dalam monoklinik C2/c, manakala dua
dalam ortorombik Pna21 dan P212121. Penghubung C—C(=O)—C—O—C(=O)
dalam molekul benzofuran ini mengambil konformasi yang hampir berserenjang
ataupun hampir mendatar. Interaksi antara molekul paling banyak diperhatikan dalam
sebatian 1f-1k manakala paling kurang dalam sebatian 1c dan 1n. Didapati bahawa
sebatian 1a, 1d, 1g dan 1p aktif terhadap asai pelupusan radikal H2O2 dengan
penambahan gantian penyumbang elektron. Dalam siri ftalimida, lima daripada tujuh
sebatian mengambil kumpulan ruang triklinik 𝑃1̅ manakala dua mempamerkan
monoklinik P21/c dan P21/n. Secara ketara, konfigurasi berbentuk V dapat dilihat
dalam semua struktur, merujuk kepada sudut N1—C9—N2 mereka. Dalam padatan
molekul, kebanyakan interaksi dapat diperlihatkan dalam sebatian 2f manakala paling
sedikit dalam sebatian 2d. Berdasarkan keputusan penghambatan, adalah didapati
bahawa sebatian (2a-2g) tidak aktif terhadap kajian antioksidan.

xv
SYNTHESIS, STRUCTURAL AND ANTIOXIDANT STUDIES OF SOME
NOVEL BENZOFURAN AND PHTHALIMIDE DERIVATIVES
ABSTRACT
In this project, two series of heterocyclic analogues bearing a benzofuran (1a-
1q) and a phthalimide (2a-2g) moieties were synthesized and crystallized. All crystal
structures were revealed by single crystal X-ray crystallography technique, supported
by FT-IR and NMR spectral analysis. The molecular structures and interactions of
these compounds were studied and analysed. Besides, the antioxidant potential of all
compounds were evaluated using different antioxidant assays. In the benzofuran
series, eight of seventeen compounds are assembled in a triclinic 𝑃1̅ space group, five
in monoclinic P21/n, two in monoclinic C2/c, whereas two in orthorhombic Pna21 and
P212121. The C—C(=O)—C—O—C(=O) connecting bridge of these benzofuran
molecules tends to adopt a nearly perpendicular or a nearly planar conformation.
Intermolecular interactions are most observable in compounds 1f-1k while the least in
compounds 1c and 1n. It was found that compounds 1a, 1d, 1g and 1p were active
towards H2O2 radical scavenging assay, with the incorporation of electron donating
substituents. In the phthalimide series, five from seven compounds adopt a triclinic
𝑃1̅ space group while two exhibit monoclinic P21/c and P21/n. Significantly, a V-
shaped configuration is observed in all structures, with respects to their N1—C9—N2
angles. In the molecular packing, most interactions are observed in compound 2f
whereas the least in compound 2d. Based on the inhibition results, it was found that
compounds (2a-2g) are antioxidant inactive.

1
INTRODUCTION
1.1 X-ray Crystallography
X-ray crystallography is a scientific way used to explore the internal structure
of a crystal through its atomic arrangement by X-ray diffraction. By computing the
diffracting beams of various intensities from the crystal lattice, scientists could build
a three-dimensional (3D) model showing the molecular structure of a compound. This
method contributes to many areas including chemistry, pharmacology, molecular
biology, materials science and mineralogy. It is the most comprehensive method
available to study the molecular structure of a compound, providing fundamental
information for molecular design and other structural-related studies. However, this
method has its limitation because a good crystal is needed to get precision
crystallographic structure in which the process of crystallization is not an ease
(Deschamps, 2010).
X-ray crystallography has been introduced and continuously improved since
more than a hundred years ago. X-rays were discovered in 1895 and systematically
studied by William Conrad Röntgen, a German physicist who won the first Nobel
Prize in Physics in 1901. Years later, another German physicist, Max von Laue found
that X-ray will be scattered in certain directions when interacting with a crystal. The
phenomenon is known as X-ray diffraction. This discovery awarded him a Nobel Prize
in Physics in 1914 (Schneegans, 2014). The father and son team, William Henry Bragg
and William Lawrence Bragg further investigated the properties of X-rays after Laue’s
discovery. The elder Bragg believed that X-rays should have particle nature but the
younger Bragg agreed with Laue that X-rays are waves. The young Bragg proposed
that reflected X-rays might tell the arrangement of atoms in a crystal. Hence, he

2
developed a simple mathematical equation to explain the diffraction of X-rays, which
is known as Bragg’s Law. Owing to their great contributions in X-ray crystallography,
the Bragg duo were awarded the Nobel Prize in Physics in the year 1915 (Bragg,
William Lawrence, 2009).
As time goes by, more and more crystal structures are revealed and the time
taken to determine a crystal structure is getting shorter thanks to the continuing
advances in every aspects of X-ray diffraction procedure.
1.2 Literature Review on Benzofuran Derivatives
Figure 1.1 Chemical structure of benzofuran.
Oxygen-containing heterocyclic compounds are common structural elements
of many bioactive structures. Benzofuran (IUPAC name: 1-Benzofuran) (Figure 1.1)
is one of these heterocycles and it is composed of a fused benzene and furan (Furan,
2012) ring. The benzofuran and its derivatives present abundantly in nature because
they are stable and easy to generate, especially those with substitution(s) at their C-2
and/or C-3 (Coşkun et al., 2016, Shankerrao et al., 2017) positions. Numerous natural
benzofuran derivatives have been isolated from plants (Naik et al., 2015) as well as
marine sources (Jin et al., 2016) as this privilege structure (DeSimone et al., 2004)
possess a broad range of biological activities as well as pharmacological profiles.
Some of these biological and medicinal significance such as antioxidant, antimicrobial,
anticancer and antiviral were described and reported in review articles (Khanam &
Shamsuzzaman, 2015, Nevagi et al., 2015, Heravi et al., 2017, Chand et al., 2017),
which in turn verify the value of this moiety in medicinal chemistry. These noteworthy

3
potentials of benzofuran ring system and its derivatives have generated the curiosity
in researchers to explore this scaffold more deeply. Despite the strenuous and time
consuming isolation method, synthetic chemists were inspired to synthesize some
newly compounds incorporating this core structure, with some modifications on its
skeleton. Besides biological properties, benzofuran derivatives also serve as building
blocks for cosmetic formulations (Leung & Foster, 1996), fluorescent sensors (Higashi
et al., 2017) and optical brighteners (Siegrist et al., 2003).
1.3 Literature Review on Phthalimide Derivatives
Figure 1.2 Chemical structure of phthalimide.
Diverse biological profiles have been revealed for phthalimide (Figure 1.2) and
its analogs (Kushwaha & Kaushik, 2016, Sharma et al., 2010). The phthalimide
(IUPAC name: Isoindole-1,3-dione) is one of the nitrogen containing heterocycles.
The skeleton of the phthalimide core consists of a fused benzene and maleimide
(Maleimide, 2018) ring. The imide functional group (—CO—N(H)—CO—) is
hydrophobic and neutral, thus it can penetrate biological membranes in vivo, and is
playing a vital role in enhancing biological reactions (Bansode et al., 2009). The
structural miscellany and biological importance of this N-heterocycle make it a vital
character in the design of new prototypes of drug candidates. Thalidomide (Mujagic
et al., 2002, Calabrese & Fleischer, 2000), one of the famous derivatives of
phthalimide, was once applied as a sedative, but then inhibited from the market owing
to its teratogenic effects in 1960s. However, it has drawn back the attention of

4
researchers thanks to its potential uses in the treatment of various diseases such as
leprosy, tuberculosis, angiogenesis and human immunodeficiency virus (HIV)
infections. The phthalimide synthon exhibits good antioxidant (Chidan Kumar et al.,
2015), anticonvulsant (Abdel-Hafez, 2004), anti-inflammatory (Machado et al., 2005),
analgesic (Fhid et al., 2014) and immunomodulatory (Cardoso et al., 2015) properties.
In industry, phthalimide analogues are broadly contributed as herbicides (Natsume et
al., 1997), dyes (Koh et al., 2008), heat resistant polymers (Nasirtabrizi et al., 2013)
and flame-retardants (Bohen et al., 1990). These aforementioned results prompted us
to choose phthalimide core in the synthesis of some new compounds to investigate
more on its structure as well as potentials.
1.4 Problem Statement
Heterocyclic compounds are gaining attentions as their physical and chemical
properties are revolutionized distinctively with the presence of a heteroatom
(Katritzky, 2014). Significantly, the structure of heterocyclic compounds such as
benzofuran and phthalimide, can be manipulated to unlock more functions by
introducing different functional groups as substituent or as a part of their rings (Arora
et al., 2012). To authenticate the modified structures, structure determination is crucial
where X-ray crystallography method is so far the most precise, non-destructive
method to determine the three-dimensional structure of a compound. Investigation on
the crystal structure provides information about molecular geometries and interactions
as well as the spatial arrangements of molecules within a crystal. By understanding
the structural behaviours of a compound, assisted by database such as Cambridge
Structural Database (CSD) for literature reference, structure-based drug design is
much more efficient even at atomic-level (Lionta et al., 2014). Excessive free radicals
in human body may cause oxidative damage to cells and lead to pathophysiological

5
changes. People nowadays are more concern on health care and have lifelong desire
to delay aging process. Therefore, scientists are motivated to discover safer and
multipotent antioxidant agents to inhibit these harms since early stage (Karthik et al.,
2015). Henceforth, the goal of this research is to study the crystal structure of newly
prepared pharmacological active compounds through single crystal X-ray diffraction
and subsequently evaluate their antioxidant potentials.
1.5 Research Objectives
The objectives of this research work are:
i. To synthesize novel compounds of benzofuran and phthalimide derivatives.
ii. To elucidate the molecular structure of synthesized compounds by using FT-
IR and NMR spectroscopy.
iii. To examine the crystal structure of synthesized compounds and study their
supramolecular features by using X-ray crystallography technique.
iv. To evaluate the antioxidant potential of newly synthesized compounds.

6
THEORY
In this study, there are several methods used to probe the internal structure of
the compounds including X-ray crystallography, FT-IR and NMR spectroscopy. The
theory behind these methods are briefly described in this chapter. Besides, types of
antioxidant assays used to evaluate the compounds are also presented.
2.1 X-ray Crystallography
Study on the unique arrangement of molecules inside a crystal structure
provides us information about connectivity, interactions and conformation as well as
bond lengths and angles. Nevertheless, it is impossible to observe a crystal structure
with naked eyes, hence crystallographers make use of X-ray diffraction method to ‘see’
it. X-ray diffraction is a process where X-rays hit a crystal, interact with it and scatter.
In X-ray crystallography technique (Figure 2.1), these scattered rays superpose to
produce diffraction frames bearing structural information of the crystal. The three
dimensional crystal structure are revealed via electron contour map generated through
Fourier transform from diffraction frames.
Figure 2.1 The process of X-ray crystallography (The Structures of Life, 2011).

7
2.1.1 What is a Crystal
A crystal appears to be glossy and has flawless edges from exterior most of the
time. The clue is, the interior of this solid state matter is made up of periodic arrays of
atoms, which can be explained by the idea of lattice and basis (set of atoms) (Figure
2.2).
Figure 2.2 The concept of crystal structure.
A crystal lattice is formed by the smallest repeating building blocks known as
the unit cell (Figure 2.3), which with unique cell parameters (cell axes a, b and c; inter
axial angles α, β and γ), translating throughout the entire crystal in three dimensions.
In crystallography, there are 7 crystal systems and 4 lattice types [primitive (P), body-
centred (I), face-centred (F) and base-centred (A, B or C)], contributing to a total of
14 possible Bravais lattices, to describe the pattern of molecular packing (Table 2.1).
Figure 2.3 An example of unit cell.

8
Table 2.1 The 7 crystal systems and 14 Bravais lattices.
Crystal System Unit cell axes Inter axial angles Bravais lattices
Cubic a = b = c α = β = γ = 90° P, I, F
Tetragonal a = b ≠ c α = β = γ = 90° P, I
Orthorhombic a ≠ b ≠ c α = β = γ = 90° P, I, F; A, B or C
Hexagonal a = b ≠ c α = β = 90°; γ = 120° P
Trigonal a = b ≠ c α = β = 90°; γ = 120° P
Monoclinic a ≠ b ≠ c α = β = 90°; γ ≠ 120° P, C
Triclinic a ≠ b ≠ c α ≠ β ≠ γ ≠ 90° P
The minimum repeating motifs in a crystal structure (or known as the
asymmetric unit) are related by symmetry operations. Combination of different lattice
types with various symmetry elements such as reflection, inversion, rotation and etc.
leads to 230 space groups which were usually denoted by Hermann-Mauguin notation.
The Hermann-Mauguin notation is constituted of 4 elements: lattice type followed by
symmetry element at each unit cell axis. An example of space group notation is Pmmm,
describing an orthorhombic crystal with primitive lattice and mirror planes
perpendicular to each a-, b- and c-axis.
2.1.2 How X-ray Diffraction Determines the Crystal Structure
X-rays are high energy electromagnetic waves with wavelengths range from
0.02 to 100 Å (1 Å equals to 1x10⁻¹⁰ m). Its dual nature properties allows it to behave
like particles as well as waves. Beforehand, let’s have a short overview on the
production of X-rays. In an evacuated X-ray tube (Figure 2.4), high speed electrons
travel from tungsten filament (cathode) to strike on a pure metal target (anode), which
is usually made from molybdenum, copper, tungsten, iron and etc. depending on
wavelength requirement. The massive impact (due to high voltage) bombards the
electrons inside the target to higher energy states. As the excited electron drops back
to lower energy state, X-ray radiation is emitted through beryllium windows. During
the process, the metal target is always cooled with running water to prevent
overheating.

9
Figure 2.4 Schematic cross section of an X-ray tube (Poppe et al., 2001).
Crystal lattice is assembled by imaginary planes so-called Miller planes, with
Miller indices hkl, acting as weakly reflecting surfaces (Stoner & Hurst, 2017). When
X-rays are directed onto a crystal, they will be reflected (diffracted) to various
directions due to the interaction with the electrons surrounding the atoms from each
plane. This is possible because the wavelengths of X-rays are comparable to the
interatomic separations of solids (about 1 to 3 Å).
The X-ray diffraction by a crystal can be explained using Bragg’s law (Figure
2.5). Let the inter planar spacing of Miller planes be d, when X-rays (ray 1 and ray 2)
hit atoms on two adjacent planes at an angle θ and are both diffracted away, ray 2
travels an extra path of PR + QR than ray 1. In order to form a diffraction spot
(constructive interference occurs), the path difference between ray 1 and ray 2 must
equal to some integer multiple of λ (full wave cycle).
Hence, PR + QR = nλ. (2.1)
From trigonometry, sinθ = PR/d. (2.2)
Since PR = QR, PR + QR = 2dsinθ. (2.3)
Therefore, 2dsinθ = nλ (Bragg’s law). (2.4)

10
Figure 2.5 X-ray diffraction obeying Bragg's law.
2.1.3 The Difference between Real and Reciprocal Space
Sum of diffractions from each d-spaced Miller plane (real lattice) corresponds
to a point in reciprocal lattice, which are recorded as diffraction frames throughout the
experiment. The diffraction pattern (in units of 1/d) can be described by rearranging
the Bragg’s law equation, which is 2dsinθ = nλ to become sin𝜃 = (n𝜆
2)(
1
𝑑), i.e. the
larger the d spacing of crystal lattice, the closer the diffraction spots and vice versa.
All these diffraction frames are then sorted out to rebuild a diffraction map, which also
known as the reciprocal lattice. From the reciprocal space, we only obtain information
regarding the intensities and phases of Bragg’s peaks. Yet, these allow
crystallographers to calculate the electron density map (in real lattice) to determine the
absolute crystal structure. From the real space, crystal information such as atomic
parameters and molecular geometries could be studied.
In mathematics, real space and reciprocal space are interconnected via Fourier
transform. Unit cell parameters of both spaces could be represented by Equations 2.5
and 2.6 (* for reciprocal) (Figure 2.6).
a.a* = b.b* = c.c* (2.5)
α = α*; β = β*; γ = γ* (2.6)

11
Figure 2.6 Relationship between real lattice and reciprocal lattice (Ooi, 2010).
2.1.4 Atomic Scattering Factors
Every atom is surrounded by its individual electron cloud and hence, the
scattering of X-rays by an atom is actually due to interactions between X-rays with
electrons. Atomic scattering factor (or atomic form factor), fj where j is the number of
electrons, is a measure on scattering efficiency of X-rays waves by an atom compared
to a single electron within (Ooi, 2010). Atomic scattering factors are involved in many
crystallographic calculations such as structure factor of a given Bragg’s peak. The
scattering effect of an atom greatly relies on the atomic nature, the direction of
scattering, the wavelength of incident radiation and the thermal vibrations of the atom
(Ladd & Palmer, 1993). Each element has a unique atomic scattering factor, which is
tabulated in the International Tables for X-ray Crystallography, as a function of
(sinθ)/λ.
For an atom in stationary state, the scattering factor increases with increasing
atomic number (Z), contradictory light atoms such as hydrogen are usually harder to
localize from the diffraction map. Path differences between scattered X-rays become
larger for higher Bragg angle and smaller wavelength (Figure 2.7). At zero scattering
angle (θ = 0°), the waves are in phase so the scattering amplitude is proportional and
maximum to atomic number Z. However, at higher Bragg angle, more scattering waves

12
are out of phase hence destructive interferences happens and consequently reduces the
intensities of diffraction spots (Atomic scattering factor, 2017).
In solid, atoms constantly vibrate about their equilibrium positions unless
external energy (for example heat energy) is supplied. Assume all atoms in the crystal
vibrate in isotropic manner, the scattering factor for the jth atom is corrected by
𝑇𝑗,𝜃 = e
−𝐵𝑗sin2𝜃
𝜆2 (2.7)
where Bj, which is the temperature factor of atom j, is given by
𝐵𝑗 = 8𝜋2𝑈𝑗2̅̅ ̅̅ (2.8)
for that 𝑈𝑗2̅̅ ̅̅ , which is a function of temperature, representing the mean-square
vibrational amplitude of the jth atom normal to the reflecting plane from its
equilibrium position. Counting in the thermal factor, T (also function of (sinθ)/λ), the
temperature-corrected atomic scattering factor could be expressed as
𝑔𝑗 = 𝑓𝑗,𝜃. 𝑇𝑗,𝜃. (2.9)
Figure 2.7 Atomic scattering factors for (a) stationary atom, fj, θ and (b)
temperature-corrected atom, fj, θ . Tj, θ (Ladd & Palmer, 1993).
2.1.5 Structure Factors
The intensity, I of each diffraction spot is integrated and expressed as structure
factor, Fhkl where 𝐼 ∝ (𝐹ℎ𝑘𝑙)2. The structure factor, Fhkl, is a quantity used to express

13
the amplitude and phase, αhkl, of diffracted beams from certain Miller planes (Structure
factor, 2017). The structure factor is influenced by the atomic scattering factors, gj and
it covers information about the Miller planes as well as the position of respective atoms
within the unit cell. It is a vital character in constructing the electron density map for
the crystal structure (Ooi, 2010). In the generation of electron density map, structure
factors of all diffracted rays from a unit cell are calculated and summated, as a unit
cell could represent whole crystal structure via translational symmetry.
Let the fractional coordinates of atoms of type j from an hkl plane in the
examined crystal be xj, yj and zj, the structure factors can be expressed by Equations
2.10 and 2.11:
𝐹ℎ𝑘𝑙 = ∑ 𝑔𝑗exp[i2𝜋(ℎ𝑥𝑗 + 𝑘𝑦𝑗 + 𝑙𝑧𝑗)]
𝑁
1
(2.10)
𝐹ℎ𝑘𝑙 = ∑ 𝑔𝑗𝑐𝑜𝑠2𝜋(ℎ𝑥𝑗 + 𝑘𝑦𝑗 + 𝑙𝑧𝑗)
𝑁
1
+ i ∑ 𝑔𝑗𝑠𝑖𝑛2𝜋(ℎ𝑥𝑗 + 𝑘𝑦𝑗 + 𝑙𝑧𝑗)
𝑁
1
(2.11)
where N is total number of atoms and i is the imaginary number, √−1. An Argand
diagram (Figure 2.8) can be used to demonstrate the structure factor in vector form by
putting Ahkl as ∑ 𝑔𝑗𝑐𝑜𝑠2𝜋(ℎ𝑥𝑗 + 𝑘𝑦𝑗 + 𝑙𝑧𝑗)𝑁1 and Bhkl as ∑ 𝑔𝑗𝑠𝑖𝑛2𝜋(ℎ𝑥𝑗 + 𝑘𝑦𝑗 +𝑁
1
𝑙𝑧𝑗). Thus, the structure factor equation becomes
𝑭ℎ𝑘𝑙 = 𝐀ℎ𝑘𝑙 + i𝐁ℎ𝑘𝑙. (2.12)
In this case, the resultant phase angle could be calculated by
𝛼ℎ𝑘𝑙 = tan−1(B A⁄ ) (2.13)
where A = |𝐀| (2.14)
and B = |𝐁|. (2.15)

14
Figure 2.8 Structure factor, Fhkl is plotted on an Argand diagram in terms of its
amplitude |𝑭𝒉𝒌𝒍| (represented by the length OF) and resultant phase
angle (αhkl) (Ladd & Palmer, 1993).
2.1.6 Where are the Missing Reflections
There are reflections, as well as absences found in a diffraction frame. Absence
occurs when diffracted X-rays form destructive interferences from certain Miller
planes (structure factor shows a zero value as a result of no intensity). The absence of
diffraction spots is essential in determining which space group the crystal adopts.
There are two types of absences in crystallography, which are general absences and
systematic absences. In essence, the general absences decides the lattice type for a unit
cell, based on certain conditions (Table 2.2). For example, a body-centred lattice, I
shows no reflection when the Miller indices from such plane is an odd sum (2n+1).
Table 2.2 Rules for general absences.
Lattice type Condition for general absences
P None
A hkl : k + l = 2n+1
B hkl : h + l = 2n+1
C hkl : h + k = 2n+1
I hkl : h + k + l = 2n+1
F hkl : Neither all odd nor all even
On the other hand, the systematic absences (Table 2.3 and 2.4) reflects the
translational symmetry elements (screw axes and glide planes) in a crystal. For

15
examples, a screw axis along a-axis only happens in Miller planes of (h00) when h is
odd and absent; a c-glide plane perpendicular to a-axis has no intensity in hk0 planes
when h is odd.
Table 2.3 Absence rules for 21 screw axes.
Orientation Condition for systematic absences
Along a-axis h00 : h = 2n+1
Along b-axis 0k0 : k = 2n+1
Along c-axis 00l : l = 2n+1
Table 2.4 Absence rules for glide planes.
Glide plane Orientation Condition for systematic absences
a-glide Perpendicular to b-axis 0kl : k = 2n+1
Perpendicular to c-axis 0kl : l = 2n+1
b-glide Perpendicular to a-axis h0l : h = 2n+1
Perpendicular to c-axis h0l : l = 2n+1
c-glide Perpendicular to a-axis hk0 : h = 2n+1
Perpendicular to b-axis hk0: k = 2n+1
n-glide Perpendicular to a-axis 0kl : k + l = 2n+1
Perpendicular to b-axis h0l : h + l = 2n+1
Perpendicular to c-axis hk0: h + k = 2n+1
*n-axis is diagonal axis.
2.1.7 Fourier Transform
Each diffracted ray from Miller planes has its own direction, amplitude and
phase angle. During data collection, the direction and the amplitude of diffracted X-
rays are identified. Unfortunately, there is still no way to measure the incident phase
angle, αhkl, henceforth the phase problem arises.
With the aid of mathematics, real space and reciprocal space could be
interrelated via Fourier transform since the repeating unit cells in crystal lattice are
analogous to a periodic function (Figure 2.9). For a unit cell of volume V, the electron
density, ρxyz, at (x, y, z) coordinate can be denoted by a Fourier equation as

16
𝜌𝑥𝑦𝑧 =
1
𝑉∑ ∑ ∑|𝐹ℎ𝑘𝑙|𝑐𝑜𝑠2𝜋(ℎ𝑥 + 𝑘𝑦 + 𝑙𝑧 − 𝛼ℎ𝑘𝑙)
𝑙𝑘ℎ
(2.16)
in unit of electrons per cubic angstroms (eÅ-3). Through Fourier synthesis (inverse
Fourier transform), electron density map comprising atomic parameters are calculated
based on structure factors. With these information, the missing phases can be
identified by Fourier analysis (forward Fourier transform) (Ooi, 2010).
Figure 2.9 Fourier connection between real space and reciprocal space.
2.1.8 Structure Solution by Direct Methods
Structure solution is a process to construct a molecular model for the crystal
structure under investigation through calculations. This process also known as phasing,
in which the phase problem is going to be solved. Typically, there are two common
ways to solve the phase problem, which are direct methods and Patterson methods
based on molecule type. Direct methods are basically meant for small organic
molecules without heavy atom, whereas Patterson methods often applied on structures
with heavy atom.
In this study, direct methods are utilized because the studied compounds are
small carbon-based molecules and contain no heavy element. Ultimately, possible
phase angles for every diffraction are deduced directly from respective structure
factors based on two conditions: (i) the resulting electron density must never be

17
negative value and (ii) sharp peaks are presence only at or near atomic positions and
zero peaks elsewhere in an electron density map.
Several steps are included during structure solution by direct methods (Ooi,
2010). The first is to transform structure factors, Fhkl to normalized structure factors,
Ehkl. The normalized structure factor excludes the thermal effects on atoms in order to
exploit atomic information. It also compensated for the nosedive of discrete scattering
factors f with increasing Bragg angles. Only those promising normalized structure
factors are obtained through the Equation 2.17,
|𝐸ℎ𝑘𝑙| =
|𝐹ℎ𝑘𝑙|
√휀 ∑ 𝑓𝑗2𝑁
𝑗=1
(2.17)
where ε is an integer governed by crystal class and type of reflections. The next stage
is origin-fixing of a unit cell. Some of the strongest reflections based on Ehkl are
assigned with phases as to determine the coordinates for the origin (0, 0, 0) within
crystal lattice. Although Fhkl is structure invariants, yet a sign change may occur due
to phase changes, hence selection of origin should be thoughtful as this will affect the
relative phases for such reflections. Once the origin is fixed, reflections with high
|𝐸ℎ𝑘𝑙| value are examined in triplet sets to compare their phase angles. The sum for
each h, k, l in a triplet set should be equal to zero. Next, the most plausible phase set
are employed to develop an Ehkl-based electron density map. Recognizable features of
the structure such as benzene rings are first identified as a preliminary testing model.
However, the model may still incomplete and need to be refined in order to get the
final absolute crystal structure.
2.1.9 Crystal Structure Refinement
The structural model derived from structure solution has to undergo a series of
adjustment and enhancement to match the diffraction data, which so-called the

18
refinement process. For small molecules with atomic number less than 200, least-
squares refinement is usually in practise. Instead of the measured (observed) structure
factors, Fo, this method calculates another set of structure factor (calculated), Fc, and
compares both set of values. Every refinement should improve the model quality and
this repeat until a minimum deviation between Fo and Fc is obtained.
In least-squares refinement, the model’s quality is assured by three common
residual factors, also known as R-factors (Sheldrick, 2015). Among them are the
weighted residual factor (wR or wR2, based on F2), the unweighted residual factor (R
or R1, based on F) and the goodness of fit (S). The values of wR2 and R should
converge to a minimum and the equation for both weighted and unweighted R-factors
are shown in Equations 2.18 and 2.19.
𝑤𝑅2 = [∑ 𝑤(𝐹𝑜
2 − 𝐹𝑐2)2
∑ 𝑤(𝐹𝑜2)2
]
12⁄
(2.18)
𝑅 =
∑(|𝐹𝑜| − |𝐹𝑐|)2
∑|𝐹𝑜| (2.19)
The goodness of fit measures how well the experimental structure matches the
theoretical structure. The value of S should close to but not less than unity, else the too
perfect model is suspicious. The equation for goodness of fit is expressed below, where
NR denotes the number of independent reflections and NP denotes the number of
refined parameters.
𝑆 = [∑ 𝑤(𝐹𝑜
2 − 𝐹𝑐2)2
𝑁𝑅 − 𝑁𝑃]
12⁄
(2.20)
2.1.10 Molecular Disorder
Once in a while, the periodic orientation in a crystal may exist some differently
oriented structures. This phenomenon is known as molecular disorder (Figure 2.10).
When molecular disorder occurs, the value of R-index is higher than usual even all

19
atoms are correctly assigned. Hence, crystallographers have to identify the residual
electron density for these special parts during refinements while the occupancies for
normal and disordered components should sum to unity. If succeed, the value of R-
index will be minimized.
In general, disorder in a crystal structure can be distinguished into two groups:
substitutional disorder and positional disorder (Sheldrick, 2015). Substitutional
disorder happens when the same coordinate of two unit cell hosted by different types
of atoms. This usually is indicated by unusual value of either anisotropic or isotropic
displacement parameters. Positional disorder includes static and dynamic modes,
happens when one atom hosts more than one location. In static case, one would see
the fusion of two structure conformations at one site and it is much easier to be
recognized. For dynamic case, it is harder to be solved because the molecule might
always “moving” though the occurring possibility of disorder could be reduced by
utilizing low-temperature data collection.
Figure 2.10 An example of disorder is shown with odd orientations observed in
periodic arrangement.
2.2 Spectroscopy
Spectroscopy studies the interactions between electromagnetic waves (Figure
2.11) and matter. It is a non-destructive way to discover the structure of a compound,
with little amount of sample required, hence greatly employed in organic chemistry.

20
In this context, two spectroscopic techniques are briefly discussed, which are the
Fourier Transform Infrared (FT-IR) spectroscopy and the Nuclear Magnetic
Resonance (NMR) spectroscopy (proton and carbon-13).
Figure 2.11 Electromagnetic spectrum and their respective molecular effects
(Wade, 2006).
2.2.1 Fourier Transform Infrared (FT-IR) spectroscopy
The Fourier Transform Infrared (FT-IR) spectroscopy includes the infrared
zone of the electromagnetic spectrum. It deals with the vibrational motions of chemical
bonds (only those with changing dipole moment) to authenticate the presence or
absence of various functional groups in a molecule (Pavia et al., 1979). In FT-IR
spectroscopy, infrared photons are absorbed by molecules near to their natural
vibrating frequencies, hence the molecular vibrations are resonated and these signals
are recorded as absorption spectrum by the detector (Figure 2.12). The absorption
spectrum for each compound is unique, acting as a fingerprint for structural
identification.
Figure 2.12 The approximate regions where various common types of bonds
absorb (only stretching vibrations included for clarity)
(Pavia et al., 1979).

21
Photon energy, E, is quantized and depends on its frequency, ν, or wavelength,
λ, where c is speed of light and h is the Planck’s constant.
𝐸 = ℎ𝜈 (2.21)
𝐸 =
ℎ𝑐
𝜆
(2.22)
Generally, the absorption frequencies in FT-IR spectroscopy are expressed in
wavenumber, �̅�, which is also the reciprocal of wavelength (in centimeters). This is
because wavenumber is easier to interpret and directly proportional to energy, in which
a higher wavenumber indicates a higher energy level.
wavenumber, �̅�(cm−1) =
1
wavelength, 𝜆(cm) (2.23)
There are two kinds of vibrational modes in an infrared active molecule, the
stretching and bending modes (Figure 2.13). Normally, higher frequencies are
observed for stretching vibrations than bending vibrations for a particular bond.
Interpretation of FT-IR spectrum (Figure 2.14) could be done by referring to the
infrared correlation tables as a guide.
Figure 2.13 Vibrational modes of a chemical bond (Pavia et al., 1979).
Consider the chemical bond between two atoms as a spring system, the energy
of the spring (bond) is determined by its stiffness (K) and the masses of the two bonded
atoms (m1 and m2). The natural vibrating frequency of a bond can be estimated from
Hooke’s law, which is given by
�̅� =1
2𝜋𝑐√
𝐾
𝜇 (2.24)

22
where K is the force constants in dynes/cm and μ is the reduced mass of the system
expressed as
𝜇 =𝑚1𝑚2
𝑚1+𝑚2. (2.25)
Figure 2.14 An example of FT-IR spectrum (from own data).
2.2.2 Nuclear Magnetic Resonance (NMR) spectroscopy
The Nuclear Magnetic Resonance (NMR) spectroscopy takes place at the
radiofrequency zone of the electromagnetic spectrum. It discloses the molecular
structure of a compound by studying the local magnetic field around atomic nuclei
(Pavia et al., 1979). Most atomic nuclei with odd atomic number or odd mass number
such as proton and carbon-13 have nuclear spins. When an atom is positioned inside
a magnetic field, the low energy radio waves will only able to excite its nucleus to
cause spin transitions, which also known as resonance. The NMR signals produced
are recorded as peaks in the spectrum.
Energy absorbed to cause a spin change is quantized and equal to the energy
difference between the two involved states. For example, a proton atom has two spin
states: +1
2 and −
1
2, the energy to induce spin change in proton is given by Equation
2.26:

23
𝐸absorbed = (𝐸−
12
state− 𝐸
+12
state)
= ℎ𝜈
(2.26)
In NMR spectroscopy, chemical shift, δ, is generally used to indicate how much a
proton/carbon resonance shifted from the standard, tetramethylsilane (TMS) in part
per million (ppm) of the spectrometer’s operating frequency. This is due to the slight
difference in resonance frequency is hard to detect for a sole compound, thus is
compared to a known standard, TMS. The reference value for chemical shift could be
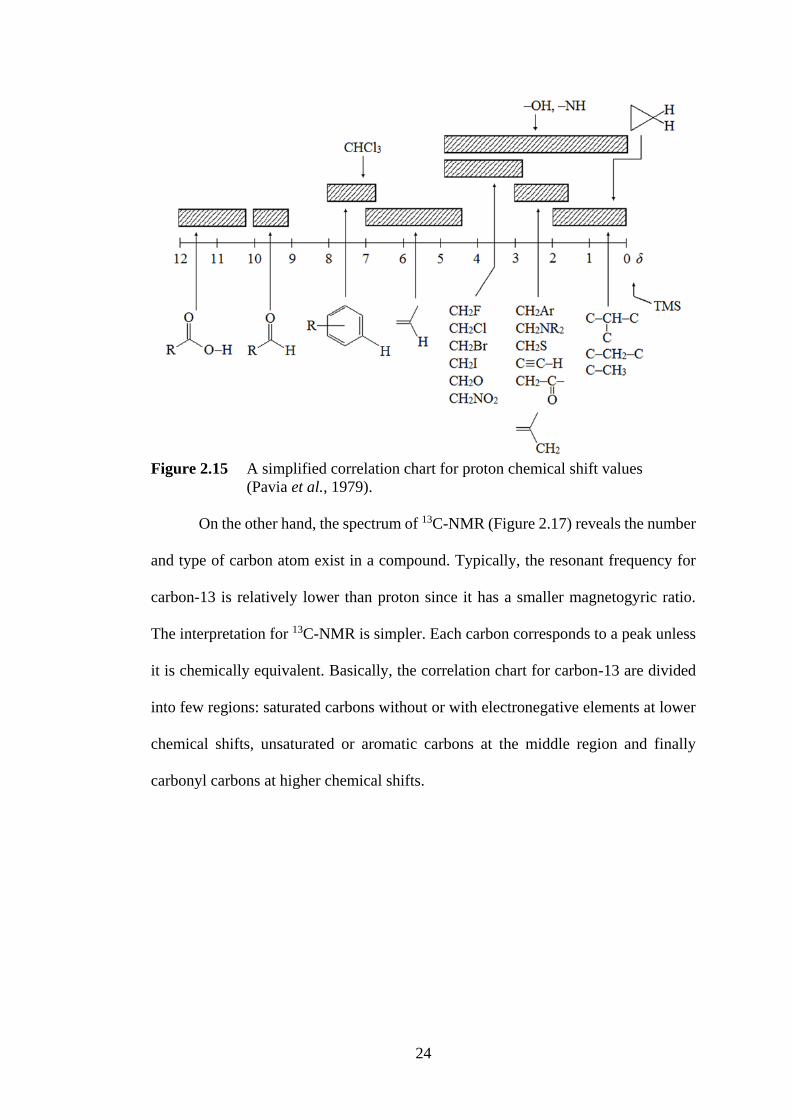
found in the chemical shift correlation chart (Pavia et al., 1979) (Figure 2.15 and 2.16).
chemical shift, 𝛿(ppm) =
shift (in Hz)
spectrometer frequency (in MHz) (2.27)
In the spectrum of 1H-NMR (Figure 2.17), different sets of peaks are exhibited
for protons in distinct chemical environment. Conversely, protons that are chemically
equivalent may resulted in a single peak. The area under each peak indicates the
amount of protons exists at that position, in the form of area ratio but not absolute
number. Since atomic nucleus is surrounded by electrons, the value of chemical shift
for every peak is influenced by the shielding effect on the nucleus. Besides individual
data, the splitting of peak could provide information on its neighbour with the n + 1
rule. For instance, a proton senses two protons (n = 2) attached to its adjacent carbon,
hence a triplet (2 + 1 = 3) is observed for this proton. The peak separation in a multiplet
is defined by their coupling constant, J (in Hertz), which tells how a nucleus is
magnetically affected by its neighbours. Normally, a group of magnetically coupled
protons (such as protons in a benzene ring) can be distinguished by their coupling
constant.
24
Figure 2.15 A simplified correlation chart for proton chemical shift values
(Pavia et al., 1979).
On the other hand, the spectrum of 13C-NMR (Figure 2.17) reveals the number
and type of carbon atom exist in a compound. Typically, the resonant frequency for
carbon-13 is relatively lower than proton since it has a smaller magnetogyric ratio.
The interpretation for 13C-NMR is simpler. Each carbon corresponds to a peak unless
it is chemically equivalent. Basically, the correlation chart for carbon-13 are divided
into few regions: saturated carbons without or with electronegative elements at lower
chemical shifts, unsaturated or aromatic carbons at the middle region and finally
carbonyl carbons at higher chemical shifts.

25
Figure 2.16 A simple correlation chart for 13C chemical shift values
(Pavia et al., 1979).