synthesis and structural-electrical properties correlation
TRANSCRIPT

Synthesis and Structural-Electrical Properties Correlation
of Hybrid Polyaniline-CNT Nanocomposites
Ph.D. Thesis
Anil Kumar (2012RMT9020)
Department of Metallurgical and Materials Engineering
Malaviya National Institute of Technology Jaipur, India
September, 2017

Synthesis and Structural-Electrical Properties Correlation
of Hybrid Polyaniline-CNT Nanocomposites
This thesis is submitted as a partial fulfilment
of the Ph.D. programme in Engineering
Anil Kumar (2012RMT9020)
Department of Metallurgical and Materials Engineering
Malaviya National Institute of Technology Jaipur, India
September, 2017

IN THE NAME OF GURU, THE MOST MERCIFUL, THE MOST GRACIOUS
This thesis is dedicated to
My Parents: Sh. Mohinder Singh & Smt. Susheela Rani
My Wife: Minakshi
My Son: Arsh Joria
For their unconditional love, motivation and especially never ending patience

© MALAVIYA NATIONAL INSTITUTE OF TECHNOLOGY, JAIPUR-2017
ALL RIGHTS RESERVED.

CERTIFICATE
This is to certify that the thesis entitled “Synthesis and Structural-Electrical Properties
Correlation of Hybrid Polyaniline-CNT Nanocomposites” is being submitted by me to the
award of the degree of Doctor of Philosophy in Metallurgical and Materials Engineering,
Malaviya National Institute of Technology Jaipur, is an original research work carried out
by me. The content of the thesis has been checked using plagiarism detector software.
I have incorporated all the suggestions/queries/changes raised by the examiner in the thesis
evaluation report.
(Anil Kumar)
This is to certify that the above statement made by the candidate is true to my knowledge.
Ph.D. viva-voce examination of Mr. Anil Kumar, research scholar was held on 02.09.2017 in
the seminar hall of department of Metallurgical and Materials Engineering MNIT Jaipur. The
candidate defended the viva-voce successfully to the satisfaction of oral defence committee.
The committee recommends for the award of Ph.D. degree.
(Signature of external examiner)
MALAVIYA NATIONAL INSTITUTE OF TECHNOLOGY JAIPUR
DEPARTMENT OF METALLURGICAL AND MATERIALS ENGINEERING
Vinod Kumar
(Supervisor)
Assistant Professor
Discipline of Metallurgy Engineering and
Materials Science, IIT, Indore, India
Dr. Kamlendra Awasthi
(Supervisor)
Assistant Professor
Department of Physics
MNIT, Jaipur, India


ACKNOWLEDGEMENTS
First of all, I would like to express my deep gratitude and sincere thanks to my supervisors
Dr. Vinod Kumar and Dr. Kamlendra Awasthi for their full support, guidance and freedom
for work to accomplish the challenges in my research. It is great honor for me to work
under their guidance.
I am grateful to Dr. Manoj Kumar, Assistant professor, department of physics, MNIT Jaipur,
Dr. Pramod Kumar Sain, lecturer in physics, Government Polytechnic College, Bharatpur
and Dr. Akash Katoch, DST-inspire faculty, IIT Roorkee, for their consistent help and
encouragement throughout my Ph.D. work. Their timely discussions are very much
appreciable. I acknowledge Material Research Centre, MNIT Jaipur for providing the
characterization facilities.
I express my deep appreciation to my friends and co-workers Yogita Kumari, Lokesh Jangir,
Rajesh Jangir, Rini Singh, Kamakshi Awasthi, Pooja Malik, Anoop MD, Shivani Shishodia
and Prashant Sharma from soft materials & high pressure physics lab., Department of
physics, MNIT Jaipur for their assistance and encouragement. I would also like to thank my
friends and labmates Ornov Maulik, Devesh Mittal, Saurav Kumar from materials science
lab., and all the research scholar from Department of Metallurgical and Materials
Engineering, MNIT, Jaipur for their moral support and help. I would like to extend my
sincere thanks to all the faculty and staff members of Department of Metallurgical and
Materials Engineering, MNIT, Jaipur for their support during my Ph.D. life.
Finally, I am also thankful to my younger brother Sunil Kumar and his spouse Sonam, my
sister Jeenu and jija ji Santosh Kumar, my in-laws as they motivate me to do research work,
shared all homely responsibilities.
(Anil Kumar)

i
ABSTRACT
Two types of polyaniline were prepared with (PANI 1) and without (PANI 2) solvent using
ammonium peroxodisulfate oxidant via chemical oxidative polymerization and solid state
oxidative polymerization method respectively. These PANIs were vacuum dried and
designated as PANI 1VD and PANI 2VD. PANI 1VD was selected as matrix for the
developing hybrid nanocomposites. MWCNTs were selected as filler material. A facile and
easy solution mixing method was used to prepare the hybrid nanocomposites. By covalent
functionalization, MWCNTs have been functionalized to improve the dispersion in PANI
matrix. PANI 1VD was also processed through solution casting method for the development
of self-standing film. The prepared film further protonated with hydrochloric acid. X-ray
diffractometry (XRD), Fourier-transform infrared spectroscopy, Raman spectroscopy,
scanning electron microscopy (SEM), transmission electron microscopy (TEM),
thermogravimetric analysis and ultraviolet-visible spectroscopy were used to characterize the
matrix, filler, and nanocomposites. The electrical properties were evaluated using
electrometer. X-ray diffractometry analysis confirmed the high crystallinity of PANI
prepared with solvent. The high electrical conductivity of PANI (prepared with solvent) was
due to the mixed (granular and fibrillar) morphology. SEM and TEM analysis revealed the
formation of PANI nanofibers and dispersion of f-MWCNTs in PANI matrix. The
percolation threshold was found to occur at 0.1 vol. % of f-MWCNTs. At 3.3 vol. %, the f-
MWCNTs/PANI nanocomposite was fully percolated and maximum achieved conductivity
was 1.8 x 10⁻¹ S/cm with 13.9 vol. % of f-MWCNTs. The achieved electrical conductivity of
nanocomposites is in the range which is required for ESD and EMI applications. In addition,
the selected pure PANI (in powder form) for nanocomposites also processed for the
development of self-standing film. SEM study revealed that the prepared film have very
dense structure without any void. The non-protonated film (PANI A) have short fibers only.
However, protonated (PANI B) also have long fibers or bunch of fibers along with short
fibers. Though, a detail study is still going over the film part.

ii
Contents
Page
No.
CHAPTER ONE: Introduction 1
1.1 Objectives of the Research Work and Motivation 4
CHAPTER TWO: Literature Review 5
2.1 Brief Introduction 6
2.2 Methods for Synthesis of Polyaniline 10
2.2.1 Electrochemical polymerization 10
2.2.2 Photo-Induced Polymerization of Aniline 12
2.2.3 Template Synthesis of Polyaniline Nanostructures 13
2.2.4 Enzymatic Polymerization 15
2.2.5 Plasma Polymerization 17
2.2.6 Chemical polymerization 18
2.3 Functionalization of CNTs 19
2.3.1 Covalent Functionalization 20
2.3.2 Defect Functionalization 22
2.3.3 Noncovalent Exohedral Functionalization 22
2.4 Methods of preparation of CNT/PANI nanocomposites 23
2.4.1 Electrophoretic Method 24
2.4.2 In-Situ polymerization 25
2.4.3 Interfacial Polymerization 28
2.4.4 Solution Mixing 30
2.5 Properties of CNT/PANI nanocomposites 32
2.5.1 Electrical Property of CNT/PANI Nanocomposites 32
2.5.2 Thermal Property of CNT/PANI Nanocomposites 34
2.6 Applications 35
2.6.1 Actuators 35
2.6.2 Sensors 36
2.6.3 EMI Shielding 37
2.6.4 Electronic Nanodevices 41
2.6.5 Fuel Cell 41

iii
2.6.6 Supercapacitors 42
CHAPTER THREE: Methodology 44
3.1 Materials 45
3.2 Synthesis of Polyaniline 46
3.2.1 With Solvent 46
3.2.2 Without Solvent 46
3.3 Functionalization of Pristine MWCNTs 48
3.4 Nanocomposites Preparation 48
3.5 Preparation of PANI Films 49
3.6 Characterizations of PANI (powder and film) and PANI
based nanocomposites
51
3.6.1 Density Determination 51
3.6.2 X-ray Diffractometry (XRD) 51
3.6.3 Fourier Transform Infrared (FTIR) Spectroscopy 52
3.6.4 Raman Spectroscopy 52
3.6.5 Scanning Electron Microscopy (SEM) 52
3.6.6 Transmission Electron Microscopy (TEM) 52
3.6.7 Thermogravimetric Analysis (TGA) 53
3.6.8 Ultra Violet-Visible (UV-Vis) Spectroscopy 53
3.6.9 Current-Voltage Measurements 53
3.6.10 Estimated Far-Field EMI Shielding 54
CHAPTER FOUR: PANI Characterizations 55
4.1 PANI with and without Solvent 56
4.2 Density Determination 56
4.3 Structural Study and Crystallinity Determination 56
4.4 Structural Study 58
4.5 Electrical Conductivity 59
4.6 Morphological Analysis 61
4.6.1 Growth Mechanism of the PANI Nanofibers and
Granular Structure
63
4.6.2 Morphology of PANI Changed from a One
Dimensional Shape to a Granular Shape
63
4.7 Thermal Analysis 64
4.8 Absorption Study 66

iv
CHAPTER FIVE: MWCNTs/PANI Nanocomposites 69
5.1 MWCNTs/PANI nanocomposites 70
5.2 Density Determination 70
5.3 Structural Study and Crystallinity Determination 71
5.4 Structural Study 73
5.5 Electrical Conductivity 74
5.6 Estimated EMI Shielding Efficiency 78
5.7 Morphological Analysis of MWCNTs 78
5.8 Structural Study of MWCNTs 79
5.9 Morphological Analysis of Hybrid Nanocomposites
81
5.10 Thermal Behaviour of Nanocomposites 83
CHAPTER SIX: Self-Standing PANI Films 87
6.1 Structural Study and Crystallinity Determination 88
6.2 Structural Study 89
6.3 Thermal Analysis 90
6.4 Electrical Conductivity 92
6.5 Morphological Analysis 94
CHAPTER SEVEN: Conclusions and Future Work 96
References 100

v
List of Figures
Figure No. Caption of the Figures Page
No.
Figure 2.1 Chemical structures of polyaniline 7
Figure 2.2 Chemical structures of the emeraldine base, its acid-doped
intermediate, and final doped form, emeraldine salt
8
Figure. 2.3 SEM images (a and b) of the PANI nanowires at different
magnifications
11
Figure 2.4 Schematic representation of the photo-polymerization of aniline
derivatives with ruthenium complex
12
Figure 2.5 SEM images of PANI composite (A) with UV synthesis and (B) with
visible light synthesis
13
Figure. 2.6 Self-templating production of PANI nanowires on the pre-structured
aluminum via electrochemical reaction
14
Figure 2.7 SEM image of a template synthesized PANI nanofibril membrane
after dissolving in alumina template partly
14
Figure 2.8 SEM top view (a), TEM cross-section view of PANI nanotubules
array in AAO membrane (b) and, TEM image of a PANI
nanotubules (c)
15
Figure 2.9 Polyaniline dispersion particles stabilized by hydroxypropyl
cellulose prepared at 0°C (a) and 40°C (b)
16
Figure 2.10 Microphotograph of PANI film at 350X (a) and 2500X (b) 17
Figure 2.11 Scheme for fluorination of nanotubes, defunctionalization, and
further derivatization
20
Figure 2.12 Derivatization reactions: (i) carbene addition; (ii) functionalization
by nitrenes; and (iii) photoinduced addition of fluoroalkyl radicals
21
Figure 2.13 1,3-Dipolar cycloaddition of azomethine ylides 21
Figure 2.14 The possible organization of the sodium dodecyl sulfate molecules
on the surface of a CNT. (a) The SDS molecules could be adsorbed
perpendicular to the surface of the nanotube, forming a
monolayer,(b) oriented parallel to the tube axis and (c). Half-
cylinders oriented perpendicular to the tube axis
23

vi
Figure 2.15 SEM (i and ii) and TEM (iii and iv) micrograph of c-MWCNT and c-
MWCNT/ES composite
24
Figure 2.16 FE-SEM images of f-MWCNT (a), PANI (b) and MWCNT/PANI
nanocomposites at MWCNTs contents of 4 wt.% (c) and 8 wt.% (d)
26
Figure 2.17 Original MWCNT (a) and those coated with 50 wt% (b), 70 wt% (c)
and 80 wt% PANI (d)
27
Figure 2.18 Original MWCNT (left) and MWCNT (50 wt%) after coating (right)
with polyaniline at the same magnification.
27
Figure 2.19 SEM images (a,d,g), TEM images (b,e,h) and electron diffraction
patterns (c,f,i) of: a-c) MWNT-(OSO3H)n; d-f) PANI-c-MWNT-
(OSO3H)n; g-i) PANI-d- MWNT-(OSO3H)n nanotubes
28
Figure 2.20 Photographs of reaction vials as function of reaction time, the
product in aqueous phase consists of PANI/PANI-g-MWCNT
mixture. The black residue at the bottom of organic phase identified
as the unreacted NH2-MWCNT (white arrow).
29
Figure 2.21 FEG-SEM images of the samples PANI (a), PANI + 0.25% CNT (b),
PANI + 1% CNT (c), and PANI + 4% CNT (d). Scale bar is 1 μm.
29
Figure 2.22 SEM images of the fiber mats of PANI (a), DM-CNT (40 wt.%)
/PANI (b), and CNT(40 wt%)/PANI (c). The inserts are the TEM
images of a single fiber. Arrows denote the alignment direction of
fibers
31
Figure 2.23 Electromagnetic radiation vector 39
Figure 2.24 Attenuation of an electromagnetic wave by a shielding material 39
Figure 3.1 Schematic of preparation of PANI with solvent 47
Figure 3.2 Schematic of preparation of PANI without solvent 47
Figure 3.3 Schematic of functionalization of pristine MWCNTs 50
Figure 3.4 Preparation of self-standing film of PANI A and PANI B 50
Figure 3.5 Flow diagram showing methodology for preparation and
characterizations of PANI and PANI-based nanocomposites
54
Figure 4.1 XRD patterns of PANI 1, PANI 1VD, PANI 2, and PANI 2VD 57
Figure 4.2 Percent of crystallinity of PANI 2; (a) area of crystalline phase (Ac)
and (b) area of crystalline and amorphous phase (Ac + Aa)
57
Figure 4.3 FTIR spectra of PANI 1, PANI 1VD, PANI 2, and PANI 2VD 58

vii
Figure 4.4 Current–voltage characteristics of PANI 1, PANI 2, PANI 1VD, and
PANI 2VD
59
Figure 4.5 SEM images of PANI 1 at (a) 5000X, (b) 25000X and (c) 50000X
magnifications
61
Figure 4.6 SEM images of PANI 2 at (a) 5000X, (b) 25000X and (c) 50000X
magnifications
61
Figure 4.7 SEM images of PANI 1VD at (a)5000X, (b)25000X and (c)50000X
magnifications
61
Figure 4.8 SEM images of PANI 2VD at (a)5000X, (b)25000X and (c)50000X
magnifications
62
Figure 4.9 TEM images of dual (granular and fibrillar) morphology PANI 1 62
Figure 4.10 TGA (a) and DTG (b) curves of PANI 1, PANI 1VD, PANI 2, and
PANI 2VD
64
Figure 4.11 Absorption spectra of PANI 1, PANI 2, PANI 1VD and PANI 2VD 66
Figure 4.12 Optical band gaps of PANI 1, PANI 1VD, PANI 2, and PANI 2VD
corresponding to (a) 330 nm and (b) 630 nm.
67
Figure 5.1 Theoretical and experimental densities of hybrid f-MWCNT/PANI
nanocomposites
71
Figure 5.2 XRD patterns of PANI, f-MWCNT, and hybrid f-MWCNT/PANI
nanocomposites
72
Figure 5.3 FTIR spectra of PANI and hybrid f-MWCNT/PANI nanocomposites 73
Figure 5.4a The DC electrical conductivity and EMI SE of PANI and f-
MWCNT/PANI nanocomposites (the inset figure is showing the
scaling law near percolation threshold)
75
Figure 5.4b scaling law near percolation threshold 76
Figure 5.5 Schematic of the interaction between positively charged PANI and
negatively charged f-MWCNT
77
Figure 5.6 TEM images of pristine MWCNTs (a) and f-MWCNT (b). 79
Figure 5.7 HRTEM images of pristine MWCNTs (a), f-MWCNT (b) and top
view to MWCNT (c).
79
Figure 5.8 Raman spectra of pristine MWCNTs and f-MWCNT 80
Figure 5.9 SEM images of f-MWCNT (0.1 vol. %)/PANI nanocomposites at
5000X (a), 25000X (b) and 50000X (c) magnifications.[f-MWCNT-
81

viii
D (dispersed) and f-MWCNT-A (agglomerated)]
Figure 5.10 SEM images of f-MWCNT (3.3 vol. %)/PANI nanocomposites at
5000X (a), 25000X (b) and 50000X (c) magnifications.[f-MWCNT-
D (dispersed) and f-MWCNT-A (agglomerated)]
81
Figure 5.11 SEM images of f-MWCNT (13.9 vol. %)/PANI nanocomposites at
25000X (a) and 50000X (b) magnifications
82
Figure 5.12 TEM images of f-MWCNT (0.1 vol. %)/PANI (a) and f-MWCNT
(13.9 vol%)/PANI nanocomposites(b). [f-MWCNT-D (dispersed)
and f-MWCNT-A (agglomerated)]
82
Figure 5.13 TGA of PANI, f-MWCNT and hybrid f-MWCNT/PANI
nanocomposites
84
Figure 5.14 Graphical representation of TGA parameter (Tonset, Td, and Char %)
of PANI and hybrid f-MWCNT/PANI nanocomposites
85
Figure 5.15 Schematic of preparation, morphological, structural and electrical
property correlation of hybrid f-MWCNT/PANI nanocomposites
86
Figure 6.1 XRD patterns of PANI A and PANI B film 89
Figure 6.2 FTIR spectra of PANI A and PANI B film 90
Figure 6.3 TGA curve of PANI A and PANI B film 91
Figure 6.4 Current –voltage characteristic of PANI A and PANI B films 92
Figure 6.5 Mechanism of the reaction of PANI film formation. 93
Figure 6.6 Cross-sectional SEM images of PANI A films at 5000X (a) and
50000X (b) magnifications
94
Figure 6.7 Cross-sectional SEM images of PANI B films at 5000X (a), and
50000X (b) magnifications
95
Figure 6.8 Cross-sectional SEM image of PANI B film 95

ix
List of Tables
Table No. Caption of Tables Page
No.
Table 3.1 Weight and volume percentages of the f-MWCNT filler in PANI matrix 49
Table 4.1 Morphology, DC electrical conductivity and band gap of prepared
PANI 1, PANI 2, PANI 1VD and PANI 2VD
60
Table 4.2 Calculation of Tonset, Td and char% of prepared PANI 1, PANI 2, PANI
1VD & PANI 2VD
65
Table 5.1 Weight and volume percentages of the f-MWCNT filler in PANI matrix 70
Table 5.2 Percent of crystallinity for PANI and hybrid f-MWCNT/PANI
nanocomposites
72
Table 5.3 Vibrational frequencies of PANI 74
Table 5.4 Comparison table of sample’s electrical conductivity 76
Table 6.1 Calculation of onset temperature, decomposition temperature, and char
percentage of the PANI A and PANI B
91

x
Abbreviations and Symbols
PF Polyfluorene
PTh Polythiophene
PPP Poly(p-phenylene
PTV Poly (thienylene vinylene)
PPy Polypyrrole
ICPs Intrinsically conducting polymers
ECPs Extrinsically conducting polymers
PA Polyacetylene
2MA 2-Methylaziridine
AZ Azetidine
PY Pyrrolidine
PP Piperidine
HXMI Hexamethyleneimine
HPMI Heptamethyleneimine
DMPU 1,3-Dimethyl-3,4,5,6-tetrahydro-2(1H)-pyrimidinone
NMP 1-methyl-2-pyrrolidinone
PANI Polyaniline
MWCNT Multiwall carbon nanotube
SWCNT Singlewall carbon nanotube
PMCs Polymer matrix composites
EMI SE Electromagnetic interference shielding effectiveness
ESD Electrostatic dissipation
APS Ammonium peroxodisulfate
VD Vacuum dried
PMC Polymer matrix composites
f-MWCNT Carboxylic-functionalized MWCNT
ρc Percolation threshold
σ Electrical conductivity

xi
Z0 Free space impedance
Xc Degree of crystallinity

Page | 1
CHAPTER ONE
Introduction
In this chapter, general introduction about conducting polymer and the
work carried out in the Ph.D. thesis has been dealt. The importance of the
conducting polymers, conducting polymer composites/nanocomposites,
their advantages, and applications have given introduced in this
chapter.Especially, discussion on the PANI and its nanocomposites has
mainly focused. In the end, motivation, objective for the work undertaken,
the methodology adopted, and the results given in brief.

Page | 2
CHAPTER ONE Introduction
========================================
The interest in electrically conducting polymers continues to rise rapidly,
with the wide range of applications. The motivating force for ongoing research in this field is
the potential for a variety of electrical properties combined with advantages of polymers, for
instance, light weight, the relative ease in processing and chemical resistance. Conducting
polymers are widely used for various applications, including actuators, sensors,
electromagnetic interference (EMI) shielding, electronic nanodevices, fuel cell,
supercapacitors, etc. [1]. Great efforts have been made during the past two decades in the
understanding of the structural, electrical, chemical and optical phenomenon of these
polymers, such as polypyrrole (PPy), polythiophene (PT), polyaniline (PANI), polyphenylene
(PPh) and their derivatives. Among these polymers, PANI has been the center of focus during
the last decade due to the presence of reactive NH- groups in its polymer chains, interesting
redox properties, low-cost monomer, facile synthesis and good electrical conductivity. PANI
has been center of attraction among the researchers because of their unique electrical
properties; however, the PANI has the tendency of agglomeration in the organic solvent
which limits its processability. Various gel-inhibitors like 2-Methylaziridine (2MA),
azetidine (AZ) and heptamethyleneimine (HPMI), etc. are used to avoid the agglomeration or
to improve the processability of PANI [2]. Among these gel inhibitors, 2MA is a toxic
compound and the film having AZ is too brittle. But, HPMI additive has found as an
excellent gel inhibitor for a polymeric solution with non-toxic and environmental favorable
characteristics.
Various fillers like metals (or their oxides like iron oxide (Fe3O4) and barium titanium
oxides (BaTiO3), graphite, dielectric/magnetic, etc. are extensively used in PANI matrix to
increase the level of electrical conductivity and especially for electromagnetic interference
(EMI) applications [3]. However, the heavyweight, corrosion nature, high density and
uneconomic processing of metals make them unsuitable for composites. Likewise, graphite
has two-dimensional structure, high percolation threshold, and poor dispensability. Carbon
nanotubes have also been used as filler for improving the electrical conductivity of matrix
component. However, the cost of single-wall carbon nanotubes (SWCNTs) is higher than that
of multi-wall carbon nanotubes (MWCNTs) and hence cost limits the application of
SWCNTs. In addition, MWCNTs have higher permittivity as compare to SWCNTs due to

Page | 3
presence of more number of defects. Agglomeration of CNTs is the major problem which
limits its dispersion in the matrix material. These problems can be rectified via
functionalization process through which functional group created on the surface of CNTs.
Various routes like covalent functionalization, defect functionalization, and non-covalent
exohedral functionalization has been used for the functionalization of CNTs. Defect
functionalization breaks the CNTs in short segment of the tube with a length of 100-300 nm.
Covalent functionalization has an advantage over other because it improves the dispersion of
CNTs in solvent and polymer matrix [1].
In the light of the above, the present research work is an attempt to prepare a PANI-
based hybrid system with improved electrical properties. As per literature reported so far, two
types of morphologies (either granular or fibrillar) are possible in the PANIs, when prepared
with different routes. Hence, for the selection of PANI matrix, it has been prepared with two
different routes, e.g., via chemical oxidative polymerization (PANI 1) and solid state
oxidative polymerization method (PANI 2). These PANIs were vacuum dried and designated
as PANI 1VD (having granular and fibrillar morphology) and PANI 2VD (mostly having
granular morphology). PANI 1VD was selected as a matrix for developing hybrid
nanocomposite, as it has relatively low moisture content and dual morphology which resulted
in the better electrical conductivity. MWCNTs were selected as filler material, as MWCNTs
are cheaper than SWCNTs which makes it commercially suitable. A facile and easy solution
mixing method was adopted to prepare the hybrid nanocomposite. By covalent
functionalization, MWCNTs were functionalized to improve the dispersion in PANI matrix.
Self-standing films were prepared with PANI 1VD through solution casting method. These
films were further protonated with hydrochloric acid to enhance the conductivity.
Matrix, filler, and prepared nanocomposites were characterized using X-ray
diffractometry (XRD), Fourier transforms infrared (FTIR) spectroscopy, Raman
spectroscopy, transmission electron microscopy (TEM), scanning electron microscopy
(SEM), and thermogravimetric analysis (TGA) techniques. Electrical properties were
measured/evaluated using electrometer. In MWCNTs/PANI nanocomposites, the percolation
threshold found at 0.1 vol. % of the MWCNTs and the maximum electrical conductivity was
found to be 0.1 S/cm at 13.9 vol. %. Based on the results obtained so far, the hybrid
MWCNTs/PANI nanocomposites, beyond percolation, could be a potential candidate for
EMI shielding and electrostatic dissipation (ESD) applications.

Page | 4
1.1 Objectives of the Research Work and Motivation
The main objectives of present work have outlined as follows:
Synthesis of PANI powder with and without solvent via chemical oxidative
polymerization and solid state oxidative polymerization methods, respectively.
Synthesis of hybrid MWCNTs / PANI nanocomposites with aim to improve the
electrical conductivity
Synthesis of self-standing film of PANI via solution casting method and their
characterizations.
Materials-Structure-Electrical Properties correlation of hybrid polyaniline-CNT
nanocomposites.

Page | 5
CHAPTER TWO
Literature Review
This chapter covers the literature review for the conducting polymers,
conducting polymer matrix composites/nanocomposites, methods adopted for
the synthesis of pure polyaniline and hybrid CNT/PANI
composites/nanocomposites. Various routes were used to functionalize the CNT
for better dispersion is PANI matrix also explained in detail with suitable
figures. Emphasis has given on the structure of the PANI obtained via various
route and correlated it with the electrical properties. The possible applications
of hybrid CNT/PANI nanocomposites in the area of actuators, sensors, EMI
shielding, electronic nanodevices, fuel cell and supercapacitors also described
in detail.

Page | 6
CHAPTER TWO Literature Review
========================================
2.1 Brief Introduction
Conducting polymers usually refers to a class of organic conjugated polymers having
electrical conductivity. There are many examples of conducting polymers like polyfluorene
(PF), polythiophene (PTh), poly(p-phenylene) (PPP), poly (thienylenevinylene) (PTV),
polypyrrole (PPy) [4-6], etc. These conducting polymers are different from the normal
organic polymer. The organic polymers typically described by sigma (σ) and pi (π) bonds.
The σ -bonds are fixed and motionless due to covalent bonds between the carbon atoms. On
the other hand, π-electrons in a conjugated polymer are relatively localized, unlike the sigma
electrons.
Conducting polymers can be broadly divided into two types, i.e., intrinsically
conducting polymers (ICPs) and extrinsically conducting polymers (ECPs). ICPs have
electrical conductivity in their pure form (without the addition of foreign constituent), or
doped form. On the other hand, ECPs, are made conducting through a blend of ICPs with
organic polymers or metal oxides, etc. In 1960, the discovery of ICPs, become an interesting
area of research because of their excellent properties. The impact of this field in science was
recognized in the year 2000, when MacDiarmid, Heeger, and Shirakawa awarded with the
noble prize in chemistry for developing polyacetylene (PA) as a conducting polymer. This
polymer was referred as “synthetic metals” having a π-conjugated system in the polymeric
chains and showed a higher level of electrical conductivity when processed with oxidative
and reductive polymerization [7]. They exploited π-bond of the conjugated system as it is
weak due to sidewise overlapping of p-orbital. Similarly, the structure of polymers mentioned
above can exploit for wide use in numerous commercial applications such as electronic,
electrical, electrochemical, chemical, electro-luminescence, electromechanical,
thermoelectric, membrane, electromagnetic, electro-rheological and sensors [8, 9]. The
intrinsic conducting polymers like polyaniline (PANI), PPy, and PTh in their doped form,
susceptible de-doping processes. These ICPs are most promising for the applications
mentioned above, mainly for stability reasons. The processing of these polymers into fibers
and film shapes presents an additional challenge. In general, the processing of conducting

Page | 7
polymers is less energy intensive as compared to the conventional electronic materials but it
still somewhat problematic about conventional polymers. Among various ICPs, PANI is a
comparatively well-investigated conjugated polymer, taking the subject of wide-range
research for over many years. PANI offerings itself is well-matched for a multiplicity of
applications because of its low-cost monomer, ease of synthesis, the presence of reactive NH-
groups in its polymer chains, better stability, tuneable properties and most important is its
redox characteristics [10, 11]. The processability of PANI is very limited because of its very
high glass transition temperature (Tg) and even higher melting temperature mainly in its
doped state. The Tg of PANI range ranges from 220-250 °C [12]. In the early 1980s,
conducting properties of PANI
Leucoemeraldine (fully reduced, clear)
Emeraldine Base (partially oxidized, blue)
Pernigraniline (fully oxidized, violet)
Figure 2.1: Chemical structures of polyaniline.
were rediscovered and tailored for various potential applications like anticorrosion coatings
[13, 14], electromagnetic shielding devices [15], and lightweight battery electrodes, etc. [16].

Page | 8
PANI has three idealized oxidation states: the fully oxidized state (pernigraniline), the fully
reduced state (leucoemeraldine), and the partially oxidized state (emeraldine base or
emeraldine salt) (figure 2.1).
The conducting emeraldine salt (figure 2.2) (green color) form of PANI is limited to
soluble in most of the organic solvent.The de-doping of emeraldine salt to emeraldine base
(blue color) form in ammonium hydroxide [17] or suitable basic solution make it soluble in a
solvent like DMPU, m-cresol, and NMP, etc. PANI also has a tendency to agglomerate in the
solvent because of which its processability is limited to casting. Various gel-inhibitors like 2-
Emeraldine Base
Doped with protonic acid De-dope with strong base
Electronic rearrangement
Emeraldine salt (conducting)
Figure 2.2: Chemical structures of the emeraldine base, its acid-doped intermediate, and final
doped form, emeraldine salt.
Methylaziridine (2MA), azetidine (AZ), pyrrolidine (PY), piperidine
(PP),hexamethyleneimine (HXMI) and heptamethyleneimine (HPMI) are used to avoid the

Page | 9
agglomeration of PANI. These secondary amine inhibitors inhibit the gelation and also
provide strength to the film. The electrical conductivity of PANI can be tuned using various
dopants like HCl, H2SO4, HCOOH, I2, camphor sulfonic acid (CSA) and methylene blue.
[18]. The chemical treatment taken for doping and de-doping process affects the electrical
conductivity as well as the morphology of the PANI polymer [19]. PANI conductivity in
emeraldine salt form is close to the value of common semiconductors (conductivity 102S/cm)
and it exceeds in common polymers (conductivity <10-12 S/cm).
Various polymerization methods are available for the synthesis of PANI like
electrochemical polymerization, template polymerization, enzymatic polymerization, photo-
polymerization, plasma polymerization, chemical polymerization, and some other special
methods. Among these methods, chemical polymerization is most attractive due to easy
handling, very simple, and large mass production point of view. The typical chemical
oxidative polymerization methods of aniline include emulsion, solution blending, dispersion,
interfacial, heterophase, self-assembling, metathesis, sonochemical and seeding
polymerizations. The development of PANI-based hybrid nanocomposites acquired the
excellent properties that individual components can never attain. PANI has been used both as
a filler and matrix material to achieve the desired properties of the multi-phase component.
The processability of PANI makes it suitable for the fabrication of PMCs by incorporating
conducting carbon nanotube (CNT) as filler. In recent time, unidirectional nanostructure CNT
(having sp2 hybridized carbon structures) widely used in the matrix of PANI. The unique
nanoscale morphology of CNT has a great impact on its mechanical, electrical, optical, and
chemical properties [20]. The semiconducting and metallic nature of CNT depends upon the
arrangement of the hexagon rings along with tubular surface. Single-wall carbon nanotubes
(SWCNT) having closed ends at both sides with a semi-fullerene molecule consist of a single
graphite sheet. Multi-wall carbon nanotubes (MWCNTs) consisting of up to dozens of
concentric tubes comprise a central tube of nanometric diameter surrounded by graphitic
layers with an intertube spacing roughly equal to the van der Waals graphite interplanar
distance, 0.34 nm [21]. However, the difficult manipulation of CNT in any solvents, lack of
solubility and dispersion (due to the existence of weak van der Wall force) have imposed
great limitations for its use. These van der Wall forces can minimize with the surface
modification of one-dimensional structures are grouped into three categories.
(a) Wrapping of functional groups or non-covalent adsorption at the surface of nanotubes

Page | 10
(b) Endohedral filling of their empty inner cavity.
(c) Reactions onto the π-conjugated skeleton of CNT for covalent attachment of chemical
groups.
CNT can form supramolecular complexes after interaction with different classes of
compounds [22-28]. In the current scenario, the incorporation of CNT in PANI
nanostructures (nanofibers, nanorods, nanotubes, and nanowires) develop a new functional
material. The attention of scientific society toward hybrid CNT/PANI system paid at the end
of 20th century. The expected applications of hybrid CNT/PANI nanocomposite include
diodes, solar cells, supercapacitors, sensors, electrochemical energy storage devices, EMI
shielding or EM absorbers and supercapacitors. These applications directly linked to
mechanical, thermal, morphological, electrical, and electrochemical properties of hybrid
CNT/PANI nanocomposite. The incorporation of CNT in PANI approves a change in
electronic and physical structure which leads to generating many novel properties [29]. The
individual chemical properties of filler and matrix material may alter the developed hybrid
CNT/PANI nanocomposites. In hybrid CNT/PANI nanocomposite, the filler might be
covalently bonded to the matrix or with filler-matrix interaction. As of morphological point
of view, PANI can attach to the CNT surface at different selective sites. There are more ways
to prepare the hybrid CNT/PANI nanocomposites, out of which chemical and electrochemical
polymerization are most utilized techniques. Research on the subject of the development and
properties of hybrid CNT/PANI nanocomposite has been carried out in dissimilar fields. As
believed CNT/PANI is a donor–acceptor system where photo-induced charge transfer
occurred between PANI and CNT for photovoltaic effect [30].
2.2 Methods for Synthesis of Polyaniline
2.2.1 Electrochemical Polymerization
Nowadays, the electrochemical approach used significantly for the synthesis of
polyaniline films deposited on the working electrode. Electrochemical polymerization (ECP)
technique is interesting because of the following two reasons.
(1) ECP method provides better polymerization with a fine control of the initiation and
termination steps.
(2) It has a degree of technological potential.

Page | 11
The reactions carried out by this method is often much cleaner which results to form
relatively pure form of PANI compared to obtained through chemical polymerization. This
method is clean because no additional chemicals such as oxidant, surfactant, and so on are
not used here. So, this method controls the pollution problem. The polymerization cell design
is of equal importance, and the same versatility in the form of assembly is attained to prepare
polyaniline. EC route used for the polymerization of aniline under constant current
(galvanostatic), constant potential and a potential scanning/cycling or sweeping. The
galvanostatic route comprises of two-electrode assembly dipped in an electrolyte solution
(containing monomer), and a constant current is supplied to form PANI film on the surface of
a platinum foil electrode. Diaz et al. [31] reported that polymerization of aniline monomer at
constant potential produces polymer powder which observed weakly on the electrode. Genies
et al. [32] demonstrated that electro-oxidation of aniline monomer by uninterrupted cycling
amid predetermined potentials produces an even polymeric film which confidently sticks to
the electrode surface. Gupta et al. [33] reported the PANI nanowires via the electrochemical
route; these nanowires deposited on stainless steel electrode at the potential of 0.75 V vs.
SCE (figure 2.3a and 2.3b).They found the long-standing cyclic stability of the PANI
nanowires which confirmed its implications for the high-performance supercapacitors. PANI
nanofibers prepared by Karami et al. [34] by using pulsed galvanostatic
electropolymerization
Figure 2.3: SEM images (a and b) of the PANI nanowires at different magnifications [33].
of aniline at different conditions. To produce the uniform morphology of PANI nanofibers,
the effect of such variables as bath temperature, relaxation time (toff), pulse height (current
amplitude), pulse time (ton), HClO4 and aniline concentrations were studied. The optimum

Page | 12
conditions used to prepare the PANI leads to develop the uniform morphology of PANI
nanofibers on an average length of 4 m and an average diameter of 80 nm.
2.2.2 Photo-Induced Polymerization of Aniline
The photochemically initiated polymerization of aniline involves the photo-excitation
of monomer for the synthesis of polyaniline. In this method, synthesis is done by irradiating
gold electrode with a Nd: YAG laser in a solution containing aniline monomer under an
applied external bias. [35]. Visible argon laser irradiation also forms polymer on the
electrode. However, the thorough polymerization mechanism is not yet known.
Photopolymerization is a direct way to make PANI in which photons and metallic ions
replace conventional oxidants to support polymerization of aniline. With photo-catalytically
route PANI was also achieved by Teshima et al. [36] in the double layer structure composed
of ruthenium complex-incorporated Nafion and viologen-pendant-poly(siloxane) in acidic
aqueous solutions. It explained that N-phenyl-p-phenylenediamine (PPD, head-to-tail
coupling dimer of aniline) along with aniline monomer also essential to induce
photopolymerization [35]. In this process PPD worked as an initiator for
photopolymerization, the assumed photopolymerization mechanism shown in figure 2.4.
Figure 2.4: Schematic representation of the photo-polymerization of aniline derivatives with
ruthenium complex
Barros et al. [37] reported that the morphology of the resulting polymer intensely depends on
the excitation wavelength. Photo-polymerization approach yields a composite material where
Ag nanowires and microwires made along with PANI. They observed the globular
morphology for the UV synthesis, and a fibrillar observed for visible light excitation (figure
2.5). These results revealed the granular morphology for PANI, while nano and micro Ag
wire growth were also observed (figure 2.5a). Besides, when wavelength changes to the
visible region, simply fibrillar morphology was observed for PANI, and there is a no

Page | 13
appearance of Ag wire with the polymer (figure 2.5b). From these results, it concluded that
the polymerization strongly depends upon the excitation energy. The time required for
Figure 2.5: SEM images of PANI composite (a) with UV synthesis and (b) with visible light
synthesis [37]
polymerization with visible excitation was more than that of UV excitation. The delay in time
was due to the change in structure.
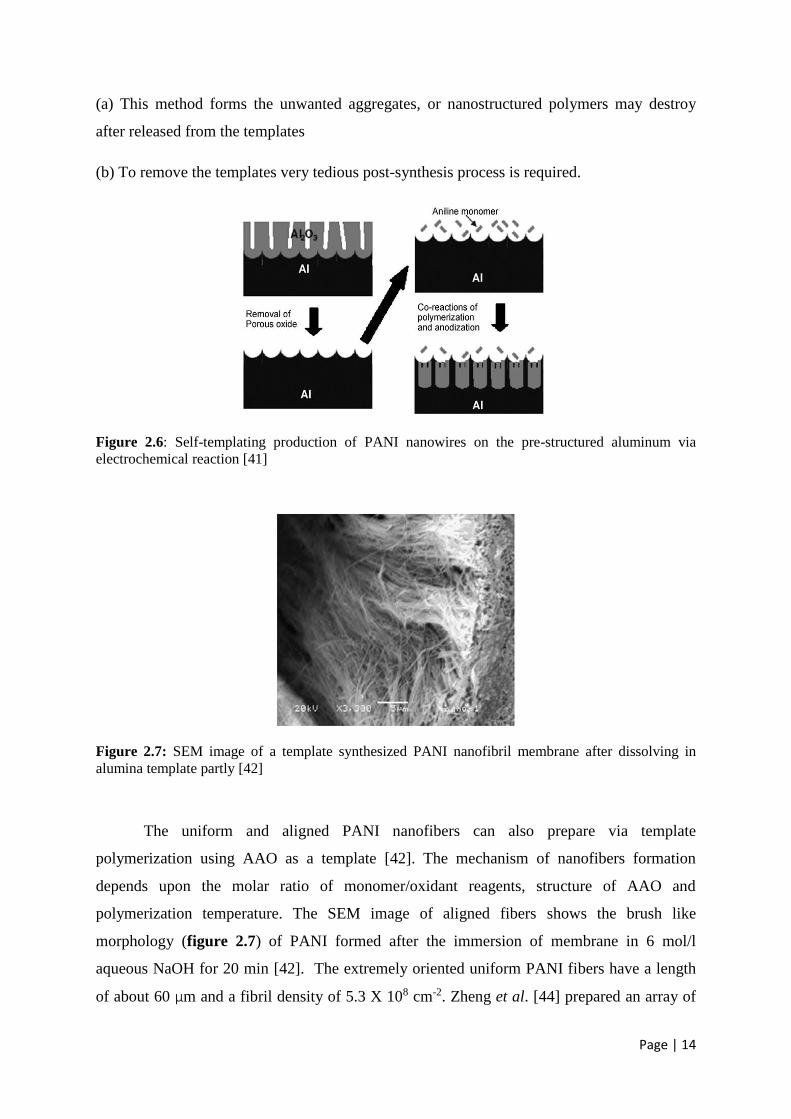
2.2.3 Template Synthesis of Polyaniline Nanostructures
Template synthesis is very simple and effective method used to obtain the
nanostructure of polymeric material [38, 39]. With this route, the desired shape of material
can be acquired in the pores of a template. This route has been widely used in
electrochemical and chemical polymerization to develop conducting polymer nanostructure
[40]. The self-templating electrochemical synthesis of PANI nanowires using aluminum as a
template illustrated in figure 2.6. The chemical etching is used to remove the aluminum
oxide from the aluminum substrate which arises the pre-structured aluminum. After that,
constant current density supplied on pre-structured aluminum. The nanowires of PANI
fabricated in porous alumina by disappearing the barrier in phosphoric acid (H3PO4). The
anodization process is the key factor to obtain the morphology of the shape of the pores [41].
Template method is most interesting and useful due to its effectiveness in the preparation of
one-dimensional nanostructured or microstructured PANI with a controllable length,
diameter, and orientation [42]. Wu et al. reported the PANI filaments (diameters of 3 nm) in
the hexagonal channels of a mesoporous aluminosilicate [43]. However, some shortcomings
of this method are as follows:
Page | 14
(a) This method forms the unwanted aggregates, or nanostructured polymers may destroy
after released from the templates
(b) To remove the templates very tedious post-synthesis process is required.
Figure 2.6: Self-templating production of PANI nanowires on the pre-structured aluminum via
electrochemical reaction [41]
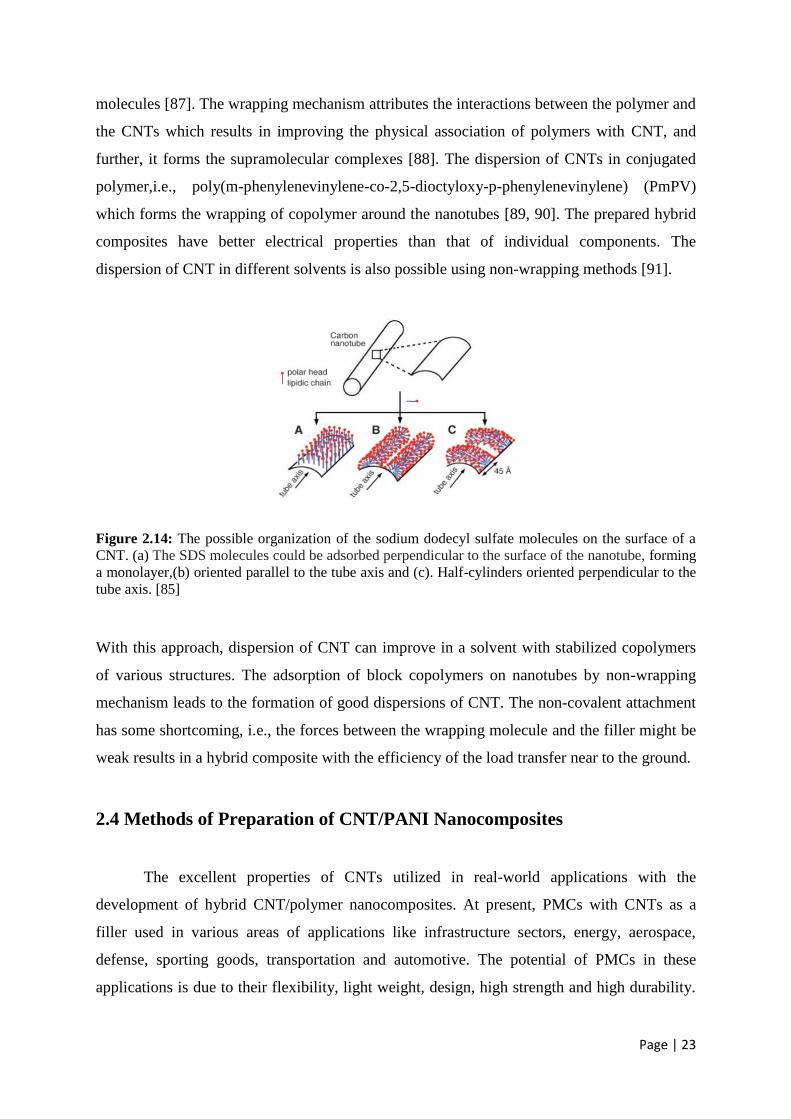
Figure 2.7: SEM image of a template synthesized PANI nanofibril membrane after dissolving in
alumina template partly [42]
The uniform and aligned PANI nanofibers can also prepare via template
polymerization using AAO as a template [42]. The mechanism of nanofibers formation
depends upon the molar ratio of monomer/oxidant reagents, structure of AAO and
polymerization temperature. The SEM image of aligned fibers shows the brush like
morphology (figure 2.7) of PANI formed after the immersion of membrane in 6 mol/l
aqueous NaOH for 20 min [42]. The extremely oriented uniform PANI fibers have a length
of about 60 µm and a fibril density of 5.3 X 108 cm-2. Zheng et al. [44] prepared an array of

Page | 15
PANI coaxial nanowires using an anodic aluminum oxide (AAO) membrane as the template.
The nanotubule array of PANI in an AAO membrane depicted in figure 2.8 The SEM image
with a top view (figure 2.8a) shows the diameter of the pores in AAO membrane is about 60
nm. The TEM image shows that PANI nanotubules were not in contact with the walls of the
Figure 2.8: SEM top view(a), TEM cross-section view of PANI nanotubules array in AAO
membrane(b) and, TEM image of a PANI nanotubules (c) [44]
pores in an AAO membrane (figure 2.8b). The TEM image of one PANI nanotubule shown
in figure 2.8c. It illustrates that the inner diameter of PANI nanotubule is less than 10 nm and
the outer diameter less than 30 nm which is inconsistent with the diameter of PANI
nanotubules in AAO membrane exposed in figure 2.8b.
2.2.4 Enzymatic Polymerization
During the last decade, conducting polymers are extensively used in many enzymatic
displays [45]. The most studied system based on glucose oxidase (GOD) enzyme which is
very interesting because of its cheapness, naturally robust and sugar analysis silently active in
the field of research. Conducting polymers like PTh, PANI, and PPy [46, 47], or other
derivatives are extensively used to develop ECP-GOD devices. The synthesis of PANI via
enzymatic polymerization of aniline takes place under milder conditions compared to
chemical polymerization. The biological molecules like Urease [48], uricase [49], tyrosinase
[50], horseradish peroxidase (HRP) and soybean peroxidase (SBP) widely used in
combination of conducting polymers [51]. Mejias et al. [52] reported that soybean peroxidase
(SBP) and horseradish peroxidase (HRP) are oxidoreductase enzymes, has the ability to
oxidize aromatic amines in the presence of hydrogen peroxide (H2O2). HRP and SBP
enzymes have high reaction selectivity toward aromatic compounds. They cut down the
oxidation by-products to water because of which peroxidase catalyzed polymerization of

Page | 16
aniline to PANI is considered to be an environmentally friendly route. McEldoon et al. [53]
explain that the melting temperature of SBP is 90.5 °C at the pH of 8.0 (in the presence of
1mMCaCl2) because of which this enzyme is thermodynamically more stable than that of
HRP enzyme. From early studies, it was found that low molecular weight branched PANI
prepared via enzymatic polymerization. To avoid this issues, enzymatic polymerization of
aniline takes place with polyelectrolyte templates such as polystyrene sulfonate (PSS).Some
other templates like poly(vinylphosphonic acid) and deoxyribonucleic acid (DNA) also used
for the polymerization of aniline monomer [54]. In this approach PSS, release the counter
ions for doping emeraldine base form of PANI to its conducting emeraldine salt. It also plays
a vital role in imparting the water-soluble complex of emeraldine salt form of PANI with a
well-defined structure at pH > 4.3 [55]. The high degree of complex formation makes it
difficult to obtain PANI in bulk form; especially for fibers and free-standing films.
Peroxidase-catalyzed polymerization of aniline monomer is an eco-friendly method to
acquire PANI because this enzyme is derived from non-pollutant renewable sources and had
extraordinary reaction selectivity to aromatic compounds. It was reported that bulk
emeraldine salt form of PANI could be prepared using HRP enzyme at pH 3.0. However,
enzyme drives through denaturing process at these reaction conditions. This issue can solve
by carrying the reaction at high pH (above 6.0). When the reaction is taking place at higher
pH without an anionic template, the obtained product possess some structural defects like
ring coupling and cross-linked chain. These defects affect the conjugation of PANI backbone
which leads to the decline in the conductivity of PANI [56]. On the other hand, soybean
peroxidase (SBP) possess well catalytic activity in an acidic
Figure 2.9: Polyaniline dispersion particles stabilized by hydroxypropyl cellulose prepared at 0 °C (a)
and 40 °C (b) [57].

Page | 17
environment and advanced thermodynamic stability than HRP. These properties of SBP
enzyme may be useful in producing conducting PANI at the same condition. Stejskal et al.
[57] reported the dispersion of PANI in the presence of hydroxypropyl cellulose. They
obtained the uniform particle of PANI in sub micrometer at 0 °C (figure 2.9a), and core like
cylindrical morphology at 40 °C (figure 2.9b).
2.2.5 Plasma Polymerization
Plasma polymerization of aniline monomer is a low-cost and reliable method for the
synthesis of polyaniline without using any oxidizing agent and solvent [58]. Cruz et al. [59]
prepared the PANI film via plasma polymerization using RF glow discharges with resistive
coupling between stainless-steel electrodes. They acquired the polymer at a pressure in the
range (2–8) x 10-2 Torr and a frequency of 13.5 MHz. The PANI film doped with I2was
adhere to metal and glass surface. The morphology of PANI film at 350 X (figure 2.10a)
shows the layers stacked over the substrate with different thickness. While removing the film
from the surface, its edges get disturbed and look like sharp edges. Figure 2.10b shows the
morphology of film at 2500 X having two regions with different appearances (plain film and
distribution of bubble on the surface). The normal surface is the homogeneous growth of
polymer. However, bubbles ascribed to drops of oligomers or monomer trapped between the
layers that vaporize. Plasma polymerization also used to deposit the thin films of PANI-nano
carbon on a silicon substrate with functional gradient properties and electronic transport with
charge accumulation [60]. Nastase et al. [61] explore the possibility to deposit
Figure 2.10: Microphotograph of PANI film at 350X (a) and 2500X (b) [59]

Page | 18
polythiophene-silicon dioxide (PTh-SiO2) and polyaniline-silicon dioxide (PAni-SiO2)
nanocomposites via plasma polymerization method. They produced the film by spraying of
mixtures of silica nanoparticles dispersed in the liquid monomer into a plasma stream of the
DC-plasma discharge reactor. It was observed that the silica in polymer matrix alter the
mechanism of conduction from ohmic to ballistic and traps inducing the space charged
limited currents (SCLC). It was also seen that the filler material varies the composition of
deposited films and the morphology. This method is used for the preparation of hybrid PANI
nanocomposite with various nanofiller materials. For preparing hybrid CNT/PANI
nanocomposites, the surface of CNT is activated using N2 plasma afterward; plasma induces
the polymerization of aniline monomer.
2.2.6 Chemical Polymerization
Chemical polymerization is a facile and efficient method having the capability of
generating bulk quantities of conducting polymers [62]. It is cost-effective for commercial
mass production, comparatively less time consuming and some companies generating bulk
powders, dispersions, and coated products. The synthesis of PANI via a chemical
polymerization involves the mixing of the monomer with an oxidizing agent in acidic,
aqueous and non-aqueous media. Sapurina and Stejskal used a silver nitrate oxidant [63] to
polymerize aniline via chemical polymerization. It revealed that the product contained non-
conducting aniline oligomers or conducting PANI with a high molecular weight. Liu and his
co-workers [64, 65] synthesized hydrochloric acid (HCl) doped PANI with ammonium
peroxidisulfate [(NH4)2S2O8 or APS] as an oxidant and observed a beltlike morphology
stacked by spherical particles. The morphology of the polymer depends on the dopant and
could be altered by suitable dopants and further tuned by the drying conditions. The oxidizing
agent APS was used because of its high oxidation potential (2.01V) [63]; this, in turn,
accelerated the polymerization mechanism. This oxidizing agent is very prominent to the
incorporation of HSO4–/SO4
2– as the dopant anions (A–) in the PANI.HA product. These
reactions take place in an acidic media with pH <3; to assist the solubilization of the aniline
monomer in aqua and prevent the massive formation of undesired branched products. The
oxidant to aniline monomer ratio of <1.2 is employed because of S2O82– anion is a two-
electron oxidizer (acceptor) which remove two electrons from each aniline monomer during
polymerization. Kumar et al. used APS as an oxidant for the synthesis of PANI in air and
vacuum dried condition with (PANI 1 and PANI 1VD) and without (PANI 2 and PANI 2
VD) solvent via chemical oxidation polymerization method [66]. They obtained dual

Page | 19
(granular and fibrillar) morphology of PANI prepared with solvent and only granular
morphology without solvent. The clear view of nanofibers was also shown with the TEM
image of PANI 1. A. Kumar and his group explained that growth mechanism of PANI
nanofibers and conversion of one-dimensional morphology shape to granular shape depends
upon the rate of addition of aniline monomer (one drop every 10 seconds for nanofibers). The
electrical conductivity of PANI 1, PANI 1VD, PANI 2 and PANI 2VD were reported as 3.3 x
10-2 S/cm, 0.3 x 10⁻² S/cm, 0.1 x 10⁻² S/cm and 0.3 x 10⁻³ S/cm, respectively.
PMCs using carbon nanotube (CNT) as a filler are more popular because they are
light-weight, easy to process, corrosion resistance and having a high level of electrical
conductivity due to the generation of conductive paths in the polymer. Experimental studies
revealed possible improvements in the electrical and mechanical properties of PANI by
efficient incorporation of CNT [67].The intriguing properties of CNT like chemical stability,
electrical and thermal properties are exploiting in the field of materials chemistry and
polymer matrix nanocomposites. However, the issues which limit the reinforcing efficiency
of CNT in a polymer matrix is its poor dispersion and contamination. These problems can
solve by the surface treatment of CNT.
2.3 Functionalization of CNTs
CNTs are tremendously resistant to wetting, hard to disperse and dissolve in aquatic
and non-aquatic media. The carbon nanotube has low mass density, large aspect ratio
(typically ca. 300-1000) and high flexibility [68]. The preparation of hybrid
composites/nanocomposites using insoluble nanotubes as a filler is a huge problem in
generating, aligned assemblies, which is important for the construction of electronic devices.
An appropriate functionalization of the carbon nanotubes represents a strategy for
overpowering these obstacles and become an attractive mark for materials scientists. The
functionalization of CNT can improve processability, solubility and permit the combination
of the exceptional properties of nanotubes with those of other types of materials. Chemical
bonds are responsible for the interaction of the nanotube with other entities, such as a
polymer, biopolymer matrices, and solvent, etc. It is believed that functionalized nanotube
have good electrical and mechanical properties than that of the un-functionalized nanotube,
and thus may exploit in the field of material chemistry. There are numerous methods for
functionalization of CNTs including covalent functionalization, defect functionalization, and
non-covalent functionalization [24].

Page | 20
2.3.1 Covalent Functionalization
Covalent functionalization of CNTs is a very promising approach for nanotubes
modification and derivatization [69]. Though, it is hard to achieve control over the chemo-
and regioselectivity with the addition of halogens, carbenes, arynes, and drastic reaction
conditions. The reactivity of CNT is very high due to the presence of sp2 hybridized (π-
orbital) carbon atom in their structure. These orbitals have more tendency to covalently bond
with the chemical species having sp2 and sp3 hybridization of carbon atom [70]. The change
in hybridization from sp2 to sp3 affects the translational symmetry of CNT which further
influences it’s electronic and transport properties. Covalent functionalization of CNT
enhances its dispersion in solvent and polymer matrix either by direct reagents to the
sidewalls of nanotubes or by modification of surface-bound carboxylic acid groups on the
nanotubes. The oxidation of CNT is possible in the presence of air, oxygen, concentrated
sulfuric acid, nitric acid, aqueous hydrogen peroxide, and acid mixture which generates the
functional groups like –COOH or –OH on the surface of CNT. The pristine MWCNTs has a
very smooth surface, and after surface treatment, its surface gets rough which shows the
defects in the carbon-carbon bonding along with carboxylic acid groups. The required
parameter to increase the number of –COOH groups on the surface of CNTs are acid
treatment, time and temperature. With increasing time and temperature number of –COOH
groups also increases [71, 72]. The –COOH group on the surface of CNT is an appropriate
Figure 2.11: Scheme for fluorination of nanotubes, defunctionalization, and further derivatization.

Page | 21
Figure 2.12: Derivatization reactions: (i) carbene addition; (ii) functionalization by nitrenes; and (iii)
photoinduced addition of fluoroalkyl radicals
Figure 2.13: 1,3-Dipolar cycloaddition of azomethine ylides
functional group as compared to others one due to multiple chemical reactions conducted
with this group. It also supports the attachment of organic or inorganic materials, which is
essential for solubilizing nanotubes [73]. The crosslinking between CNTs can done with
covalent functionalization via thiolation and esterification reaction [74]. Mickelson et al. [75]
reported the fluorination of SWCNT at the side walls by passing fluorine element at different
temperatures. The solubility of organolithium and Grignard reagent in chloroform convert the
fluorinated SWCNTs into alkylated SWCNTs (figure 2.11). It can also be solubilized by
direct functionalization of their side walls by cycloaddition reactions like carbenes addition,
nitrenes addition (figure 2.12), nucleophilic cyclopropanol, Azomethineylides [76] (figure
2.13), Diel- Alder reaction and side wall osmylation. CNT can also functionalized with the
addition of radicals, electrophilic addition, and nucleophilic carbene [77, 78].

Page | 22
2.3.2 Defect Functionalization
The oxidative treatment is used to eradicate amorphous carbon or metal particles from
the raw materials.This methodology observes the defects at the open ends of CNTs. The
oxidized carbon atoms in the form of carboxyl (-COOH) group were attached to the surface
of CNT [79]. This treatment breaks the CNT in short segment of tubes with lengths 100–300
nm. Mawhinney et al. [80] reported the 5% of carbon atom at the localized defective site of
SWCNTs by the evolution of carbon dioxide (CO2), carbon monoxide (CO) at 1273 K
temperature. Hu et al. [81] also described the 1-3 % of acidic sites using acid-base titration
method. This method is not efficient for generating defective sites at the surface of CNT
because of which CNT can not properly disperse in the polymer matrix. After the finishing,
off weak van der Wall, forces functionalized CNT are more dispersible in an organic solvent
than pristine CNT. This method is also proposed to get individual and soluble (in organic
solvent) SWCNT macromolecules if reaction time increased for four days (at elevated
temperature) in the presence of acid chloride group with amines [82].
2.3.3 Noncovalent Exohedral Functionalization
The non-covalent functionalization of the outer surface of CNTs widely interested in
reserving the extended p-network of the nanotubes [83]. In this method, nanotubes can be
moved to the liquid phase via non-covalent functionalization of the surface-active molecules,
for example, sodium dodecyl sulfate (SDS) or benzalkonium(BKC).The hydrophobic
surfaces of the CNTs can be changed to the hydrophilic surface using Triton X-100 as a
surfactant [84]. As a result, CNT-Triton conjugate interacts with the reductase, both having
hydrophilic surface creating a water-soluble complex of the immobilized enzyme. The
interactions between the enzyme and CNT-Triton conjugates can confirmed by gel
electrophoresis and Raman spectroscopy. As the micellar concentration reached to a critical
point, SDS forms supramolecular structures made up of half cylinders on the nanotube’s
surface (figure 2.14).The observed rings, helices, or double helices depends on the symmetry
and the diameter of the CNT [85]. Gul et al. [86] reported non-surfactant arbitrated
immobilization of protein and DNA on the carbon nanotube. The water repelling sections of
the proteins are essential for adsorption. Protein immobilization on nanotubes is a
nucleophilic reaction which involves the substitution of N-hydroxysuccinimide by an amine
(RNH2) group on the protein. The mechanism of above reaction shows the interaction of
movableπ-bonds on the CNTs wall because of sp2 hybridization with π-bonds of polymer
Page | 23
molecules [87]. The wrapping mechanism attributes the interactions between the polymer and
the CNTs which results in improving the physical association of polymers with CNT, and
further, it forms the supramolecular complexes [88]. The dispersion of CNTs in conjugated
polymer,i.e., poly(m-phenylenevinylene-co-2,5-dioctyloxy-p-phenylenevinylene) (PmPV)
which forms the wrapping of copolymer around the nanotubes [89, 90]. The prepared hybrid
composites have better electrical properties than that of individual components. The
dispersion of CNT in different solvents is also possible using non-wrapping methods [91].
Figure 2.14: The possible organization of the sodium dodecyl sulfate molecules on the surface of a
CNT. (a) The SDS molecules could be adsorbed perpendicular to the surface of the nanotube, forming
a monolayer,(b) oriented parallel to the tube axis and (c). Half-cylinders oriented perpendicular to the
tube axis. [85]
With this approach, dispersion of CNT can improve in a solvent with stabilized copolymers
of various structures. The adsorption of block copolymers on nanotubes by non-wrapping
mechanism leads to the formation of good dispersions of CNT. The non-covalent attachment
has some shortcoming, i.e., the forces between the wrapping molecule and the filler might be
weak results in a hybrid composite with the efficiency of the load transfer near to the ground.
2.4 Methods of Preparation of CNT/PANI Nanocomposites
The excellent properties of CNTs utilized in real-world applications with the
development of hybrid CNT/polymer nanocomposites. At present, PMCs with CNTs as a
filler used in various areas of applications like infrastructure sectors, energy, aerospace,
defense, sporting goods, transportation and automotive. The potential of PMCs in these
applications is due to their flexibility, light weight, design, high strength and high durability.

Page | 24
Among various polymer composites, hybrid CNT/PANI nanocomposites extensively used as
electromagnetic interference (EMI) shielding and electrostatic discharge (ESD) material
because of its high electrical conductivity. The higher level of conductivity was due to the
creation of conducting path in the matrix material. The effective use of CNTs as a filler for
producing nanocomposites depends on the homogeneous dispersion of nanotubes in the
PANI matrix without finishing their integrity. Moreover, the mechanical properties of hybrid
nanocomposites can also be improved with excellent interfacial bonding which helps in
transferring the significant load across the CNT–matrix interface. This process is highly
acceptable for getting good dispersion of nanotubes without affecting its property. The
various method used for the synthesis of CNT/PANI nanocomposites are as follows:
2.4.1 Electrophoretic Method
In recent years, electrophoretic method received much attention toward itself, for
developing dense and uniform films of conducting polymer. Some research papers published
on the incorporation of CNT into a PANI matrix. Dhand et al. used electrophoretic route [92,
93] to prepare carboxylic-functionalized MWCNTs/PANI composite film [93] on indium tin
oxide (ITO) coated the glass.
Figure 2.15: SEM (i and ii) and TEM (iii and iv) micrograph of c-MWCNTs and c-MWCNTs/ES
composite. [92]

Page | 25
The thickness of the homogeneous composites film was about 200nm and having excellent
electrochemical and charge transfer properties. SEM and TEM studies investigate the
wrapping of carboxylic-functionalized MWCNTs (c-MWCNTs) with ES form of PANI. The
surface morphology of carboxylic-functionalized MWCNTs and its composite with ES form
of PANI after the film fabrication on the ITO plates depicted in figure (2.15i and ii).
Furthermore, TEM images show the sharp and well-defined edges in MWCNTs (figure
2.15iii), however, the unclear ends of MWCNTs are noticeable in MWCNTs doped PANI
nanocomposite (figure 2.15iv) along with ES wrapping onto MWCNTs. The limitation of the
electrophoretic method compared to the other colloidal processes is that aquatic media cannot
use during processing. The reason is that as the voltage applied to the liquid medium, the
gasses like hydrogen and oxygen evolved at the electrodes. The evolution of these gasses has
the negative effect on the deposits formed.
2.4.2 In-Situ Polymerization
In this polymerization method, a solution of dispersed CNT added in the aniline
monomer. The desired solution of an oxidizing agent like APS, K2Cr2O7, KMnO4, KIO3,
FeCl3, etc. is added dropwise to the mixture solution followed by polymerization. A higher
percentage of CNTs can easily disperse via this route, form a strong interaction with the
polymer matrixes. This method is useful for the preparation of composites with polymers that
cannot be processed by solution or melt mixing, e.g., insoluble and thermally unstable
polymers. Bachhav et al. [94] reported the synthesis of carboxylated multi-walled carbon
nanotubes (MWCNTs) doped PANI nanocomposites by in situ chemical oxidative
polymerization method using ammonium peroxodisulphate (APS) as an oxidant and HCl as a
dopant. The ultrasonication treatment is given for uniform dispersion of MWCNTs in PANI
matrix. Figure 2.16a depicts the combined ropes with the smooth surface of functionalized
MWCNTs with lengths up to few micrometer and diameter is about 10 nm. Granular
morphology of PANI with an average diameter of 100nm shown in figure 2.16b. This
method intentionally used for grafting of PANI on the surface of MWCNTs. Figure 2.16c
shows that with the addition of 4.0 wt.% MWCNTs in PANI matrix increased the diameter
up to the range of 100-150 nm. The thin layer of PANI was deposited on the surface of
MWCNTs with an average diameter of 15-20 nm at 8.0 wt% of MWCNTs figure 2.16d. The
electrical conductivity increased gradually up to 1 wt% MWCNTs content but sharply

Page | 26
increase beyond it. The electrical conductivity of pure PANI was 0.17 S/cm and increase
from 0.22 S/cm to 3.32 S/cm for 0.25 wt% and 8 wt%, respectively. Konyushenko et al. also
followed same method [95] for the development of MWCNTs doped PANI nanocomposites
with loading the filler up to 80 wt% (figure 2.17). They observed the uniform coating of
PANI on the surface of MWCNTs and found that the diameter of MWCNTs increased with
increasing the deposition of PANI. TEM images (figure 2.18) shows the clear view of
Figure 2.16: FE-SEM images of f-MWCNTs (a), PANI (b) and MWCNTs/PANI nanocomposites at
MWCNTs contents of 4 wt.% (c) and 8 wt.% (d) [94].
MWCNTs (left), and bilayer structure of MWCNTs coated PANI nanocomposites (right).
The visualization of internal cavity makes it sure that the coating of PANI takes place only at
the outer surface of the CNT. In situ polymerization of aniline monomer inside the CNT
hindered by the limited access of reactants to the interior of the CNT. It was found that
resulting composites have the electrical conductivity of 7.7 S cm-1 for 70 wt. % CNT which
was higher than that of pure PANI,i.e., 0.9 S cm-1. Choudhury et al. [96] stated the average
electrical conductivity of about 1.4 x 10⁻¹ S/cm for f-MWCNTs/PANI nanocomposites loaded
with filler concentration greater than1wt %. Philip et al. [97] also reported the MWCNTs
coated PANI nanocomposites via in-situ polymerization method. For good dispersion of
MWCNTs in PANI matrix, they functionalized the MWCNTs with p-phenylenediamine,
which gave phenylamine functional groups on the surface. The composites of PANI prepared
with a-MWCNTs (C1), and oxidized MWCNTs (C2) disclosed the tubular morphology with

Page | 27
core-shell structure in which C1 composite also display the granular morphology. The
electrical conductivity of PANI, C1 and C2 were 8.2 x 10⁻³ S/cm, 6.5 x 10⁻² S/cm and 2 x 10-
2 S/cm, respectively. PANI -coated and doped sulfonated multiwalled carbon nanotube (i.e.,
PANI-c-MWNT-(OSO3H)n) and (PANI-d-MWNT-(OSO3H)n) nanocomposites, respectively
were prepared by in situ polymerization method [98].
Figure 2.17: Original MWCNTs (a) and those coated with 50 wt% (b), 70 wt% (c) and 80 wt%
PANI (d). [95]
Figure 2.18: Original MWCNTs (left) and MWCNTs (50 wt%) after coating (right) with polyaniline
at the same magnification. [95]
Figure 2.19a shows the diameter of the pure nanotube in the range of 10-100nm. The
hollow core of nanotube and its crystalline nature can see in figure 2.19b and figure 2.19c,
respectively. As aniline to MWCNTs-(OSO3H)n ratio was ≤ 1 (for example 1:2 or 1:1), the

Page | 28
prepared composites show the coating of PANI on the surface of MWCNTs-(OSO3H)n (i.e.,
PANI-c-MWCNTs-(OSO3H)n) (see figure 2.19d and 2.19e). The diffraction rings and spot
in figure 2.19f reveals the characteristic of PANI “shell” and MWCNTs- (OSO3H)n “core,”
respectively. The ratio of aniline to MWCNTs-(OSO3H)n ≥ 2 (for example 2:1, 4:1 and 8:1)
leads to the preparation of the composites via self-assembly process along with in-situ
polymerization (figure 2.19g and 2.19h). It explained that the surface of PANI-d-MWNT-
(OSO3H)n was very rough compared to the PANI-c-MWNT-(OSO3H)n nanocomposites.
Figure 2.19: SEM images (a,d,g), TEM images (b,e,h) and electron diffraction patterns (c,f,i) of: a-c)
MWNT-(OSO3H)n; d-f) PANI-c-MWNT-(OSO3H)n; g-i) PANI-d- MWNT-(OSO3H)n nanotubes.
[98]
The electron diffraction pattern of PANI-d-MWNT-(OSO3H)n composites (figure 2.19i)
displays the amorphous nature of composites. The electrical conductivity of PANI-c-MWNT-
(OSO3H)n and PANI-d-MWNT-(OSO3H)n nanocomposites reported as 2.2 x 10⁻² S/cm and
1.4 x 10⁻² S/cm, respectively.
2.4.3 Interfacial Polymerization
Interfacial polymerization usually implemented in an organic/aqueous biphasic
system with aniline monomer dissolved in an organic solvent followed by the addition of

Page | 29
oxidizing agent [99]. Usually, APS oxidant, dissolved in an aqueous acid solution [100, 101].
Interfacial polymerization is of two types,i.e., static (without stirring) and dynamic (with
stirring). The preparation of PANI nanofibers highly desired through interfacial
polymerization method. The reason behind that is reduced local dielectric constant of water at
the organic/water interface would support the formation of phenazine nucleates at the
interface. Huang et al. [102] also explained the reason for the development of fibers through
interfacial polymerization. They observed organic phase eliminates an amount of aniline
monomer from aqueous phase which promotes the stacking of nucleates over their random
agglomeration. Jeon et al. [103] prepared the dispersion of carbon nanotube in the organic
Figure 2.20: Photographs of reaction vials as a function of reaction time, the product in aqueous
phase consists of PANI/PANI-g-MWCNTs mixture. The black residue at the bottom of organic phase
identified as the unreacted NH2-MWCNTs (white arrow). [103]
Figure 2.21: FEG-SEM images of the samples PANI (a), PANI + 0.25% CNT (b), PANI + 1% CNT
(c), and PANI + 4% CNT (d). Scale bar is 1 μm. [104]
phase through static interfacial polymerization. By way of static polymerization taking place
at the interface, PANI, and PANI-g-MWCNTs diffuse into the upper aqueous phase. Figure

Page | 30
2.20 shows static interfacial polymerization of aniline with respect to time. Salvatierra et al.
[105] deposited a film of CNT-doped PANI nanocomposite over the glass substrate by
interfacial polymerization method and studied the effect of CNT on the structure and
conformation of polyaniline. They explained that carbon nanotubes bring vital modifications
in the electronic structure of the polymer, resulting in a more polaronic organization. Mariano
et al. also reported self- assembled films of CNT/PANI nanocomposites via using interfacial
polymerization method [104]. They observed the granular morphology of PANI displays in
figure 2.21a. The morphology of the films shows that at lower CNT (0.25 wt.%) content only
rare tubes are detected (figure 2.21b). These tubes attractively distributed in the granular
polymeric structure. PANI with 1 wt% CNT shows more discrete structures, where few tubes
capped with a PANI layer (figure 2.21c). The CNT/PANI (4 wt. %) nanocomposite present
large and plane structure with several CNTs (figure 2.21d). Consequently, the electrical
properties of CNT-doped PANI films must depend on the size of PANI layer separating each
CNT and the contact of filler with PANI matrix by the quantity of CNT. The electrical
conductivity of these composites at low CNT concentration was the order of 10-7 S/cm. The
slight change in electrical conductivity observed from 0.0 wt% to 0.25 wt% of CNT. The
electrical conductivity of 4 wt% CNT with PANI matrix was approximately 0.06 S/cm.
2.4.4 Solution Mixing
This approach is very simple and efficient for the preparation of hybrid CNT/PANI
nanocomposites. It involves the dispersion or dissolution of the nanotube with PANIeither in
a same or different solvent [106]. The product obtained after the mixing of fillers and
polymeric solution followed by drying treatment. Stirring is not sufficient condition for
mixing of CNT in PANI matrix; a high power ultrasonic waves can also be used to
emulsifying, crushing, and activating the particles. With this process, the aggregates and
entanglement of CNTs effectively can broken which results in the easy dispersion. It has been
reported the good dispersion of CNTs in polycarbonate matrix with ultrasonication at a
frequency of 20 kHz for 10 minutes [107]. Ultrasonic waves and mechanical stirring play
very vital role in the development of composites with an identical particle size. Li et al. [108]
prepared the PANI nanofibers using irradiated ultrasonic polymerization with varying
reaction temperature, ultrasonic power, and frequency of waves. The PANI prepared at
higher frequencies showed higher purity as well as smooth surfaces than those at lower
frequencies. The diameter and length of obtained PANI nanofibers were about 80 nm and 700

Page | 31
nm, respectively with ultrasonic power 250 W and frequency 50 kHz. Husinet al. [109] also
reveals the formation of PANI nanofibers with ultrasonic polymerizations at a different
frequency. They prepared the nanofibers at the frequency of 5-20 kHz and found the diameter
of ~25 nm. Gajendran et al. [110] adopted solution mixing method for the preparation of
CNT-doped polyaniline nanocomposites. The results obtained by mixing method reveals the
favorable interaction between PANI and CNTs. The amount of filler used in PANI matrix
controls their mechanical, conductive, and thermal properties. CNT/PANI composite
synthesized via direct mixing (DM) mixing method and in situ polymerization also reported
in the literature [111]. After that, three types of nanofibers for PANI, CNT/PANI, and DM-
CNT/PANI fabricated via an electrospinning process. Authors compared the morphological
feature of PANI, CNT/PANI, and DM-CNT/PANI composite. The fibers of DM-CNT (40 wt.
%)/ PANI nanocomposites have a diameter about 50 nm which is less than that of PANI and
CNT(40 wt%)/PANI nanocomposites fibers,i.e., 50-200 nm (figure 2.22).The clear view of
three types of nanofibers also shown with the TEM images (inset of figure 2.22).PANI
Figure 2.22: SEM images of the fiber mats of PANI (a), DM-CNT (40 wt.%) /PANI (b), and CNT(40
wt%)/PANI (c). The inserts are the TEM images of a single fiber. Arrows denote the alignment
direction of fibers. [111]
particles segregated in DM-CNT/PANI composites, however in the case of CNT/PANI
composites nanotubes were homogeneously covered by PANI and aligned in the direction
parallel to the nanofibers axis. The electrical conductivity of CNT (40 wt %)/PANI
nanocomposites fibers was about 17.1 S/cm which was ten times greater than the electrical
conductivity of pure PANI. The direct value of electrical conductivity not reported for DM-
CNT/PANI nanocomposite [111]
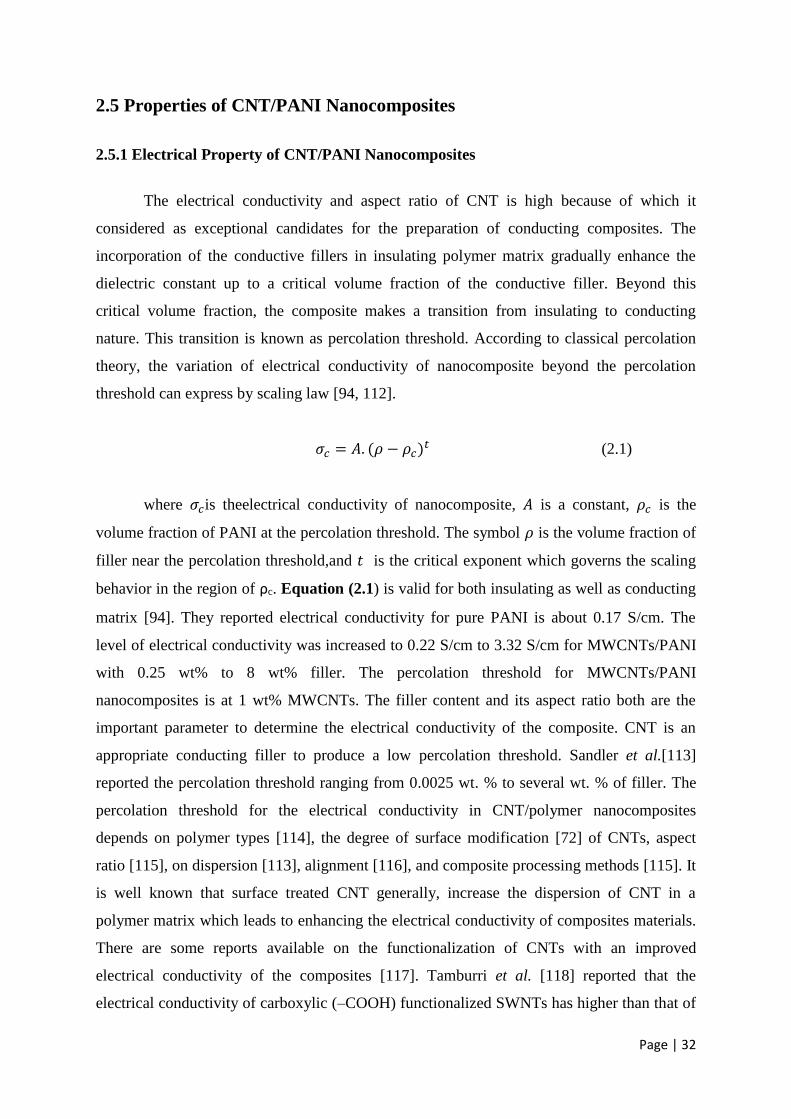
Page | 32
2.5 Properties of CNT/PANI Nanocomposites
2.5.1 Electrical Property of CNT/PANI Nanocomposites
The electrical conductivity and aspect ratio of CNT is high because of which it
considered as exceptional candidates for the preparation of conducting composites. The
incorporation of the conductive fillers in insulating polymer matrix gradually enhance the
dielectric constant up to a critical volume fraction of the conductive filler. Beyond this
critical volume fraction, the composite makes a transition from insulating to conducting
nature. This transition is known as percolation threshold. According to classical percolation
theory, the variation of electrical conductivity of nanocomposite beyond the percolation
threshold can express by scaling law [94, 112].
𝜎𝑐 = 𝐴. (𝜌 − 𝜌𝑐)𝑡 (2.1)
where 𝜎𝑐is theelectrical conductivity of nanocomposite, 𝐴 is a constant, 𝜌𝑐 is the
volume fraction of PANI at the percolation threshold. The symbol 𝜌 is the volume fraction of
filler near the percolation threshold,and 𝑡 is the critical exponent which governs the scaling
behavior in the region of ρc. Equation (2.1) is valid for both insulating as well as conducting
matrix [94]. They reported electrical conductivity for pure PANI is about 0.17 S/cm. The
level of electrical conductivity was increased to 0.22 S/cm to 3.32 S/cm for MWCNTs/PANI
with 0.25 wt% to 8 wt% filler. The percolation threshold for MWCNTs/PANI
nanocomposites is at 1 wt% MWCNTs. The filler content and its aspect ratio both are the
important parameter to determine the electrical conductivity of the composite. CNT is an
appropriate conducting filler to produce a low percolation threshold. Sandler et al.[113]
reported the percolation threshold ranging from 0.0025 wt. % to several wt. % of filler. The
percolation threshold for the electrical conductivity in CNT/polymer nanocomposites
depends on polymer types [114], the degree of surface modification [72] of CNTs, aspect
ratio [115], on dispersion [113], alignment [116], and composite processing methods [115]. It
is well known that surface treated CNT generally, increase the dispersion of CNT in a
polymer matrix which leads to enhancing the electrical conductivity of composites materials.
There are some reports available on the functionalization of CNTs with an improved
electrical conductivity of the composites [117]. Tamburri et al. [118] reported that the
electrical conductivity of carboxylic (–COOH) functionalized SWNTs has higher than that of

Page | 33
untreated SWNTs. Aspect ratio plays a very important role in the percolation threshold of the
polymer nanocomposites. Aspect ratio is defined as the ratio of the longest dimension to
shortest dimension. Aspect ratio for planer fillers like graphene and graphite flakes is the
ratio of lateral dimension to sheet thickness, whereas for rod-like nanostructures (such as
carbon nanotubes and nanowires) is the ratio of thelength to its diameter. Fillers with higher
aspect ratio percolate atlower concentration because of the formation of more efficient
network with fewer contacts required to form a spanning cluster. Literature shows the
electrical percolation threshold at 1wt.%, 0.1 wt.% and lower than 0.1 wt.% typical for
CNT/polymer composites [119]. The conventional fillers such as carbon black used in matrix
material found the percolation threshold between 3 and 15 wt. %. The range of percolation
threshold can increased to 60 wt. % for metallic powders filler [115]. The size of filler affects
the percolation threshold in the composites. In polypropylene-Cu composite small sizeCu
particles shows the percolation threshold at lower volume percent than that of larger size
filler [120]. Some researchers report the percolation threshold of MWCNTs filled polystyrene
nanocomposites from 2 wt. % high-aspect ratio CNT grown in vertically aligned films was
0.1 to 0.5 wt.%. It was five times lesser than that for low aspect ratio industrially developed
CNT-polymer nanocomposites; the achieved electrical conductivity with 2wt.% CNTs was
103 S/m [121]. The non-covalently functionalized SWCNT in PS matrix shows the
percolation threshold at 0.045 wt. % with a maximum electrical conductivity of 6.89 S/m at
7wt. % of CNT. The similar route was also used for the preparation of PC/SWCNT
nanocomposites and found that measured electrical conductivity increased to 4.81×10² S/m at
7 wt. % of nanotubes. The percolation threshold for this nanocomposites reached to 0.11 wt.
% of SWCNT fillers. Sarviet al. [122] reported PANI coated MWCNTs and uncoated
MWCNTs dispersed in the matrix of polystyrene. They observed the electrical percolation
threshold for PANI-coated MWCNTs and uncoated MWCNTs at 0.4 wt. % and 0.7 wt. %,
respectively. The lower percolation threshold value in PANI-coated MWCNTs was due to the
well dispersion of PANI-coated MWCNTs in a PS matrix. Many research group also studied
the effect of morphology on the percolation threshold. They found that fibrous shape is the
most favorable for achieving low percolation threshold [123, 124]. The shortcoming of
fibrous shape filler is only the narrow smearing region. It is the region in between the onset
and offset of percolation where electrical conductivity increases abruptly. George et al. [125]
reported higher dielectric constant of the composite in the broad smearing region. To achieve
the percolation value at lower filler concentration, the distribution of filler in the matrix
should be uniform throughout the composite. The non-uniform distribution or formation of
Page | 34
aggregates disturbs the formation of a 3D path for charge carrier which leads the
concentration of fillers toward higher sides [126].
2.5.2 Thermal Property of CNT/PANI Nanocomposites
Thermally stable polymer nanocomposites extensively used in automotive, aerospace
industries, electrical and electronics applications. The aerospace industries are a major
driving force for the advancement of new materials. Thermogravimetric analysis (TGA) is a
very prominent technique used to know the thermal stability of nanocomposites. Among
various composites, CNT-doped PANI nanocomposites because of thermal stability are
widely used applications mentioned above. In general, the thermal stability of MWCNTs in
the air is up to 650 °C and completely decompose beyond 750 °C. The first weight loss of
emeraldine salt form of PANI (without considering the moisture) is due to the removal of
dopant which converts emeraldine salt form of PANI to emeraldine base form. This step
occurs at the same temperature range in air and nitrogen which means it is independent in the
atmosphere [127]. Beyond this step, the major decomposition of PANI is taking place [128].
In an air atmosphere, PANI is completely decomposed at 700 C however, in a nitrogen
atmosphere, it converted into nitrogen-containing carbon [127]. With increasing the
concentration of CNT fillers in the PANI matrix, the thermal stability of nanocomposites
increased. The increase in thermal stability is due to the following reason.
a) The long conjugate π–π bond formed between PANI and MWCNTs
b) The existence of polymeric-filler interaction along with filler-filler interaction.
The degradation of emeraldine salt form of PANI with CNT nanocomposite in air
atmosphere is complex because the loosed dopant in this atmosphere moderately overlaps
with the degradation of the PANI backbone. To avoid the overlapping of dopant and getting a
simplified interpretation of TGA data emeraldine salt is de-doped to emeraldine base before
TGA measurement [129]. The volume contraction during the conversion of emeraldine salt
into emeraldine base breaks the contact between MWCNTs fillers and PANI matrix. This
contraction leads to lower the thermal stability of nanocomposites at a higher temperature. It
also reported that volume contraction could be avoided by thermal deprotonation of thermally
aged MWCNTs/EB nanocomposites at high temperature [130].

Page | 35
2.6 Applications
The conducting nature of PANI makes it suitable for many applications in
multidisciplinary areas like conductive paint, conductive ink, conductive adhesive and
electrostatic discharge (ESD) materials [131, 132]. To make the conductive paint on an
industrial scale, DBSA-doped PANI commonly dispersed in the insulating poly(methyl
methacrylate) (PMMA) matrix in an organic solvent [133]. The desired pattern can be
obtained with inkjet cartridge loaded with the suspension or solution of conducting polymer.
The conductive adhesive prepared with the dispersion of PANI as a filler in epoxy resin with
different concentration as reported by Hino et al. [132]. The addition of doped PANI (10wt
%) in the matrix of epoxy resin generates the electrical conductivity of the level of 10-1 S/cm.
Wet spinning method is used to prepare the conducting textile fibers of high molecular
weight PANI. The conducting fillers in insulating matrix avoid static charge generation for
electrostatic discharge protection application [134]. Carbon nanotube doped PANI
nanocomposites have great attention in numerous applications because of facile synthesis,
easy processability. Another reason is the combination of various properties of CNT filler and
matrix PANI which explains the synergistic effects in prepared nanocomposites. The
properties of filler and PANI includes large surface area, high mechanical strength, high
conductivity and exceptional case of doping by oxidation/ protonation, electrical conductivity
respectively. The various application where CNT/PANI nanocomposites extensively used are
as follows:
2.6.1 Actuators
Most advanced application of conducting polymers in the scientific community
include actuators [135]. Actuators convert electrical energy into mechanical energy. The
conducting polymer actuators are fully developed and demonstrate a solid-state actuating
device to accelerate the commercial application. The bending operation of an actuator is
comprising of the membrane and gold. Carbon nanotubes extensively used in actuators [136].
The excellent properties of CNTs like electronic, electrochemical and mechanical in PANI
nanofibers leads to improve the electromechanical actuation [137]. The PANI and CNT have
high actuation strain and high modulus, respectively, because of which nanocomposites
display higher actuation strain in the range of 0.2–0.5% [138]. With the same objective, Yun
et al. [139] reported the MWCNTs doped PANI nanocomposites coating for electroactive

Page | 36
paper actuators. The paper actuators were prepared using cellulose sheet coated with a thin
electrode on its both sides. The electric field was applied to these electrodes, generating a
bending displacement in a paper. The PANI and co-spun fibers of a chitosan hydrogel reveal
electrochemical actuation responses. There are various advantages of electro-active actuator
materials, for example, biodegradability, low price, dryness, low power consumption,
actuation voltage and lightweight.
2.6.2 Sensors
A sensor is a device that detects and responds to some input (light, heat, motion,
moisture, pressure, etc.) from the physical environment and converts it into a signal which
can be read by an observer or by an instrument. Conducting polymers broadly used in the
field of sensors, especially in the biological and chemical field [106]. The reason of wide
interest is the interactions of these polymers with various analytes which may affect the redox
and doping states of conducting polymers. The influenced state of these polymers leads to a
change electrochemical potential, resistance, or current [140]. It is believed that conducting
polymers are a good candidate for biological and chemical sensing, but their poor selectivity
and low sensitivity are its short-coming and must be improved. The capability of PANI to
change the color and electrical conductivity dopant make it useful in the field of the detector,
sensor, and indicator [141, 142]. The limitations mentioned above can be overcome using
various fillers in PANI matrices like metal and metal oxide particles, biological materials,
metal salts, and carbon nanotubes. The reason for using these fillers is to alter the affinity of
composite/nanocomposites, raise the chain mobility of PANI. The gas sensor improves its
sensing characteristics in the presence of carbon nanotube with PANI. The addition of CNT
in PANI increases its sensitivity. However, recovery times reduced. The network of the
carbon nanotube is used as conductive and flexible electrodes to deposit the polyaniline via
electrochemical method [143]. Sensors fabricated on Si surfaces with PANI/DNA composite
nanowires established for the detection of HCl and NH3. The outcomes revealed that the
response time of prepared PANI/DNA composite nanowires to HCl and NH3 was about 1s
which was 100 times faster as compared to pure PANI nanofibers. The incorporation of metal
oxide nanoparticle into PANI nanostructure spread their use in other gasses. Chemical
polymerization route was also used to prepare the In2O3/PANI composite nanofibers for the
detection of NO2, CO, and H2 gasses. The sensors based on In2O3 nanomaterial have a huge
response to gasses mentioned above [144]. However, the operation temperature was
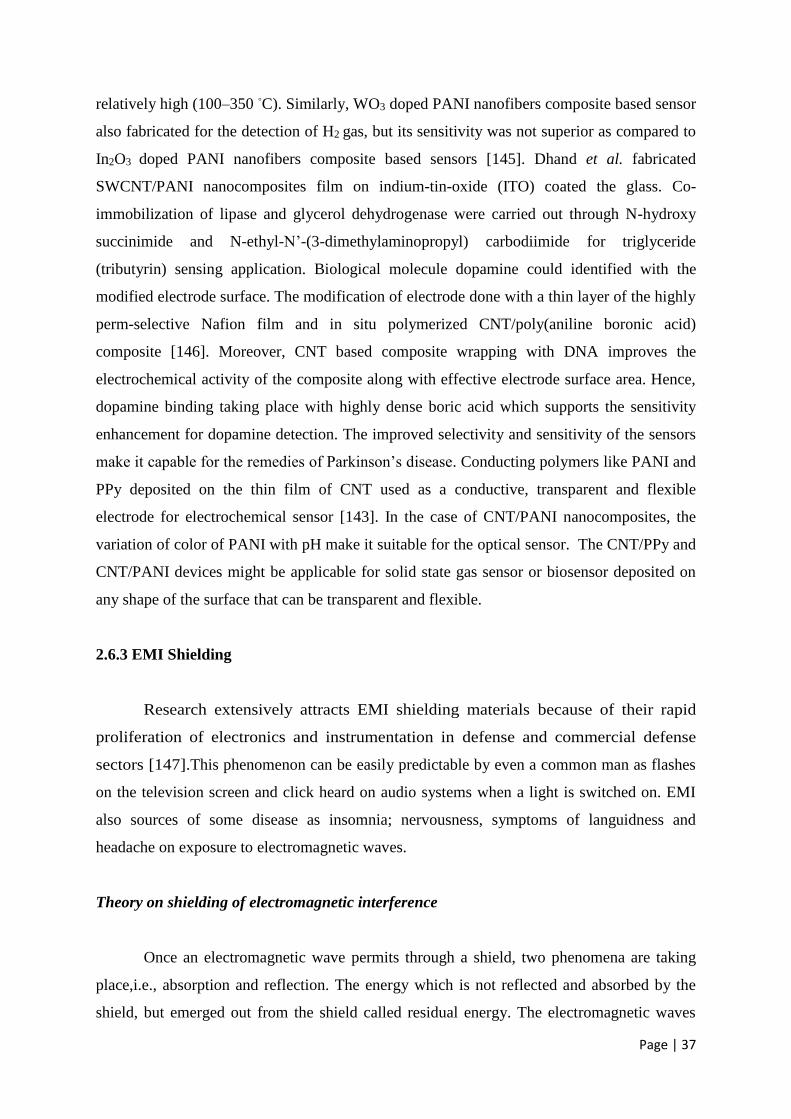
Page | 37
relatively high (100–350 C). Similarly, WO3 doped PANI nanofibers composite based sensor
also fabricated for the detection of H2 gas, but its sensitivity was not superior as compared to
In2O3 doped PANI nanofibers composite based sensors [145]. Dhand et al. fabricated
SWCNT/PANI nanocomposites film on indium-tin-oxide (ITO) coated the glass. Co-
immobilization of lipase and glycerol dehydrogenase were carried out through N-hydroxy
succinimide and N-ethyl-N’-(3-dimethylaminopropyl) carbodiimide for triglyceride
(tributyrin) sensing application. Biological molecule dopamine could identified with the
modified electrode surface. The modification of electrode done with a thin layer of the highly
perm-selective Nafion film and in situ polymerized CNT/poly(aniline boronic acid)
composite [146]. Moreover, CNT based composite wrapping with DNA improves the
electrochemical activity of the composite along with effective electrode surface area. Hence,
dopamine binding taking place with highly dense boric acid which supports the sensitivity
enhancement for dopamine detection. The improved selectivity and sensitivity of the sensors
make it capable for the remedies of Parkinson’s disease. Conducting polymers like PANI and
PPy deposited on the thin film of CNT used as a conductive, transparent and flexible
electrode for electrochemical sensor [143]. In the case of CNT/PANI nanocomposites, the
variation of color of PANI with pH make it suitable for the optical sensor. The CNT/PPy and
CNT/PANI devices might be applicable for solid state gas sensor or biosensor deposited on
any shape of the surface that can be transparent and flexible.
2.6.3 EMI Shielding
Research extensively attracts EMI shielding materials because of their rapid
proliferation of electronics and instrumentation in defense and commercial defense
sectors [147].This phenomenon can be easily predictable by even a common man as flashes
on the television screen and click heard on audio systems when a light is switched on. EMI
also sources of some disease as insomnia; nervousness, symptoms of languidness and
headache on exposure to electromagnetic waves.
Theory on shielding of electromagnetic interference
Once an electromagnetic wave permits through a shield, two phenomena are taking
place,i.e., absorption and reflection. The energy which is not reflected and absorbed by the
shield, but emerged out from the shield called residual energy. The electromagnetic waves

Page | 38
comprise of two essential part one is a magnetic field (H), and other is an electric field (E)
(figure 2.23). The magnetic and electric fields are mutually perpendicular to each other, and
the direction of wave propagation is at right angles to the plane comprising the two
components. Wave impedance is the ratio of electric field to magnetic field, the intrinsic
impedance of free space is 377 ohm. The near field shielding and far field shielding are the
two regions involved in EMI shielding. The far field shielding is that region where the
distance between the radiation source and the shield is larger than λ/2π (where λ is the
wavelength of the source). Electromagnetic plane wave theory applied for EMI shielding is in
far field shielding region [148]. However, the region when the distance is less than λ/2π
called near field shielding and the concept centered on the involvement of electric and
magnetic dipoles used for EMI shielding [149]. Shielding effectiveness (SE) is the ratio of
the field before and after attenuation of the electric and magnetic field and can be stated as
(equation 2.2 and 2.3).
𝑆𝐸 = 20 𝑙𝑜𝑔 (𝐸𝐼 𝐸𝑇⁄ ) (2.2)
𝑆𝐸 = 20 𝑙𝑜𝑔 (𝐻𝐼 𝐻𝑇⁄ ) (2.3)
Where 𝐸 and 𝐻 refer as electric and magnetic fields, respectively. The subscripts 𝐼
and 𝑇 denote to incident and transmitted waves, respectively. 𝐸measured in volts/m and 𝐻 in
amps/m. There are three primary mechanisms contributing to 𝑆𝐸. Part of electromagnetic
radiation absorbed within the shield material (A), part of the incident radiation reflected from
the front surface of the shield (R), and part is reflected from the rear surface to the front (B),
as exposed in figure 2.24. Hence, shielding effectiveness is the sum of all the three parts
(equation 2.4). In last four decades, conducting polymers, PANI and PPy received great
𝑆𝐸 = 𝐴 + 𝑅 + 𝐵 (2.4)
intention toward EMI shielding because of their corrosion resistance and light weight. The
usual difficulties with intrinsically conductive polymers (ICP) are the lack of ability to
process into useful articles. It is mainly true for PANI, which is known for its redox behavior,
environmental stability and has adequate electronic conductivity. The good electrical
conductivity of the material is required to achieve the excellent EMI shielding
efficiency. Mostly, Metals used for EMI shielding applications, but due to their

Page | 39
heavyweight, natural corrosion, and uneconomic processing, it gets replaced by
polymeric materials. The electrical conductivity required for electrostatic dissipating
are approximately 10-5-10-9 S/cm and should be greater than 10-4 S/cm for
electromagnetic shielding applications [150]. The SE depends upon the thickness of
conducting coating, type, level of doping and time interval given for each measurement in the
point-by-point method. Lee et al. [151] stated the EMI shielding efficiency of the mixtures of
PANI and conducting fillers such as graphite, carbon black and silver in the frequency range
from 10 MHz to 1 GHz. They reported the shielding efficiency for graphite/PANI and
Silver/PANI are 27 and 46 dB respectively, however, PANI without mixing of filler was
merely 17dB. SE increases with increasing direct current electrical conductivity. They also
saying that SE in contrast to
Figure 2.23: Electromagnetic radiation vector
Figure 2.24: Attenuation of an electromagnetic wave by a shielding material

Page | 40
electromagnetic radiation increases through chemical doping and mixing with the addition of
conducting filler. Koul et al.[152] used organic dopant like dodecyl benzene sulfonate and p-
toluene sulfonate to prepare the PANI blend with acrylonitrile-butadiene-styrene (ABS) and
measured their EMI/ESD response at 101 GHz. It was found that loading of PANI in
(PAn/ABS: 10:90) composite illustrate SE of 11dB. 5% loading of PANI in ABS provides an
SE of the order of 6dB, this order of SE is not sufficient to control the interference in the
material having a thickness in the mm range but can use for the dissipation of static charge.
Saini et al. studied the microwave absorption properties of PANI/CNT nanocomposite
prepared via in situ polymerization [153]. The synergistic effect of CNT in PANI matrix
shows that the conductivity of CNT/PANI nanocomposites was higher compared to neat
PANI. These nanocomposites can apply for EMI shielding in the Ku-band,i.e., 12.4–18.0
GHz with the shielding effectiveness of −27.5–39.2 dB. Makeiff et al. [154] reported the
composite of PANI-pTsA (para-toluene sulfonic acid)-coated MWCNTs and PANI-pTsA or
MWNTs with an insulating polymer. They measured the microwave absorption (at X-band
frequencies (8–12 GHz) of these composites and described that composites prepared with the
mechanical mixing of separate synthetic PANI-pTsA and non-coated MWNT are good
absorbers, having stronger absorption as compared to the composite of PANI-pTsA or
MWNTs. Han et al. [155] reported the estimated EMI SE for CNT-doped polycarbonate (PC)
in the range of 1.54 – 14.26 dB. They calculated the EMI SE both experimentally and
theoretically and compared the data. Based on the EMI shielding theory (far-field shielding),
it is observed that EMI SE increases with increasing the electrical conductivity (σ) of
shielding material (see equation2.5). The electrical conductivity obtained for these
composites were in the order of 2.06 x 10⁻⁴ S/cm.
𝐸𝑀𝐼 𝑆𝐸 = 20 𝑙𝑜𝑔 [1 + (1 2⁄ )𝜎. 𝐿. 𝑍𝑜] (2.5)
where 𝜎 is the conductivity of nanocomposite pellets, 𝐿 is the thickness of the pellets
and 𝑍𝑜is the free space impedance (constant: 377 S-1). Ghasemi et al.[156] also reported
the polystyrene/polyaniline (PS/PANI) composites with EMI SE up to 8dB.
Aggregates of PANI used for the preparation of composite showed the value of
electrical conductivity about 3.4 × 10⁻² S/cm.

Page | 41
2.6.4 Electronic Nanodevices
The versatile properties of conducting polymers like electrical conductivity,
mechanical flexibility, and low-cost availability widely attracted for the fabrication of
electronics devices. Among one dimensional, two dimensional and three-dimensional
structures of conducting polymers one-dimensional nanostructured (like nanofibers,
nanorods, nanotubes, and nanowires) are the excellent candidates for nanoelectronic devices.
The use of various fillers like metals, carbon nanomaterials, semiconductors and even
insulating polymers in conducting polymers matrix facilitate the formation of the one-
dimensional nanocomposite. It believed that one-dimensional nanocomposite has good
electrical conductivity than their 2D/3D counterparts or induce efficient electron transfer. The
availability of free charge carriers makes them suitable for various electronic devices like
transistors, memory, light emitting diodes, and photovoltaic devices [157-159]. Gold-doped-
PANI composites extremely used by some researchers for the fabrication of memory devices
[160].
2.6.5 Fuel Cell
In the recent decade, the energy conversion and storage attract the intention scientific
society toward itself. Fuel cells are the most promising applications for electric vehicles; it
converts the chemical energy of a fuel directly into electricity by electrochemical reactions.
The advantages of fuel cell-like environment friendliness, fuel portability, high energy
conversion efficiency and direct methanol fuel cells (DMFCs) has a great impact in the area
of energy applications [161]. In the current scenario, carbon nanofibers and carbon nanotubes
are the decent candidate for Pt nanoparticle filling for the reason of their large surface area
and superior electrical conductivity. The 1D nanostructure of conducting polymer make it a
more supportive for electrocatalyst [66, 162, 163]. The catalytic activity CNT/PANI
nanocomposite is higher than that of pure PANI for formaldehyde [164], methanol [165], and
formic acid [166]. Manish et al.[167] reported MWCNTs-coated-PANI nanocomposite which
altered glassy carbon electrode for oxygen reduction and improvement in the amperometric
current. Researchers put their efforts on the cathode modification and the optimization of
bacterial inoculums to increase the power output of microbial fuel cells [168]. CNT filled
PANI nanocomposites broadly used as an anode material meant for high power microbial
fuel cells [169, 170]. The reason for using CNT is that it has high surface area and electrical
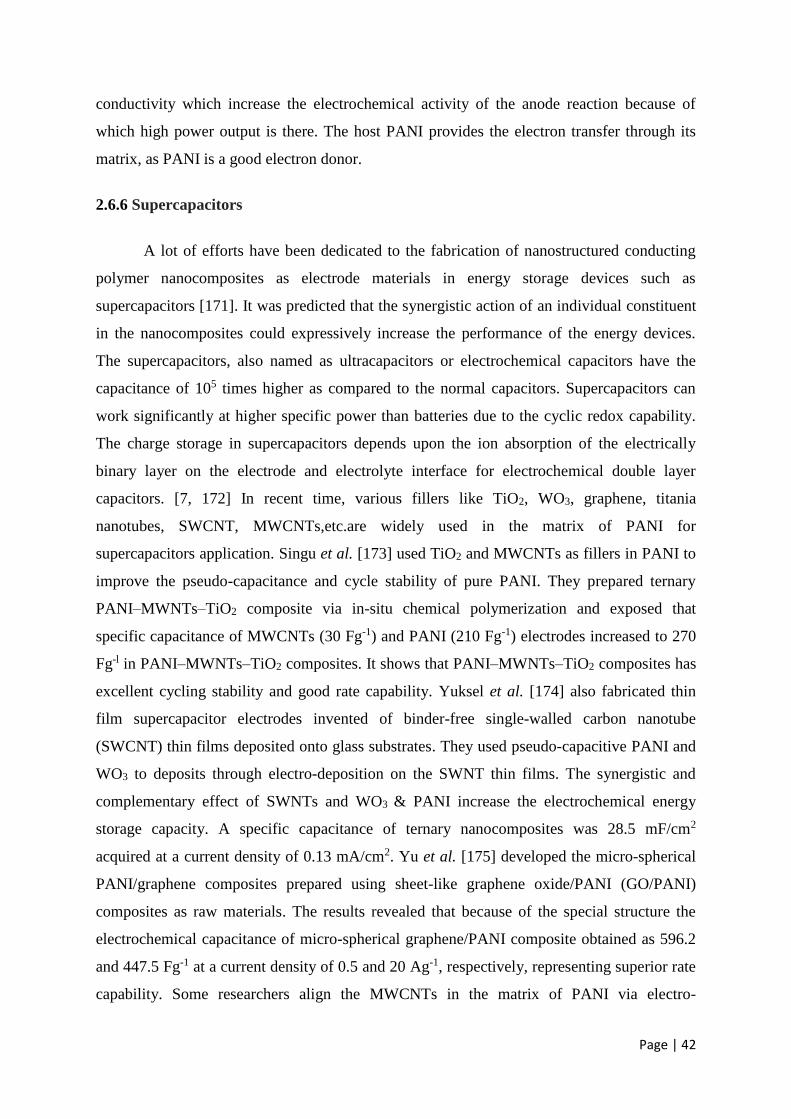
Page | 42
conductivity which increase the electrochemical activity of the anode reaction because of
which high power output is there. The host PANI provides the electron transfer through its
matrix, as PANI is a good electron donor.
2.6.6 Supercapacitors
A lot of efforts have been dedicated to the fabrication of nanostructured conducting
polymer nanocomposites as electrode materials in energy storage devices such as
supercapacitors [171]. It was predicted that the synergistic action of an individual constituent
in the nanocomposites could expressively increase the performance of the energy devices.
The supercapacitors, also named as ultracapacitors or electrochemical capacitors have the
capacitance of 105 times higher as compared to the normal capacitors. Supercapacitors can
work significantly at higher specific power than batteries due to the cyclic redox capability.
The charge storage in supercapacitors depends upon the ion absorption of the electrically
binary layer on the electrode and electrolyte interface for electrochemical double layer
capacitors. [7, 172] In recent time, various fillers like TiO2, WO3, graphene, titania
nanotubes, SWCNT, MWCNTs,etc.are widely used in the matrix of PANI for
supercapacitors application. Singu et al. [173] used TiO2 and MWCNTs as fillers in PANI to
improve the pseudo-capacitance and cycle stability of pure PANI. They prepared ternary
PANI–MWNTs–TiO2 composite via in-situ chemical polymerization and exposed that
specific capacitance of MWCNTs (30 Fg-1) and PANI (210 Fg-1) electrodes increased to 270
Fg-l in PANI–MWNTs–TiO2 composites. It shows that PANI–MWNTs–TiO2 composites has
excellent cycling stability and good rate capability. Yuksel et al. [174] also fabricated thin
film supercapacitor electrodes invented of binder-free single-walled carbon nanotube
(SWCNT) thin films deposited onto glass substrates. They used pseudo-capacitive PANI and
WO3 to deposits through electro-deposition on the SWNT thin films. The synergistic and
complementary effect of SWNTs and WO3 & PANI increase the electrochemical energy
storage capacity. A specific capacitance of ternary nanocomposites was 28.5 mF/cm2
acquired at a current density of 0.13 mA/cm2. Yu et al. [175] developed the micro-spherical
PANI/graphene composites prepared using sheet-like graphene oxide/PANI (GO/PANI)
composites as raw materials. The results revealed that because of the special structure the
electrochemical capacitance of micro-spherical graphene/PANI composite obtained as 596.2
and 447.5 Fg-1 at a current density of 0.5 and 20 Ag-1, respectively, representing superior rate
capability. Some researchers align the MWCNTs in the matrix of PANI via electro-

Page | 43
deposition process [176]. The specific capacitance of these electrically conductive composite
films obtained about 233 F/g at a current density of 1 A/g. It also reported that the cyclic
stability of these unique supercapacitors were much high.

Page | 44
CHAPTER THREE
Methodology
In this chapter, the information about the materials and purchased along with
methods that adopted for the synthesis of PANIs (with and without solvent),
functionalization of MWCNTs and preparation of hybrid MWCNTs/PANI
nanocomposites given in details. The methodology adopted for the synthesis of self-
standing film of PANI also explained in detail. Details about the characterization
techniques like density kit, XRD, FT-IR, Raman spectroscopy, I-V measurement,
SEM, TEM, TGA and UV-Vis spectroscopy used for reported materials also given
in this chapter.
Page | 45
CHAPTER THREE Methodology
========================================
Chemical oxidative polymerization and solid state oxidative polymerization methods
were used to prepare the PANIs with solvent (PANI 1) and without solvent (PANI 2),
respectively. The PANIsalso prepared under vacuum drying conditions namely, PANI 1VD
and PANI 2VD.Among all prepared PANIs, PANI 1VD selected as a matrix for further
preparing hybrid nanocomposites using functionalized MWCNTs as a filler material. PANI
1VD also used for the synthesis of self-standing film of non-protonated and protonated (with
hydrochloric acid) PANI system namely PANI A and PANI B, respectively.
3.1 Materials
We select PANI as a matrix materials. The conducting MWCNTs were used as a filler
in dual morphology (fibrillar and granular) PANI matrix. Before using, functionalization of
as- received MWCNTs were carried out to for good dispersion in PANI matrix. The
conducting filler was used to enhance the level of electrical conductivity of dual morphology
PANI composites.
The following chemical used to prepare all samples; Aniline (C6H5NH2; 99%purity,
Merck) as a monomer double distilled before use. Ammonium peroxodisulfate [(NH4)2S2O8or
APS; 98% purity, Merck)] were used as an oxidant.To prepare PANI, deionized
water was used as a solvent.Sulfuric acid (H2SO4; purity 98%, Merck make), Nitric acid
(HNO3, Fisher Scientific;Qualigens make) and hydrochloric acid (HCl; 37% purity, Merck)
as a dopant. The 1-methyl-2-pyrrolidinone (NMP) (99%purity, Alfa Aesar),
heptamethyleneimine (HPMI) (99% purity, Alfa Aesar), 1,3-Dimethyl-3,4,5,6-tetrahydro-
2(1H)-pyrimidinone (DMPU) (99% purity, Alfa Aesar),dimethyl sulphoxide (DMSO)
(C2H6OS, purity >99%, Merck make) were used as solvent. The MWCNTs (density 2.1 g/cc)
purchased from Sigma-Aldrich. For good dispersion, the surface treatment of pristine
MWCNTs was done by oxidative treatment as reported by Z. Zhao et al. According to the
manufacturer, the diameter and length of MWCNTs were (16-20 nm) and (3-8 µm)
respectively.

Page | 46
3.2 Synthesis of Polyaniline
PANI was synthesized with and without solvent under different drying conditions.
APS used as an oxidizing agent. The oxidation potential of APS oxidant was (2.01 V); [63].
Due to its higher oxidation potential, this, in turn, accelerated the polymerization mechanism.
A previous study [177] revealed that PANI prepared with APS oxidant (with solvent)
exhibited a granular morphology.
3.2.1 With Solvent
PANI synthesized in the presence of solvent by the chemical polymerization of the
aniline monomer. A solution of APS (4.564 g) prepared in 200 ml of 2.5M HCl (figure 3.1).
Distilled aniline (4 ml) was added to the previous solution for complete solubility of the
monomer and stirred vigorously in a chemical bath kept below 5 0C. A volume of 2 ml of
aniline was added dropwise (one drop every 10 s), whereas the remaining 2 ml added at once.
The pH of the solution maintained in acidic medium (pH < 3). The solution stirred in an
airtight flask for another 3 h, and after that, it left for 10–12 h at room temperature to
completely polymerize aniline [178]. During polymerization, the color of the solution
gradually turned green. The solution was filtered and washed with deionized water to remove
the unreacted soluble component, with a 0.1 M HCl solution to eliminate the unreacted
aniline monomer and finally with acetone to remove water. The precipitate was dried
separately in the air (PANI 1) and a vacuum oven at 90 0C (PANI 1VD) for 18 h.
3.2.2 Without Solvent
Solid state oxidative polymerization can be used for the synthesis of PANI without
solvent. First, distilled aniline (4 ml) poured into a porcelain mortar and HCl (2.4 ml) was
added dropwise followed by simultaneous grinding (a white paste formed during this process)
for 10 min at room temperature (figure 3.2). Subsequently, fine APS powder (11.409 g) was
added slowly (to prevent overheating due to the highly exothermic reaction) [179]. After the
addition of APS, the color of the paste changed from white to green; this confirmed the
doping of HCl. This paste transferred into a 2-L beaker containing a solution of acetone,
ethanol, and deionized water in a 1:1:8 ratio and left for 1h. The previous solution was
washed with deionized water, acetone, and ethanol, respectively, until the brown filtrate
became colorless, as also reported by Tantawy et al. [180]. The obtained product was dried
separately in air (PANI 2) and, after that, in a vacuum oven at 90 0C (PANI 2VD) for 18 h.

Page | 47
Figure 3.1: Schematic of preparation of PANI with solvent
Figure 3.2: Schematic of preparation of PANI without solvent
Among all prepared PANIs, PANI 1VD selected as a matrix for further preparing
hybrid nanocomposites using functionalized MWCNTs as a filler material. PANI 1VD also
used for the synthesis of self-standing film of non-protonated and protonated (with
hydrochloric acid) PANI system namely PANI A and PANI B respectively.

Page | 48
3.3 Functionalization of Pristine MWCNTs
The chemical functionalization of pristine MWCNTs has been carried out using
oxidative treatment. CNT has the weak van der Wall forces because of which it strongly
agglomerated. The creation of an additional functional group on its surface diminishes the
van der Wall forces due to the existence of repulsive forces. The reduction in van der Wall
forces, increase its dispersion in the nanocomposite materials. To create identical
functionality by oxidative treatment, around 1g pristine MWCNTs was ultrasonicated in a
mixture of concentrated H2SO4 and HNO3 (3:1, 60ml and 20ml, respectively) for 2h as
reported in the literature [181] (figure 3.3). After that, the dispersion refluxed in a triple-neck
flask (volume 1.0 L), equipped with an external heater, control thermocouple, magnetic stirrer
and condenser under vigorous stirring at 80 °C for 60 minutes. The suspension was kept for
some time until it gets cooled. After acid treatment, above acidic suspension of MWCNTs
slowly added into the deionized water (to avoid the excess exothermic reaction). The above
solution was filtered through centrifuge process, washed the suspension thoroughly with
deionized water (this process was repeated several times until neutral pH). The collected
suspension dried in air, and after that, the dried powder was kept in vacuum oven (-70Kpa)
overnight at 60C. The functionalized MWCNTs, with acid treatment, were assigned as
COOH-MWCNTs (f-MWCNTs).
3.4 Nanocomposites Preparation
Initially, different weight percent of functionalized MWCNTs (f-MWCNTs) was
ultrasonicated in 10ml DMSO solvent for 1h. After that, 0.5g of PANI added during
ultrasonication followed by constant stirring for 2h at room temperature to ensure complete
mixing. During solution processing, hydrophobic chains of polymer attached to the surface of
individual f-MWCNTs due to hydrophobic-hydrophobic interactions. The surface treated
nanotubes with –COOH group by the chemical treatment enhance the dispersion of nanotubes
in PANI matrix. A carbonyl is a hydrophilic group but polyaniline and nanotubes both have
hydrophobic benzene rings. The presence of benzene ring in PANI and nanotubes leads to
enhance the hydrophobic interactions [182].The obtained composite was filtered and washed

Page | 49
Table 3.1. Weight and volume percentages of the f-MWCNTs filler in PANI matrix
Sr. No. Weight% Volume%
1 0 0.0
2 0.25 0.1
3 0.5 0.3
4 1.0 0.6
5 1.5 0.9
6 2.0 1.3
7 3.0 1.9
8 5.0 3.3
9 10.0 6.7
10 20.0 13.9
11 30.0 21.0
with DI water and acetone to remove unreacted soluble components and water molecules.
The product was subsequently vacuum-dried (-70 Kpa) in the oven at 90 C for 18h.
Composites containing 0.1, 0.3, 0.6, 0.9, 1.3, 1.9, 3.3, 6.7, 13.9 and 21 vol. % of f-MWCNTs
were prepared. The volume percent of f-MWCNTs (table 3.1) for selected weight percent in
PANI matrix was determined from the relation given as [183] (equation 3.1).
𝑉𝑓 =𝑊𝑓
[𝑊𝑓 + (1 − 𝑊𝑓) × (𝜌𝑓 𝜌𝑚⁄ )]⁄ (3.1)
where 𝑉𝑓 the volume fraction of filler, 𝑊𝑓 is the weight fraction of filler; 𝜌𝑓 is the
density of the filler, and 𝜌𝑚 is the density of the PANI matrix.
3.5 Preparation of PANI Films
The self-standing PANI films were prepared via solution casting method. Initially, 0.1
gm of PANI 1VD powder was mixed with 0.1 ml of HPMI in a teflon vial for 10 minutes.
With the addition of HPMI, the color of the PANI changed to blue which indicates that the
emeraldine salt form of PANI converted to the emeraldine base form. After that, 1.35 ml of

Page | 50
Figure 3.3: Schematic of functionalization of pristine MWCNTs
Figure 3.4: Preparation of self-standing film of PANI A and PANI B
DMPU solvent was added to above mixture and stirred mildly for 30 minutes to disperse the
visible solid particle of PANI. After that, PANI solution was filtered through the cotton plug
followed by casting on a glass substrate and put in the oven at 60 °C for two days. It was
found that the color of the film turned to green. To detach the dried film from the glass
substrate, it immersed into the water container for overnight. The exchange of water with the
solvent was taking place. Previous water was changed with a fresh one and keep the film
again for the next 4 hour to ensure the complete removal of residual of NMP and HPMI. The
obtained film was in blue color which indicates the formation of emeraldine base form of
PANI (figure 3.4) and dry it in air for one hour. To reduce the chance of bending sandwich
self-standing PANI film in between two Kim Wipes under the load of 5 kg for one day. The

Page | 51
obtained film in blue color leveled as PANI A. Afterward, the self-standing film was
protonated with 1M HCl. The color of the film turned to green which shows the emeraldine
salt form of PANI. Dried it in the air for one h and sandwich between two Kim Wipes under
the load of 5 kg for one day; the obtained film labeled as PANI B.
3.6 Characterizations of PANI (powder and film) and PANI based
nanocomposites
Many characterization techniques were used to analyze filler component, matrix, and
hybrid composites/nanocomposites. The used techniques discussed as follows in subsequent
paragraphs.
3.6.1 Density Determination
The experimental density (𝜌𝑒𝑥𝑝) of hybrid nanocomposites were measured using
density kit (Mettler Toledo, ME-DNY-4) according to equation 3.2 based on Archimedes
principle. The theoretical density(𝜌𝑡ℎ) of hybrid nanocomposites was calculated using the
rule of mixture (ROM) equation 3.3: [184]
𝜌𝑒𝑥𝑝 = [𝐴 𝐴 − 𝐵⁄ (𝜌𝑜 − 𝜌𝐿) + 𝜌𝐿] (3.2)
𝝆𝒕𝒉 = 𝝆𝒎 × (𝟏 − 𝑽𝒇) + 𝝆𝒇 × 𝑽𝒇 (3.3)
where 𝐴 and 𝐵 is the weight of nanocomposites pellet in the air and distilled water
medium, respectively.𝜌𝑜 and 𝜌𝐿 are the density of the distilled water (i.e. 0.9967 gcm−3) and
density of air (i.e., 0.0012 g cm−3) respectively. 𝜌𝑚 and 𝜌𝑓 are the densities of PANI matrix
and filler, respectively. 𝑉𝑓 is the volume fraction of the filler. After preparation of hybrid
nanocomposites, further characterizations has done.
3.6.2 X-ray Diffractometry (XRD)
Information related to the crystallinity in the samples (PANI 1, PANI 1VD, PANI 2,
PANI 2VD, hybrid MWCNTs/PANI nanocomposites, PANI A and PANI B) collected with
the help of X-ray Diffractometry (XRD; PaNalytical X’Pert Pro, Cu Kα radiation,
wavelength = 1.54 Å). The XRD data collected in the 2θ range from 10 to 60°; step size 0.02°
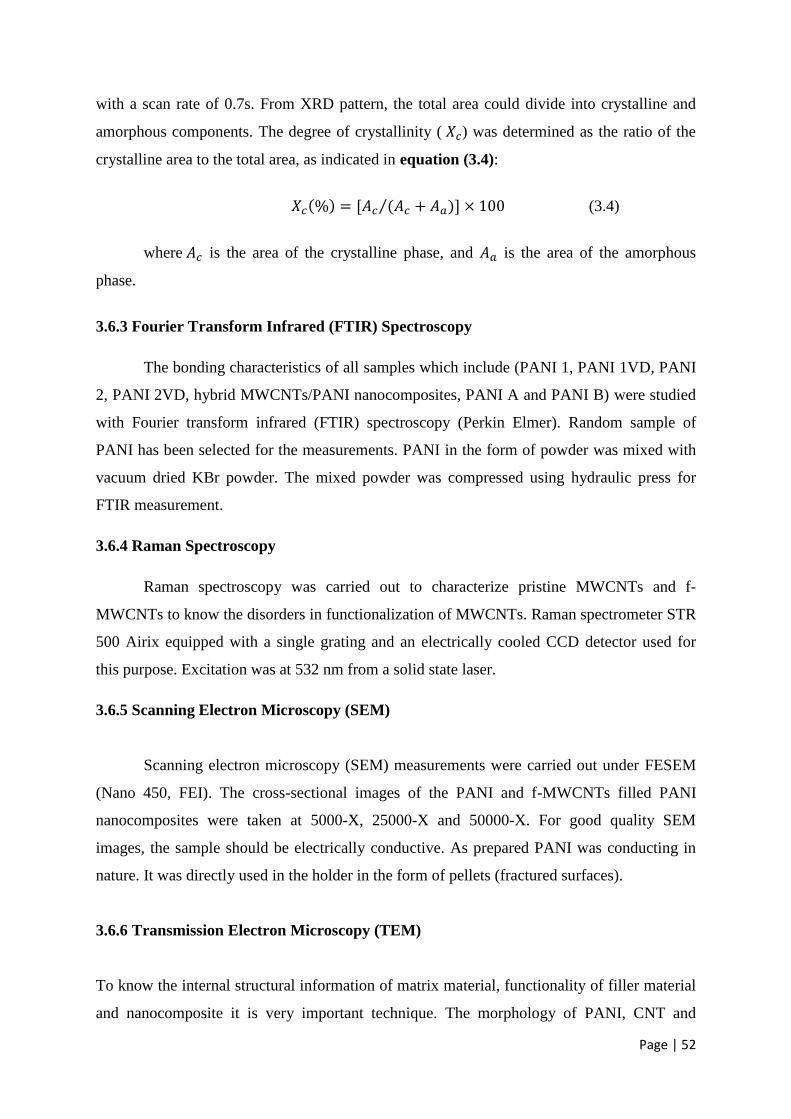
Page | 52
with a scan rate of 0.7s. From XRD pattern, the total area could divide into crystalline and
amorphous components. The degree of crystallinity ( 𝑋𝑐) was determined as the ratio of the
crystalline area to the total area, as indicated in equation (3.4):
𝑋𝑐(%) = [𝐴𝑐 (𝐴𝑐 + 𝐴𝑎)⁄ ] × 100 (3.4)
where 𝐴𝑐 is the area of the crystalline phase, and 𝐴𝑎 is the area of the amorphous
phase.
3.6.3 Fourier Transform Infrared (FTIR) Spectroscopy
The bonding characteristics of all samples which include (PANI 1, PANI 1VD, PANI
2, PANI 2VD, hybrid MWCNTs/PANI nanocomposites, PANI A and PANI B) were studied
with Fourier transform infrared (FTIR) spectroscopy (Perkin Elmer). Random sample of
PANI has been selected for the measurements. PANI in the form of powder was mixed with
vacuum dried KBr powder. The mixed powder was compressed using hydraulic press for
FTIR measurement.
3.6.4 Raman Spectroscopy
Raman spectroscopy was carried out to characterize pristine MWCNTs and f-
MWCNTs to know the disorders in functionalization of MWCNTs. Raman spectrometer STR
500 Airix equipped with a single grating and an electrically cooled CCD detector used for
this purpose. Excitation was at 532 nm from a solid state laser.
3.6.5 Scanning Electron Microscopy (SEM)
Scanning electron microscopy (SEM) measurements were carried out under FESEM
(Nano 450, FEI). The cross-sectional images of the PANI and f-MWCNTs filled PANI
nanocomposites were taken at 5000-X, 25000-X and 50000-X. For good quality SEM
images, the sample should be electrically conductive. As prepared PANI was conducting in
nature. It was directly used in the holder in the form of pellets (fractured surfaces).
3.6.6 Transmission Electron Microscopy (TEM)
To know the internal structural information of matrix material, functionality of filler material
and nanocomposite it is very important technique. The morphology of PANI, CNT and

Page | 53
hybrid PANI nanocomposites were investigated by transmission electron microscopy (TEM)
and high-resolution TEM (HRTEM) [FEI: TECNAI G2 operated at 200kV]. Samples for
TEM study were prepared by dispensing a small amount material in DMSO; a single drop of
the suspension dropped on a 300 mesh carbon coated copper grid with the help of
micropipette. To dry the copper grid keep it for overnight and then next day used under TEM.
The high-resolution mode of TEM (HRTEM) was used to investigate the characteristic
features of pristine and functionalized carbon nanotubes.
3.6.7 Thermogravimetric Analysis (TGA)
The thermal stability of the samples were examined using a thermogravimetric
analyzer (TGA) STA 6000, Perkin Elmer). The operation was taken under nitrogen gas with a
flow rate of 10 ml/min and a heating rate of10°C/min.
3.6.8 Ultra Violet-Visible (UV-Vis) Spectroscopy
The absorption spectra of matrix material were recorded using ultraviolet–visible
spectroscopy (C60, Agilent Technologies, 300–900 nm). The samples were prepared in a 1-
methyl-2-pyrrolidinone (NMP) solvent for the absorption study. The purpose was to know
the presence of benzenoid and quinoid rings in PANI.
3.6.9 Current-Voltage Measurements
For the electrical measurements, pure PANI pellets were prepared with 2mm
thickness whereas PANI/CNTs nano-composites pellets were prepared with 1mm thickness.
In both the conditions, the diameter was 13mm. In case of self-standing film of PANI, the
thickness of prepared film was 36 micron. The DC electrical resistance of PANI pellet,
PANI/CNTs nano-composites pellets and PANI films were measured using electrometer
(2601B, Keithley). The silver paste applied on the cross-sectional faces of the pellets prior the
electrical measurements. Standard two-probe and four-probe method used for this
measurement. In case of two probe methods, pellets were sandwich between two electrodes
and for four probes the distance between the probes was 0.2 cm. The equations 3.5 and 3.6
were used to calculate the DC electrical conductivity of PANI and f-MWCNTs filled PANI

Page | 54
composites pellets. The electrical conductivity of self-standing PANI films were calculated
using equation 3.6 and 3.7.
𝜌 = 𝑅𝐴 𝐿⁄ (3.5)
𝜎 = 1 𝜌 ⁄ (3.6)
𝜌 = 4.5324 × 𝑤 ×𝑉
𝐼 (3.7)
where 𝜌 is the resistivity of the PANI pellet and PANI film, 𝑅 is the resistance of the
PANI pellet; 𝐴 is the area of the pellet, 𝐿 is the thickness of the PANI pellet and 𝜎is the
conductivity.𝑤 , 𝑉 and 𝐼 is the thickness of PANI films, voltage and current, respectively.
3.6.10 Estimated Far-Field EMI Shielding
The estimated far-field EMI shielding efficiency of f-MWCNTs filled PANI
nanocomposites was calculated using equation (3.8)
𝐸𝑀𝐼 𝑆𝐸 = 20 𝑙𝑜𝑔 [1 + (1 2⁄ )𝜎. 𝐿. 𝑍𝑜] (3.8)
where 𝜎 is the conductivity of nanocomposite pellets, 𝐿 is the thickness of the pellets
and 𝑍𝑜is the free space impedance (constant: 377 S-1).
Figure 3.5: Flow diagram showing methodology for preparation and characterizations of PANI and
PANI-based nanocomposites
The methodology adopted in research work summarized with flow diagram (figure 3.5).

Page | 55
CHAPTER FOUR
PANI Characterizations The present chapter has given detail about the structural, electrical, morphological, thermal and
optical study of PANI 1, PANI 1VD, PANI 2and PANI 2VD. XRD results showed that PANI prepared
with solvent has more crystallinity than that of without solvent. FTIR results confirmed the presence
of dopant in the air and vacuumdrying conditions. The direct current electrical conductivity of PANIs
prepared with solvent is higher as compared to the without solvent due to mixed (granular and
fibrillar) morphology. The growth mechanism of PANI nanofibers and granular structure along with
morphology of PANI changed from one-dimensional to granular shape also explained in this chapter.

Page | 56
CHAPTER FOUR PANI Characterizations
========================================
4.1 PANI with and without Solvent
The prepared PANIs samples were characterized using XRD, FTIR, SEM, TEM, UV-
Vis and TGA techniques. Electrical resistance of all samples were measured with an
electrometer. The effect of drying conditions on the DC electrical conductivity of PANI also
investigated in detail.
4.2 Density Determination
The experimental densities of PANI 1, PANI 2, PANI 1VD, and PANI 2VD were
found to be 1.327, 1.331, 1.361, and 1.335 g/cm3, respectively. These densities were very
close to the density of the commercially available PANI (i.e., 1.36 g/cm3). The density of the
vacuum-dried PANI 2VD was slightly higher than that of the air dried PANI 2. However, the
higher density of PANI 1VD compared to PANI 1 may have been due to the removal of
defects and free volume and similarly for PANI 1VD and PANI 1. Another reason may have
been the good ordering of the polymeric chain and the change in the molecular weight of the
polymers processed under different conditions. The molecular weight of PANI 1 prepared in
solvent could be on the higher side because of the presence of air, moisture, and solvent. On
vacuum treatment, the PANI prepared below 5 C (having high molecular weight) has
released air and moisture which could lead to an enhancement in the density. It reported that
high-molecular-weight PANI could achieve when it prepared below room temperature [185].
4.3 Structural Study and Crystallinity Determination
The analysis of XRD patterns (figure 4.1) confirmed the formation of PANI and the
percent crystallinity. The three main peaks observed at 2θ values of 14.2, 20.2, and 25.2°
correspond to (010), (100), and (110) crystal planes (JCPDS 00-060-1167) of PANI salt
[180]. Peaks of relatively lower intensity at 27.3 and 30° also observed in PANI 1 and PANI
1VD. It was evident from the XRD data that PANI prepared with a solvent had a greater

Page | 57
Figure 4.1: XRD patterns of PANI 1, PANI 1VD, PANI 2, and PANI 2VD.
extent of crystallinity. This may have been due to the orientation of polymeric chains during
solution evaporation [186] this, in turn, produced larger crystalline domains embedded in the
amorphous region. We found that the crystallinity of PANI decreased slightly during the
vacuum drying treatment. The percentage crystallinity values for PANI 1, PANI 1VD, PANI
2, and PANI 2VD calculated as approximately 45, 38, 20, and 15, respectively. It was the
Figure 4.2: Percent of crystallinity of PANI 2; (a) area of crystalline phase (Ac) and (b) area of
crystalline and amorphous phase (Ac + Aa).
approximate measurements of the crystallinity. These changes in crystallinity were due to the
loss of dopant, which confirmed from FTIR spectroscopy. Figure 4.2 shows the plots for

Page | 58
percent of crystallinity calculated from XRD data, for PANI 2. Similarly, the percent of
crystallinity was calculated for PANI 1, PANI 1VD and PANI 2VD.
4.4 Structural Study
The FTIR spectra (figure 4.3) of the PANI 1, PANI 1VD, PANI 2 and PANI 2VD
were analyzed to confirm the presence of a dopant in the air- and vacuum-drying conditions.
For FTIR measurement, the samples were placed inside the holder. As expected, the
crystallinity of the vacuum-dried PANI was lower compared to that of the air-dried PANI.
This change in the crystallinity may affect the area of the absorption band. The band at 1292
and 1245 cm-1 assigned to the bending vibrations of C-N for aromatic amines and C-N+•
stretching vibrations in the polaron structure represented the existence of conducting
protonated PANI [153]. The moisture content in the polymer was measured with the
vibrations at 1620 cm-1 in their FTIR spectra [187].The characteristic peaks at 1564 and 1490
cm-1 represented C=C stretching of quinoid (N=Q=N) and benzenoid (N=B=N) rings,
respectively [188]. The strong band at 1143 cm-1attributed to the vibration
Figure 4.3: FTIR spectra of PANI 1, PANI 1VD, PANI 2, and PANI 2VD.
mode of the –NH+= structure and/or C-H in-plane bending vibrations [189]. The bands
observed at 871 and 793 cm-1 and corresponding to ring deformation were related to the C-H

Page | 59
out of plane bending vibrations of the benzene ring. There was no obvious change in the
characteristic peaks of any of the PANIs; however, the intensity changed as follows: PANI 2
> PANI 2VD > PANI 1> PANI 1VD. The decrease in the intensity was due to the removal of
a small amount of HCl dopant from PANI with the vacuum-drying treatment [190]. For
instance, the intensity of the band at 1143 cm-1 was higher in the case of PANI (without
solvent); this was ascribed to the higher degree of protonation in the backbone due to
concentrated acidic medium. This resulted in a higher degree of electron delocalization. The
higher degree of protonation may have increased the electrical conductivity of PANI.
4.5 Electrical Conductivity
The current–voltage characteristics of PANI 1, PANI 2, PANI1VD, and PANI 2VD
are shown in figure 4.4 and indicate their cubical parabolic nature at room temperature.
Figure 4.4: Current–voltage characteristics of PANI 1, PANI 2, PANI 1VD, and PANI 2VD.
The electrical conductivity values of PANI 1 and PANI 1VD were greater than those
of PANI 2 and PANI 2VD. However, the degrees of electron delocalization in PANI 2 and
PANI 2VDwere greater than those of PANI 1 and PANI 1VD. This contradiction could
explain by the mixed (granular and fibrillar) morphology of PANI 1 and PANI 1VD.Due to
fibrillar (almost one-dimensional system) morphology, the resistance experienced by the

Page | 60
charge carriers would be lesser than that experience in the granular morphology,i.e., in PANI
prepared without solvent.An enlarged view of the current–voltage characteristics of PANI 2
and PANI 2VD shown in the inset. The values of the dc electrical conductivity of PANI 1,
PANI 2,PANI 1VD, and PANI 2VD were calculated as 3.3 X 10⁻², 0.1 X 10⁻², 0.3 X 10⁻², and
0.3 X 10⁻³ S/cm, respectively (table4.1).The higher conductivity of PANI 1 may have been
due to the presence of nanofibers, moisture content, and strong interior intrachain interactions
[191]. In addition, the crystallinity of PANI 1was higher than the values of 7, 25, and 30% for
PANI 1VD, PANI 2, and PANI 2VD, respectively. The higher the crystallinity, the fewer
were the number of defects in the polymer, and this resulted in an enhancement in the
conductivity. The crystalline phase may also be responsible for the percolation pathway of
the systems. The reduced resistance of the nanofibers facilitated the drifting of the charge
carriers. On vacuum treatment, the slight decrease in the electrical conductivity of PANI 1VD
may have been due to the removal of moisture and the formation of branched nanofibers. The
Table 4.1 Morphology, DC electrical conductivity and band gap of prepared PANI 1, PANI 2, PANI
1VD and PANI 2VD
branching of nanofibers enhanced the separation, and this reduced interior intrachain
interactions and coupling between the polymeric chains [192].The lower conductivity of
PANI 2 and PANI 2VD may have been due to the irregularly shaped granular morphology
and less contact between the monomer and oxidant molecule; this may have decreased the
oxidation level in PANI prepared without solvent. The weak secondary bonding separated the
particle phase, and this may have also favored the decline in the dc electrical conductivity of
PANI. Riaz et al. [193] reported that irregular agglomerates decreased the desired properties
of the polymer. The dc electrical conductivities of one-dimensional/two-dimensional
structures are greater than those of their three-dimensional counterparts.

Page | 61
4.6 Morphological Analysis
Figure 4.5 and 4.6 show the morphological features of air dried PANI 1 and PANI 2
respectively. The air dried PANI 1 shows the dual (granular and hair like nanofibers)
morphology of PANI. These grains and hair like nanofibers at different magnifications
Figure 4.5:SEM images of PANI 1 at (a) 5000X, (b) 25000X and (c) 50000X magnifications
Figure 4.6: SEM images of PANI 2 at (a) 5000X, (b) 25000X and (c) 50000X magnifications
Figure 4.7: SEM images of PANI 1VD at (a)5000X, (b)25000X and (c)50000X magnifications

Page | 62
Figure 4.8: SEM images of PANI 2VD at (a) 5000X, (b) 25000X and (c) 50000X magnifications
depicted in figure 4.5(a-c). Figure 4.6 shows the granular morphology of PANI 2 at different
magnification. It was very interesting to note that after vacuum dried treatment the
morphology of PANI 1 gets changed from hair like nanofibers to branched nanofibers (PANI
1VD). However, there was no change in the morphology of PANI 2. The obtained
morphology of PANI 1VD and PANI 2VD at different magnification are depicted in figure
4.7 and 4.8, respectively. The TEM images (figure 4.9) shows the clear view of PANI
(PANI 1) nanofibers along with granular morphology.
Figure 4.9: TEM images of dual (granular and fibrillar) morphology PANI 1
The formation of PANI nanofibers along with grains observed without the addition of
any structural directing agent was very interesting and might be the natural morphology of
PANI. Such a mixed morphology has rarely reported in the literature. The reason for the dual
morphology in the case of PANI 1 might have been the rate of addition of aniline. Initially, 2
ml of reagent added dropwise; this formed nanofibers. The remaining 2 ml added at a once,
and this produced the granular morphology [100]. Figure 4.7(a-c) reveals the branched

Page | 63
nanofibers network along with a granular structure for PANI 1VD. On removal of a small
amount of HCl dopant, as confirmed by the FTIR spectra, intermolecular hydrogen bonding
occurred in PANI, and this resulted in the branching of nanofibers networks [193]. TGA also
did the confirmation of the removal of the HCl dopant. The hair like nanofibers may have
increased the free volume and, hence, decreased the density of the materials. In the case of
PANI prepared without a solvent, the irregularly shaped grains were interconnected well with
each other, and this represented a sufficient binding energy to combine with nearby grains or
molecules.
4.6.1 Growth Mechanism of the PANI Nanofibers and Granular Structure
The dropwise addition of the aniline monomer into the oxidant solution enhanced its
solubility to a larger extent, and this led to the formation of nanofibers. The complete
solubility of the monomer formed primary nanofibers, and the secondary chain growth of the
nanofibers suppressed. Wang and Jing [194] reported that a depleted region of oligomeric
intermediate and aniline cation created that surrounded the PANI nanofibers; this assisted the
growth and elongation of the nanofibers in one direction because their ends extended to the
less depleted region. In addition, the lower nucleation site on the surface of the PANI
nanofibers also confirmed the continuity of the PANI nanofibers at the end of polymerization.
In the case of PANI prepared without a solvent, the reactions mainly occurred at the surface
of the solid-state reactant. The reported literature shows that the morphology of a product
depends on the rates of nucleation and growth of the product. The inter-diffusion rate of the
reactant was very slow; this may have been due to less contact between the monomer and
oxidant molecules. This may have weakened the secondary bonding (van der Waals
interactions) and favored the phase separation of the particles.
4.6.2 Morphology of PANI Changed from a One-Dimensional Shape to a Granular
Shape
The dropwise addition of aniline into APS produced clean nanofibers at the early
stage of the polymerization process. The initially formed nanofibers acted as nucleation
centers for the further precipitation of PANI. With the extreme surplus of APS, the nanofibers
became thicker and coarser, and this led to irregularly shaped agglomerates. The relative
fraction of nanofibers and granular particles depended on the ability to separate the
formation of nanofibers from the secondary growth of the polymer.

Page | 64
4.7 Thermal Analysis
The TGA and differential thermogravimetric (DTG) curves of the PANI samples
depicted in Figure 4.10 (a,b). A three-step weight loss process was evident in the TGA curve
of the pure PANI. Three major minima observed in the DTG curve, which showed the
majority weight loss of the respective steps [195, 196]. The initial weight loss about 100°C
Figure 4.10: TGA (a) and DTG (b) curves of PANI 1, PANI 1VD, PANI 2, and PANI 2VD.

Page | 65
attributed to the loss of small amounts of absorbed water and unreacted monomers [162]. The
second weight loss between 150 and 300 °C was believed to have been due to the
decomposition of dopant and low-molecular-weight oligomer [197]. We observed that the
third weight loss started close to 400 °C, and it ascribed to the degradation and decomposition
of the backbone units of PANI [198].
The degradation of the PANI backbone units resulted in the formation of substituted
aromatic fragments and the extended aromatic fragment, as confirmed by the bands at 871
and 793 cm-1 in the FTIR spectra. Figure 4.10a reveals that there was a lower content of
moisture and dopant expelled from the polymeric chains in the vacuum-treated PANIs
compared to those that were air dried. The onset temperature is the temperature up to which a
material has thermal stability. For PANI 1, PANI 1VD, PANI 2, and PANI 2VD, the onset
temperatures were 520, 510, 530, and 515 °C, respectively (table 4.2). The main
decomposition temperature and residual weight values for PANI 1, PANI 1VD, PANI 2, and
PANI 2VD were 560 °C and54.72%, 565 °C and 60.18%, 550 °C and 58.03%, and 555 °C
and 57.38%, respectively. The order of moisture percentage, as observed in figure 4.10a, was
as follows PANI 1 > PANI 2 >PANI 1VD > PANI 2VD. The higher percentage of
Table 4.2: Calculation of Tonset, Td and char% of prepared PANI 1, PANI 2, PANI 1VD & PANI 2VD
moisture content in PANI 1 and PANI 2 compared to PANI 1VD and PANI 2VD,
respectively, showed the higher value of dc electrical conductivity. Bellucci et al. [199]
reported that in the presence of moisture, the electrical conductivity of polyimide increased.
A very slight change in the percentage of counter ion of the dopants moieties (Cl2) may have
also affected the mobility of the charge carrier. It has reported that the higher electron affinity
and lower thermal conductivity in the dopant counter ion (Cl2) increased the conductivity of
PANI. The presence of moisture could have enhanced the electrical conductivity of PANI.
Among all of the PANIs, PANI 1 showed a higher content of moisture, and this resulted in a
higher conductivity compared to those observed in the others.
Materials Tonset Td char%
PANI 1 520 °C 560 °C 54.72%
PANI 2 530 °C 550 °C 58.03%
PANI 1VD 510 °C 565 °C 60.18%
PANI 2VD 515 °C 555 °C 57.38%

Page | 66
4.8 Absorption Study
To prove the presence of benzenoid and quinoid rings in the PANI samples,
absorption spectra (figure 4.11) recorded. The spectra taken in NMP solvent; this turned the
color of PANI from green to blue (i.e., indication of the conversion of emeraldine salt to
emeraldine base). There were no changes in the absorption spectra of all of the samples; this
may have been due to the same dopant used during the preparation of PANI.
Figure 4.11: Absorption spectra of PANI 1, PANI 2, PANI 1VD and PANI 2VD.
Babu et al. [200] reported that PANI prepared with various oxidants had different
absorptions. The absorption spectra showed intense and broad absorptions at 330 and 630
nm; this confirmed the formation of emeraldine base [201]. The absorption at 330 nm might
have correlated with the pi–pi* transition within benzenoid rings, that is, the electronic
transition from highest occupied molecular orbital to lowest unoccupied molecular orbital,
and the absorption at 630 nm should have been pi–pi* transitions within the quinoid rings
[202]. The intensity of the peak corresponding to the quinoid ring was relatively weak
because the addition of HCl into the PANI backbone changed electron delocalization into the
polymeric chains and led to charge equalization. The equalization of charge formed the
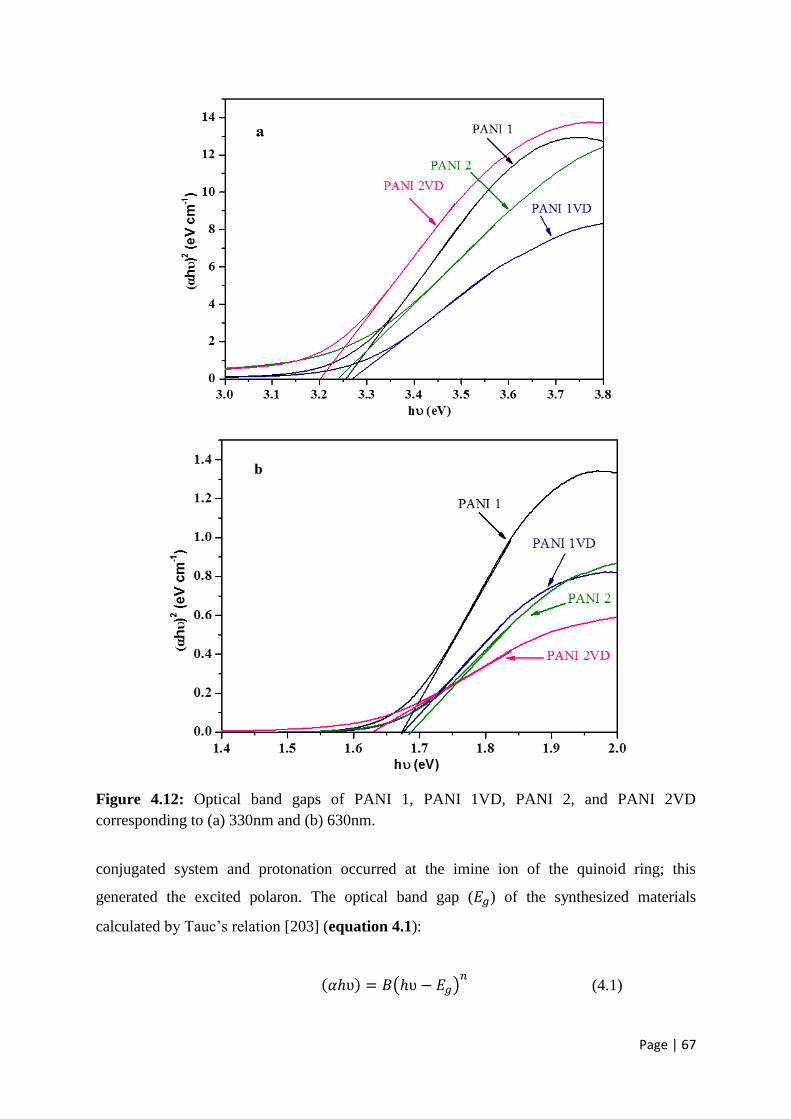
Page | 67
Figure 4.12: Optical band gaps of PANI 1, PANI 1VD, PANI 2, and PANI 2VD
corresponding to (a) 330nm and (b) 630nm.
conjugated system and protonation occurred at the imine ion of the quinoid ring; this
generated the excited polaron. The optical band gap (𝐸𝑔) of the synthesized materials
calculated by Tauc’s relation [203] (equation 4.1):
(𝛼ℎʋ) = 𝐵(ℎʋ − 𝐸𝑔)𝑛
(4.1)

Page | 68
where 𝐵 is a constant, 𝛼 is the absorption coefficient, ℎ is Planck’s constant (6.625 X 10⁻³⁴ J
s), and ʋ is the frequency of the incident photon. The exponent n has discrete values of
1/2,3/2, 2, and 3, and n = 1/2 is assigned to direct allowed transitions, n = 3/2 is assigned to
direct forbidden transitions, n = 2 assigned to indirect allowed transitions, and n = 3 assigned
to indirect forbidden transitions. For calculating the band gap, first the absorption spectra
have been obtained with respect to wavelength using UV spectrometer. The graph was
plotted between (αhѵ)2 and hѵ in origin software. The band gap was calculated by drawing a
tangent in the graph with respect to both peaks at 330 nm and 630 nm which touches the hѵ
value.
Tauc’s plot for the calculation of the optical band gap (on both 330 nm and 630 nm peaks)
shown in figure 4.12 (a,b). Extrapolation of a tangent on both the peaks, obtained in the
absorption spectra, indicated values of the optical band gap of 3.25 and 1.67 eV (PANI 1),
3.24 and1.68 eV (PANI 2), 3.27 and 1.67 eV (PANI 1VD), and 3.20 and1.63 eV (PANI
2VD). Our results suggest that the morphological and physical properties of PANI could be
regulated through the selection of an appropriate route of preparation.

Page | 69
CHAPTER FIVE
MWCNTs/PANI Nanocomposites
In current chapter, discussion has given about the density,
structural, electrical, morphological and thermal stability of hybrid
f-MWCNTs/PANI nanocomposites. PANI 1VD selected as a matrix
for further nanocomposites formation and their characterizations.
The results about confirmation of functionalization of pristine
MWCNTs with carbonyl group explained in this chapter. The
electrical conductivity of nanocomposites is higher than that of pure
PANI. The percolation threshold is found to occur at 0.1 vol. % of
the filler. The electrical conductivity of nanocomposites is reaches
up to the level which is required for EMI shielding applications.

Page | 70
CHAPTER FIVE MWCNTs/PANI Nanocomposites
========================================
5.1 MWCNTs/PANI Nanocomposites
Hybrid MWCNTs/PANI nanocomposites were prepared with different MWCNTs
content as given in table 5.1. Before preparing nanocomposites pristine MWCNTs were
Table 5.1. Weight and volume percentages of the f-MWCNTs filler in PANI matrix
Sr. No. Weight% Volume%
1 0 0
2 0.25 0.1
3 0.5 0.3
4 1.0 0.6
5 1.5 0.9
6 2.0 1.3
7 3.0 1.9
8 5.0 3.3
9 10.0 6.7
10 20.0 13.9
11 30.0 21
functionalized by oxidative treatment designated as f-MWCNTs. Pristine and functionalized
MWCNTs were characterized using FTIR spectroscopy, Raman spectroscopy and TEM. The
prepared nanocomposites were characterized using XRD, FTIR, SEM, TEM, TGA
techniques. The DC electrical conductivity was also measured using electrometer.
5.2 Density Determination
The theoretical and experimental density of hybrid f-MWCNTs/PANI
nanocomposites shown in figure 5.1. It is clearly seen that the density of nanocomposites
increased with increasing the content of f-MWCNTs which is due to the higher density of
MWCNTs (2.1 g/cm3) than the density of pure PANI (1.361 g/cm3). The experimental
density was in close agreement with the theoretical density at lower vol. %, however, at

Page | 71
Figure 5.1: Theoretical and experimental densities of hybrid f-MWCNTs/PANI
nanocomposites
higher vol. %(beyond 3.3 vol. %) it was slightly less than the theoretical density. The
probable reason for lower density at higher vol.% is the agglomeration of CNT which hinders
the infiltration of the polymer during processing [204].
5.3 Structural Study and Crystallinity Determination
The analysis of XRD patterns confirmed the formation of hybrid f-MWCNTs/PANI
nanocomposites and percent of crystallinity (figure 5.2).The diffraction peaks (for f-
MWCNTs) appeared at 2θ = 25.9°, and 43° correspond to graphite-like structure and catalytic
particles encapsulated inside the wall of CNTs, respectively [205]. PANI shows broad peaks
at 2θ = 14.2°, 20.2°, and 25.2° which is corresponding to (010), (100) and (110), crystal
planes (JCPDS 00-060-1167) of polyaniline in the emeraldine salt form, respectively [180].
The peaks of relatively lower intensity also observed at 27.3° and 30°. In comparison to
PANI, the XRD pattern of hybrid f-MWCNTs/PANI nanocomposite demonstrate noticeable
differences in the sharpness of the peak which affects the crystallinity of nanocomposites.

Page | 72
Figure 5.2: XRD patterns of PANI, f-MWCNTs, and hybrid f-MWCNTs/PANI nanocomposites
The value of percentage crystallinity for pure PANI and hybrid f-MWCNTs/PANI
nanocomposite calculated as 38 (for PANI), 40 (1.3 vol % f-MWCNTs and 1.9 vol. % f-
MWCNTs), 42 (3.3 vol. % f-MWCNTs), 43 (6.7 vol. % f-MWCNTs) and 46 (13.9 vol. % f-
MWCNTs) (table 5.2). The increased crystallinity in nanocomposites compared to PANI was
Table 5.2. Percent of crystallinity for PANI and hybrid f-MWCNTs/PANI nanocomposites
Material Ac + Aa Ac Xc (%) = [Ac/ (Ac+Aa)] X 100
PANI 3460 1305 38
f-MWCNTs(1.3 vol%)/PANI 3465 1383 40
f-MWCNTs(1.9 vol%)/PANI 3470 1379 40
f-MWCNTs(3.3 vol%)/PANI 3980 1664 42
f-MWCNTs(6.7 vol%)/PANI 3220 1380 43
f-MWCNTs(13.9 vol%)/PANI 3900 1790 46
due to ultrasonication treatment was given during solution processing. The ultrasonication
has been applied to attain the better dispersion of f-MWCNTs and PANI in DMSO solvent. It
causes the rapid motion of molecule resulted in efficient mixing leads to the ordering of
PANI chains along the axis of CNT. Peng et al. [206] reported the higher crystallinity of
poly(3,4-ethylenedioxythiphene) (PEDOT) with effective mixing by ultrasonication

Page | 73
treatment. The higher percent of crystallinity of PANI with 13.9 vol. % f-MWCNTs also
shows high direct current electrical conductivity. FTIR spectroscopy also confirmed these
changes in crystallinity of hybrid nanocomposites.
5.4 Structural Study
The FT-IR spectra (figure 5.3) of PANI and hybrid f-MWCNTs/PANI
nanocomposites were analyzed to confirm the interaction of f-MWCNTs with PANI which
affected the crystallinity of nanocomposites. In the case of PANI, the 1564 cm-1and 1490
cm−1 bands attributed to the C=C stretching of quinoid and benzenoid rings, respectively
[188] (table 5.3). The characteristic peaks at 1292 and 1245 cm-1 ascribed to the bending
Figure 5.3: FTIR spectra of PANI and hybrid f-MWCNTs/PANI nanocomposites
vibration of C-N for aromatic amines and C-N+. stretching vibrations in the polaron structure
which signify the presence of conducting protonated PANI [153]. The strong bands at 1143
cm-1 assigned to vibration mode of –NH+= structure and/or C-H in-plane bending vibration
[189]. The observed band at 871 cm-1 and 793 cm−1 identified with the out-of-plane bending
of C-H bond in the benzene ring. The signal observed at 3415 cm-1 (strong and broad for
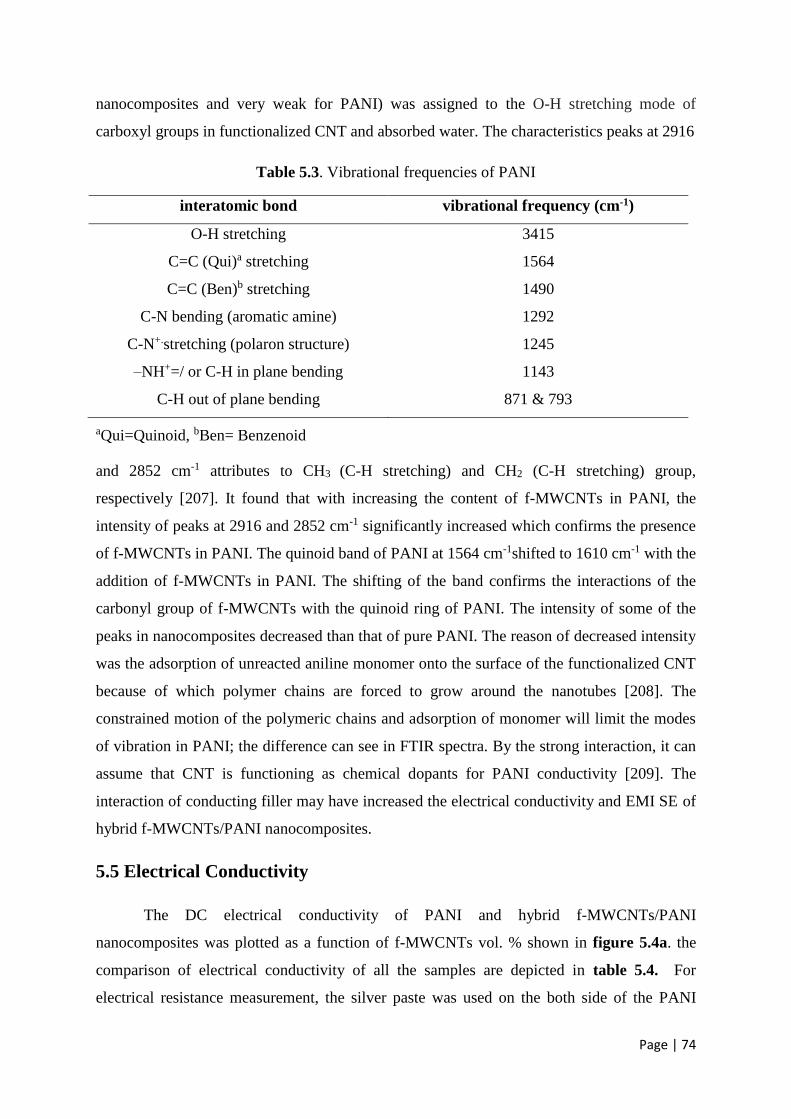
Page | 74
nanocomposites and very weak for PANI) was assigned to the O-H stretching mode of
carboxyl groups in functionalized CNT and absorbed water. The characteristics peaks at 2916
Table 5.3. Vibrational frequencies of PANI
interatomic bond vibrational frequency (cm-1)
O-H stretching 3415
C=C (Qui)a stretching 1564
C=C (Ben)b stretching 1490
C-N bending (aromatic amine) 1292
C-N+.stretching (polaron structure) 1245
–NH+=/ or C-H in plane bending 1143
C-H out of plane bending 871 & 793
aQui=Quinoid, bBen= Benzenoid
and 2852 cm-1 attributes to CH3 (C-H stretching) and CH2 (C-H stretching) group,
respectively [207]. It found that with increasing the content of f-MWCNTs in PANI, the
intensity of peaks at 2916 and 2852 cm-1 significantly increased which confirms the presence
of f-MWCNTs in PANI. The quinoid band of PANI at 1564 cm-1shifted to 1610 cm-1 with the
addition of f-MWCNTs in PANI. The shifting of the band confirms the interactions of the
carbonyl group of f-MWCNTs with the quinoid ring of PANI. The intensity of some of the
peaks in nanocomposites decreased than that of pure PANI. The reason of decreased intensity
was the adsorption of unreacted aniline monomer onto the surface of the functionalized CNT
because of which polymer chains are forced to grow around the nanotubes [208]. The
constrained motion of the polymeric chains and adsorption of monomer will limit the modes
of vibration in PANI; the difference can see in FTIR spectra. By the strong interaction, it can
assume that CNT is functioning as chemical dopants for PANI conductivity [209]. The
interaction of conducting filler may have increased the electrical conductivity and EMI SE of
hybrid f-MWCNTs/PANI nanocomposites.
5.5 Electrical Conductivity
The DC electrical conductivity of PANI and hybrid f-MWCNTs/PANI
nanocomposites was plotted as a function of f-MWCNTs vol. % shown in figure 5.4a. the
comparison of electrical conductivity of all the samples are depicted in table 5.4. For
electrical resistance measurement, the silver paste was used on the both side of the PANI
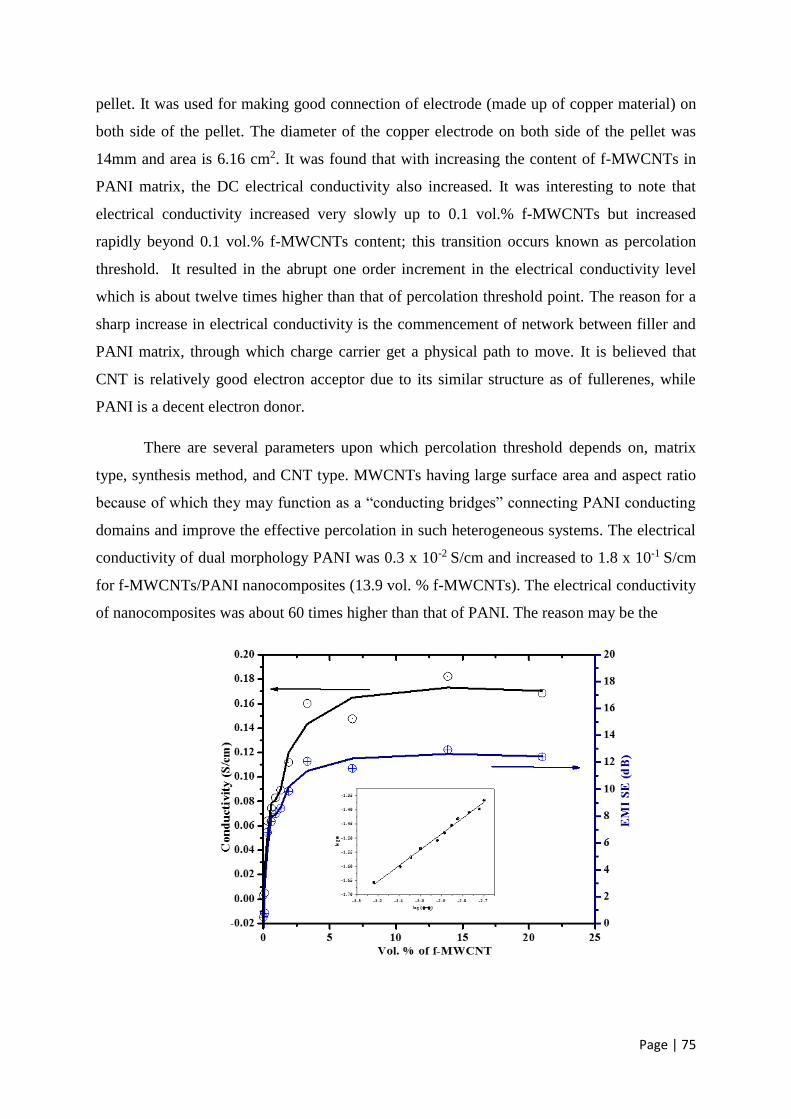
Page | 75
pellet. It was used for making good connection of electrode (made up of copper material) on
both side of the pellet. The diameter of the copper electrode on both side of the pellet was
14mm and area is 6.16 cm2. It was found that with increasing the content of f-MWCNTs in
PANI matrix, the DC electrical conductivity also increased. It was interesting to note that
electrical conductivity increased very slowly up to 0.1 vol.% f-MWCNTs but increased
rapidly beyond 0.1 vol.% f-MWCNTs content; this transition occurs known as percolation
threshold. It resulted in the abrupt one order increment in the electrical conductivity level
which is about twelve times higher than that of percolation threshold point. The reason for a
sharp increase in electrical conductivity is the commencement of network between filler and
PANI matrix, through which charge carrier get a physical path to move. It is believed that
CNT is relatively good electron acceptor due to its similar structure as of fullerenes, while
PANI is a decent electron donor.
There are several parameters upon which percolation threshold depends on, matrix
type, synthesis method, and CNT type. MWCNTs having large surface area and aspect ratio
because of which they may function as a “conducting bridges” connecting PANI conducting
domains and improve the effective percolation in such heterogeneous systems. The electrical
conductivity of dual morphology PANI was 0.3 x 10⁻² S/cm and increased to 1.8 x 10⁻¹ S/cm
for f-MWCNTs/PANI nanocomposites (13.9 vol. % f-MWCNTs). The electrical conductivity
of nanocomposites was about 60 times higher than that of PANI. The reason may be the

Page | 76
Figure 5.4a: The DC electrical conductivity and EMI SE of PANI and hybrid f-MWCNTs/PANI
nanocomposites [the inset (enlarged view shown in figure 5.4b) showing the scaling law near
percolation threshold]
Figure 5.4b: scaling law near percolation threshold
Table 5.4. Comparison table of sample’s electrical conductivity
Sr. No Materials conductivity EMI SE = 20 log (1+1/2 σ. t. Zo)
1. Pure PANI 0.3 x 10⁻² S/cm 0.47 S/Ω
2. f-MWCNTs(0.1 vol%)/PANI 0.5 x 10⁻² S/cm 0.78 S/ Ω
3. f-MWCNTs(0.3 vol%)/PANI 0.6 x 10⁻¹ S/cm 6.78 S/ Ω
4. f-MWCNTs(0.6 vol%)/PANI 0.7 x 10⁻¹ S/cm 7.58 S/ Ω
5. f-MWCNTs(0.9 vol%)/PANI 0.8 x 10⁻¹ S/cm 8.17 S/ Ω
6. f-MWCNTs(1.3 vol%)/PANI 0.1 S/cm 8.57 S/ Ω
7. f-MWCNTs(1.9 vol%)/PANI 1.1 x 10⁻¹ S/cm 9.85 S/ Ω
8. f-MWCNTs(3.3 vol%)/PANI 1.6 x 10⁻¹ S/cm 12.07 S/ Ω
9. f-MWCNTs(6.7 vol%)/PANI 1.4 x 10⁻¹ S/cm 11.54 S/ Ω
10. f-MWCNTs(13.9 vol%)/PANI 1.8 x 10⁻¹ S/cm 12.93 S/ Ω
11. f-MWCNTs(21.0 vol%)/PANI 1.6 x 10⁻¹ S/cm 12.40 S/ Ω
dispersion of f-MWCNTs in PANI mutually improve the continuity of the f-MWCNTs in the
nanocomposites. The higher loading of f-MWCNTs generates more conducting bridges

Page | 77
which facilitate more charge to transfer between the quinoid ring of PANI and the f-
MWCNTs (see figure 5.5).
Figure 5.5: Schematic of the interaction between positively charged PANI and negatively charged f-
MWCNTs
Bao et al. [210] reported the connection of MWCNTs with PANI at higher filler loading
which leads to enhancing the electrical conductivity of nanocomposites. The plateau observed
beyond 3.3 vol. % of f-MWCNTs indicate that the smearing region ranges from 0.1 vol. % to
3.3 vol. % of f-MWCNTs. According to classical percolation theory, the variation of
electrical conductivity of nanocomposites beyond the percolation threshold can express by
scaling law [112] (equation 5.1)
𝜎𝑐 = 𝐴. (𝛷 − 𝛷𝑐)𝑡 (5.1)
where 𝜎𝑐is the electrical conductivity of the nanocomposite, 𝐴 is a constant, 𝛷𝑐is the
volumefraction of filler at the percolation threshold. The symbol 𝛷 is the volume fraction of
filler near the percolation threshold, and 𝑡 is the critical exponent which governs the scaling
behavior in the region of 𝛷𝑐 . By equation 5.1, the inset in figure 5.4 shows the best fit to the
measured logarithm of direct current electrical conductivity as a function of the logarithm of
𝛷 − 𝛷𝑐. From the scaling law plot, the value of t is found to be 0.565. Classical percolation
theory predicts the value of t between 1.5 to 2.0 for a three-dimensional network, whereas it
falls between 1.0 to 1.332 for a two-dimensional system. Accordingly, the value of t is

Page | 78
expected to be lower than 1.0 if the charge carriers flow in one dimension [104, 211]. In the
present nanocomposite, the filler having aspect ratio nearly 1000 and hence the flow of
charge inside may flow through a one-dimensional network of f-MWCNTs which resulted in
the value of t less than 1.0. Another reason of improved electrical conductivity of
nanocomposites may have the conversion of the granular structure of double morphology
PANI to one-dimensional nanofibers. The electrical conductivities of the one-dimensional or
two-dimensional structure are higher than that of three-dimensional counterparts.
5.6 Estimated EMI Shielding Efficiency
Figure 5.4 also represent the estimated EMI SE of hybrid f-MWCNTs/PANI
nanocomposites. EMI SE depends on the electrical conductivity, thus with increasing the f-
MWCNTs content, estimated EMI SE also improved. Based on the shielding theory (far-field
shielding), the estimated value of shielding was calculated using equation 3.7.The EMI SE
for pure PANIwas 0.47 dB and increased with f-MWCNTs content in PANI. The value of
estimated EMI SE from 3.3 – 21 vol. % of f-MWCNTs in PANI was about 12 dB. The higher
value of EMI shielding in hybrid nanocomposite compare to pure PANI is due to the
increased value of electrical conductivity. The reason of electrical conductivity in the system
may depend upon the morphology of the nanocomposites. It has reported in the literature that
materials with high electrical conductivity are well suited for EMI shielding.
5.7 Morphological Analysis of MWCNTs
Figure 5.6 shows the TEM images of pristine MWCNTs and f-MWCNTs. The
carbon nanotube has the weak van der Wall forces because of which it firmly agglomerated.
The creation of additional functional groups on its surface diminishes these effects due to the
existence of repulsive forces between the same charges of carbonyl groups. It could clearly
see from TEM image of pristine MWCNTs (figure 5.6a) that the graphene sheet fragments of
the outer shell, are relatively in order. The dark region (highlighted with a circle) in the
microstructure of pristine MWCNTs can be the impurity content of Fe2O3 and Al2O3. The
disturbed surface of f-MWCNTs (figure 5.6b) represents the surface treatment of pristine
MWCNTs. Silva et al. [212] reported that Fe2O3 and Al2O3 impurity from CNT could remove
via acid treatment. Figure 5.7(a-c) depicts the high-resolution TEM images of pristine

Page | 79
MWCNTs, f-MWCNTs and top view of MWCNTs. It seems that the sidewall of f-MWCNTs
looks like leaves have been eaten by worms which indicate the creation of carboxylic acid
groups on the side walls (figure 5.7b).
Figure 5.6: TEM images of pristine MWCNTs(a) and f-MWCNTs (b).
Figure 5.7: HRTEM images of pristine MWCNTs (a), f-MWCNTs (b) and top view to MWCNTs (c).
Figure 5.7c shows the top view of MWCNTs contained the numbers of cylinder which
confirmed the identity of MWCNTs.
5.8 Structural Study of MWCNTs
Raman spectroscopy further confirmed the functionalization of pristine MWCNTs.
Figure 5.8 shows Raman spectra of pristine MWCNTs and f-MWCNTs. Three major
characteristic bands observed in spectra of both samples: mode D (1337 cm−1), mode G (1579
cm−1), and mode G’ (2678 cm−1). The strong band observed at 1579 cm-1 ascribed to the in-

Page | 80
plane C–C stretching modes. MWCNTs have a number of concentric graphene layers, which
result in a single symmetric band (G).
Figure 5.8: Raman spectra of pristine MWCNTs and f-MWCNTs
Due to many rolled graphene layers, their longitudinal and transverse components cannot
distinguish at this vibration. An inactive in-plane mode (D-band) becomes active due to small
imperfections produced by the particle size effect and the loss of translational symmetry in
the disordered structure [105]. The significance of ID/IG is the ratio of sp3 -hybridized carbon
atoms (amorphous/disordered carbon) about sp2-bonded carbon atoms (graphitic carbon)
[181]. The variation in the relative intensity of the D and G lines (ID/IG) corresponds to the
ordering of the graphitic structure, and this ratio is used to characterize the different sp2 -
based carbonaceous materials. The relative intensities between D and G modes are ID/IG =
1.04 (f-MWCNTs) and ID/IG = 0.73 (MWCNTs) (see figure 5.8). The intensity ratio ID/IG for
f-MWCNTs was higher as compared to pristine MWCNTs, which reveals that mixture of
concentrated H2SO4/HNO3 increases the degree of disorders, greater disruption of the sp2-
bonded carbon atoms to sp3-hybridised carbon atoms. It implies that greater extent of surface
modification of pristine MWCNTs was carried out.

Page | 81
5.9 Morphological Analysis of Hybrid Nanocomposites
SEM images have examined the surface morphology, dispersion, and agglomeration
of f-MWCNTs in the PANI matrix (figure 5.9, 5.10 and 5.11). Figure 5.9 (a-c) at different
magnifications shows the SEM images of f-MWCNTs in f-MWCNTs (0.1vol%) /PANI
nanocomposite. It also observed that f-MWCNTs dispersed in the PANI matrix, or
somewhere it get agglomerated. The obtained morphology of PANI is in good agreement
with the nanofibers produced by Huang et al. [102]. The clear view of morphology and
dispersion of f-MWCNTs in f-MWCNTs (0.1 vol %)/PANI nanocomposite shown with TEM
image in
Figure 5.9: SEM images of f-MWCNTs (0.1 vol. %)/PANI nanocomposites at 5000X(a), 25000X(b)
and 50000X (c) magnifications. [f-MWCNTs-D (dispersed) and f-MWCNTs-A (agglomerated)]
Figure 5.10: SEM images of f-MWCNTs (3.3 vol. %)/PANI nanocomposites at 5000X(a), 25000X
(b) and 50000X (c) magnifications. [f-MWCNTs-D (dispersed) and f-MWCNTs-A (agglomerated)]
figure 5.12a. The obtained results from TEM were also in good agreement with the results
available in the literature. It is able to understand that there is a synergistic action of PANI
and f-MWCNTs and they can mutually improve the continuity and dispersion of the f-
MWCNTs in the nanocomposites. The reason of the synergistic action is the interaction
between f-MWCNTs and PANI, which can weaken the filler-filler or polymer-polymer

Page | 82
Intramolecular and Intermolecular interactions favorable to improve the dispersion of f-
MWCNTs in PANI. Figure 5.10 (a-c) shows the SEM images of f-MWCNTs in f-MWCNTs
(3.3vol %) /PANI nanocomposite at different magnifications. From these images, it
illustrated that accumulation of f-MWCNTs on the surface of PANI nanofibers, or
somewhere it gets through the polymer matrix. It was due to increase in concentration and
different orientation of filler in PANI matrix. The segregation of carbon nanotube reduced the
density of nanocomposites as explained above. The loading of f-MWCNTs in f-MWCNTs
(13.9 vol %) /PANI nanocomposite at different magnifications [figure 5.11 (a-b)] shows that
the fraction of
Figure 5.11: SEM images of f-MWCNTs (13.9 vol. %)/PANI nanocomposites at 25000X (a) and
50000X (b) magnifications
Figure 5.12: TEM images of f-MWCNTs (0.1 vol. %)/PANI(a) and f-MWCNTs (13.9 vol%)/PANI
nanocomposites (b). [f-MWCNTs-D (dispersed) and f-MWCNTs-A (agglomerated)]
PANI reduced because of which f-MWCNTs can easily form the number of the connection
between the conducting domains of PANI. The clear view of the connection of f-MWCNTs
with PANI is depicted in TEM images figure 5.12b.The granular structure (obtained with

Page | 83
overgrowth) of dual morphology PANI transformed to the high yield fibrillar structure with
the stirring process. This methodology is practically dissimilar from the prior efforts that
focused on shaping PANI nanostructure. The literature shows this type of transformation
(granular to fibrillar) via interfacial polymerization and rapidly mixed reaction. However, our
study reveals a conversion of the granular structure of PANI into its fibrillar structure via
solution mixing method. When the reaction carried out under stirring, the network of PANI
nanofibers can saw with an irregular diameter which looks like the combination of many
fibers [see figure 5.12 (a, b)]. Ghamdi et al. [213] reported the intermolecular hydrogen
bonding between molecules of PANI and alcohol. They explained that such bonding made
the polymeric chains enfolded by alcohol molecules, which inhibit the PANI nanofibers from
aggregating together. The mechanical stirring breaks the intermolecular hydrogen bonding
between polymeric chains and DMSO which leads to generating more embryonic nuclei on
the surface of PANI fibers. The mechanical stirring boost the collision between embryonic
nuclei and PANI fibers which may decline the activation energy of heterogeneous nucleation
[214]. When nucleation takes place on the contact point of fibers, the nuclei at collision point
will act as nanoscale glue to connect the fibers with each other. Qiu et al. [215]displayed the
effect of stirring on the morphology of PANI and found the one-dimensional growth of PANI
nanofibers.
5.10 Thermal Behaviour of Nanocomposites
The thermal stability of PANI, f-MWCNTs and hybrid f-MWCNTs/PANI
nanocomposites examined under TGA shown in figure 5.13. In the case of f-MWCNTs, the
first weight loss nearby 100 °C ascribed to the loss of water molecules. The steepest weight
loss in the range of 200°C-300 °C represents the thermal degradation of carboxylic acid
groups which were found on the side wall of MWCNTs [216]. The initial weight loss in
PANI and f-MWCNTs/PANI nanocomposites up to 150 °C was due to loss of small amount
of absorbed moisture and unreacted monomer [162]. The second weight loss was detected
near about 300 °C attributed to the loss of dopant and low molecular weight oligomer. The
third weight loss observed from 470 °C to 600 °C ascribed to the degradation and
decomposition of backbone unit of PANI. The extent of weight loss for nanocomposites
loaded with f-MWCNTs in PANI matrix found to be lower than for the PANI. The improved

Page | 84
thermal stability of nanocomposites about PANI can be noted specifically by onset
temperature (Tonset) and decomposition temperature (Td).
Figure 5.13: TGA of PANI, f-MWCNTs and hybrid f-MWCNTs/PANI nanocomposites
The onset temperature for f-MWCNTs and PANI were 215 °C and 478 °C
respectively. For f-MWCNTs/PANI the onset temperature was observed to be at 535 °C (for
0.3 vol.% f-MWCNTs), 489 °C (for 0.6 vol.% f-MWCNTs), 487 °C (for 1.3 vol.% & 1.9
vol.% f-MWCNTs), and 480 °C (6.7 vol.% f-MWCNTs). The residual weight value at 800
°C and main decomposition temperature were 73.68% and 245 °C (for f-MWCNTs), 41.74%
and 527 °C ( PANI), 60.73% and 570 °C (0.3 vol.% f-MWCNTs), 49.95% and 538 °C (0.6
vol.% f-MWCNTs), 47.64% and 535 °C (1.3 vol.% f-MWCNTs), 46.61% and 535 °C (1.9
vol.% f-MWCNTs), and 45.58% and 536 °C (6.7 vol.% f-MWCNTs). Figure 5.14 shows the
graphical representation of TGA parameters (Tonset, Td, and Char %).
From the above results; it was found that Tonset and Td are much higher up to 0.3 vol.
% of f-MWCNTs/PANI nanocomposites and not improved extensively beyond it. In this
case, the temperature shift was found to be 57 °C (Tonset) and 43 °C. Moniruzzaman et al. [68]
reported that MWCNTs (5 wt %)/PAN composite fibers show 24 °C shift in Tonset than those
of pure PAN. The reason for higher thermal stability upto 0.3 vol. % f-MWCNTs could

Page | 85
ascribe to the obstruction of the flux of degradation product due to the interaction of f-
MWCNTs with polymeric chains which results in delayed onset of degradation.
Figure 5.14: Graphical representation of TGA parameter (Tonset, Td, and Char %) of PANI and hybrid
f-MWCNTs/PANI nanocomposites
The slow degradation of polymer near the f-MWCNTs would shift Tpeak toward
higher temperature side. On the other hand, the higher content of f-MWCNTs started an
adverse effect on the dispersion of f-MWCNTs. This effect occurred due to spatial hindrance
enforced on f-MWCNTs by the nearby tubes. This worsening in the dispersion of f-
MWCNTs would give rise to the dominance of undesirable effects like reducing the
secondary bonding between polymeric chains. Therefore, there is no much difference in the
thermal stability of f-MWCNTs/PANI nanocomposites at higher vol. % of f-MWCNTs
compare to pure PANI.
The morphology and structure process-property correlation in case of PANI-based
nanocomposites using f-MWCNTs as a filler in PANI matrix schematically shown in figure
5.15. Both, the electrical conductivity and estimated EMI shielding efficiency of the
nanocomposites gradually increased irrespective of non-uniformly dispersed f-MWCNTs
content due to the formation of more number of conducting bridge which generates path for

Page | 86
charge carrier to move. Based on present study it can be concluded that the prepared
nanocomposite may be utilized as an EMI shielding plate and also in ESD applications.
Figure 5.15: Schematic of preparation, morphological, structural and electrical property correlation of
hybrid f-MWCNTs/PANI nanocomposites
An advance study is going on to explore the possibility of PANI-based nanocomposite
as a potential EMI shielding material.

Page | 87
CHAPTER SIX
Self-Standing PANI Films
In this chapter, the structural, electrical and thermal analysis
of two types of PANI films [PANI A (non-protonated) and
PANI B (protonated)] discussed in detail. PANI B film has
more crystallinity as compared to PANI A film. The electrical
conductivity of PANI B film is slightly higher than that of
PANI A. The morphological analysis of films reveals that
PANI A has short fibers, however, PANI B has long
fibers/bunch of fibers along with short fibers. The further
study of these film is still going on.

Page | 88
CHAPTER SIX Self-Standing PANI Films
========================================
The solution casting method was used to prepare self-standing films of PANI. The
film dried in vacuum, after that treated with water. The obtained film was labeled as PANI A
(non-protonated). The film treated with concentrated HCl labeled as PANI B (protonated).
The prepared samples were characterized using XRD, FTIR, SEM, TGA techniques. Direct
current electrical conductivity also measured with an electrometer.
6.1 Structural Study and Crystallinity Determination
XRD was carried out to confirm the effect of doping process on PANI crystallinity.
Figure 6.1 shows the XRD patterns of PANI A and PANI B film. A broad peak at 22.4°
observed in the XRD pattern shows the amorphous nature of PANI A. The amorphous nature
of PANI A was due to the non-conducting region consisting of disordered or folded
polymeric chains. Zheng et al. [217] reported amorphous PANI film with NMP solvent
without stretch or orientation of polymeric chains. The reason of non-ordering of polymeric
chains in PANI A might be the higher boiling point of DMPU solvent. As films dried at 110
°C, It is believed that solvent could not evaporate which restrict the orientation of polymeric
chains. It was reported that the crystalline phase formed in PANI with complete solvent
evaporation because at same time polymeric chains get proper time for ordering [186]. It
clearly appears from XRD data that PANI B has some crystallinity. The reason of higher
crystallinity of PANI B than that of PANI A is the protonation with HCl dopant. The percent
of crystallinity increased in PANI B film was about 10. The sharpness of the peak and high
intensity indicate the degree of orientation of the polymer chains and population of the
crystalline domain in amorphous region. The structure of polymeric chains depend upon the
type of dopant used, which can contribute to increase or decrease in the crystallinity character
of PANI [218]. In doping process, the participation of acids in polymeric chains create more

Page | 89
Figure 6.1: XRD patterns of PANI A and PANI B film
inter-chain space in bulk. When film dipped in concentrated hydrochloric acid, the
dopant may get ordered in the polymeric chains which lead to increase the crystallinity of
PANI film. FTIR spectra can confirm the presence of dopant which affects the crystallinity of
PANI B.
6.2 Structural Study
The FTIR spectra was carried out to know the effect of dopant on the PANI films
(figure 6.2). The band observed at 1590 and 1487 cm-1 assigned to the C=C stretching of
quinoid and benzenoid rings of PANI, respectively [219]. The band observed at 1295 cm-
1confirmed the presence of C-N bending vibration in aromatic amines. The characteristic
peaks at 1157 cm-1 attributed to the stretching mode of N=Q=N where Q represents the
quinoid ring. The band at 1245 correspond to the C-N+. stretching vibration in the polaron
structure shows the existence of the conducting PANI. The vibrational bands typically of
polymeric backbone in PANI A at 1590, 1487, 1295, 1157 and 830 cm-1shifted to 1567,
1480, 1290, 1122 and 806 cm-1 after doping with HCl represents longer effective conjugation
length. It also seems that the intensity of all peaks in PANI B are higher than that of PANI A.
The reason of these combined effects are the increase of oscillator strengths to the backbone-

Page | 90
related vibrations owing to vibronic coupling with the pi electron charge oscillation along the
chain [220]. For instant, the intensity of the peak at 1157 cm-1 rises significantly after doping
which measures the degree of doping of the polymer backbone. MacDiarmid et al. [221]
reported that the strong band at 1150 cm-1 ascribed as “electron-like band” measure the
degree of electron delocalization and it considered as a characteristic peak of PANI
conductivity.
Figure 6.2. FTIR spectra of PANI A and PANI B film
It was interesting to note that in case of PANI A, the peak observed at 2850-2950 cm-1
and 3288 cm-1 (shown in the inset of figure 6.2) represents to sp3 C-H stretch (in CH3 and
CH2) of HPMI [222]. These newly appeared peaks were attributed to sp2 and sp3 originate
from the reduced quinoid and the attached HPMI molecule.
6.3 Thermal Analysis
The thermograms of PANI A and PANI B films depicted in figure 6.3. The three-step
weight loss found in TGA curve of the PANI films. The initial weight loss about 100°C could
be assign to the loss of small amount of moisture and HPMI trapped in the PANI films. In
case of PANI A, the second weight loss observed near about 260°C was attributed to the
removal of DMPU because the boiling point of DMPU solvent is 246 °C. Whereas, PANI B
shows second weight loss about 200 °C represents the loss of acid dopant bound to the
polyaniline chain. XRD results also confirmed the presence of a dopant in polymeric chains.

Page | 91
It seems that third weight loss started close to 400°C is due to the degradation of the skeletal
polyaniline chain structure after elimination of the dopant.The thermal stability of both PANI
film can calculated from onset temperature (Tonset) and decomposition temperature (Td). The
onset temperature for PANI A and PANI B films were 448°C and 463°C, respectively. The
Figure 6.3. TGA curve of PANI A and PANI B film
main decomposition temperature and the residual weight value for PANI A and PANI B were
473°C and 38%, 486°C and 48% respectively. It has reported that higher the Tonset and Td
value higher will be the stability of the material. Table 6.1 shows the Tonset, Td and Char % of
PANI A and PANI B.
Table 6.1: Calculation of onset temperature, decomposition temperature, and char percentage of the
PANI A and PANI B
Material Onset temperature (°C) Decomposition temperature (°C) Char%
PANI A 448 473 38%
PANI B 463 486 48%
It appears from TGA curve that PANI B has greater Tonset, Td and Char % which
indicates the higher stability of the film. The higher stability of PANI B was due to the

Page | 92
benzene segment of PANI. When films dipped into the dopant, this segment was condensed
with HCl to produce chloride ion, as the –NH- bond is one of the weakest bonds and N atoms
in benzene fragment is the more reactive atom in PANI chains. Palaniappan et al. [223] has
reported that thermal stability of polyaniline in conducting form depends on the counter anion
used during preparation.
6.4 Electrical Conductivity
The current-voltage characteristic of PANI A and PANI B films depicted in figure
6.4. The ohmic behavior of films may ascribe to the weak protonation of PANI when it was
in powder form. However, the non-ohmic behavior of films can be explained with the
conduction mechanism of PANI. In general, the electric current is not merely voted by
electrons and holes as in semiconductor but also by the creation of polarons and bipolarons.
As the applied voltage increase beyond 4 volts, it generates the polarons and bipolarons
rapidly in the polymeric chains because of which electric current was increased sharply (as
shown in figure 6.4). Bhadra et al. [224] reported that in heterogeneous system of PANI
Figure 6.4: Current –voltage characteristic of PANI A and PANI B films
crystalline (ordered) region dispersed in an amorphous (disordered) region, the electrical
conduction occurs through the electron delocalization or hopping of charge carrier due to an

Page | 93
ordered structure. The electrical conductivity of PANI A and PANI B up to 4 volts is 5.95 x
10-6 S/cm and 6.735 x 10⁻⁶ S/cm, respectively and beyond that, it is 7.29 x 10⁻⁶ S/cm and 8.45
x 10-6 S/cm. The high electrical conductivity of PANI B was due to its higher crystallinity
compare to PANI A. The results are in good agreement with the crystallinity of PANIs
(prepared with and without solvent). The low difference in conductivity after protonation of
the film might be due to the tight coil conformation of PANI molecule when it mixed with
DMPU solvent. In general, tight coil conformation takes place in the solid state, so the film is
difficult to protonate completely.
The lower conductivity of PANI A compared to PANI B was due to the presence of
secondary amine,i.e., HPMI in polymeric chains. HPMI is a nucleophilic agent with strong
basicity (pKa= 11.2) have strong reactivity toward the PANI. The use of HPMI provide
mechanical strength to the polymer but destroy the conjugated chains in the emeraldine base
by quinoid ring substitution which reduce the chance of formation of polaron in polymeric
chains. It has reported that the quinoid ring substitution in PANI leads to decrease its
electrical conductivity. The mechanism of the reaction which shows the quinoid ring
substitution depicted in figure 6.5. Another reason of very low electrical conductivity is the
hydrolysis of the film which breaks the polymeric chain at –N=C bond as reported by Yang
et al. [222].
Figure 6.5: Mechanism of the reaction of PANI film formation.
It clearly seen from figure 6.4 that the electrical conductivity of PANI B is higher
than PANI A. The reason may have been the conduction in crystalline domains take place by
the hopping of charge carrier through the polaron structure that made after the protonation of

Page | 94
PANI B with HCl. It has reported that conduction on the crystalline region or metallic region
of PANI occurred though the hopping of charge carries [162]. On the other hand, the
crystalline domains enclosed by an amorphous region or folded chains. Thus, the total
electrical conductivity of the PANI B is subject to the bridging among the conductive
regions.MacDiarmid et al.described in their report that degree of electron delocalization
measured the higher electrical conductivity in PANI [221]. Higher crystallinity of PANI B as
confirmed by XRD results also affect the electrical conductivity of polymer; higher
crystallinity has the fewer number of defects in the polymer which lead to enhance in the
electrical conductivity.
6.5 Morphological Analysis
A scanning electron microphotography of PANI A and PANI B films exposed in
figure 6.6, 6.7 and 6.8. Figure 6.6 (a, b) shows the SEM images of PANI A at different
magnifications. Its features are dense and hardly reported previously. However, the film with
voids reported by many research groups [225]. The cross-sectional view of the PANI A
shows that nanofibers of the polymer are broken and appeared like short fibers as indicated in
figure (6.6a and 6.6b). The reason of formation of short nanofibers might be due to attack of
Figure 6.6: Cross-sectional SEM images of PANI A films at 5000X (a) and50000X (b)
magnifications
HPMI on the quinoid ring of PANI A which destroy the conjugation system of bond in the
polymeric chains. The structural integrity in PANI A may lead to forming the short fibers.
Rather the observed morphology of films do not have any micro-void so it could have high
electrical conductivity but due to loss of conjugation in PANI, its electrical conductivity may
lose or decreased. In case of PANI B (figure 6.7a and 6.7b), it seems to be very interesting

Page | 95
from SEM image that along with short fibers the bunch of long fibers was also formed. The
bunch of these fibers leads to a “lamellar-like” structure having no crossed linked network of
fibers (figure 6.7b). The reason of getting a lamellar-like arrangement of fibers was the
protonation of the film with concentrated hydrochloric acid. Abdiryim et al. and Sniechowski
et al. reported that the doping of PANI with acid forms the fibers of polymer with lamellar
Figure 6.7:Cross-sectional SEM images of PANI B films at 5000X(a), and50000X (b)magnifications
Figure 6.8: Cross-sectional SEM image of PANI B film
structure [226, 227]. The formation of long range bunched fibers after acid treatment increase
the electrical conductivity of PANI B film. The average thickness of PANI A and PANI B
films was approximately 35 micron. Figure 6.8 shows the cross-sectional view of SEM
image of PANIB film.

Page | 96
CHAPTER SEVEN
Conclusions and Future Work
This chapter concludes the synthesis and characterizations of PANIs
powder (i.e., PANI 1, PANI 1VD, PANI 2 and PANI 2 VD), f-MWCNTs,
hybrid f-MWCNTs/PANI nanocomposites and self-standing film of PANI
(i.e., PANI A and PANI B). The overall outcomes of the materials after
characterizations discussed in this section.

Page | 97
CHAPTER SEVEN Conclusions and Future Work
========================================
The research work on synthesis and structure-electrical properties correlation of PANI and
hybrid PANI/CNT nanocomposite has been successfully carried out. Based on the findings
from density measurements, XRD analysis, FTIR spectroscopy, Raman spectroscopy
electrical measurements, microscopic studies, TGA analysis and UV-Vis spectroscopy the
following conclusions can be made.
PANIs powder with (PANI 1) and without (PANI 2) solvent have successfully
synthesized via chemical oxidative polymerization and solid state oxidative
polymerization, respectively. The prepared PANIsfurther dried under vacuum named
as PANI 1VD and PANI 2VD.
The mixed (fibrillar and granular) morphology of PANI (with solvent) obtained via
chemical oxidative polymerization. However, granular morphology obtained via solid
state oxidative polymerization (without solvent).
Functionalization of pristine MWCNTs done with covalent functionalization through
which –COOH group attached on the surface of MWCNTs.
The electrical conductivity of PANI (fibrillar and granular morphology) prepared with
solvent was greater than that prepared without solvent due to high crystallinity and
presence of nanofibers. The resistance experienced by the charge carriers in fibrillar
morphology would be lesser than that experience in the granular morphology,i.e., in
PANI prepared without solvent.
Among all synthesized PANIs, PANI 1VD selected for further preparing hybrid
MWCNTs/PANI nanocomposites with different filler loading via solution mixing
method. PANI 1VD was also processed by solution casting method to prepare a self-
standing film of pure PANI.
The experimental densities of hybrid MWCNTs/PANI nanocomposites were very
close to theoretical densities up to 3.3 vol% of f-MWCNTs loading. However, at high

Page | 98
loadings beyond 3.3 vol%, the experimental density was found to be lower than the
theoretical densities which might be due to the agglomeration of CNT which hinders
the infiltration of the polymer during processing.
XRD study confirmed that pure PANIs, prepared with solvent, has a higher percent of
crystallinity. It was due to the orientation of polymeric chains during solution
evaporation. With increasing the loading of fillers in PANI matrix, the crystallinity of
nanocomposites further increased. The study also confirmed that PANI B film has
more crystallinity than that of PANI A film.
TGA confirmed that vacuum dried PANIs have a lower content of moisture than that
of air dried PANIs. In case of hybrid nanocomposites, it seems that the thermal
stability of PANI was increased up to 0.3 vol. % of f-MWCNTs loading. However,
there was no much difference in thermal stability at high filler loading.
In hybrid nanocomposites, percolation threshold obtained at 0.1 vol. % f-MWCNTs
and the maximum achieved electrical conductivity was 10-1S/cm. By electrical
conductivity, the estimated EMI shielding of nanocomposites at 3.3 vol. % of f-
MWCNTs and beyond it was found to be 12 dB.
The prepared hybrid MWCNTs/PANI nanocomposites have a maximum electrical
conductivity of 0.1 S/cm, which is a good level of electrical conductivity for
electromagnetic interference (EMI) shielding. Hence, the prepared hybrid
nanocomposites could be suggested for electromagnetic interference (EMI)
shielding/electrostatic dissipation (ESD) applications.

Page | 99
Future Work
Based on the present study, the following work on PANI and hybrid f-MWCNTs/PANI
nanocomposites could be done in the future
The dielectric study (dielectric constant, dissipation factor and their variation with
frequency and temperature) of f-MWCNTs/PANI nanocomposites can be done in
future.
Based on f-MWCNTs/PANI nanocomposites, more nanocomposites system can be
prepared using other suitable filler materials such as graphite flakes,
graphene/graphene oxide for further study.
Experimental study for EMI shielding for f-MWCNTs/PANI nanocomposites can be
done.
More suitable gel-inhibitors can be used for the preparation of the self-standing film
of pure PANI which can provide mechanical strength without destroying the
conjugated system of PANI.
More detailed study on the self-standing film of PANI based nanocomposite can be
done in future.

Page | 100
References
[1] Kumar A, Kumar V, Awasthi K. Polyaniline-Carbon Nanotube Composites: Preparation
Methods, Properties and Applications. Polymer-Plastics Technology and Engineering.
2017:null-null.
[2] Yang D, Zuccarello G, Mattes BR. Physical Stabilization or Chemical Degradation of
Concentrated Solutions of Polyaniline Emeraldine Base Containing Secondary Amine
Additives. Macromolecules. 2002;35:5304-13.
[3] Saini P, Arora M, Gupta G, Gupta BK, Singh VN, Choudhary V. High permittivity
polyaniline–barium titanate nanocomposites with excellent electromagnetic interference
shielding response. Nanoscale. 2013;5:4330-6.
[4] Baker CO, Huang X, Nelson W, Kaner RB. Polyaniline nanofibers: broadening
applications for conducting polymers. Chemical Society Reviews. 2017;46:1510-25.
[5] Chauhan AK, Gupta SK, Taguchi D, Manaka T, Jha P, Veerender P, et al. Enhancement
of the carrier mobility of conducting polymers by formation of their graphene composites.
RSC Advances. 2017;7:11913-20.
[6] Zhang Q, Esrafilzadeh D, Crook JM, Kapsa R, Stewart EM, Tomaskovic-Crook E, et al.
Electrical Stimulation Using Conductive Polymer Polypyrrole Counters Reduced Neurite
Outgrowth of Primary Prefrontal Cortical Neurons from NRG1-KO and DISC1-LI Mice.
Scientific Reports. 2017;7:42525.
[7] Lu X, Zhang W, Wang C, Wen T-C, Wei Y. One-dimensional conducting polymer
nanocomposites: Synthesis, properties and applications. Progress in Polymer Science.
2011;36:671-712.
[8] Schoch KF. Update on electrically conductive polymers and their applications. IEEE
Electrical Insulation Magazine. 1994;10:29-32.
[9] Angelopoulos M. Conducting polymers in microelectronics. IBM J Res Dev. 2001;45:57-
75.
[10] Bhadra S, Chattopadhyay S, Singha NK, Khastgir D. Improvement of conductivity of
electrochemically synthesized polyaniline. Journal of Applied Polymer Science.
2008;108:57-64.
[11] Bhadra S, Singha NK, Khastgir D. Polyaniline by new miniemulsion polymerization and
the effect of reducing agent on conductivity. Synthetic Metals. 2006;156:1148-54.
[12] Wei Y, Jang G-W, Hsueh KF, Scherr EM, MacDiarmid AG, Epstein AJ. Thermal
transitions and mechanical properties of films of chemically prepared polyaniline. Polymer.
1992;33:314-22.
[13] Lu W-K, Elsenbaumer RL, Wessling B. Proceedings of the International Conference on
Science and Technology of Synthetic Metals (ICSM '94)Corrosion protection of mild steel by
coatings containing polyaniline. Synthetic Metals. 1995;71:2163-6.
[14] Fahlman M, Jasty S, Epstein AJ. Corrosion protection of iron/steel by emeraldine base
polyaniline: an X-ray photoelectron spectroscopy study. Synthetic Metals. 1997;85:1323-6.
[15] Joo J, Epstein AJ. Electromagnetic radiation shielding by intrinsically conducting
polymers. Applied Physics Letters. 1994;65:2278-80.
[16] Desilvestro J, Scheifele W, Haas O. In situ determination of gravimetric and volumetric
charge densities of battery electrodes polyaniline in aqueous and nonaqueous electrolytes.
Journal of the electrochemical society. 1992;139:2727-36.
[17] Palaniappan S, John A. Polyaniline materials by emulsion polymerization pathway.
Progress in Polymer Science. 2008;33:732-58.

Page | 101
[18] Chaudhari HK, Kelkar DS. Investigation of Structure and Electrical Conductivity in
Doped Polyaniline. Polymer International. 1997;42:380-4.
[19] Anderson MR, Mattes BR, Reiss H, Kaner RB. Conjugated polymer films for gas
separations. Science. 1991;252:1412-5.
[20] Mehwish N, Kausar A, Siddiq M. Polyvinylidenefluoride/Poly(styrene-butadiene-
styrene)/Silver Nanoparticle-grafted-Acid Chloride Functional MWCNTs-Based
Nanocomposites: Preparation and Properties. Polymer-Plastics Technology and Engineering.
2015;54:474-83.
[21] Baughman RH, Zakhidov AA, de Heer WA. Carbon Nanotubes--the Route Toward
Applications. Science. 2002;297:787-92.
[22] Thostenson ET, Ren Z, Chou T-W. Advances in the science and technology of carbon
nanotubes and their composites: a review. Composites Science and Technology.
2001;61:1899-912.
[23] Dai L, Mau AWH. Controlled Synthesis and Modification of Carbon Nanotubes and
C60: Carbon Nanostructures for Advanced Polymeric Composite Materials. Advanced
Materials. 2001;13:899-913.
[24] Hirsch A. Functionalization of Single-Walled Carbon Nanotubes. Angewandte Chemie
International Edition. 2002;41:1853-9.
[25] Bahr JL, Tour JM. Covalent chemistry of single-wall carbon nanotubes. Journal of
Materials Chemistry. 2002;12:1952-8.
[26] Andrews R, Jacques D, Qian D, Rantell T. Multiwall Carbon Nanotubes: Synthesis and
Application. Accounts of Chemical Research. 2002;35:1008-17.
[27] Fischer JE. Chemical Doping of Single-Wall Carbon Nanotubes. Accounts of Chemical
Research. 2002;35:1079-86.
[28] Niyogi S, Hamon MA, Hu H, Zhao B, Bhowmik P, Sen R, et al. Chemistry of Single-
Walled Carbon Nanotubes. Accounts of Chemical Research. 2002;35:1105-13.
[29] Spinks GM, Mottaghitalab V, Bahrami-Samani M, Whitten PG, Wallace GG. Carbon-
Nanotube-Reinforced Polyaniline Fibers for High-Strength Artificial Muscles. Advanced
Materials. 2006;18:637-40.
[30] Sariciftci NS, Smilowitz L, Heeger AJ, Wudl F. Photoinduced Electron Transfer from a
Conducting Polymer to Buckminsterfullerene. Science. 1992;258:1474-6.
[31] Diaz AF, Logan JA. Electroactive polyaniline films. Journal of Electroanalytical
Chemistry and Interfacial Electrochemistry. 1980;111:111-4.
[32] Genies EM, Syed AA, Tsintavis C. Electrochemical Study Of Polyaniline In Aqueous
And Organic Medium. Redox And Kinetic Properties. Molecular Crystals and Liquid
Crystals. 1985;121:181-6.
[33] Gupta V, Miura N. High performance electrochemical supercapacitor from
electrochemically synthesized nanostructured polyaniline. Materials Letters. 2006;60:1466-9.
[34] Karami H, Asadi MG, Mansoori M. Pulse electropolymerization and the characterization
of polyaniline nanofibers. Electrochimica Acta. 2012;61:154-64.
[35] Kobayashi N, Teshima K, Hirohashi R. Conducting polymer image formation with
photoinduced electron transfer reaction. Journal of Materials Chemistry. 1998;8:497-506.
[36] Teshima K, Yamada K, Kobayashi N, Hirohashi R. Photopolymerization of aniline with
a tris(2,2[prime or minute]-bipyridyl)ruthenium complex-methylviologen polymer bilayer
electrode system. Chemical Communications. 1996:829-30.
[37] de Barros RA, de Azevedo WM, de Aguiar FM. Photo-induced polymerization of
polyaniline. Materials Characterization. 2003;50:131-4.
[38] Xie A, Tao F, Sun W, Li Y, Jiang C, Hu L, et al. Design and Synthesis of
Graphene/Porous Polyaniline Nanocomposite Using Attapulgite as Template for High-
Performance Supercapacitors. Journal of The Electrochemical Society. 2017;164:H70-H7.

Page | 102
[39] Nguyen DN, Yoon H. Recent advances in nanostructured conducting polymers: from
synthesis to practical applications. Polymers. 2016;8:118.
[40] Martin CR. Template Synthesis of Electronically Conductive Polymer Nanostructures.
Accounts of Chemical Research. 1995;28:61-8.
[41] Choi J, Kim SJ, Lee J, Lim JH, Lee SC, Kim KJ. Controlled self-assembly of
nanoporous alumina for the self-templating synthesis of polyaniline nanowires.
Electrochemistry Communications. 2007;9:971-5.
[42] Wang C, Wang Z, Li M, Li H. Well-aligned polyaniline nano-fibril array membrane and
its field emission property. Chemical Physics Letters. 2001;341:431-4.
[43] Wu C-G, Bein T. Conducting Polyaniline Filaments in a Mesoporous Channel Host.
Science. 1994;264:1757-9.
[44] X. Zheng Z, Y. Xi Y, Dong P, G. Huang H, Z. Zhou J, L. Wu L, et al. The enhanced
photoluminescence of zinc oxide and polyaniline coaxial nanowire arrays in anodic oxide
aluminium membranes. PhysChemComm. 2002;5:63-5.
[45] Nabid MR, Asadi S, Sedghi R, Bayandori Moghaddam A. Chemical and Enzymatic
Polymerization of Polyaniline/Ag Nanocomposites. Chemical Engineering & Technology.
2013;36:1411-6.
[46] Kojima K, Yamauchi T, Shimomura M, Miyauchi S. Covalent immobilization of
glucose oxidase on poly[1-(2-carboxyethyl)pyrrole] film for glucose sensing. Polymer.
1998;39:2079-82.
[47] Sharma AL, Singhal R, Kumar A, Rajesh, Pande KK, Malhotra BD. Immobilization of
glucose oxidase onto electrochemically prepared poly(aniline-co-fluoroaniline) films. Journal
of Applied Polymer Science. 2004;91:3999-4006.
[48] Lakard B, Herlem G, Lakard S, Antoniou A, Fahys B. Urea potentiometric biosensor
based on modified electrodes with urease immobilized on polyethylenimine films. Biosensors
and Bioelectronics. 2004;19:1641-7.
[49] Nakaminami T, Ito S-i, Kuwabata S, Yoneyama H. Uricase-catalyzed oxidation of uric
acid using an artificial electron acceptor and fabrication of amperometric uric acid sensors
with use of a redox ladder polymer. Analytical chemistry. 1999;71:1928-34.
[50] Rajesh, Kaneto K. A new tyrosinase biosensor based on covalent immobilization of
enzyme on N-(3-aminopropyl) pyrrole polymer film. Current Applied Physics. 2005;5:178-
83.
[51] Kobayashi S, Uyama H, Kimura S. Enzymatic polymerization. Chem Rev.
2001;101:3793-818.
[52] Mejias L, Reihmann MH, Sepulveda-Boza S, Ritter H. New Polymers from Natural
Phenols Using Horseradish or Soybean Peroxidase. Macromolecular Bioscience. 2002;2:24-
32.
[53] McEldoon JP, Dordick JS. Unusual Thermal Stability of Soybean Peroxidase.
Biotechnology Progress. 1996;12:555-8.
[54] Nagarajan R, Tripathy S, Kumar J, Bruno FF, Samuelson L. An Enzymatically
Synthesized Conducting Molecular Complex of Polyaniline and Poly(vinylphosphonic acid).
Macromolecules. 2000;33:9542-7.
[55] Liu W, Cholli AL, Nagarajan R, Kumar J, Tripathy S, Bruno FF, et al. The role of
template in the enzymatic synthesis of conducting polyaniline. Journal of the American
Chemical Society. 1999;121:11345-55.
[56] Nagarajan R, Liu W, Kumar J, Tripathy SK, Bruno FF, Samuelson LA. Manipulating
DNA conformation using intertwined conducting polymer chains. Macromolecules.
2001;34:3921-7.
[57] Stejskal J, Spirkova M, Riede A, Helmstedt M, Mokreva P, Prokes J. Polyaniline
dispersions 8. The control of particle morphology. Polymer. 1999;40:2487-92.

Page | 103
[58] Park C-S, Kim DY, Kim DH, Lee H-K, Shin BJ, Tae H-S. Humidity-independent
conducting polyaniline films synthesized using advanced atmospheric pressure plasma
polymerization with in-situ iodine doping. Applied Physics Letters. 2017;110:033502.
[59] Cruz GJ, Morales J, Castillo-Ortega MM, Olayo R. Synthesis of polyaniline films by
plasma polymerization. Synthetic Metals. 1997;88:213-8.
[60] Nastase C, Nastase F, Dumitru A, Ionescu M, Stamatin I. Thin film composites of
nanocarbons-polyaniline obtained by plasma polymerization technique. Composites Part A:
Applied Science and Manufacturing. 2005;36:481-5.
[61] Nastase F, Stamatin I, Nastase C, Mihaiescu D, Moldovan A. Synthesis and
characterization of PAni–SiO2 and PTh–SiO2 nanocomposites' thin films by plasma
polymerization. Progress in Solid State Chemistry. 2006;34:191-9.
[62] Abu-Thabit NY. Chemical Oxidative Polymerization of Polyaniline: A Practical
Approach for Preparation of Smart Conductive Textiles. Journal of Chemical Education.
2016;93:1606-11.
[63] Sapurina IY, Stejskal J. Oxidation of aniline with strong and weak oxidants. Russian
Journal of General Chemistry. 2012;82:256-75.
[64] Liu D, Wang X, Deng J, Zhou C, Guo J, Liu P. Crosslinked Carbon
Nanotubes/Polyaniline Composites as a Pseudocapacitive Material with High Cycling
Stability. Nanomaterials. 2015;5:1034-47.
[65] Katoch A, Burkhart M, Hwang T, Kim SS. Synthesis of polyaniline/TiO 2 hybrid
nanoplates via a sol–gel chemical method. Chemical engineering journal. 2012;192:262-8.
[66] Kumar A, Jangir LK, Kumari Y, Kumar M, Kumar V, Awasthi K. Electrical behavior of
dual-morphology polyaniline. Journal of Applied Polymer Science. 2016;133:n/a-n/a.
[67] Zhang Q, Wang W, Li J, Zhu J, Wang L, Zhu M, et al. Preparation and thermoelectric
properties of multi-walled carbon nanotube/polyaniline hybrid nanocomposites. Journal of
Materials Chemistry A. 2013;1:12109-14.
[68] Moniruzzaman M, Winey KI. Polymer nanocomposites containing carbon nanotubes.
Macromolecules. 2006;39:5194-205.
[69] Charrier G, Desrues A, Barchasz C, Leroy J, Cornut R, Jousselme B, et al. Covalently
functionalized carbon nanotubes as stable cathode materials of lithium/organic batteries.
Journal of Materials Chemistry A. 2016;4:15036-40.
[70] Park H, Zhao J, Lu JP. Effects of Sidewall Functionalization on Conducting Properties
of Single Wall Carbon Nanotubes. Nano Letters. 2006;6:916-9.
[71] Cho JW, Kim JW, Jung YC, Goo NS. Electroactive Shape-Memory Polyurethane
Composites Incorporating Carbon Nanotubes. Macromolecular Rapid Communications.
2005;26:412-6.
[72] Georgakilas V, Kordatos K, Prato M, Guldi DM, Holzinger M, Hirsch A. Organic
Functionalization of Carbon Nanotubes. Journal of the American Chemical Society.
2002;124:760-1.
[73] Chen J, Rao AM, Lyuksyutov S, Itkis ME, Hamon MA, Hu H, et al. Dissolution of Full-
Length Single-Walled Carbon Nanotubes. The Journal of Physical Chemistry B.
2001;105:2525-8.
[74] Vasiliev I, Curran SA. Cross linking of thiolated carbon nanotubes: An ab initio study.
Journal of Applied Physics. 2007;102:024317.
[75] Mickelson ET, Huffman CB, Rinzler AG, Smalley RE, Hauge RH, Margrave JL.
Fluorination of single-wall carbon nanotubes. Chemical Physics Letters. 1998;296:188-94.
[76] Tasis D, Tagmatarchis N, Bianco A, Prato M. Chemistry of Carbon Nanotubes.
Chemical Reviews. 2006;106:1105-36.

Page | 104
[77] Bahr JL, Mickelson ET, Bronikowski MJ, Smalley RE, Tour JM. Dissolution of small
diameter single-wall carbon nanotubes in organic solvents? Chemical Communications.
2001:193-4.
[78] Holzinger M, Vostrowsky O, Hirsch A, Hennrich F, Kappes M, Weiss R, et al. Sidewall
Functionalization of Carbon Nanotubes. Angewandte Chemie International Edition.
2001;40:4002-5.
[79] Kim B-H, Lee K-R, Chung Y-C, Park M. Functionalization effect on a Pt/carbon
nanotube composite catalyst: a first-principles study. Physical Chemistry Chemical Physics.
2016;18:22687-92.
[80] Mawhinney DB, Naumenko V, Kuznetsova A, Yates Jr JT, Liu J, Smalley RE. Surface
defect site density on single walled carbon nanotubes by titration. Chemical Physics Letters.
2000;324:213-6.
[81] Hu H, Bhowmik P, Zhao B, Hamon MA, Itkis ME, Haddon RC. Determination of the
acidic sites of purified single-walled carbon nanotubes by acid–base titration. Chemical
Physics Letters. 2001;345:25-8.
[82] Xie X-L, Mai Y-W, Zhou X-P. Dispersion and alignment of carbon nanotubes in
polymer matrix: A review. Materials Science and Engineering: R: Reports. 2005;49:89-112.
[83] Mallakpour S, Soltanian S. Surface functionalization of carbon nanotubes: fabrication
and applications. RSC Advances. 2016;6:109916-35.
[84] S. Duesberg G, Burghard M, Muster J, Philipp G. Separation of carbon nanotubes by
size exclusion chromatography. Chemical Communications. 1998:435-6.
[85] Richard C, Balavoine F, Schultz P, Ebbesen TW, Mioskowski C. Supramolecular Self-
Assembly of Lipid Derivatives on Carbon Nanotubes. Science. 2003;300:775.
[86] Guo Z, Sadler PJ, Tsang SC. Immobilization and Visualization of DNA and Proteins on
Carbon Nanotubes. Advanced Materials. 1998;10:701-3.
[87] Chen RJ, Zhang Y, Wang D, Dai H. Noncovalent Sidewall Functionalization of Single-
Walled Carbon Nanotubes for Protein Immobilization. Journal of the American Chemical
Society. 2001;123:3838-9.
[88] Cheng F, Imin P, Maunders C, Botton G, Adronov A. Soluble, Discrete Supramolecular
Complexes of Single-Walled Carbon Nanotubes with Fluorene-Based Conjugated Polymers.
Macromolecules. 2008;41:2304-8.
[89] Curran SA, Ajayan PM, Blau WJ, Carroll DL, Coleman JN, Dalton AB, et al. A
Composite from Poly(m-phenylenevinylene-co-2,5-dioctoxy-p-phenylenevinylene) and
Carbon Nanotubes: A Novel Material for Molecular Optoelectronics. Advanced Materials.
1998;10:1091-3.
[90] Coleman JN, Dalton AB, Curran S, Rubio A, Davey AP, Drury A, et al. Phase
Separation of Carbon Nanotubes and Turbostratic Graphite Using a Functional Organic
Polymer. Advanced Materials. 2000;12:213-6.
[91] Shvartzman-Cohen R, Nativ-Roth E, Baskaran E, Levi-Kalisman Y, Szleifer I,
Yerushalmi-Rozen R. Selective Dispersion of Single-Walled Carbon Nanotubes in the
Presence of Polymers: the Role of Molecular and Colloidal Length Scales. Journal of the
American Chemical Society. 2004;126:14850-7.
[92] Dhand C, Arya SK, Singh SP, Singh BP, Datta M, Malhotra BD. Preparation of
polyaniline/multiwalled carbon nanotube composite by novel electrophoretic route. Carbon.
2008;46:1727-35.
[93] Dhand C, Solanki PR, Datta M, Malhotra BD. Polyaniline/Single-Walled Carbon
Nanotubes Composite Based Triglyceride Biosensor. Electroanalysis. 2010;22:2683-93.
[94] Bachhav S, Patil D. Synthesis and characterization of polyaniline-multiwalled carbon
nanotube nanocomposites and its electrical percolation behavior. American Journal of
Materials Science. 2015;5:90-5.

Page | 105
[95] Konyushenko EN, Stejskal J, Trchová M, Hradil J, Kovářová J, Prokeš J, et al. Multi-
wall carbon nanotubes coated with polyaniline. Polymer. 2006;47:5715-23.
[96] Choudhury A, Kar P. Doping effect of carboxylic acid group functionalized multi-walled
carbon nanotube on polyaniline. Composites Part B: Engineering. 2011;42:1641-7.
[97] Philip B, Xie J, Abraham JK, Varadan VK. Polyaniline / carbon nanotube composites:
starting with phenylamino functionalized carbon nanotubes. Polymer Bulletin. 2005;53:127-
38.
[98] Wei Z, Wan M, Lin T, Dai L. Polyaniline Nanotubes Doped with Sulfonated Carbon
Nanotubes Made Via a Self-Assembly Process. Advanced Materials. 2003;15:136-9.
[99] Bhattacharya M. Polymer nanocomposites—a comparison between carbon nanotubes,
graphene, and clay as nanofillers. Materials. 2016;9:262.
[100] Huang J, Kaner RB. Nanofiber Formation in the Chemical Polymerization of Aniline:
A Mechanistic Study. Angewandte Chemie International Edition. 2004;43:5817-21.
[101] Huang J, Virji S, Weiller BH, Kaner RB. Polyaniline Nanofibers: Facile Synthesis and
Chemical Sensors. Journal of the American Chemical Society. 2003;125:314-5.
[102] Huang J, Kaner RB. A General Chemical Route to Polyaniline Nanofibers. Journal of
the American Chemical Society. 2004;126:851-5.
[103] Jeon I-Y, Tan L-S, Baek J-B. Synthesis and electrical properties of
polyaniline/polyaniline grafted multiwalled carbon nanotube mixture via in situ static
interfacial polymerization. Journal of Polymer Science Part A: Polymer Chemistry.
2010;48:1962-72.
[104] Mariano LC, Salvatierra RV, Cava CE, Koehler M, Zarbin AJG, Roman LS. Electrical
Properties of Self-Assembled Films of Polyaniline/Carbon Nanotubes Composites. The
Journal of Physical Chemistry C. 2014;118:24811-8.
[105] Salvatierra RV, Moura LG, Oliveira MM, Pimenta MA, Zarbin AJG. Resonant Raman
spectroscopy and spectroelectrochemistry characterization of carbon nanotubes/polyaniline
thin film obtained through interfacial polymerization. Journal of Raman Spectroscopy.
2012;43:1094-100.
[106] Sen T, Mishra S, Shimpi NG. Synthesis and sensing applications of polyaniline
nanocomposites: a review. RSC Advances. 2016;6:42196-222.
[107] Chen L, Pang X-J, Qu M-Z, Zhang Q-t, Wang B, Zhang B-L, et al. Fabrication and
characterization of polycarbonate/carbon nanotubes composites. Composites Part A: Applied
Science and Manufacturing. 2006;37:1485-9.
[108] Li Y, Wang Y, Wu D, Jing X. Effects of ultrasonic irradiation on the morphology of
chemically prepared polyaniline nanofibers. Journal of Applied Polymer Science.
2009;113:868-75.
[109] Husin MR, Arsad A, Hassan A, Hassan O. Influence of Different Ultrasonic Wave on
Polymerization of Polyaniline Nanofiber. Applied Mechanics and Materials: Trans Tech
Publ; 2014. p. 50-4.
[110] Gajendran P, Saraswathi R. Polyaniline-carbon nanotube composites. Pure and Applied
Chemistry. 2008;80:2377-95.
[111] Wang Q, Yao Q, Chang J, Chen L. Enhanced thermoelectric properties of CNT/PANI
composite nanofibers by highly orienting the arrangement of polymer chains. Journal of
Materials Chemistry. 2012;22:17612-8.
[112] Oyharçabal M, Olinga T, Foulc M-P, Lacomme S, Gontier E, Vigneras V. Influence of
the morphology of polyaniline on the microwave absorption properties of epoxy polyaniline
composites. Composites Science and Technology. 2013;74:107-12.
[113] Sandler JKW, Kirk JE, Kinloch IA, Shaffer MSP, Windle AH. Ultra-low electrical
percolation threshold in carbon-nanotube-epoxy composites. Polymer. 2003;44:5893-9.

Page | 106
[114] Li H-C, Lu S-Y, Syue S-H, Hsu W-K, Chang S-C. Conductivity enhancement of
carbon nanotube composites by electrolyte addition. Applied Physics Letters.
2008;93:033104.
[115] Li J, Ma PC, Chow WS, To CK, Tang BZ, Kim JK. Correlations between Percolation
Threshold, Dispersion State, and Aspect Ratio of Carbon Nanotubes. Advanced Functional
Materials. 2007;17:3207-15.
[116] Choi ES, Brooks JS, Eaton DL, Al-Haik MS, Hussaini MY, Garmestani H, et al.
Enhancement of thermal and electrical properties of carbon nanotube polymer composites by
magnetic field processing. Journal of Applied Physics. 2003;94:6034-9.
[117] Li S, Qin Y, Shi J, Guo Z-X, Li Y, Zhu D. Electrical Properties of Soluble Carbon
Nanotube/Polymer Composite Films. Chemistry of Materials. 2005;17:130-5.
[118] Tamburri E, Orlanducci S, Terranova ML, Valentini F, Palleschi G, Curulli A, et al.
Modulation of electrical properties in single-walled carbon nanotube/conducting polymer
composites. Carbon. 2005;43:1213-21.
[119] Bauhofer W, Kovacs JZ. A review and analysis of electrical percolation in carbon
nanotube polymer composites. Composites Science and Technology. 2009;69:1486-98.
[120] Boudenne A, Ibos L, Fois M, Majesté JC, Géhin E. Electrical and thermal behavior of
polypropylene filled with copper particles. Composites Part A: Applied Science and
Manufacturing. 2005;36:1545-54.
[121] Grossiord N, Loos J, van Laake L, Maugey M, Zakri C, Koning CE, et al. High-
Conductivity Polymer Nanocomposites Obtained by Tailoring the Characteristics of Carbon
Nanotube Fillers. Advanced Functional Materials. 2008;18:3226-34.
[122] Sarvi A, Sundararaj U. Rheological percolation in polystyrene composites filled with
polyaniline-coated multiwall carbon nanotubes. Synthetic Metals. 2014;194:109-17.
[123] Yao S-H, Dang Z-M, Jiang M-J, Xu H-P, Bai J. Influence of aspect ratio of carbon
nanotube on percolation threshold in ferroelectric polymer nanocomposite. Applied Physics
Letters. 2007;91:212901.
[124] Eken AE, Tozzi EJ, Klingenberg DJ, Bauhofer W. A simulation study on the combined
effects of nanotube shape and shear flow on the electrical percolation thresholds of carbon
nanotube/polymer composites. Journal of Applied Physics. 2011;109:084342.
[125] George S, Sebastian MT. Three-phase polymer–ceramic–metal composite for
embedded capacitor applications. Composites Science and Technology. 2009;69:1298-302.
[126] Wessling B. New Insight into Organic Metal Polyaniline Morphology and Structure.
Polymers. 2010;2:786.
[127] Green AA, Hersam MC. Processing and properties of highly enriched double-wall
carbon nanotubes. Nat Nano. 2009;4:64-70.
[128] Ghatak S, Chakraborty G, Meikap AK, Woods T, Babu R, Blau WJ. Synthesis and
characterization of polyaniline/carbon nanotube composites. Journal of Applied Polymer
Science. 2011;119:1016-25.
[129] Jeon I-Y, Kang S-W, Tan L-S, Baek J-B. Grafting of polyaniline onto the surface of 4-
aminobenzoyl-functionalized multiwalled carbon nanotube and its electrochemical properties.
Journal of Polymer Science Part A: Polymer Chemistry. 2010;48:3103-12.
[130] Morávková Z, Trchová M, Tomšík E, Čechvala J, Stejskal J. Enhanced thermal
stability of multi-walled carbon nanotubes after coating with polyaniline salt. Polymer
Degradation and Stability. 2012;97:1405-14.
[131] Roth S, Graupner W. Conductive polymers: Evaluation of industrial applications.
Synthetic Metals. 1993;57:3623-31.
[132] Hino T, Taniguchi S, Kuramoto N. Syntheses of conductive adhesives based on epoxy
resin and polyanilines by using N-tert-butyl-5-methylisoxazolium perchlorate as a thermally

Page | 107
latent curing reagent. Journal of Polymer Science Part A: Polymer Chemistry. 2006;44:718-
26.
[133] Hosoda M, Hino T, Kuramoto N. Facile preparation of conductive paint made with
polyaniline/dodecylbenzenesulfonic acid dispersion and poly(methyl methacrylate). Polymer
International. 2007;56:1448-55.
[134] Bhadra S, Singha NK, Khastgir D. Semiconductive composites from ethylene 1-octene
copolymer and polyaniline coated nylon 6: Studies on mechanical, thermal, processability,
electrical, and EMI shielding properties. Polymer Engineering & Science. 2008;48:995-1006.
[135] Kausar A, Rafique I, Muhammad B. Review of Applications of Polymer/Carbon
Nanotubes and Epoxy/CNT Composites. Polymer-Plastics Technology and Engineering.
2016;55:1167-91.
[136] Landi BJ, Raffaelle RP, Heben MJ, Alleman JL, VanDerveer W, Gennett T. Single
wall carbon nanotube-Nafion composite actuators. Nano Letters. 2002;2:1329-32.
[137] Mottaghitalab V, Xi B, Spinks GM, Wallace GG. Polyaniline fibres containing single
walled carbon nanotubes: Enhanced performance artificial muscles. Synthetic Metals.
2006;156:796-803.
[138] Hyder MN, Lee SW, Cebeci FÇ, Schmidt DJ, Shao-Horn Y, Hammond PT. Layer-by-
layer assembled polyaniline nanofiber/multiwall carbon nanotube thin film electrodes for
high-power and high-energy storage applications. ACS nano. 2011;5:8552-61.
[139] Yun S, Kim J. Sonication time effect on MWNT/PANI-EB composite for hybrid
electro-active paper actuator. Synthetic Metals. 2007;157:523-8.
[140] Rajesh, Ahuja T, Kumar D. Recent progress in the development of nano-structured
conducting polymers/nanocomposites for sensor applications. Sensors and Actuators B:
Chemical. 2009;136:275-86.
[141] Bai H, Chen Q, Li C, Lu C, Shi G. Electrosynthesis of polypyrrole/sulfonated
polyaniline composite films and their applications for ammonia gas sensing. Polymer.
2007;48:4015-20.
[142] Irimia-Vladu M, Fergus JW. Suitability of emeraldine base polyaniline-PVA composite
film for carbon dioxide sensing. Synthetic Metals. 2006;156:1401-7.
[143] Ferrer-Anglada N, Kaempgen M, Roth S. Transparent and flexible carbon
nanotube/polypyrrole and carbon nanotube/polyaniline pH sensors. physica status solidi (b).
2006;243:3519-23.
[144] Sadek AZ, Wlodarski W, Shin K, Kaner RB, Kalantar-zadeh K. A layered surface
acoustic wave gas sensor based on a polyaniline/In 2 O 3 nanofibre composite.
Nanotechnology. 2006;17:4488.
[145] Sadek AZ, Wlodarski W, Shin K, Kaner RB, Kalantar-zadeh K. A polyaniline/WO3
nanofiber composite-based ZnO/64° YX LiNbO3 SAW hydrogen gas sensor. Synthetic
Metals. 2008;158:29-32.
[146] Ali SR, Ma Y, Parajuli RR, Balogun Y, Lai WYC, He H. A Nonoxidative Sensor
Based on a Self-Doped Polyaniline/Carbon Nanotube Composite for Sensitive and Selective
Detection of the Neurotransmitter Dopamine. Analytical Chemistry. 2007;79:2583-7.
[147] Sudha JD, Sivakala S, Patel K, Radhakrishnan Nair P. Development of electromagnetic
shielding materials from the conductive blends of polystyrene polyaniline-clay
nanocomposite. Composites Part A: Applied Science and Manufacturing. 2010;41:1647-52.
[148] Geetha S, Satheesh Kumar KK, Rao CRK, Vijayan M, Trivedi DC. EMI shielding:
Methods and materials—A review. Journal of Applied Polymer Science. 2009;112:2073-86.
[149] Wang Y, Jing X. Intrinsically conducting polymers for electromagnetic interference
shielding. Polymers for Advanced Technologies. 2005;16:344-51.

Page | 108
[150] Grimes CA, Mungle C, Kouzoudis D, Fang S, Eklund PC. The 500 MHz to 5.50 GHz
complex permittivity spectra of single-wall carbon nanotube-loaded polymer composites.
Chemical Physics Letters. 2000;319:460-4.
[151] Lee CY, Song HG, Jang KS, Oh EJ, Epstein AJ, Joo J. Electromagnetic interference
shielding efficiency of polyaniline mixtures and multilayer films. Synthetic Metals.
1999;102:1346-9.
[152] Koul S, Chandra R, Dhawan SK. Conducting polyaniline composite for ESD and EMI
at 101 GHz. Polymer. 2000;41:9305-10.
[153] Saini P, Choudhary V, Singh BP, Mathur RB, Dhawan SK. Polyaniline–MWCNT
nanocomposites for microwave absorption and EMI shielding. Materials Chemistry and
Physics. 2009;113:919-26.
[154] Makeiff DA, Huber T. Microwave absorption by polyaniline–carbon nanotube
composites. Synthetic Metals. 2006;156:497-505.
[155] Han MS, Lee YK, Kim WN, Lee HS, Joo JS, Park M, et al. Effect of multi-walled
carbon nanotube dispersion on the electrical, morphological and rheological properties of
polycarbonate/multi-walled carbon nanotube composites. Macromolecular Research.
2009;17:863-9.
[156] Ghasemi H, Sundararaj U. Electrical properties of in situ polymerized
polystyrene/polyaniline composites: The effect of feeding ratio. Synthetic Metals.
2012;162:1177-83.
[157] Pérez R, Pinto NJ, Johnson Jr AT. Influence of temperature on charge transport and
device parameters in an electrospun hybrid organic/inorganic semiconductor Schottky diode.
Synthetic Metals. 2007;157:231-4.
[158] Rivera R, Pinto NJ. Schottky diodes based on electrospun polyaniline nanofibers:
Effects of varying fiber diameter and doping level on device performance. Physica E: Low-
dimensional Systems and Nanostructures. 2009;41:423-6.
[159] Pinto NJ, Johnson AT, MacDiarmid AG, Mueller CH, Theofylaktos N, Robinson DC,
et al. Electrospun polyaniline/polyethylene oxide nanofiber field-effect transistor. Applied
Physics Letters. 2003;83:4244-6.
[160] Tseng RJ, Huang J, Ouyang J, Kaner RB, Yang. Polyaniline Nanofiber/Gold
Nanoparticle Nonvolatile Memory. Nano Letters. 2005;5:1077-80.
[161] Thomas SC, Ren X, Gottesfeld S, Zelenay P. Direct methanol fuel cells: progress in
cell performance and cathode research. Electrochimica Acta. 2002;47:3741-8.
[162] Kumar A, Mishra A, Awasthi K, Kumar V. Thermal Stability and Electrical Properties
of Polyaniline Synthesized by Oxidative Polymerization Method. Macromolecular Symposia.
2015;357:168-72.
[163] Kumar A, Jangir LK, Kumari Y, Kumar M, Kumar V, Awasthi K. Optical and
Structural Study of Polyaniline/Polystyrene Composite Films. Macromolecular Symposia.
2015;357:229-34.
[164] Wang Z, Zhu Z-Z, Shi J, Li H-L. Electrocatalytic oxidation of formaldehyde on
platinum well-dispersed into single-wall carbon nanotube/polyaniline composite film.
Applied Surface Science. 2007;253:8811-7.
[165] Shi J, Wang Z, Li H-l. Electrochemical fabrication of polyaniline/multi-walled carbon
nanotube composite films for electrooxidation of methanol. Journal of Materials Science.
2007;42:539-44.
[166] Shi J, Zhang Z-Y, Hu Y-Q, Hua Y-X. Incorporation of 4-aminobenzene functionalized
multi-walled carbon nanotubes in polyaniline for application in formic acid electrooxidation.
Journal of Applied Polymer Science. 2010;118:1815-20.

Page | 109
[167] Manesh KM, Santhosh P, Gopalan AI, Lee K-P. Electrocatalytic Dioxygen Reduction
at Glassy Carbon Electrode Modified with Polyaniline Grafted Multiwall Carbon Nanotube
Film. Electroanalysis. 2006;18:1564-71.
[168] Chaudhuri SK, Lovley DR. Electricity generation by direct oxidation of glucose in
mediatorless microbial fuel cells. Nat Biotech. 2003;21:1229-32.
[169] Qiao Y, Li CM, Bao S-J, Bao Q-L. Carbon nanotube/polyaniline composite as anode
material for microbial fuel cells. Journal of Power Sources. 2007;170:79-84.
[170] Akbari E, Buntat Z. Benefits of using carbon nanotubes in fuel cells: a review.
International Journal of Energy Research. 2017;41:92-102.
[171] Tang L, Duan F, Chen M. Silver nanoparticle decorated polyaniline/multiwalled super-
short carbon nanotube nanocomposites for supercapacitor applications. RSC Advances.
2016;6:65012-9.
[172] Oueiny C, Berlioz S, Perrin F-X. Carbon nanotube–polyaniline composites. Progress in
Polymer Science. 2014;39:707-48.
[173] Singu BS, Male U, Srinivasan P, Yoon KR. Preparation and performance of
polyaniline–multiwall carbon nanotubes–titanium dioxide ternary composite electrode
material for supercapacitors. Journal of Industrial and Engineering Chemistry.
[174] Yuksel R, Durucan C, Unalan HE. Ternary nanocomposite SWNT/WO3/PANI thin
film electrodes for supercapacitors. Journal of Alloys and Compounds. 2016;658:183-9.
[175] Yu T, Zhu P, Xiong Y, Chen H, Kang S, Luo H, et al. Synthesis of microspherical
polyaniline/graphene composites and their application in supercapacitors. Electrochimica
Acta. 2016;222:12-9.
[176] Lin H, Li L, Ren J, Cai Z, Qiu L, Yang Z, et al. Conducting polymer composite film
incorporated with aligned carbon nanotubes for transparent, flexible and efficient
supercapacitor. Scientific Reports. 2013;3:1353.
[177] Liu H, Wang Y, Gou X, Qi T, Yang J, Ding Y. Three-dimensional
graphene/polyaniline composite material for high-performance supercapacitor applications.
Materials Science and Engineering: B. 2013;178:293-8.
[178] Singh V, Mohan S, Singh G, Pandey PC, Prakash R. Synthesis and characterization of
polyaniline–carboxylated PVC composites: Application in development of ammonia sensor.
Sensors and Actuators B: Chemical. 2008;132:99-106.
[179] Fu Y, Elsenbaumer RL. Thermochemistry and Kinetics of Chemical Polymerization of
Aniline Determined by Solution Calorimetry. Chemistry of Materials. 1994;6:671-7.
[180] Tantawy HR, Aston DE, Smith JR, Young JL. Comparison of Electromagnetic
Shielding with Polyaniline Nanopowders Produced in Solvent-Limited Conditions. ACS
Applied Materials & Interfaces. 2013;5:4648-58.
[181] Zhao Z, Yang Z, Hu Y, Li J, Fan X. Multiple functionalization of multi-walled carbon
nanotubes with carboxyl and amino groups. Applied Surface Science. 2013;276:476-81.
[182] Wu M, Wang L, Zhao F, Zeng B. Ionic liquid polymer functionalized carbon
nanotubes-coated polyaniline for the solid-phase microextraction of benzene derivatives.
RSC Advances. 2015;5:99483-90.
[183] Sain PK, Goyal RK, Bhargava AK, Prasad YVSS. Thermal and dielectric behavior of
flexible polycarbonate/lead zirconate titanate composite system. Journal of Applied Polymer
Science. 2014;131:n/a-n/a.
[184] Sain PK, Goyal RK, Bhargava AK, Prasad YVSS. Thermal and electronic behaviour of
polycarbonate–copper nanocomposite system. Journal of Physics D: Applied Physics.
2013;46:455501.
[185] Stejskal J, Hlavata D, Holler P, Trchová M, Prokeš J, Sapurina I. Polyaniline prepared
in the presence of various acids: a conductivity study. Polymer international. 2004;53:294-
300.

Page | 110
[186] Sain PK, Goyal RK, Prasad YVSS, Jyoti, Sharma KB, Bhargava AK. Few-layer-
graphene/polycarbonate nanocomposites as dielectric and conducting material. Journal of
Applied Polymer Science. 2015;132:n/a-n/a.
[187] Mirghani MES, Kabbashi NA, Alam MZ, Qudsieh IY, Alkatib MaFR. Rapid Method
for the Determination of Moisture Content in Biodiesel Using FTIR Spectroscopy. Journal of
the American Oil Chemists' Society. 2011;88:1897-904.
[188] Hongxia J, Qiaoling L, Yun Y, Zhiwu G, Xiaofeng Y. Preparation and microwave
adsorption properties of core–shell structured barium titanate/polyaniline composite. Journal
of Magnetism and Magnetic Materials. 2013;332:10-4.
[189] Wang J, Wang J, Yang Z, Wang Z, Zhang F, Wang S. A novel strategy for the
synthesis of polyaniline nanostructures with controlled morphology. Reactive and Functional
Polymers. 2008;68:1435-40.
[190] John H, Biju Kumar S, Mathew KT, Joseph R. Effect of drying conditions on
microwave conductivity of polyaniline. Journal of Applied Polymer Science. 2002;83:2008-
12.
[191] Wang Y, Chen K, Li T, Li H, Zeng R, Zhang R, et al. Soluble polyaniline nanofibers
prepared via surfactant-free emulsion polymerization. Synthetic Metals. 2014;198:293-9.
[192] Su B, Tong Y, Bai J, Lei Z, Wang K, Mu H, et al. Acid doped polyaniline nanofibers
synthesized by interfacial polymerization.
[193] Riaz U, Ahmad S, Ashraf SM. Effect of Dopant on the Nanostructured Morphology of
Poly (1-naphthylamine) Synthesized by Template Free Method. Nanoscale Research Letters.
2007;3:45.
[194] Wang Y, Jing X. Formation of Polyaniline Nanofibers: A Morphological Study. The
Journal of Physical Chemistry B. 2008;112:1157-62.
[195] Wolter A, Rannou P, Travers JP, Gilles B, Djurado D. Model for aging in HCl-
protonated polyaniline: Structure, conductivity, and composition studies. Physical Review B.
1998;58:7637-47.
[196] Yue J, Epstein AJ, Zhong Z, Gallagher PK, Macdiarmid AG. Thermal stabilities of
polyanilines. Synthetic Metals. 1991;41:765-8.
[197] Neoh KG, Kang ET, Tan KL. Thermal degradation of leucoemeraldine, emeraldine
base and their complexes. Thermochimica Acta. 1990;171:279-91.
[198] Wei Y, Hsueh KF. Thermal analysis of chemically synthesized polyaniline and effects
of thermal aging on conductivity. Journal of Polymer Science Part A: Polymer Chemistry.
1989;27:4351-63.
[199] Bellucci F, Khamis I, Senturia S, Latanision R. Moisture effects on the electrical
conductivity of kapton polyimide. Journal of the Electrochemical Society. 1990;137:1778-84.
[200] Babu VJ, Vempati S, Ramakrishna S. Conducting polyaniline-electrical charge
transportation. 2013.
[201] Zhang D. On the conductivity measurement of polyaniline pellets. Polymer Testing.
2007;26:9-13.
[202] Borah R, Banerjee S, Kumar A. Surface functionalization effects on structural,
conformational, and optical properties of polyaniline nanofibers. Synthetic Metals.
2014;197:225-32.
[203] Reda SM, Al-Ghannam SM. Synthesis and Electrical Properties of Polyaniline
Composite with Silver Nanoparticles. Advances in Materials Physics and Chemistry.
2012;Vol.02No.02:7.
[204] Sain PK, Goyal RK, Bhargava AK, Prasad YVSS. Thermal and electronic behaviour of
polycarbonate–copper nanocomposite system. Journal of Physics D: Applied Physics.
2013;46:455501-8.

Page | 111
[205] Wu T-M, Lin Y-W. Doped polyaniline/multi-walled carbon nanotube composites:
Preparation, characterization and properties. Polymer. 2006;47:3576-82.
[206] Peng C, Zhang S, Jewell D, Chen GZ. Carbon nanotube and conducting polymer
composites for supercapacitors. Progress in Natural Science. 2008;18:777-88.
[207] Saini P, Arora M, Gupta G, Gupta BK, Singh VN, Choudhary V. High permittivity
polyaniline-barium titanate nanocomposites with excellent electromagnetic interference
shielding response. Nanoscale. 2013;5:4330-6.
[208] Park O-K, Jeevananda T, Kim NH, Kim S-i, Lee JH. Effects of surface modification on
the dispersion and electrical conductivity of carbon nanotube/polyaniline composites. Scripta
Materialia. 2009;60:551-4.
[209] Yılmaz F, Küçükyavuz Z. Conducting polymer composites of multiwalled carbon
nanotube filled doped polyaniline. Journal of applied polymer science. 2009;111:680-4.
[210] Bao J, Tie C, Xu Z, Suo Z, Zhou Q, Hong J. A Facile Method for Creating an Array of
Metal-Filled Carbon Nanotubes. Advanced Materials. 2002;14:1483-6.
[211] Samukhin AN, Prigodin VN, Jastrabík L. Critical Percolation and Transport in Nearly
One Dimension. Physical Review Letters. 1997;78:326-9.
[212] Silva WM, Ribeiro H, Seara LM, Calado HDR, Ferlauto AS, Paniago RM, et al.
Surface properties of oxidized and aminated multi-walled carbon nanotubes. Journal of the
Brazilian Chemical Society. 2012;23:1078-86.
[213] Al-Ghamdi A, Al-Saigh ZY. Surface and thermodynamic characterization of
conducting polymers by inverse gas chromatography: I. Polyaniline. Journal of
Chromatography A. 2002;969:229-43.
[214] Li D, Kaner RB. Shape and Aggregation Control of Nanoparticles: Not Shaken, Not
Stirred. Journal of the American Chemical Society. 2006;128:968-75.
[215] Qiu W, Ma L, Gan M, Bai Y, Fu D, Li Z, et al. Preparation and characterization of
polyaniline nanofiber colloids. Polymer Engineering & Science. 2013;53:1631-6.
[216] Trchová M, Šeděnková I, Tobolková E, Stejskal J. FTIR spectroscopic and
conductivity study of the thermal degradation of polyaniline films. Polymer Degradation and
Stability. 2004;86:179-85.
[217] Zheng W, Angelopoulos M, Epstein AJ, MacDiarmid AG. Concentration Dependence
of Aggregation of Polyaniline in NMP Solution and Properties of Resulting Cast Films.
Macromolecules. 1997;30:7634-7.
[218] Biscaro RS, Rezende MC, Faez R. Reactive doping of PAni–CSA and its use in
microwave absorbing materials. Polymers for Advanced Technologies. 2009;20:28-34.
[219] Sharma BK, Khare N, Sharma R, Dhawan SK, Vankar VD, Gupta HC. Dielectric
behavior of polyaniline–CNTs composite in microwave region. Composites Science and
Technology. 2009;69:1932-5.
[220] Wang Y, Rubner MF. An investigation of the conductivity stability of acid-doped
polyanilines. Synthetic Metals. 1992;47:255-66.
[221] Quillard S, Louarn G, Lefrant S, Macdiarmid AG. Vibrational analysis of polyaniline:
A comparative study of leucoemeraldine, emeraldine, and pernigraniline bases. Physical
Review B. 1994;50:12496-508.
[222] Yang D, Mattes BR. Polyaniline emeraldine base in N-methyl-2-pyrrolidinone
containing secondary amine additives: B. Characterization of solutions and thin films.
Synthetic Metals. 2002;129:249-60.
[223] Palaniappan S, Narayana BH. Temperature effect on conducting polyaniline salts:
Thermal and spectral studies. Journal of Polymer Science Part A: Polymer Chemistry.
1994;32:2431-6.
[224] Bhadra S, Khastgir D, Singha NK, Lee JH. Progress in preparation, processing and
applications of polyaniline. Progress in Polymer Science. 2009;34:783-810.

Page | 112
[225] Chapman P, Loh XX, Livingston AG, Li K, Oliveira TAC. Polyaniline membranes for
the dehydration of tetrahydrofuran by pervaporation. Journal of Membrane Science.
2008;309:102-11.
[226] Abdiryim T, Jamal R, Nurulla I. Doping effect of organic sulphonic acids on the solid-
state synthesized polyaniline. Journal of Applied Polymer Science. 2007;105:576-84.
[227] Sniechowski M, Djurado D, Dufour B, Rannou P, Pron A, Luzny W. Direct analysis of
lamellar structure in polyaniline protonated with plasticizing dopants. Synthetic Metals.
2004;143:163-9.

Page | 113
List of publications from this research work
Anil Kumar, Lokesh Kumar Jangir, Yogita Kumari, Manoj Kumar, Vinod Kumar,
Kamlendra Awasthi,“Electrical behavior of dual-morphology polyaniline”, Journal of
Applied Polymer Science 133 (2016) 44091 DOI: 10.1002/app.44091
Anil Kumar, Vinod Kumar, Kamlendra Awasthi, “Polyaniline-carbon nanotube
composites: Preparation Methods, Properties and Applications”, Polymer-Plastics
Technology and Engineering, (2017), DOI: 10.1080/03602559.2017.1300817
Anil Kumar, Vinod Kumar, Manoj Kumar, Kamlendra Awasthi, “Synthesis and
characterization of hybrid PANI/MWCNT nanocomposites for EMI applications”,
Polymer Composites (2017) DOI: 10.1002/pc.24418
Anil Kumar, Vinod Kumar, Manoj Kumar, Kamlendra Awasthi, “Polyaniline in N,
N’-dimethyl propylene urea containing secondary amine additive and properties of
resulting cast films” (2017) (Journal of Polymer Science Part A: Polymer Chemistry)
(submitted)
Other publications
Anil Kumar, Lokesh Kumar Jangir, Yogita Kumari, Manoj Kumar, Vinod Kumar,
Kamlendra Awasthi, “Optical and Structural Study of Polyaniline/Polystyrene
Composite Films”, Macromolecular Symposia 357 (2015) 229-234 DOI:
10.1002/masy.201500039
Anil Kumar, Amit Mishra, Kamlendra Awasthi,Vinod Kumar “Thermal Stability and
Electrical Properties of Polyaniline Synthesized by Oxidative Polymerization
Method”, Macromolecular Symposia 357 (2015) 168-172
DOI:10.1002/masy.201400218
Lokesh Kumar Jangir, Yogita Kumari, Anil Kumar, Manoj Kumar, Kamlendra
Awasthi, “Investigation of luminescence and structural properties of ZnO
nanoparticles, synthesized with different precursors”, Materials Chemistry Frontiers
(2017), (accepted), DOI: 10.1039/C7QM00058H
Yogita Kumari, Lokesh Kumar Jangir, Anil Kumar, Manoj Kumar, Kamlendra
Awasthi, “Investigation of thermal stability of TiO2 nanoparticles using 1-thioglycerol
as capping agent”, Solid State Communications 263 (2017) 1-5