synthesis report: findings from the needs assessment...
TRANSCRIPT
1
“QUALITY TEACHERS FOR EFA”
UNESCO-CHINA FUNDS-IN-TRUST PROJECT (CFIT) ENHANCING TEACHER EDUCATION FOR
BRIDGING THE EDUCATION QUALITY GAP IN AFRICA
SYNTHESIS REPORT: FINDINGS FROM THE NEEDS ASSESSMENT PHASE CONGO, DR CONGO, LIBERIA, TANZANIA, UGANDA
UNESCO Headquarters Paris, September 2014
2
Contents Introduction ................................................................................................................................................................... 3
I. The CFIT project .............................................................................................................................................. 3 II. Objectives ........................................................................................................................................................... 3 III. Scope and limitations ................................................................................................................................ 4 IV. Methodology ................................................................................................................................................. 4
Part 1: Key findings ..................................................................................................................................................... 5 Chapter 1: Socio-economic and education contexts .................................................................................. 5
1.1 Introduction .................................................................................................................................................. 5 1.2 Key indicators ............................................................................................................................................... 5 1.3 Conclusion ...................................................................................................................................................... 8
Chapter 2: Teacher related issues ..................................................................................................................... 9 2.1 Introduction .................................................................................................................................................. 9 2.2 Teacher policies and planning ............................................................................................................... 9 2.3 Teacher education ..................................................................................................................................... 10 2.4 Teacher management: recruitment, deployment, attrition, and absenteeism, motivation ........................................................................................................................................................... 12 2.5 Conclusion from the comparative analysis ..................................................................................... 14
Part 2: Experience and lessons learnt from the recent needs assessment process ......................... 15 Chapter 1: Key steps ............................................................................................................................................. 15
1.1 Introduction ................................................................................................................................................ 15 1.2 Preparing the needs assessment phase ............................................................................................ 15 1.3 Conducting the needs assessment at country level ..................................................................... 15 1.4 Finalization of the needs assessment report and the way ahead ........................................... 16
Chapter 2: Key factors that determine the effectiveness of the needs assessment phase and beyond ....................................................................................................................................................................... 17
Part 3: Conclusion ...................................................................................................................................................... 19
3
Introduction
I. The CFIT project Within the framework of UNESCO’s South-South cooperation and the financial contributions through the UNESCO-Funds-In-Trust by the People’s Republic of China (PRC) to accelerate progress towards the attainment of quality-related EFA goals and the education-related Millennium Development Goals (MDGs), a cooperation framework, entitled “QUALITY TEACHERS FOR EFA: ENHACING TEACHER TRAINING FOR BRIDGING THE QUALITY GAP IN AFRICA (2012-2016)” was established in October 2012.
The specific objective of the UNESCO-China-Funds-in-Trust (CFIT project) is to support the target countries in enhancing the capacity of their teacher training institutions (TTIs):
• First, by improving the capacity of existing key TTIs in each benefiting country to provide quality pre-service programmes, so as to increase the supply of qualified teachers, particularly through ICT-supported distance training programmes;
• Second, by strengthening the capacity of key TTIs in supporting in-service teachers’ continuous professional development, particularly through blended learning modalities and programmes scaling up by successful ICT-support innovations in this domain;
• Third, by enhancing the capacity of key TTIs to equip teacher trainers and teachers with the competency of using ICT to improve the quality of teaching and learning;
• And finally by supporting networks of TTIs for knowledge sharing among policymakers, institutional leaders and other stakeholders on effective strategies and practices.
The project targets eight countries during the four years. Three (Côte d’Ivoire, Ethiopia and Namibia) joined the project in late 2012 and have started the first year of the implementation. The project welcomed the other five countries – Congo, DRC, Liberia, Tanzania, Uganda – in October 2013.
This document synthesises the results of the needs assessment processes carried out in the latter five countries in February 2014. These processes entailed a series of meetings with the main stakeholders, a dedicated report (which is available online from the CFIT project website), and a validation workshop, which took place in Paris in April 2014.
II. Objectives
This synthesis report aims at consolidating the key findings of the five needs assessment reports, which cover the status of the teacher sub-sector and naturally the perceived needs in teacher training, both from a qualitative and quantitative perspective. Also, this report is an opportunity to draw some lessons for future activities.
4
The specific objectives of this synthesis are:
- To describe and analyze the diverse socio-economic and educational contexts in Congo, DRC, Liberia, Tanzania, and Uganda;
- To identify and analyze key teacher issues and draw some commonalities and divergences across the five countries;
- To present the key findings from the needs assessment phase; - To draw some lessons for future UNESCO projects of this nature.
III. Scope and limitations
The needs assessment process had a reduced scope and ambition: as the area of teachers is very well documented in these countries, the process was purely aimed at summarizing the key findings from previous studies or reviews and identifying in particular the persistent needs of the teacher subsector that could be addressed by strengthening the institutional capacities of TTIs.
It should be noted that, although the structure of the needs assessment reports of each country is very similar, the presentation of data and the types of information included in each country’s needs assessment report are diverse. In addition, some countries reported the challenges in obtaining precise and updated data about the education sector and teachers in particular. In this report, when it was deemed necessary for the purpose of comparison, numerical data from the databanks of UIS and the World Bank were consulted. However, the majority of the contents of this report draws on the information included in the five needs assessment reports.
IV. Methodology
The following methods were used to gather information for this report:
- A desk review of the five needs assessment reports; - A desk review of the mission reports; and - Direct consultations with the five country project teams during the April 2014 meeting at
UNESCO HQ.
Followed by a brief introduction, the report is organized in three parts. PART 1 presents key findings and analysis of the country needs assessment phase. Chapter 1 introduces a comparative analysis of the wider socio-economic contexts of the five countries, Chapter 2 identifies and analyses key teacher issues, as well as draws some commonalities and divergence.
PART 2 focuses on salient experience and lessons learnt drawing upon the needs assessment process. Chapter 1 describes key steps to initiate the needs assessment, Chapter 2 presents key factors that determine effectiveness of the needs assessment phase and beyond, followed by a brief conclusion.
PART 3 serves as the conclusion of this report.
5
Part 1: Key findings
Chapter 1: Socio-economic and education contexts
1.1 Introduction
This part highlights some key commonalities and differences across countries in relation to their socio-economic and educational contexts. Particular attention is given to the identification of the key issues related to the quality of the education provision in the five countries. To allow for more accurate comparisons, numerical data of the five countries are primarily drawn from the databanks of the UIS and the World Bank.
1.2 Key indicators
Table 1 shows key demographic and education indicators. A number of findings arise from the simple observation of the diverse country values.
A first finding is that the total population of the five countries diverse – DRC’s population was almost two times that of Uganda and 16 times that of Congo and Liberia. The annual population growth rate and the percentages of young population and primary school children of the total population were similar in the five countries, which implies that, in absolute terms, DRC, Tanzania, and Uganda have a higher demand for education.
A second important finding relates to out of school children, which is particularly relevant in the context of EFA. It is worth noting that Liberia and DRC had significantly higher percentages of out of school primary school age children, this may be due to the fact that the two countries have experienced devastating civil wars in recent decades, that the status of the countries is still volatile and that many infrastructure and systems are still to be rebuilt.

6
Table 1: Key demographic and education indicators Total
population (2012)
Annual population growth (%) (2012)
Population 14 years old or younger (2012) - % of the total population
Primary school age population (2013); % of the total population
Primary NER*
OOSC** of primary school age (% of the total primary school age population, based on 2013 level)
Congo 4,337,051 2.6 42% 691,894 (15.6%) 90.17 (2012) 56,264 (8%) (2012)
DRC 65,705,093 2.7 45% 11,121,325 (16.5%)
73.2^ 3,500,000^^ (31%) (2011/2012)
Liberia 4,190,435 2.7 43% 699,327 (16.3%) 40.62 (2011) 389 259 (56%) (2011)
Tanzania 47,783,107 3 45% 9,195,801 (18.8%)
97.59 (2007) 168 478 (2%) (2008)
Uganda 36,345,860 3.4 49% 7,880,832 (21%)
90.92 (2011) 662 974 (8%) (2011)
Source: UIS Data Centre (as of 19 May 2014) http://data.uis.unesco.org/, The World Bank Data (as of 11 June 2014) http://data.worldbank.org/indicator/SP.POP.0014.TO.ZS *NER = Net enrollment rate **OOSC = Out of school children ^Data from the DRC Country Project Team ^^ Data from MEPSP/UNICEF/DFID Table 2 presents a set of key indicators related to teachers. The overall size of the teaching force varies greatly across countries, as it could be expected in light of the diverse size of the school-age children population. Irrespective of the total size of the teaching body, what really matters is its quality and the conditions under which they teach – in particular the ratio of students per teacher. Liberia has the lowest pupil-teacher ratio among the five countries, 26.8:1, whereas Uganda has the highest – approximately 47.8:1.
An interesting observation is found in the percentage of trained teachers. In UIS data, the percentage of trained primacy school teachers (according to national standards) was quite high in the countries (with the exception of Liberia). However, it should be noted that countries also expressed more worrying observations. For example, Liberia’s needs assessment report states that 94% of the teachers are either not trained or lowly trained; in the DRC’s needs assessment report, it is stated that although over 90% of the teachers are qualified according to national standards, the teachers’ professional competencies are weak – only 36% of the teachers are proficient in writing. Congo and Tanzania also made similar observations, indicating that even the ‘qualified teachers’ have actually inadequate skills and competencies.
The main reason for the lack of professional skills of ‘qualified teachers’ is obviously related to the poor quality of initial training. For instance, in Liberia, the current main teacher training course used in the country – a nine-month course called the ‘C-certificate’ to train primary level teachers – is lacking appropriate content and is outdated. The lack of attractiveness of the teaching profession in these countries also results in poorly qualified candidates entering TTIs. For example, in Tanzania, TTIs had to lower the admission requirement of teacher trainees to cope with the

7
growing needs of teachers. In conclusion, there is a need for the countries to ensure that the ‘qualified’ teachers are actually ‘quality’ teachers.
Table 2: Indicators on teachers Total primary
school teachers Pupil-teacher ratio, primary school
% of trained primary school teachers
Congo 16 527 (2012)
44.4:1 (2012)
80.3 (2012)
DRC 345 486 (2012)
34.7:1 (2012)
93.5 (2012)
Liberia 25 137 (2011)
26.8:1 (2012)
56.4 (2011)
Tanzania 180 987 (2012)
45.6:1 (2012)
96.6 (2012)
Uganda 169 503 (2011)
47.8:1 (2011)
94.8 (2011)
Source: UIS Data Centre (as of 19 May 2014) http://data.uis.unesco.org/ Quality of education, and of teacher training, may have to do with funding, among other things, which is not only linked to the wealth of each country, but also the public policies in place. Table 3 shows that, in terms of GDP per capita, Congo is the richest country among the five. Its GDP per capita was almost 5 times of that of Liberia, and 12 times higher than DRC’s.
It is also worth noting that, having the lowest GDP per capita, DRC also spent the lowest percentage of GDP per capita on each primary student, while the opposite is true for Congo – Congo’s spending on each primacy student in USD was approximately 33 times of that of DRC. In addition of being the country with the lowest GDP per capita, DRC is also the country spending the least in education, both in absolute and relative in relative terms, per student: USD 11.6 per student or 4.9% of the per capita GDP. The opposite is true for Congo, with the highest expenditure in education both in absolute and relative terms.
Table 3: GDP and government expenditure on education GDP per
capita (current US$) (2012)
GDP in billion (2012)
Public expenditure on education as % of total government expenditure
Government expenditure per primary student as % of GDP per capita
Government expenditure per primary student in constant US$
Congo 3,154 13.68 29.02 (2010)
11.2 (2010)
$381.5 (2010)
DRC 262 17.20 8.91 (2010)
4.9 (2010)
$11.6 (2010)
Liberia 414 1.73 *25 (2014) N/A N/A Tanzania 609 28.24 21.16
(2010) 10.9 (2009)
$53.6 (2009)
Uganda 551 20.03 14.02 (2012)
7.6 (2012)
$37.1 (2012)
Source: The World Bank (Data Bank) (as of 19 May 2014) http://data.worldbank.org/indicator/ UIS Data Centre (as of 19 May 2014) http://stats.uis.unesco.org * Data from the national needs assessment report.
8
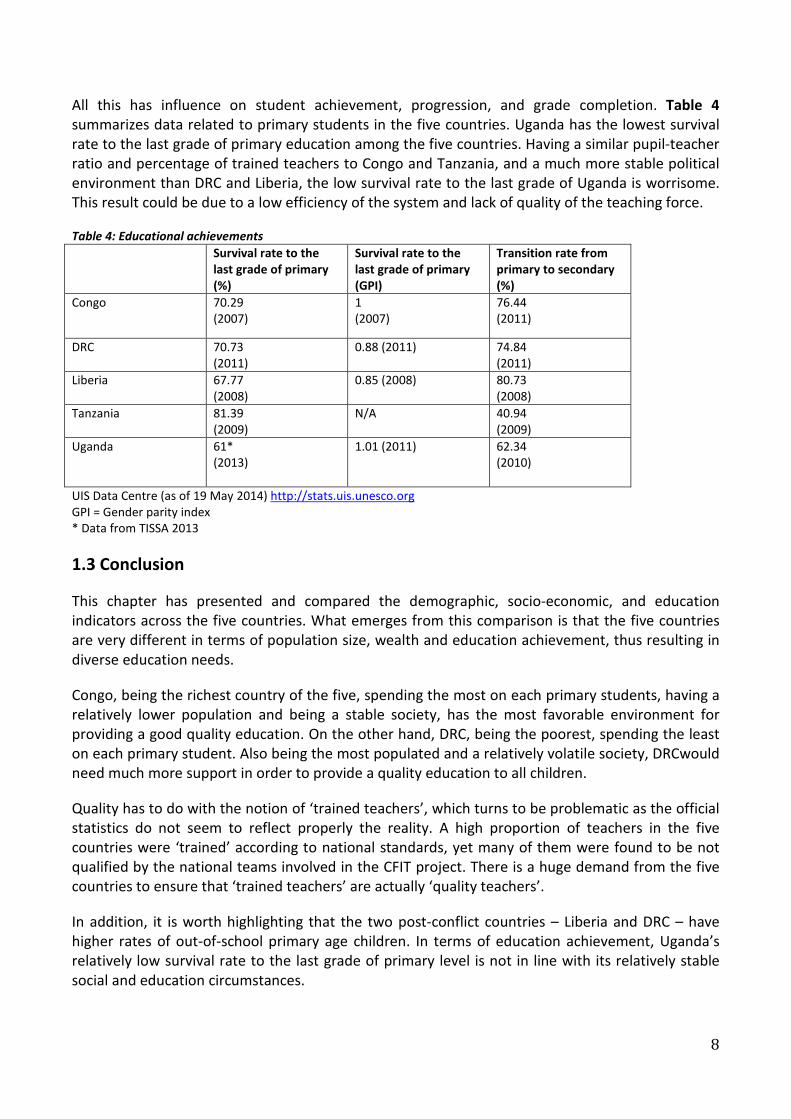
All this has influence on student achievement, progression, and grade completion. Table 4 summarizes data related to primary students in the five countries. Uganda has the lowest survival rate to the last grade of primary education among the five countries. Having a similar pupil-teacher ratio and percentage of trained teachers to Congo and Tanzania, and a much more stable political environment than DRC and Liberia, the low survival rate to the last grade of Uganda is worrisome. This result could be due to a low efficiency of the system and lack of quality of the teaching force.
Table 4: Educational achievements Survival rate to the
last grade of primary (%)
Survival rate to the last grade of primary (GPI)
Transition rate from primary to secondary (%)
Congo 70.29 (2007)
1 (2007)
76.44 (2011)
DRC 70.73 (2011)
0.88 (2011) 74.84 (2011)
Liberia 67.77 (2008)
0.85 (2008) 80.73 (2008)
Tanzania 81.39 (2009)
N/A 40.94 (2009)
Uganda 61* (2013)
1.01 (2011) 62.34 (2010)
UIS Data Centre (as of 19 May 2014) http://stats.uis.unesco.org GPI = Gender parity index * Data from TISSA 2013
1.3 Conclusion
This chapter has presented and compared the demographic, socio-economic, and education indicators across the five countries. What emerges from this comparison is that the five countries are very different in terms of population size, wealth and education achievement, thus resulting in diverse education needs.
Congo, being the richest country of the five, spending the most on each primary students, having a relatively lower population and being a stable society, has the most favorable environment for providing a good quality education. On the other hand, DRC, being the poorest, spending the least on each primary student. Also being the most populated and a relatively volatile society, DRCwould need much more support in order to provide a quality education to all children.
Quality has to do with the notion of ‘trained teachers’, which turns to be problematic as the official statistics do not seem to reflect properly the reality. A high proportion of teachers in the five countries were ‘trained’ according to national standards, yet many of them were found to be not qualified by the national teams involved in the CFIT project. There is a huge demand from the five countries to ensure that ‘trained teachers’ are actually ‘quality teachers’.
In addition, it is worth highlighting that the two post-conflict countries – Liberia and DRC – have higher rates of out-of-school primary age children. In terms of education achievement, Uganda’s relatively low survival rate to the last grade of primary level is not in line with its relatively stable social and education circumstances.

9
Chapter 2: Teacher related issues
2.1 Introduction
Following the analysis of the socio-economic and education indicators, this chapter discusses key teacher issues identified a) in the five needs assessment reports, and b) in the scoping missions carried out in February 2014 in the five countries.
These teacher-related issues are fundamental factors for a quality provision in education. The analysis below unveils how they are intertwined with the broader issue of the unaddressed needs of quality teachers in the five countries and, indirectly, in which ways the CFIT project can help the beneficiary countries to tackle them. These issues have been grouped under three areas, namely teacher policies and planning, teacher education, and teacher management.
2.2 Teacher policies and planning
With the exception of Liberia, where there is no existing teacher policy (on licensure, recruitment, deployment, ascension or professional development), teacher policies are framed by wider education/civil servant policies. In Tanzania, the current teacher policy is the result of many education policy reforms in the past decades and was most recently updated in 2008 (Education Sector Development Plan 2008 – 2016), in view of the ‘adoption of a sector-wide approach, effective mobilization and coordination of international assistance, equitable and gender-sensitive access, robust monitoring, and outcome-based results’. In Uganda, the Education Service Act, the Public Service Act, and the Local Government Act 1997 aim to regularize the recruitment of teachers in government schools.
As usual, gaps can be observed between the stated policies and actual practices. For example, the Education and Training Policy 1995 in Tanzania defined in-service training as compulsory, yet the majority of government and non-government TTIs do not have the financial recourses to provide in-service training. In Uganda, although the government has tried to satisfy the staffing needs especially in primary and secondary schools, there is still a mismatch between the number of teachers a school is supposed to receive and the number of teachers it actually gets, e.g. in primacy schools, 37% of the schools have more teachers than they should receive, while 45.7% of schools are in deficit of teachers.
Determining the number of teachers needed for universal primary education (UPE) is important in teacher planning. In Uganda, it was estimated that from 2010 to 2025, 12,596 new government teachers and 6150 new private teachers will have to be recruited annually. In Tanzania, from 2012 to 2016, if the pupil-teacher ratio is to remain at 40:1, the annual new recruits stand at 12,344 for primary level. The other countries also reported huge number of new recruits needed if UPE is to be achieved in the coming years. In order to train a large amount of both pre- and in-service teachers more efficiently, using ICT in teacher training could be a solution.
10
2.3 Teacher education
2.3.1 Characteristics of teacher training
Management, policy, and funding
In the five countries, teacher training is provided by both government and non-government institutions. Pre-service training is usually more systematically organized than in-service training. Many international organisations or donors offer training in the five countries, e.g. USAID in Liberia or SIDA in Tanzania. In most cases, the government has the mandate to manage and govern all training courses, both offered by government and non-government institutions. However, according to the national teams, the reality is that training, particularly if provided by non-governmental actors, is barely coordinated and often ad-hoc. For example, DRC reported that the National Service of Training does not have the capacity to coordinate and manage teacher training projects conducted by different partners in the country: although USAID had trained some 5000 pre-service teachers at the request of the government, none of them have been recruited due to budget shortages, whereas a very high percentage of active teachers have received either very limited training or no training at all.
Countries have developed dedicated teacher training policies, with the exception of Liberia where a national teacher training policy does not exist for neither pre-service or in-service teachers –although teacher training institutes are in place. Tanzania also reported that there is not a comprehensive in-service training scheme, thus teachers feel that they are denied the right to professional development.
In all the five countries, external donors contribute to financing teacher training, therefore sustainability could be a problem and countries report that once the donors’ support phases out, there is no way the government could sustain the current level of training. National teams also complain about the constant shortage of financial resources for training, e.g. Congo stated that ‘no funding for training is provided at all’.
Content and methodology
Training contents cover mainly two areas: academic subjects and pedagogy. In Uganda, training curricula are developed by Kyambogo University; in Liberia, the content is less coordinated – scope of in-service training is determined by the capacity and/or credential level of individual teachers. A common complaint from the national teams is that current contents are outdated, not connected with teachers’ work and the reality of classrooms, not meeting teachers’ professional needs, and have no real impact to teachers’ work. This situation is especially salient in in-service training.
School practice is included in most of the pre-service training, lasting from one to a few weeks. Although countries reported that different methods are used for training: workshops, seminars, participatory approach etc., they also found that many training approaches are still of a ‘traditional style’ – lecture-centered leading to learning by memorization.

11
Duration and certification
In terms of pre-service training, including both primary and secondary education, the training duration ranges from one year to four years, depending on the previous qualification of the trainees.
Certification is usually managed and issued by the government, again with the exception of Liberia which lacks a national teacher certification system. A graduate trainee with a certification is seen as a qualified teacher according to national standards. However, as discussed in section 1.2, a qualified teacher is not necessarily a quality teacher.
2.3.2 Usage of ICT in teacher training
In all five countries’ needs assessment report, the national teams expressed that there is a high demand to integrate ICT in teacher training. Two basic criteria are needed to reach this goal: a) sufficient infrastructure and equipment, e.g. electricity, internet connection, computers; and b) a teacher training force which is capable of using ICT in teaching how to teach.
a) In terms of infrastructure and equipment, all five countries report unstable power supply, and a lack of affordable internet coverage. The problem is more severe in TTIs located in remote areas, such as in Liberia. As for equipment, all public institutions providing teacher training in Tanzania are equipped with ICT infrastructure. However, there are complains about both software and hardware being outdated. ICT infrastructure in Congo, DRC, and Liberia is scarcer. There are also cases of computer labs that are kept always locked for security reasons and therefore not used.
b) When it comes to whether teacher trainers are equipped to use ICT in their training, Tanzania and Uganda both have ICT training programs (e.g. computer literacy, ICT teaching materials development) for teacher trainers, as well as syllabus for integrating ICT in teacher training. In Congo, DRC, and Liberia teacher trainers are apparently less well prepared.
Yet the definition of ‘integrating ICT in teacher training’ is unclear: some institutions would consider having a projector in the classroom or a lab with computers sufficient to indicate such an integration, without paying any attention to whether the equipment is effectively used in meaningful ways to deliver teacher training.
2.3.3 The attractiveness of the teaching profession
In all five countries a similar trend can be observed: the teaching profession is not attractive to young people – it is often their ‘last choice’. This is mainly due to the following reasons:
- There is not a career ladder in place; - The benefits are not competitive, the salary is low, and/or does not come on time, if not
missed; - Working conditions are not desirable, especially in remote areas.
12
The low attractiveness of the teaching profession leads to inadequate intake of pre-service teachers. In Liberia, the lack of minimum requirements to enter the teaching profession also contributes to lowering the prestige of being a teacher and therefore the attractiveness of the profession. In Tanzania, the admission qualification had to be lowered to attract more teacher trainees. In both countries this has an impact on the profile of teacher trainees who will later become teachers.
There are ways and means to improve the prestige of the teaching profession, for instance, by increasing the salary scale and benefits, and promoting continuous development and linking it with promotion. However, a common obstacle countries face is the lack of funds for education, be that because other priorities in practice are considered to be of higher relevance than education, or simply because the overall public budget for education does not allow for significant teachers salary increases.
2.4 Teacher management: recruitment, deployment, attrition, and absenteeism, motivation
2.4.1 Recruitment
Ministries of education, ministries of finance, and/or ministries of public service are the main government entities in charge of teacher recruitment in the countries. The recruitment is usually based on a legislative framework, with the exception of Liberia which lacks it. There is not yet a system to manage the recruitment of teachers in Liberia, thus recruitment is ‘spontaneous’, the recruitment process can take from six months to five years. However, the government of Liberia has recently established an EMIS unit that compiles and analyses school data to project the demand for teachers. In other countries, the recruitment process includes estimation of new teachers needed, verification of the qualifications of the applicants, and allotment by the government. In some countries, interviews of the applicants are also part of the process.
2.4.2 Deployment
All countries face a common phenomenon: compared to rural areas, urban areas usually have better pupil/teacher ratios, more qualified teachers, and a relatively higher percentage of female teachers (in Congo, female teachers accounted for over 65% of the total teaching force in urban areas; in DRC, female teachers accounted for 40% of the teaching force in urban areas, and only 24% in rural areas). Countries also reported that teachers deployment was found to be random and not aiming at reducing the disparities between urban and rural areas.
Urban areas usually have better living conditions, transportation, and social services, therefore are more attractive to teachers. Uganda reported that even young people would like to ‘escape’ from their home towns in rural areas as soon as they can. To mitigate the situation, the Ugandan government introduced a hardship allowance of 20% of salary increment for teachers in the so-called ‘hard-to-reach’ areas in 2001.

13
2.4.3 Attrition
Attrition in the five countries is caused by the inability to fill the vacant posts caused by: retirement, illness, death, transferal to non-teaching posts, dismissal, and resignation. DRC reported massive attrition, mainly due to voluntary quitting because of bad working conditions and low salaries. Tanzania observed that younger teachers are more likely to leave the teaching profession than experienced ones. It was also found that the inability to fill the posts of staff reaching retirement age is the major reason of attrition in the primary level (52.4%) in Tanzania; while at the secondary level, voluntarily leaving the teaching profession accounted for 29% of the attrition. A possible reason is that teachers at the secondary level are of higher education level, therefore having higher chances of getting better career prospects in another sector or profession. In Uganda, the attrition rate is estimated to be at 4% at primary level, and 5% at secondary level.
2.4.4 Absenteeism
All countries reported high absenteeism. These are the main reasons: illnesses, demotivation, long hours of commuting, personal reasons (e.g. birth in the family) and providing private tutoring.
Rural or low-socioeconomic areas usually suffer higher teacher absenteeism, as the transportation and social services (banking, health) are usually less effective, if available at all, and would consume more of the teachers’ time.
Malaria and HIV/AIDS are the most common illnesses that lead to absenteeism. Also ageing can be a major factor – for instance, in DRC, 20% of the teaching force is over 50 years old and consequently with higher chances of health issues.
Low salaries or delay of payment not only lead to demotivation but also encourage teachers to take up extra tuition jobs to increase their income. In Tanzania, due to the high demand for science and mathematics teachers, some of these teachers absent themselves from their duty and devote their time to offer lessons in private schools. Some schools even become private tuition centres. This growing business is worsening the situation of teacher absenteeism and attrition.
National teams report that there is not an effective system for tracking and penalizing absent teachers. In Liberia, school administrators at local level do not possess the power or tools to effectively track and penalize a teacher; therefore, regardless of the number of absences a teacher may accumulate in a pay period, his or her salary is not affected. The national team of Uganda also stated that teacher absenteeism is not tracked or tackled effectively.

14
2.5 Conclusion from the comparative analysis
The five countries suffer from a quantity and quality gap in teachers: not only they have high pupil to teacher ratios (with the exception of Liberia) but also important percentages of out of school children; in terms of quality, they have relatively high percentages of officially trained teachers, yet there is an issue of teaching quality.
These problems stem from some common causes in these five countries: teacher training suffers from the shortage of financial and human resources, as well as efficient policies to regulate teacher training systems, the situation is worse in in-service training than in pre-service training; there are gaps between stated policies and actual implementation as sometimes governments are unable to ensure that teacher training policies are well-implemented; teachers usually have low morale because of low and unstable salary, the lack of a clear career path, undesirable working conditions, and a low social respect for the profession.
There are differences in the governance of teacher training in the five countries: it is steered by the government in Congo, DRC, Tanzania and Uganda, in some cases with the support of international aid agencies, whereas in Liberia teacher training is currently managed by the government together with USAID.
15
Part 2: Experience and lessons learnt from the recent needs assessment process
Chapter 1: Key steps
1.1 Introduction
This chapter describes the key steps that the needs assessment phase has taken, guided by the principles of being rapid, focused, participatory, impartial, and full usage of existing information and documentations.
1.2 Preparing the needs assessment phase
In order to have an initial dialogue with the five participating countries as well as other stakeholders, a first consultative meeting was held in October 2013 at UNESCO HQ. The main objective of the meeting was to consult the relevant government officials and UNESCO field colleagues, and to prepare an implementation plan based on the specific context and needs of the five countries.
For more information about this consultative meeting, please visit:
https://en.unesco.org/events/cfit-consultative-meeting-report-10-11-october-2013-congo-dr-congo-liberia-tanzania-uganda
1.3 Conducting the needs assessment at country level
A country project team responsible for writing the needs assessment report was set up in each country after the October 2013 meeting. A mission carried out by UNESCO HQ and FO colleagues were conducted in February 2014 to provide technical support to the country project team, as well as to collect data for the needs assessment report. Mission members also had meetings with relevant government officials and the Chinese Embassies in the countries, to consolidate the partnership.

16
1.4 Finalization of the needs assessment report and the way ahead
With the additional support of international experts, the country project teams finished the needs assessment, and shared their key findings at the April 2014 meeting held at UNESCO HQ. The key findings of the needs assessment served as the foundation of preparing the project document (ProDoc) of each country.
For more information about this meeting, please visit:
https://en.unesco.org/events/consultative-meeting-minutes-16-17-april-2014-congo-dr-congo-liberia-tanzania-uganda
17
Chapter 2: Key factors that determine the effectiveness of the needs assessment phase and beyond
In the needs assessment phase of the first three countries, a few factors were identified as being important in determining the effectiveness of the exercise. These include: coordination with the national education authorities, national capacities, and determining the roles and responsibilities of different UNESCO entities. The experience in the five countries confirms these observations, which have been discussed in detail in the synthesis report for the first three countries:
https://en.unesco.org/sites/default/files/CFIT%20Needs%20assessment%20synthesis%20report%202013-June.pdf
During the needs assessment phase of the five countries, it was found that better defined roles and responsibilities of different UNESCO entities are beneficial to effective internal collaboration. Below is the TOR for different UNESCO entities during the preliminary phase of the CFIT project – the needs assessment and ProDoc production phase.
A. Needs assessment phase
*National office (NO)
- Act as the interface between UNESCO and the national team/country project team to ensure smooth communication and coordination during this phase;
- Draft the budget of the activities to be carried out by the national team/country project teamduring the needs assessment phase and submit it to HQ for approval;
- Ensure proper management of the in-country expenses decentralized to the NO by the HQ; - Support the national team/country project team in designing and implementing local
activities involved in the needs assessment; - In coordination with HQ and RO, finalize the mission programme and take charge of
logistics; - Follow up closely the implementation of the roadmap established with the national
team/country project team, in close coordination with HQ and RO. - Follow up with the drafting and finalization of the needs assessment report by the national
team/country project team, in close coordination with HQ and RO.
Regional office (RO)
- Provide substantial technical inputs to the drafting of the needs assessment report; - In the absence of a NO or at the request of the corresponding NO, one senior education
specialist is sent from the RO to join the needs assessment mission; - Provide any other assistance requested by the NO, when deemed necessary.

18
Headquarters (HQ)
- Coordinate this phase; - Provide overall orientation and technical guidance to the national team/country project
team in drafting and finalizing a needs assessment report; - Oversee a needs assessment mission with a teacher expert or ICT expert from the TEP
Section (or an international consultant, when needed); - Review and approve the final draft of a needs assessment report; - Approve and decentralize the in-country expenses – budget for activities to be carried out
by the national team/country project team during the needs assessment phase.
B. ProDoc formulation phase
*National office (NO)
- Draft the budget of the activities to be carried out by the national team/country project team, during the ProDoc formulation phase and submit it to HQ for approval;
- Ensure proper management of the in-country expenses decentralized to the NO by the HQ; - Follow up with the national team/country project team in the formulation and finalization
of a ProDoc, in close coordination with HQ and RO; - Organize a validation workshop for the ProDoc prior to the consultation meeting in HQ in
April 2014.
Regional office (RO)
- Provide substantial inputs to the drafting of the ProDoc; - In the absence of a NO or at the request of the corresponding NO, to organize jointly a
validation workshop for the ProDoc or to participate in such a workshop, prior to a consultation meeting in HQ in April 2014;
- Provide any other assistance requested by the NO, when deemed necessary.
Headquarters (HQ)
To ensure quality assurance of the ProDoc by: - Ensuring coherence with UNESCO’s Teacher Strategy / Initiative and general framework of
the Project; - Providing backstopping and overall orientation and technical guidance; - Establishing a list of review criteria for the ProDoc review; - Carrying out one mission to guide the design and the development of the ProDoc, if needed; - Endorsing the ProDoc for the donors’ approval; - Approving and decentralizing the in-country expenses – the budget of the activities to be
carried out by the national team/country project team, during the ProDoc formulation phase.
*In the case where there is no NO or at the request of the NO, the RO assumes the responsibly of the NO.
19
Part 3: Conclusion The CFIT project was initiated according to a systematic and methodological approach: needs assessment, analysis of the needs and prioritization of intervention areas; all of these being fully guided by a participatory approach and a demonstrated national ownership.
From the needs assessment exercise in the five countries, it was found that, despite the diversity in the population size and wealth of the five countries, they all share the same challenge in the education sector: there is a huge gap in teacher quantity and quality. The magnitude of the challenge might be different, but it is hoped that the intervention of the CFIT project – using ICT to harness teacher training in the countries – could make a difference, and assist the countries in providing quality education to their children.