synergies in banking m&a: let’s play - home page-dip ... · exploit global operating ... the...
TRANSCRIPT
Copyright © 2009 Accenture All Rights Reserved, Accenture, its logo, and High Performance Delivered are trademarks of Accenture,Copyright © 2009 Accenture All Rights Reserved, Accenture, its logo, and High Performance Delivered are trademarks of Accenture,
Synergies in Banking M&A:Let’s play
Verona, 18 maggio 2009
Copyright © 2009 Accenture All Rights Reserved, 22
� Pre deal - Danilo Troncarelli
- M&A Trend
- Synergies in Banking M&A
- Golden Rules
� Post deal - Andrea Dalla Vedova
- Integration approach
- Action Plan
- Golden Rules
Agenda
Copyright © 2009 Accenture All Rights Reserved, 3
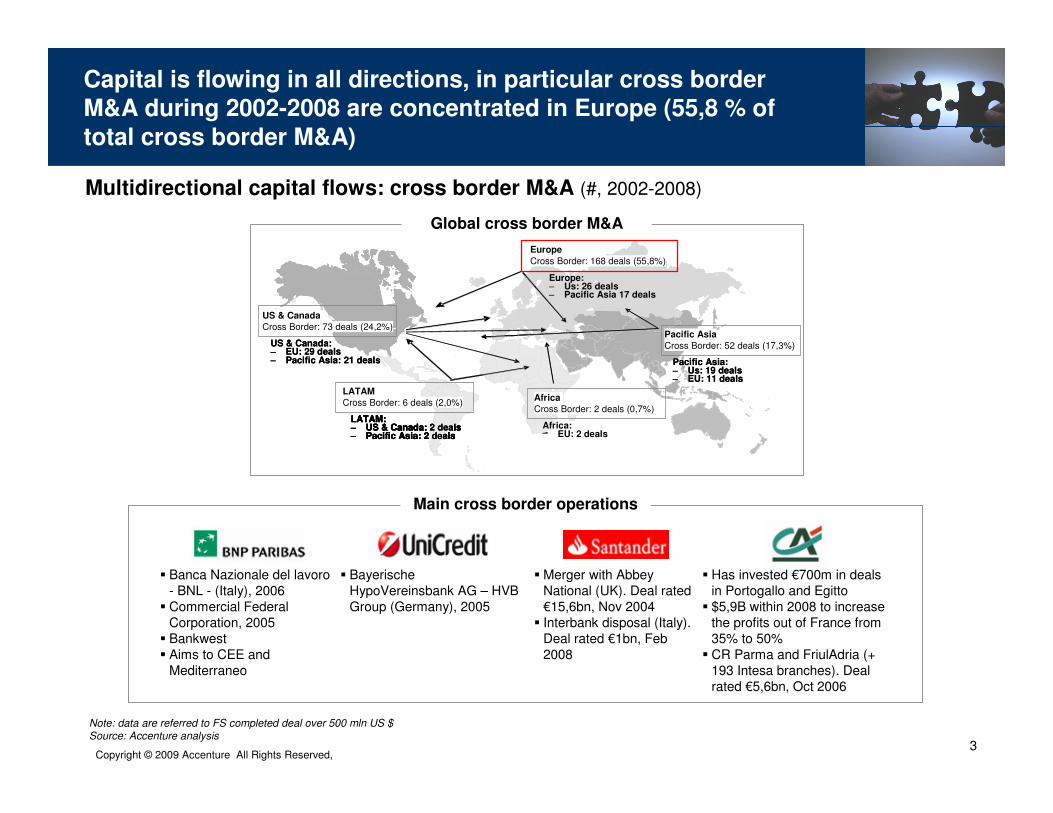
Capital is flowing in all directions, in particular cross borderM&A during 2002-2008 are concentrated in Europe (55,8 % of
total cross border M&A)
Multidirectional capital flows: cross border M&A (#, 2002-2008)
Note: data are referred to FS completed deal over 500 mln US $Source: Accenture analysis
Europe
Cross Border: 168 deals (55,8%)
Europe:– Us: 26 deals – Pacific Asia 17 deals
Pacific Asia
Cross Border: 52 deals (17,3%)
Pacific Asia:– Us: 19 deals – EU: 11 deals
US & Canada:– EU: 29 deals – Pacific Asia: 21 deals
LATAM
Cross Border: 6 deals
LATAM:– US & Canada: 2 deals – Pacific Asia: 2 deals
LATAM
Cross Border: 6 deals (2,0%)
LATAM:– US & Canada: 2 deals – Pacific Asia: 2 deals
Africa
– EU: 2 deals
Europe
Cross Border: 168 deals (55,8%)
Europe:– Us: 26 deals – Pacific Asia 17 deals
Pacific Asia
Cross Border: 52 deals (17,3%)
Pacific Asia:– Us: 19 deals – EU: 11 deals
US & Canada:– EU: 29 deals – Pacific Asia: 21 deals
LATAM
Cross Border: 6 deals
LATAM:– US & Canada: 2 deals – Pacific Asia: 2 deals
LATAM
Cross Border: 6 deals (2,0%)
LATAM:– US & Canada: 2 deals – Pacific Asia: 2 deals
Africa
Cross Border: 2 deals (0,7%)
–Africa:
� Merger with AbbeyNational (UK). Deal rated€15,6bn, Nov 2004
� Interbank disposal (Italy). Deal rated €1bn, Feb2008
� BayerischeHypoVereinsbank AG – HVB Group (Germany), 2005
� Has invested €700m in dealsin Portogallo and Egitto
� $5,9B within 2008 to increasethe profits out of France from35% to 50%
� CR Parma and FriulAdria (+ 193 Intesa branches). Deal rated €5,6bn, Oct 2006
� Banca Nazionale del lavoro - BNL - (Italy), 2006
� Commercial FederalCorporation, 2005
� Bankwest� Aims to CEE and
Mediterraneo
Main cross border operations
US & Canada
Cross Border: 73 deals (24,2%)
Global cross border M&A

Copyright © 2009 Accenture All Rights Reserved, 4
The global FS M&A trend shows a significantly reduction in the 2008 (compared with 2007) after a long period of a high growth
rate. 2008 in any case is positioning itself between 2005-06 …
Global FS M&A trend (1/2)
FS M&A($ Bn, 2002 - 2008)
% of cross border
22,6% 11,7% 21,1% 31,1% 26,6% 21,9%33,4%
319381
336
245196200
87 90
191
122111532726
2008200720062005200420032002
33,9%
-53%
-16%
Cross border
Domestic
CAGR 2002-2007 domestic
CAGR 2002-2007 cross border
49,2%
∆ (pp) 2007-2008
Average ‘02-’07
24,4%
Year
11,5%
Note: data are referred to FS completed deal over 500 mln US $Source: Accenture analysis
Copyright © 2009 Accenture All Rights Reserved, 5
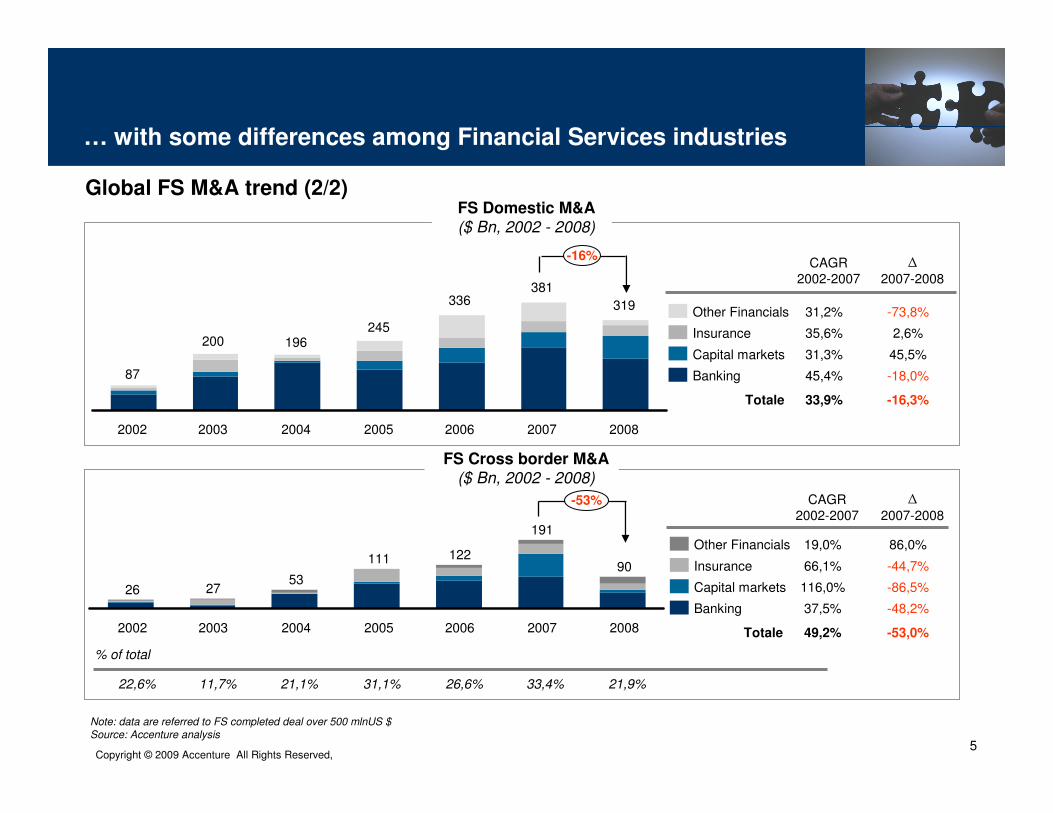
… with some differences among Financial Services industries
FS Domestic M&A($ Bn, 2002 - 2008)
FS Cross border M&A($ Bn, 2002 - 2008)
Global FS M&A trend (2/2)
Note: data are referred to FS completed deal over 500 mlnUS $Source: Accenture analysis
Other Financials
Insurance
Capital markets
Banking
Insurance
Capital markets
Banking
Other Financials
% of total
20052002 20042003
381
196245
2008
336
2006 2007
319
87
200
-16%
22,6%
2005 2008
191
2007
90
26
2002
27
2003
53
2004
111 122
2006
11,7% 21,1% 31,1% 26,6% 21,9%33,4%
CAGR 2002-2007
35,6%
31,3%
45,4%
31,2%
Totale 33,9%
CAGR 2002-2007
Totale
66,1%
116,0%
37,5%
19,0%
49,2%
∆
2007-2008
2,6%
45,5%
-18,0%
-73,8%
-16,3%
-44,7%
-86,5%
-48,2%
86,0%
-53,0%
-53%
∆
2007-2008
Copyright © 2009 Accenture All Rights Reserved, 6
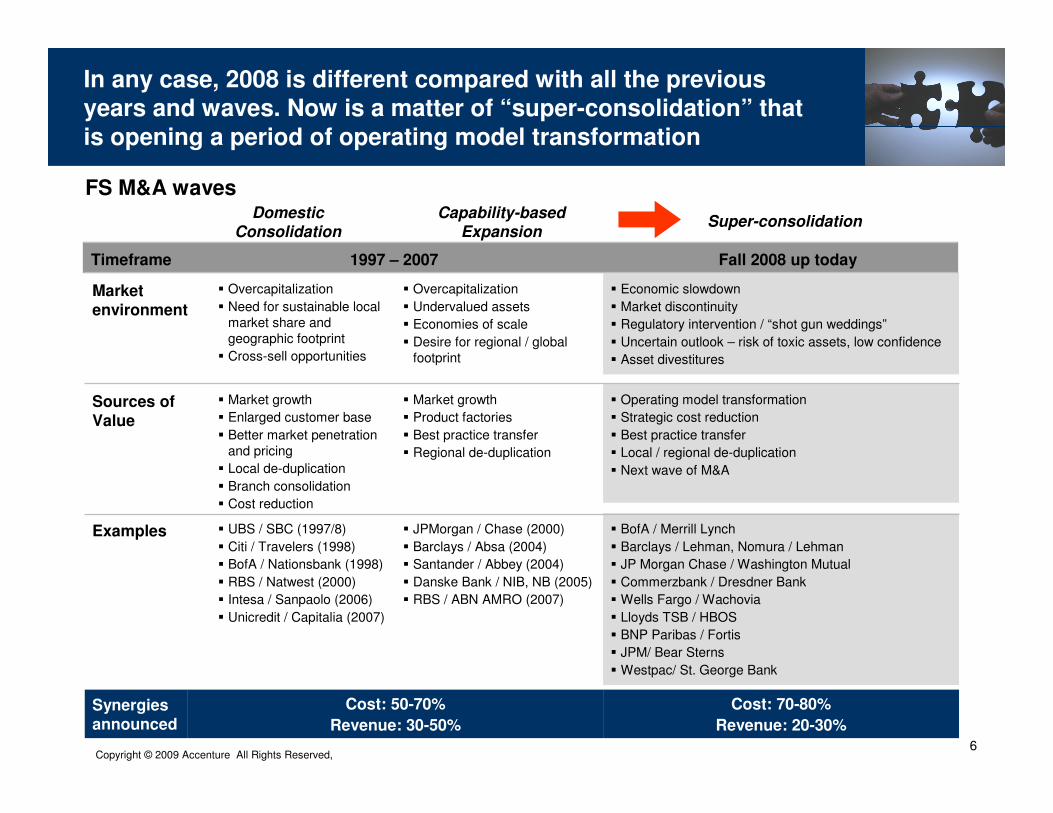
In any case, 2008 is different compared with all the previous years and waves. Now is a matter of “super-consolidation” that
is opening a period of operating model transformation
� BofA / Merrill Lynch
� Barclays / Lehman, Nomura / Lehman
� JP Morgan Chase / Washington Mutual
� Commerzbank / Dresdner Bank
� Wells Fargo / Wachovia
� Lloyds TSB / HBOS
� BNP Paribas / Fortis
� JPM/ Bear Sterns
� Westpac/ St. George Bank
� JPMorgan / Chase (2000)
� Barclays / Absa (2004)
� Santander / Abbey (2004)
� Danske Bank / NIB, NB (2005)
� RBS / ABN AMRO (2007)
� UBS / SBC (1997/8)
� Citi / Travelers (1998)
� BofA / Nationsbank (1998)
� RBS / Natwest (2000)
� Intesa / Sanpaolo (2006)
� Unicredit / Capitalia (2007)
Examples
Cost: 70-80%
Revenue: 20-30%
Cost: 50-70%
Revenue: 30-50%
Synergies
announced
Fall 2008 up today1997 – 2007Timeframe
Super-consolidation
� Operating model transformation
� Strategic cost reduction
� Best practice transfer
� Local / regional de-duplication
� Next wave of M&A
� Market growth
� Product factories
� Best practice transfer
� Regional de-duplication
� Market growth
� Enlarged customer base
� Better market penetration and pricing
� Local de-duplication
� Branch consolidation
� Cost reduction
Sources of Value
� Economic slowdown
� Market discontinuity
� Regulatory intervention / “shot gun weddings”
� Uncertain outlook – risk of toxic assets, low confidence
� Asset divestitures
� Overcapitalization
� Undervalued assets
� Economies of scale
� Desire for regional / global footprint
� Overcapitalization
� Need for sustainable local market share and geographic footprint
� Cross-sell opportunities
Market
environment
Capability-basedExpansion
Domestic Consolidation
FS M&A waves
Copyright © 2009 Accenture All Rights Reserved, 7
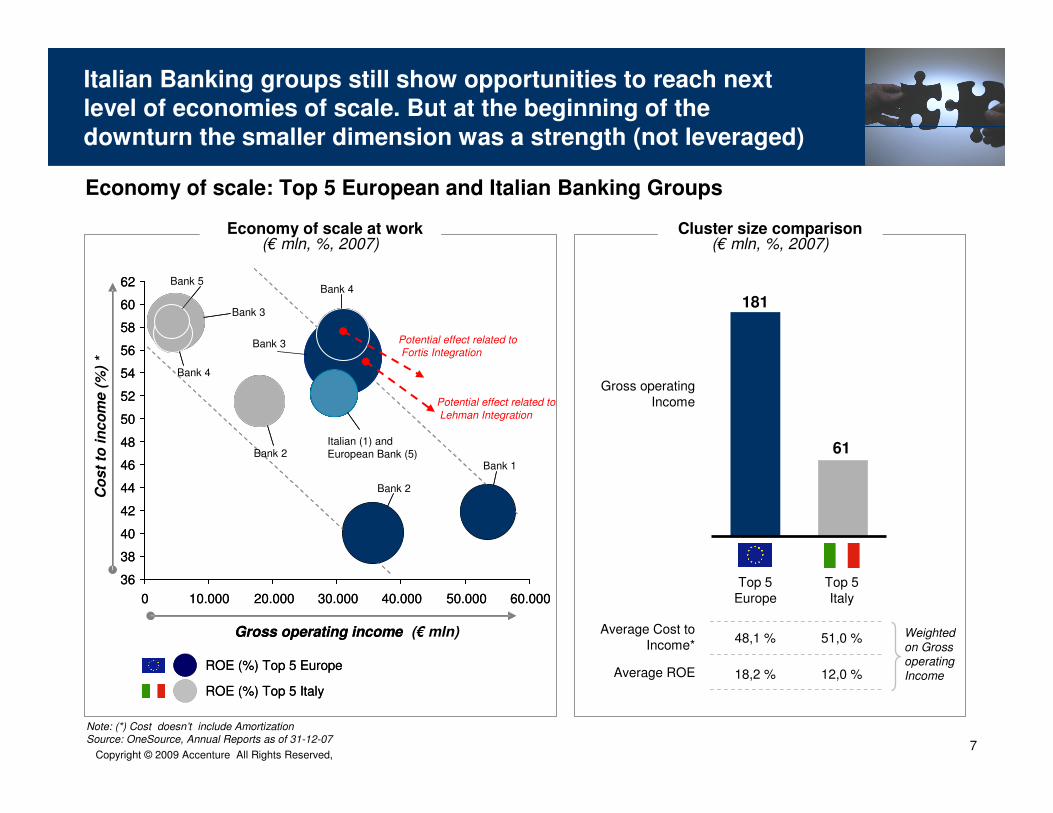
181
61
Top 5Europe
Top 5Italy
Average Cost to Income*
Average ROE
48,1 % 51,0 %
18,2 % 12,0 %
Note: (*) Cost doesn’t include Amortization Source: OneSource, Annual Reports as of 31-12-07
Italian Banking groups still show opportunities to reach next level of economies of scale. But at the beginning of the
downturn the smaller dimension was a strength (not leveraged)
Economy of scale at work(€ mln, %, 2007)
Cluster size comparison(€ mln, %, 2007)
Gross operating income
ROE (%) Top 5 Europe
ROE (%) Top 5 Italy
+
+
Gross operating income (€ mln)
ROE (%) Top 5 Europe
ROE (%) Top 5 Italy
Economy of scale: Top 5 European and Italian Banking Groups
36
38
40
42
44
46
48
50
52
54
56
58
60
62
0 10.000 20.000 30.000 40.000 50.000 60.000
Bank 4
Italian (1) andEuropean Bank (5)
Unicredit
Bank 3
Bank 4
Bank 5
Co
st
to in
co
me (
%)
*
36
38
40
42
44
46
48
50
52
54
56
58
60
62
0 10.000 20.000 30.000 40.000 50.000 60.000
Bank 2
Bank 3
Bank 2
Gross operating Income
Weighted on Gross operating Income
Potential effect related toFortis Integration
Potential effect related toLehman Integration
Bank 1
Copyright © 2009 Accenture All Rights Reserved, 8
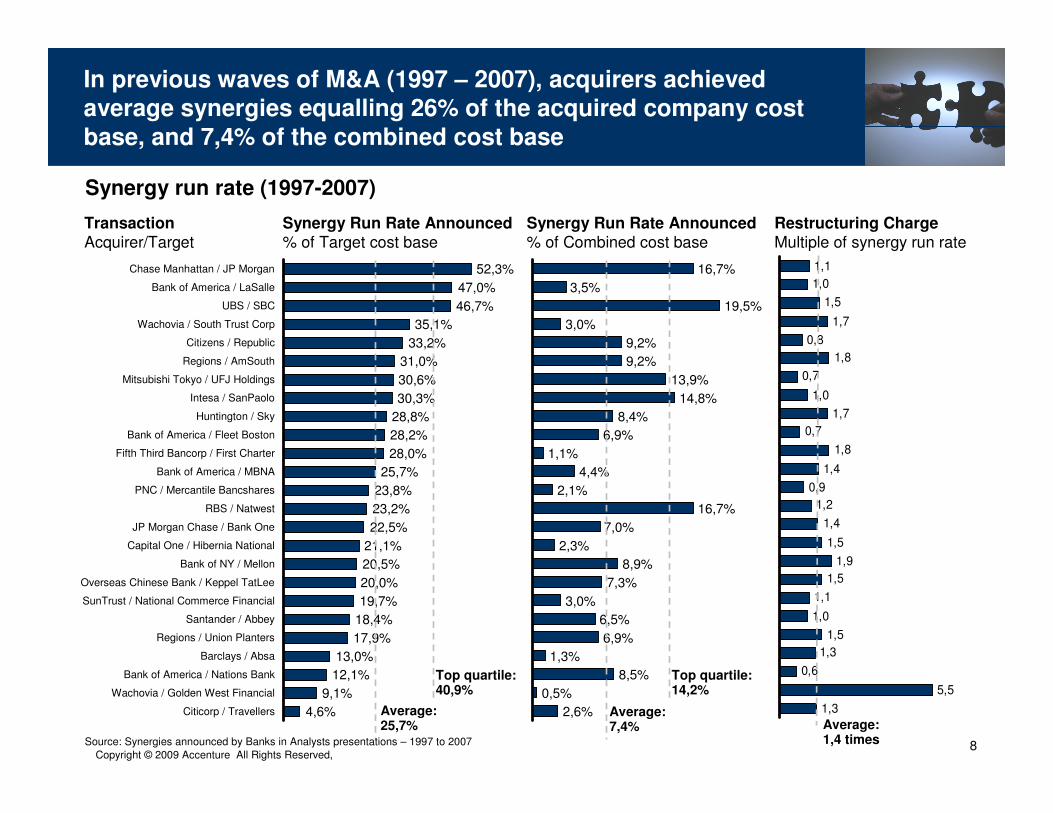
In previous waves of M&A (1997 – 2007), acquirers achieved average synergies equalling 26% of the acquired company cost
base, and 7,4% of the combined cost base
Synergy Run Rate Announced
% of Target cost baseSynergy Run Rate Announced
% of Combined cost baseTransaction
Acquirer/Target
Average:1,4 times
Citicorp / Travellers
9,1%Wachovia / Golden West Financial
12,1%Bank of America / Nations Bank
13,0%Barclays / Absa
17,9%Regions / Union Planters
18,4%Santander / Abbey
19,7%SunTrust / National Commerce Financial
20,0%Overseas Chinese Bank / Keppel TatLee
20,5%Bank of NY / Mellon
21,1%Capital One / Hibernia National
22,5%JP Morgan Chase / Bank One
23,2%RBS / Natwest
23,8%PNC / Mercantile Bancshares
25,7%Bank of America / MBNA
28,0%Fifth Third Bancorp / First Charter
28,2%Bank of America / Fleet Boston
28,8%
4,6%
46,7%
47,0%
52,3%
33,2%
Regions / AmSouth
UBS / SBC
Wachovia / South Trust Corp
Intesa / SanPaolo
31,0%
Bank of America / LaSalle
35,1%
30,3%
Mitsubishi Tokyo / UFJ Holdings
Chase Manhattan / JP Morgan
Citizens / Republic
Huntington / Sky
30,6%
Average:25,7%
Top quartile:40,9%
16,7%
3,5%
19,5%
3,0%
9,2%
9,2%
13,9%
14,8%
8,4%
6,9%
1,1%
4,4%
2,1%
16,7%
7,0%
2,3%
8,9%
7,3%
3,0%
6,9%
8,5%
2,6%
6,5%
1,3%
0,5%
Average:7,4%
Top quartile:14,2%
1,3
5,5
0,6
1,3
1,5
1,0
1,1
1,5
1,9
1,5
1,4
1,2
0,9
1,4
1,8
0,7
1,7
1,0
0,7
1,8
0,8
1,7
1,5
1,0
1,1
Restructuring Charge
Multiple of synergy run rate
Synergy run rate (1997-2007)
Source: Synergies announced by Banks in Analysts presentations – 1997 to 2007
Copyright © 2009 Accenture All Rights Reserved, 9
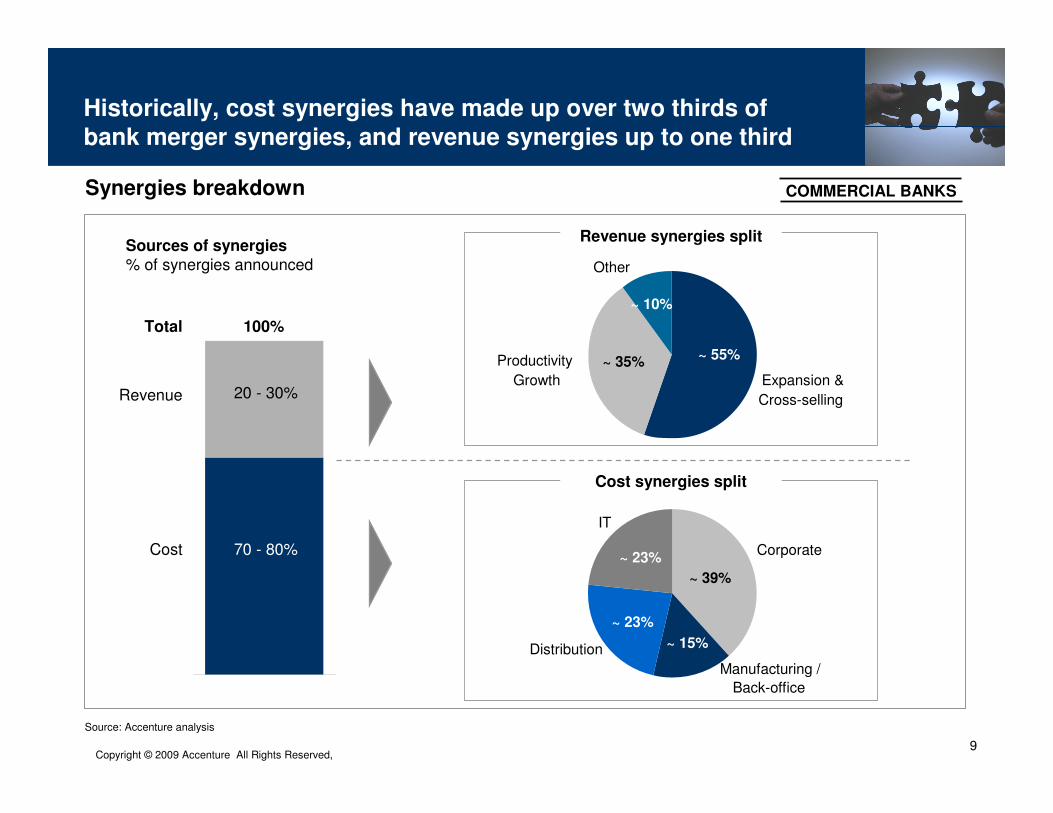
Productivity
Growth Expansion &
Cross-selling
Other
Sources of synergies% of synergies announced
100%
Revenue 20 - 30%
Cost
Total
70 - 80%
Revenue synergies split
~ 55%~ 35%
~ 10%
Cost synergies split
Source: Accenture analysis
~ 8%
COMMERCIAL BANKS
Historically, cost synergies have made up over two thirds of
bank merger synergies, and revenue synergies up to one third
Synergies breakdown
Corporate
IT
~ 39%
~ 23%
~ 23%
~ 15%
Manufacturing /
Back-office
Distribution
Copyright © 2009 Accenture All Rights Reserved, 10
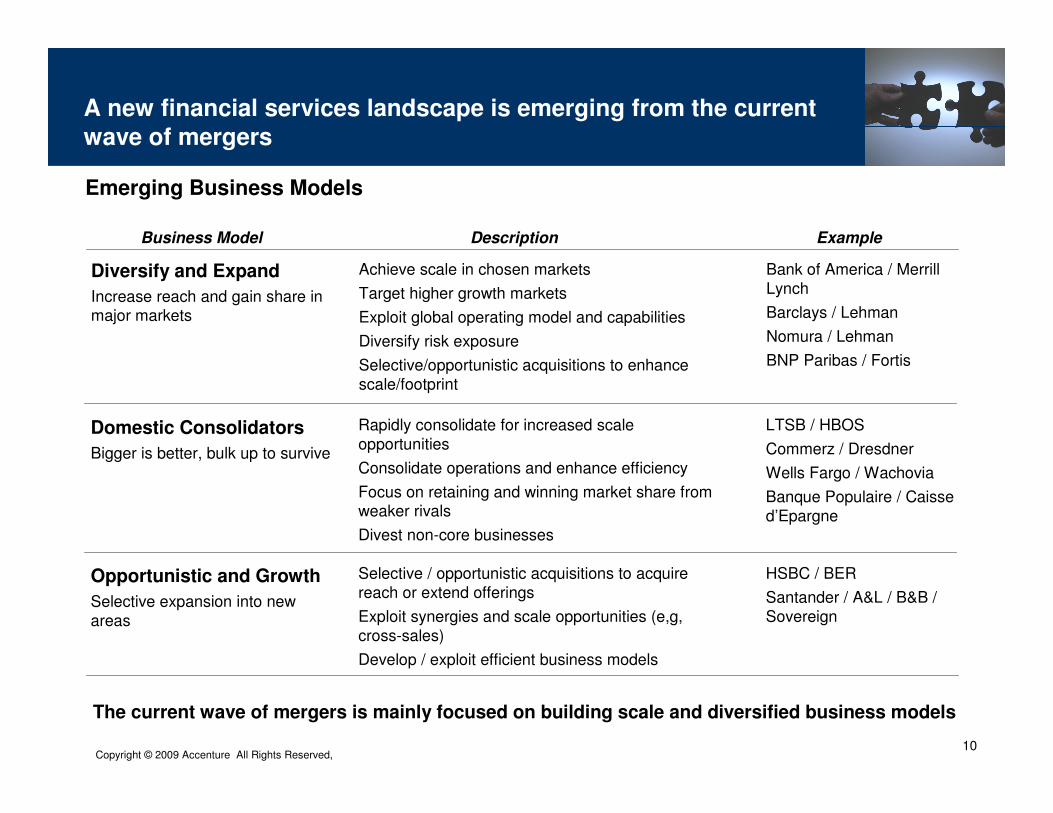
Achieve scale in chosen markets
Target higher growth markets
Exploit global operating model and capabilities
Diversify risk exposure
Selective/opportunistic acquisitions to enhance scale/footprint
Diversify and Expand
Increase reach and gain share in major markets
Domestic Consolidators
Bigger is better, bulk up to survive
Rapidly consolidate for increased scale opportunities
Consolidate operations and enhance efficiency
Focus on retaining and winning market share from weaker rivals
Divest non-core businesses
Opportunistic and Growth
Selective expansion into new areas
Selective / opportunistic acquisitions to acquire reach or extend offerings
Exploit synergies and scale opportunities (e,g, cross-sales)
Develop / exploit efficient business models
Bank of America / Merrill Lynch
Barclays / Lehman
Nomura / Lehman
BNP Paribas / Fortis
LTSB / HBOS
Commerz / Dresdner
Wells Fargo / Wachovia
Banque Populaire / Caissed’Epargne
HSBC / BER
Santander / A&L / B&B / Sovereign
The current wave of mergers is mainly focused on building scale and diversified business models
A new financial services landscape is emerging from the current
wave of mergers
Emerging Business Models
Business Model Description Example
Copyright © 2009 Accenture All Rights Reserved, 11
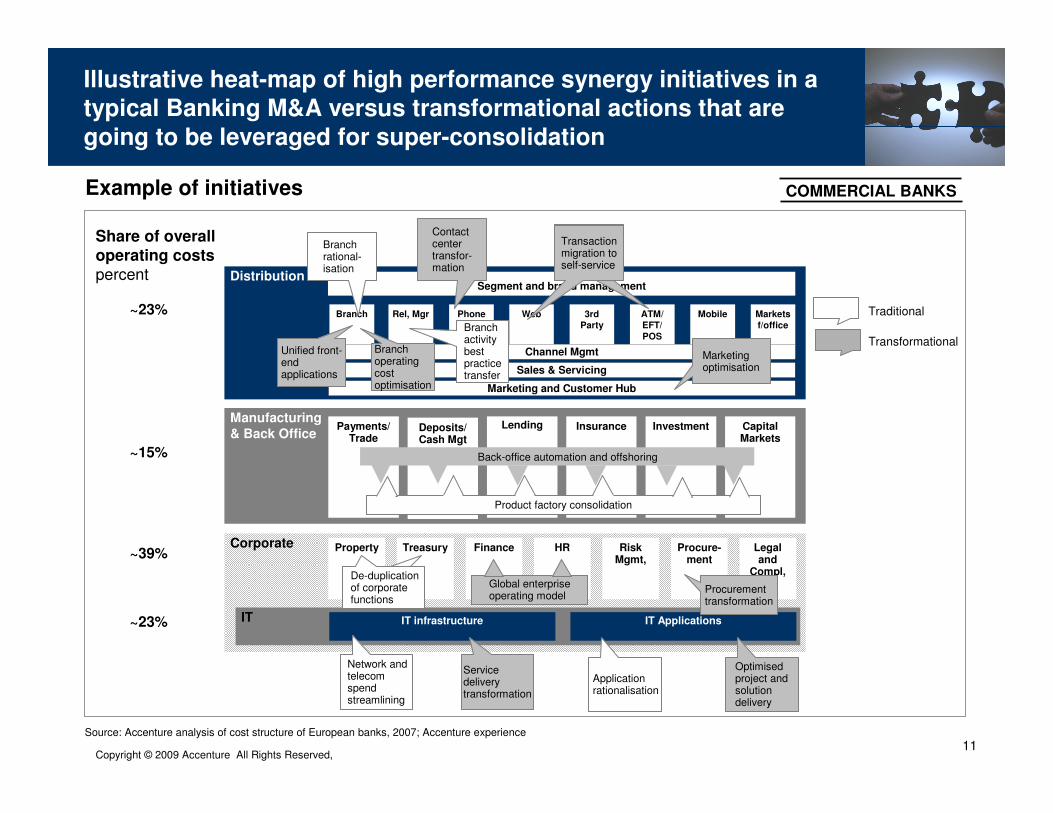
Distribution
Manufacturing
& Back Office
Corporate
Segment and brand management
Branch Rel, Mgr Web ATM/
EFT/
POS
3rd
Party
Phone Mobile Markets
f/office
Deposits/Cash Mgt
Lending InvestmentPayments/ Trade
Insurance Capital Markets
Finance HR Risk Mgmt,
Procure-ment
Legal and
Compl,
Property Treasury
IT IT infrastructure IT Applications
Channel Mgmt
Sales & Servicing
~65%
Marketing and Customer Hub
Share of overall operating costspercent
~23%
~15%
~23%
~39%
Branch rational-isation
Contact center transfor-mation
Transaction migration to self-service
Optimisedproject and solution delivery
Application rationalisation
Service delivery transformation
Network and telecom spend streamlining
De-duplication of corporate functions
Marketing optimisation
Traditional
Transformational
Global enterprise operating model
Product factory consolidation
Back-office automation and offshoring
Transaction migration to self-service
De-duplication of corporate functions
Branch operating cost optimisation
Unified front-end applications
Branch activity best practice transfer
Procurement transformation
Illustrative heat-map of high performance synergy initiatives in a typical Banking M&A versus transformational actions that are
going to be leveraged for super-consolidation
Example of initiatives
Source: Accenture analysis of cost structure of European banks, 2007; Accenture experience
COMMERCIAL BANKS
Copyright © 2009 Accenture All Rights Reserved, 12
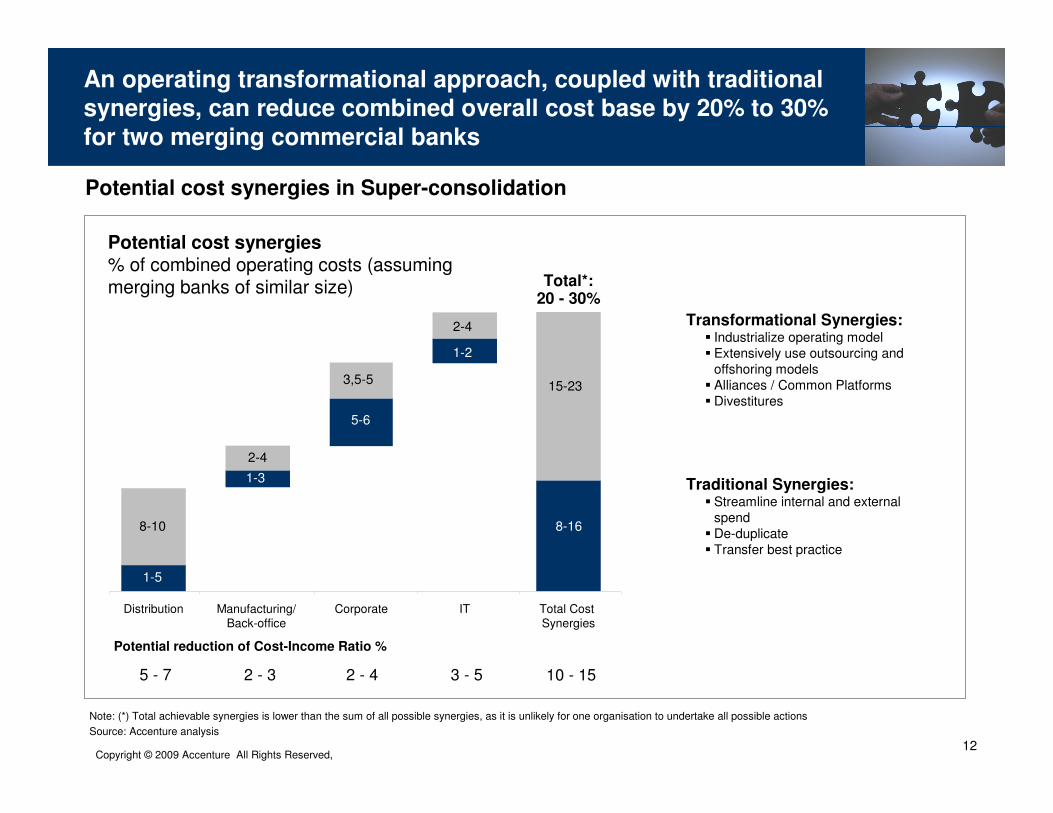
Potential cost synergies% of combined operating costs (assuming merging banks of similar size)
Traditional Synergies:� Streamline internal and external
spend� De-duplicate� Transfer best practice
Total*:20 - 30%
Transformational Synergies:� Industrialize operating model� Extensively use outsourcing and
offshoring models� Alliances / Common Platforms� Divestitures
10 - 153 - 52 - 42 - 35 - 7
Potential reduction of Cost-Income Ratio %
Note: (*) Total achievable synergies is lower than the sum of all possible synergies, as it is unlikely for one organisation to undertake all possible actions
Source: Accenture analysis
An operating transformational approach, coupled with traditionalsynergies, can reduce combined overall cost base by 20% to 30%
for two merging commercial banks
8-16
15-23
1-5
8-10
1-3
2-4
5-6
3,5-5
Distribution Manufacturing/Back-office
Corporate Total CostSynergies
Potential cost synergies in Super-consolidation
1-2
2-4
IT
Copyright © 2009 Accenture All Rights Reserved, 13
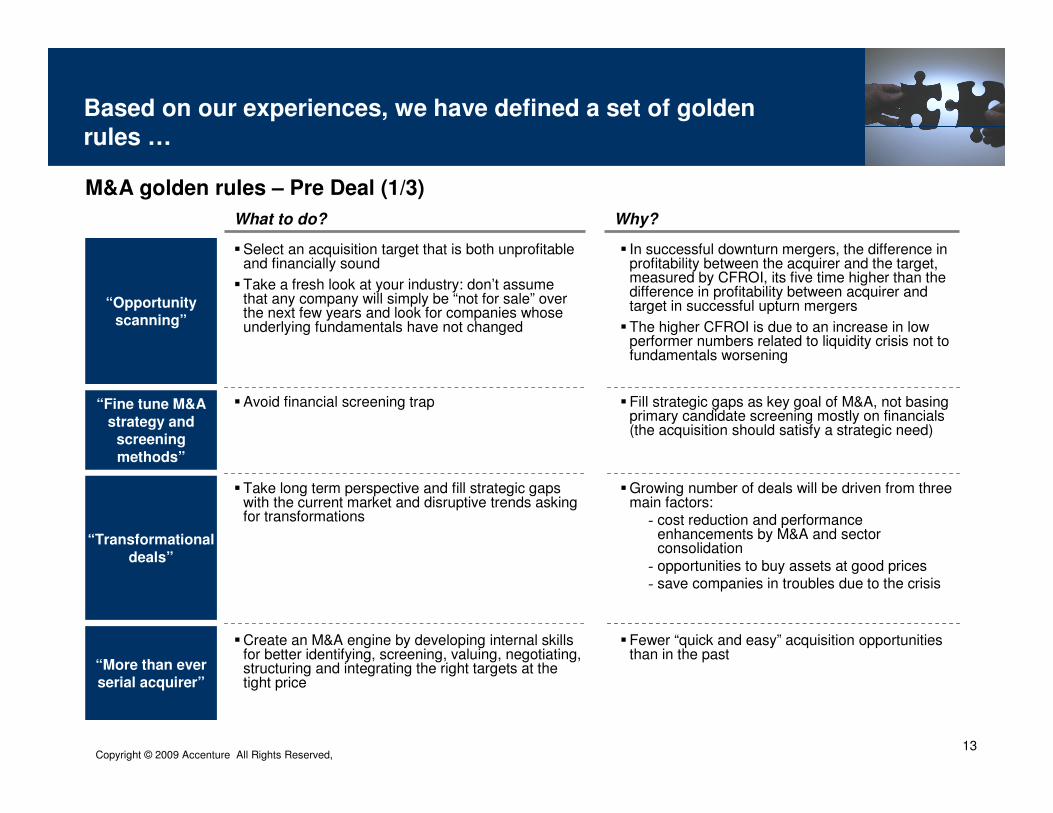
“Opportunity scanning”
“Fine tune M&A
strategy and screening
methods”
“Transformational
deals”
What to do? Why?
�Select an acquisition target that is both unprofitable and financially sound
�Take a fresh look at your industry: don’t assume that any company will simply be “not for sale” over the next few years and look for companies whose underlying fundamentals have not changed
� In successful downturn mergers, the difference in profitability between the acquirer and the target, measured by CFROI, its five time higher than the difference in profitability between acquirer and target in successful upturn mergers
�The higher CFROI is due to an increase in low performer numbers related to liquidity crisis not to fundamentals worsening
�Avoid financial screening trap �Fill strategic gaps as key goal of M&A, not basing primary candidate screening mostly on financials (the acquisition should satisfy a strategic need)
�Take long term perspective and fill strategic gaps with the current market and disruptive trends asking for transformations
�Growing number of deals will be driven from three main factors:- cost reduction and performance
enhancements by M&A and sector consolidation- opportunities to buy assets at good prices- save companies in troubles due to the crisis
Based on our experiences, we have defined a set of golden
rules …
�Create an M&A engine by developing internal skills for better identifying, screening, valuing, negotiating, structuring and integrating the right targets at the tight price
�Fewer “quick and easy” acquisition opportunities than in the past
“More than ever serial acquirer”
M&A golden rules – Pre Deal (1/3)
Copyright © 2009 Accenture All Rights Reserved, 14
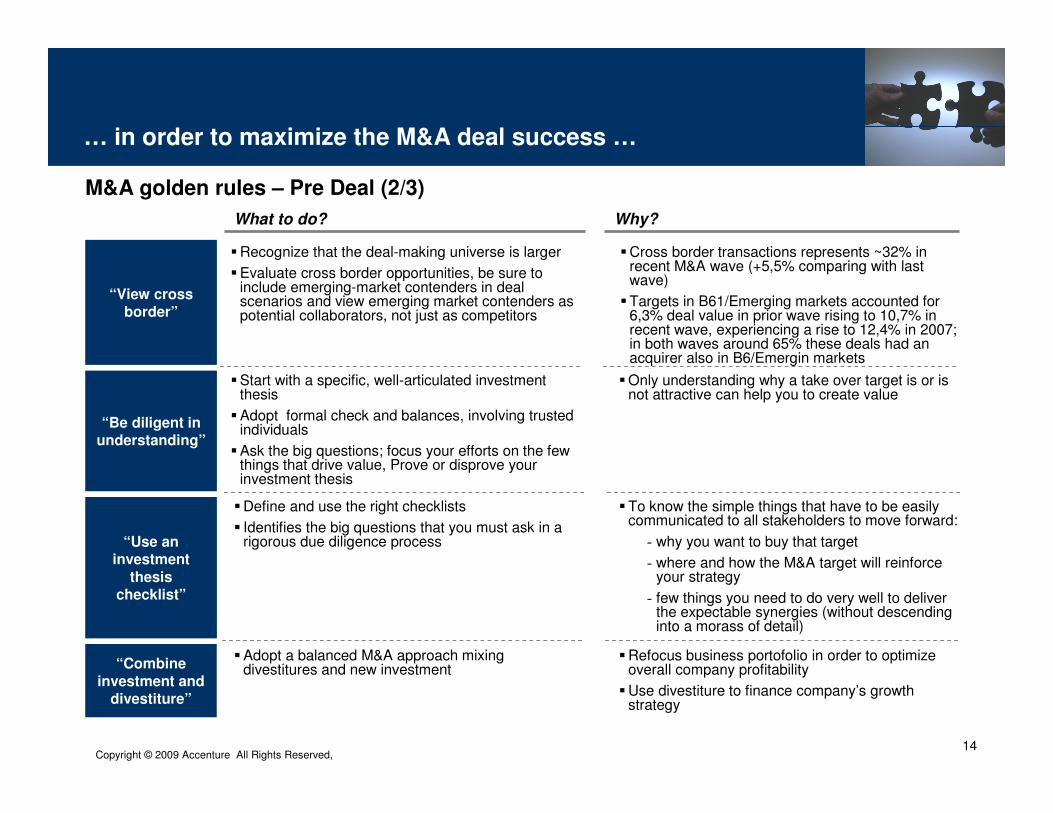
�Start with a specific, well-articulated investment thesis
�Adopt formal check and balances, involving trusted individuals
�Ask the big questions; focus your efforts on the few things that drive value, Prove or disprove your investment thesis
�Only understanding why a take over target is or is not attractive can help you to create value
“Be diligent in understanding”
�Define and use the right checklists
� Identifies the big questions that you must ask in a rigorous due diligence process
�To know the simple things that have to be easily communicated to all stakeholders to move forward:
- why you want to buy that target
- where and how the M&A target will reinforce your strategy
- few things you need to do very well to deliver the expectable synergies (without descending into a morass of detail)
“Use an investment
thesis checklist”
… in order to maximize the M&A deal success …
�Adopt a balanced M&A approach mixing divestitures and new investment“Combine
investment and divestiture”
�Refocus business portofolio in order to optimize overall company profitability
�Use divestiture to finance company’s growth strategy
M&A golden rules – Pre Deal (2/3)
�Recognize that the deal-making universe is larger
�Evaluate cross border opportunities, be sure to include emerging-market contenders in deal scenarios and view emerging market contenders as potential collaborators, not just as competitors
“View cross border”
What to do? Why?
�Cross border transactions represents ~32% in recent M&A wave (+5,5% comparing with last wave)
�Targets in B61/Emerging markets accounted for 6,3% deal value in prior wave rising to 10,7% in recent wave, experiencing a rise to 12,4% in 2007; in both waves around 65% these deals had an acquirer also in B6/Emergin markets
Copyright © 2009 Accenture All Rights Reserved, 15
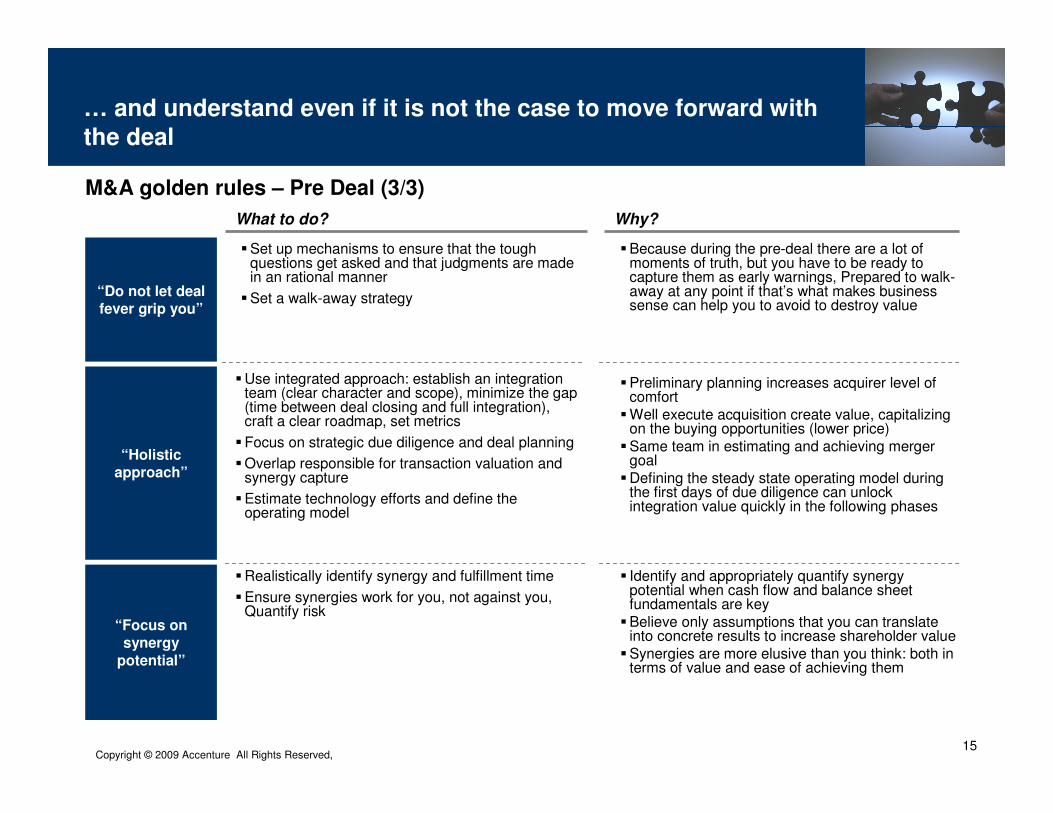
… and understand even if it is not the case to move forward with
the deal
�Use integrated approach: establish an integration team (clear character and scope), minimize the gap (time between deal closing and full integration), craft a clear roadmap, set metrics
�Focus on strategic due diligence and deal planning
�Overlap responsible for transaction valuation and synergy capture
�Estimate technology efforts and define the operating model
“Holistic approach”
�Realistically identify synergy and fulfillment time
�Ensure synergies work for you, not against you, Quantify risk
“Focus on synergy
potential”
� Identify and appropriately quantify synergy potential when cash flow and balance sheet fundamentals are key
�Believe only assumptions that you can translate into concrete results to increase shareholder value
�Synergies are more elusive than you think: both in terms of value and ease of achieving them
M&A golden rules – Pre Deal (3/3)
What to do? Why?
�Set up mechanisms to ensure that the tough questions get asked and that judgments are made in an rational manner
�Set a walk-away strategy
�Because during the pre-deal there are a lot of moments of truth, but you have to be ready to capture them as early warnings, Prepared to walk-away at any point if that’s what makes business sense can help you to avoid to destroy value
“Do not let deal fever grip you”
�Preliminary planning increases acquirer level of comfort
�Well execute acquisition create value, capitalizing on the buying opportunities (lower price)
�Same team in estimating and achieving merger goal
�Defining the steady state operating model during the first days of due diligence can unlock integration value quickly in the following phases
Copyright © 2009 Accenture All Rights Reserved, 1616
Agenda
� Pre deal - Danilo Troncarelli
- M&A Trend
- Synergies in Banking M&A
- Golden Rules
� Post deal - Andrea Dalla Vedova
- Integration approach
- Action Plan
- Golden Rules
Copyright © 2009 Accenture All Rights Reserved, 17
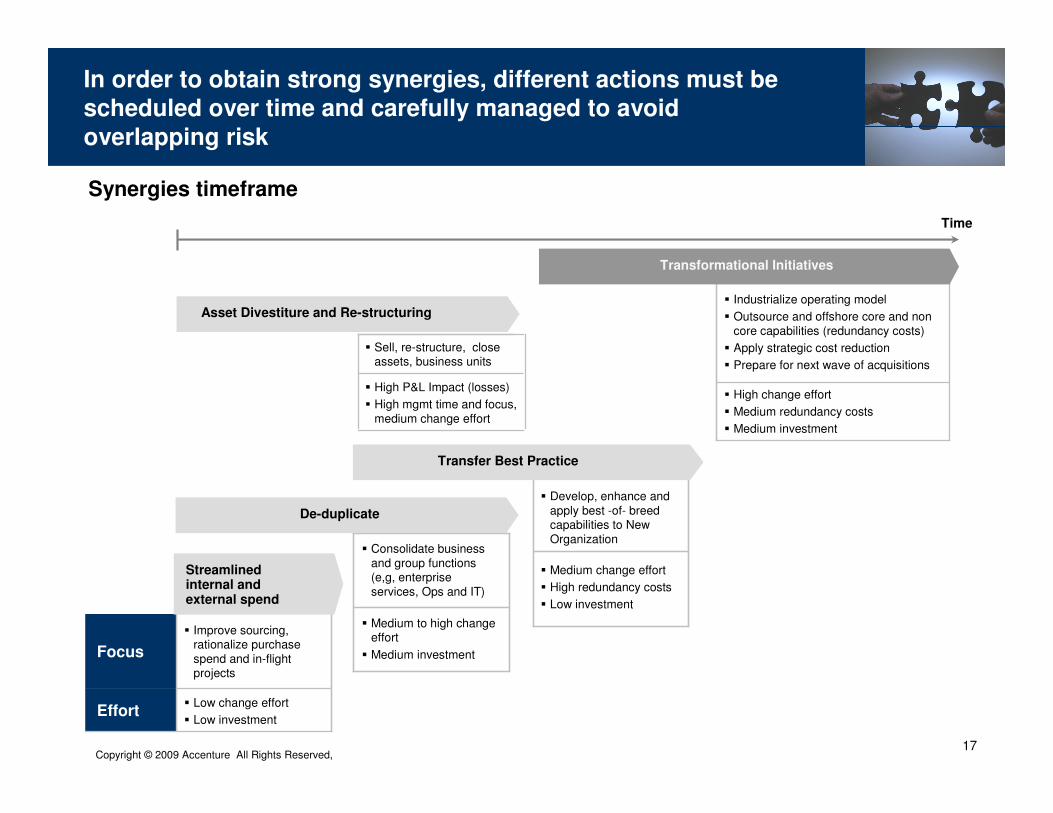
Effort
Focus
Transfer Best Practice
De-duplicate
Time
Transformational Initiatives
Asset Divestiture and Re-structuring
Synergies timeframe
In order to obtain strong synergies, different actions must be scheduled over time and carefully managed to avoid
overlapping risk
� Sell, re-structure, close assets, business units
� High P&L Impact (losses)
� High mgmt time and focus, medium change effort
� Industrialize operating model
� Outsource and offshore core and non core capabilities (redundancy costs)
� Apply strategic cost reduction
� Prepare for next wave of acquisitions
� High change effort
� Medium redundancy costs
� Medium investment
� Develop, enhance and apply best -of- breed capabilities to New Organization
� Medium change effort
� High redundancy costs
� Low investment
� Medium to high change effort
� Medium investment
� Consolidate business and group functions (e,g, enterprise services, Ops and IT)
� Low change effort
� Low investment
� Improve sourcing, rationalize purchase spend and in-flight projects
Streamlined internal and external spend
Copyright © 2009 Accenture All Rights Reserved, 18
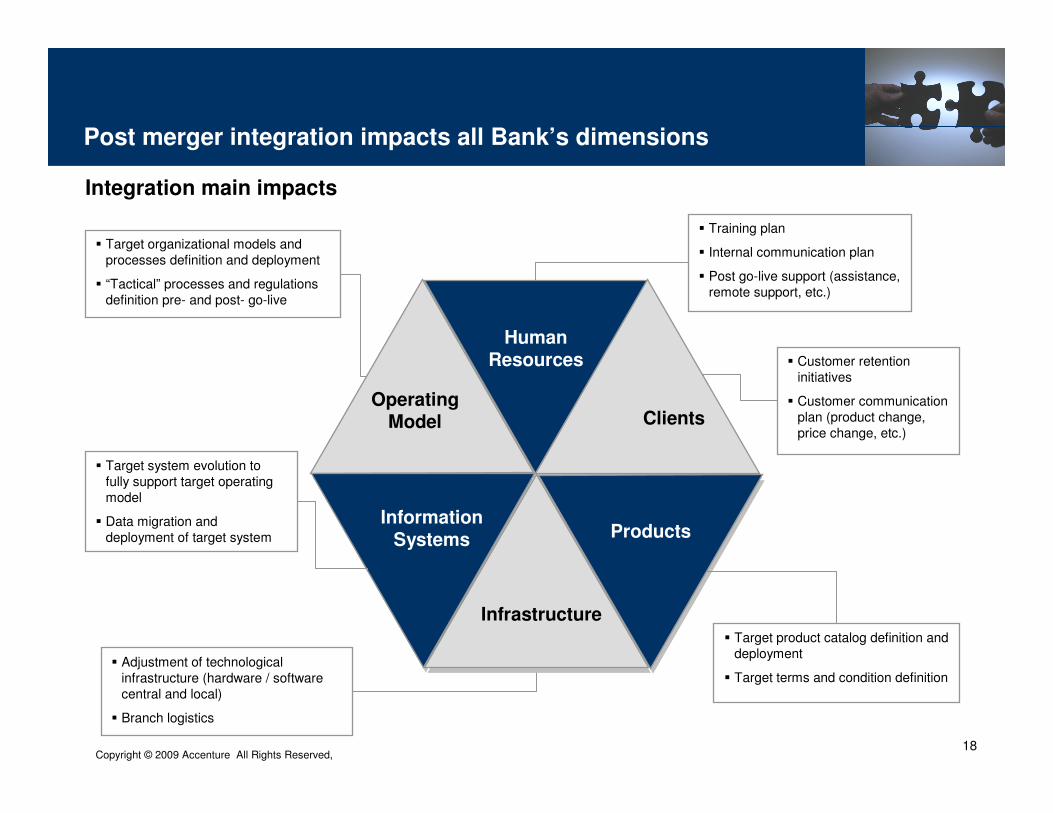
Information Systems
Human Resources
Operating Model
� Training plan
� Internal communication plan
� Post go-live support (assistance, remote support, etc.)
� Customer retention initiatives
� Customer communication plan (product change, price change, etc.)
� Target product catalog definition and deployment
� Target terms and condition definition� Adjustment of technological
infrastructure (hardware / software central and local)
� Branch logistics
� Target organizational models and processes definition and deployment
� “Tactical” processes and regulations definition pre- and post- go-live
� Target system evolution to fully support target operating model
� Data migration and deployment of target system
Clients
Products
Infrastructure
Post merger integration impacts all Bank’s dimensions
Integration main impacts
Copyright © 2009 Accenture All Rights Reserved, 19
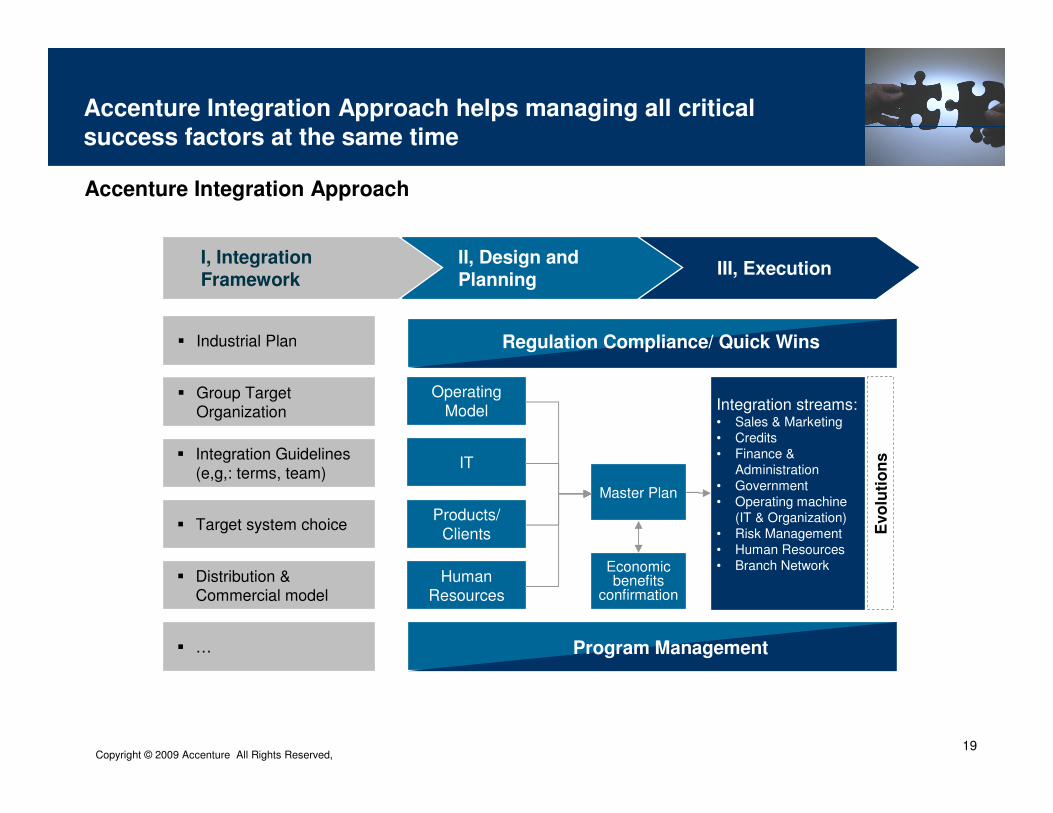
Accenture Integration Approach helps managing all critical
success factors at the same time
Accenture Integration Approach
� Industrial Plan
III, ExecutionII, Design and Planning
I, Integration Framework
Operating Model
Evo
luti
on
sIT
Products/ Clients
Human Resources
Master Plan
Economic benefits
confirmation
Integration streams:• Sales & Marketing • Credits• Finance &
Administration• Government• Operating machine
(IT & Organization)• Risk Management• Human Resources• Branch Network
Program Management
Regulation Compliance/ Quick Wins
� Group Target Organization
� Integration Guidelines (e,g,: terms, team)
� Target system choice
� Distribution & Commercial model
� …
Copyright © 2009 Accenture All Rights Reserved, 20
Distribution
Group Operations
Op
era
tio
ns
Pro
du
cts
&
M
ark
ets
Sa
les
&
Se
rvic
eS
up
po
rt
C&G Cards SW
3rd
Parties
Group Operations
CA GIBusiness
Migration
to Gp
Ops
Underway
CardsC&GSavingsLendingCurrent
Accounts
Enterprise Shared Services
Distribution
Group OperationsOp
era
tio
ns
Pro
du
cts
&
M
ark
ets
Sa
les
&
Se
rvic
eS
up
po
rt
C&G
Central Operations
CA
Ops
Underway
Enterprise Shared Services
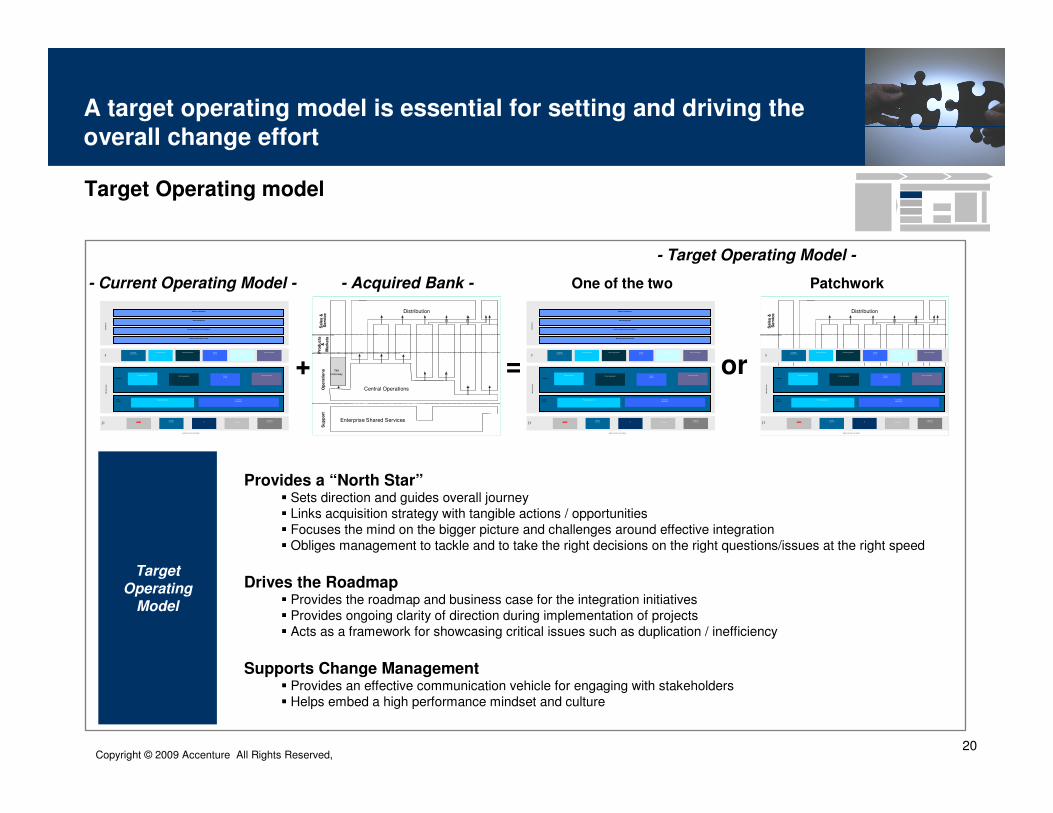
- Acquired Bank -- Current Operating Model -
- Target Operating Model -
+
Provides a “North Star”� Sets direction and guides overall journey� Links acquisition strategy with tangible actions / opportunities� Focuses the mind on the bigger picture and challenges around effective integration� Obliges management to tackle and to take the right decisions on the right questions/issues at the right speed
Drives the Roadmap� Provides the roadmap and business case for the integration initiatives � Provides ongoing clarity of direction during implementation of projects� Acts as a framework for showcasing critical issues such as duplication / inefficiency
Supports Change Management� Provides an effective communication vehicle for engaging with stakeholders� Helps embed a high performance mindset and culture
Target
Operating Model
Target Operating model
= or
One of the two Patchwork
A target operating model is essential for setting and driving the
overall change effort
Dis
trib
uti
on
Hu
bM
an
ufa
ctu
rin
g
Co
rp
co
re
Knowledgemanagement
Products
Crossproduct
Product development
Ser vice integrationCustomermanagement
Customer pricing Product aggregation Third partymanagement
Productpricing
Segment manag ement
Brand management
Marketin g, sales and servicing
Channel integration and man agement
Finance
Humanresources IT Purchasing
Legal andcompliance
SIMPLIFIED ON THE INSIDE
Customer pricingProduct aggregation Product
pricing
Ser vice integration
Dis
trib
uti
on
Hu
bM
an
ufa
ctu
rin
g
Co
rp
co
re
Knowledgemanagement
Products
Crossproduct
Product development
Ser vice integrationCustomermanagement
Customer pricing Product aggregation Third partymanagement
Productpricing
Segment management
Brand management
Marketing, sales and servicing
Channel integration and management
Finance
Humanresources IT Purchasing
Legal andcompliance
SIMPLIFIED ON THE INSIDE
Customer pricingProduct aggregation Product
pricing
Ser vice integration
Distribution
Pro
du
cts
&
M
ark
ets
Sa
les
&
Se
rvic
e
C&G Cards SW
3rd
Parties
CA GIBusiness CardsC&GSavingsLendingCurrent
Accounts
Distribution
Sa
les
&
Se
rvic
e
C&GCA
Hu
bM
an
ufa
ctu
rin
g
Co
rp
co
re
Knowledgemanagement
Products
Crossproduct
Product development
Ser vice integrationCustomermanagement
Customer pricing Product aggregation Third partymanagement
Productpricing
Finance
Humanresources IT Purchasing
Legal andcompliance
SIMPLIFIED ON THE INSIDE
Customer pricingProduct aggregation Product
pricing
Ser vice integration
Copyright © 2009 Accenture All Rights Reserved, 21
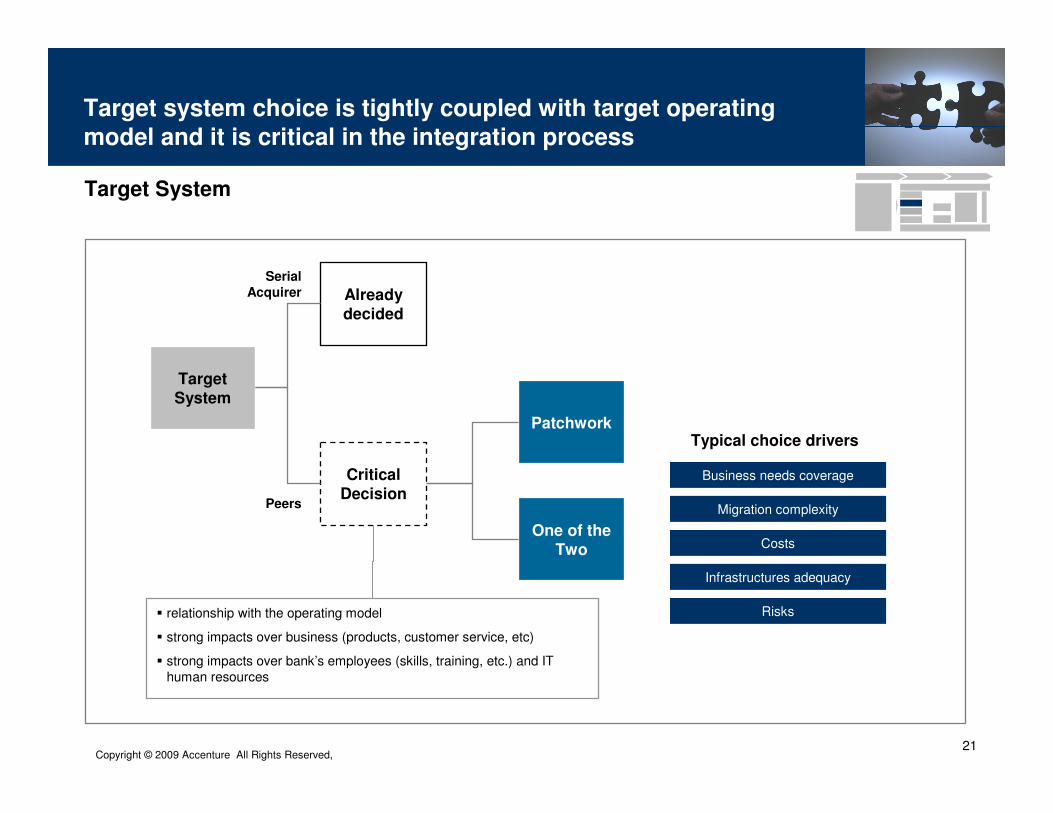
Already decided
Target System
� relationship with the operating model
� strong impacts over business (products, customer service, etc)
� strong impacts over bank’s employees (skills, training, etc.) and IT human resources
Target System
Patchwork
Critical Decision
Serial
Acquirer
Peers
One of the Two
Typical choice drivers
Business needs coverage
Migration complexity
Costs
Infrastructures adequacy
Risks
Target system choice is tightly coupled with target operating
model and it is critical in the integration process
Copyright © 2009 Accenture All Rights Reserved, 22
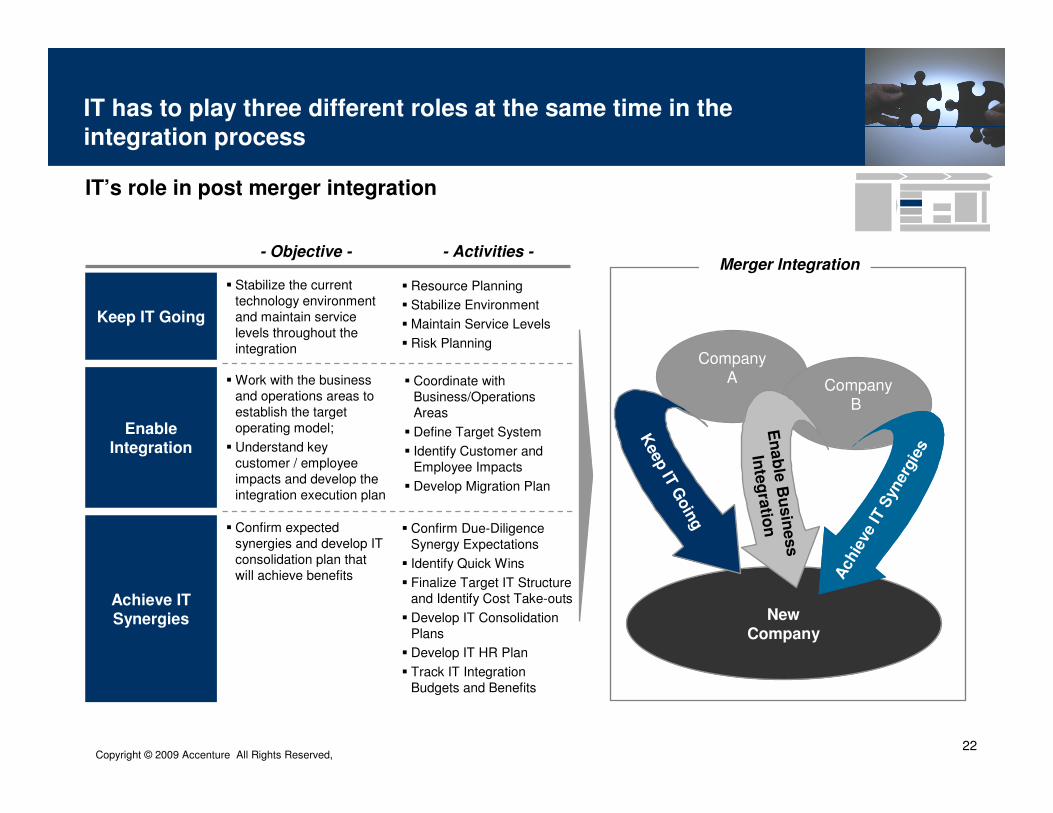
Keep IT Going
Enable Integration
Achieve IT Synergies
� Stabilize the current technology environment and maintain service levels throughout the integration
� Work with the business and operations areas to establish the target operating model;
� Understand key customer / employee impacts and develop the integration execution plan
� Confirm expected synergies and develop IT consolidation plan that will achieve benefits
- Activities -- Objective -
� Resource Planning
� Stabilize Environment
� Maintain Service Levels
� Risk Planning
� Coordinate with Business/Operations Areas
� Define Target System
� Identify Customer and Employee Impacts
� Develop Migration Plan
� Confirm Due-Diligence Synergy Expectations
� Identify Quick Wins
� Finalize Target IT Structure and Identify Cost Take-outs
� Develop IT Consolidation Plans
� Develop IT HR Plan
� Track IT Integration Budgets and Benefits
Company A
New Company
Company B
Keep IT
Goin
g
En
ab
le B
usin
ess
Inte
gra
tion
Achie
ve IT
Syn
erg
ies
Merger Integration
IT has to play three different roles at the same time in the
integration process
IT’s role in post merger integration
Copyright © 2009 Accenture All Rights Reserved, 23
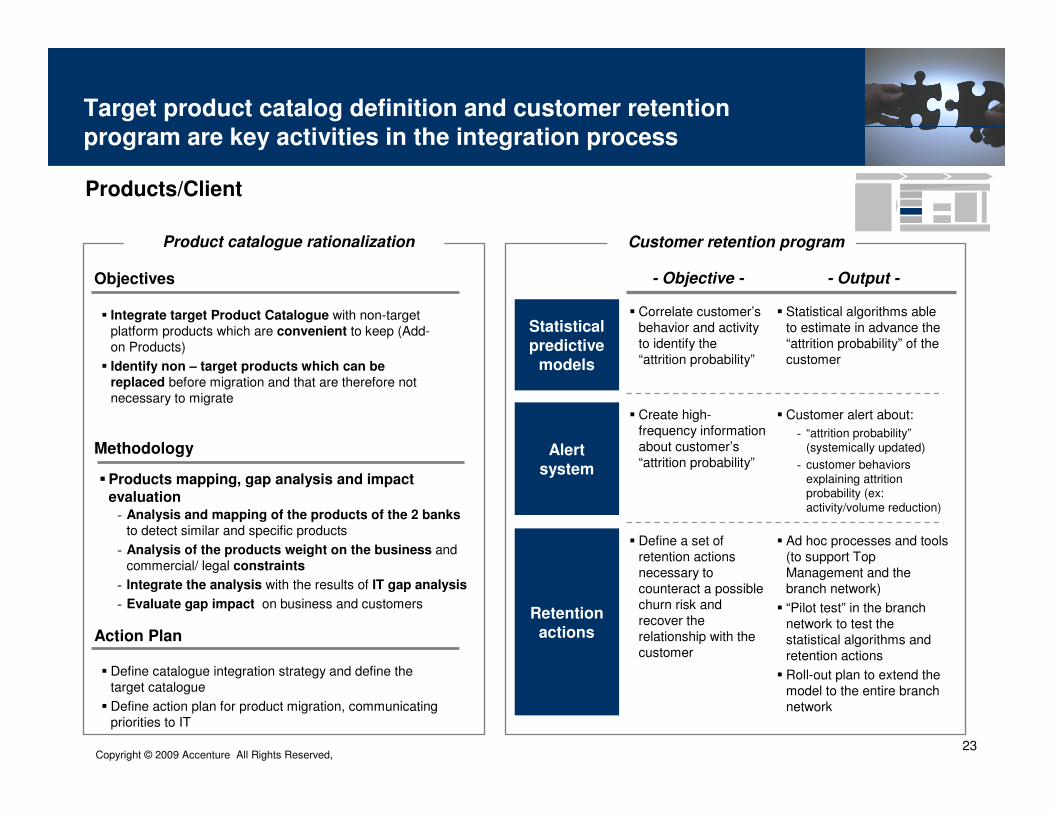
Products/Client
Statistical predictive
models
Alert system
Retention actions
� Correlate customer’s behavior and activity to identify the “attrition probability”
� Create high-frequency information about customer’s “attrition probability”
� Define a set of retention actions necessary to counteract a possible churn risk and recover the relationship with the customer
- Output -- Objective -
� Statistical algorithms able to estimate in advance the “attrition probability” of the customer
� Customer alert about:
� Ad hoc processes and tools (to support Top Management and the branch network)
� “Pilot test” in the branch network to test the statistical algorithms and retention actions
� Roll-out plan to extend the model to the entire branch network
- “attrition probability”(systemically updated)
- customer behaviors explaining attrition probability (ex: activity/volume reduction)
� Integrate target Product Catalogue with non-target platform products which are convenient to keep (Add-on Products)
� Identify non – target products which can be
replaced before migration and that are therefore not necessary to migrate
Objectives
Methodology
- Analysis and mapping of the products of the 2 banks
to detect similar and specific products
- Analysis of the products weight on the business andcommercial/ legal constraints
- Integrate the analysis with the results of IT gap analysis
- Evaluate gap impact on business and customers
Customer retention programProduct catalogue rationalization
�Products mapping, gap analysis and impact
evaluation
Action Plan
� Define catalogue integration strategy and define the target catalogue
� Define action plan for product migration, communicating priorities to IT
Target product catalog definition and customer retention
program are key activities in the integration process
Copyright © 2009 Accenture All Rights Reserved, 24
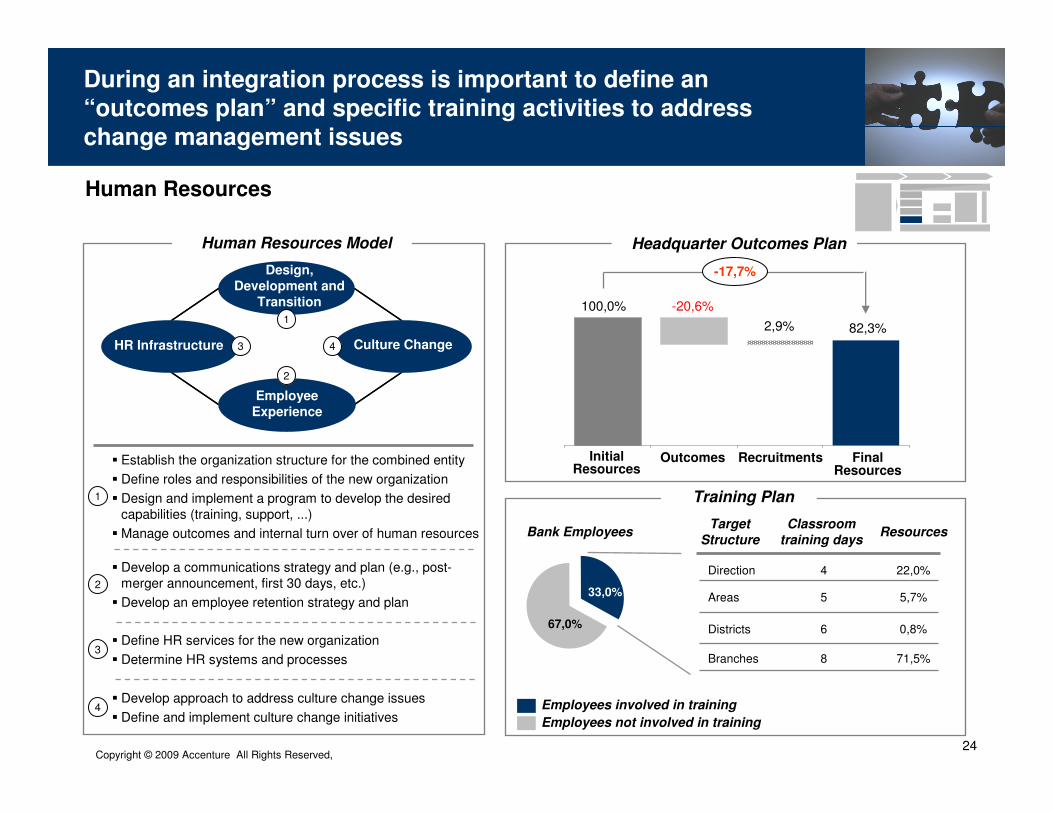
During an integration process is important to define an “outcomes plan” and specific training activities to address
change management issues
Organization
Design,
Development and
Transition
Culture Change
Employee
Experience
HR Infrastructure 3
1
4
2
1
2
3
4
4Direction
Target
Structure
Areas
Districts
Classroom
training daysResources
5
6
8Branches
22,0%
5,7%
0,8%
71,5%
� Establish the organization structure for the combined entity
� Define roles and responsibilities of the new organization
� Design and implement a program to develop the desired capabilities (training, support, ...)
� Manage outcomes and internal turn over of human resources
� Develop a communications strategy and plan (e.g., post-merger announcement, first 30 days, etc.)
� Develop an employee retention strategy and plan
� Define HR services for the new organization
� Determine HR systems and processes
� Develop approach to address culture change issues
� Define and implement culture change initiatives
100,0% -20,6%
2,9% 82,3%
OutcomesInitial Resources
Final Resources
Recruitments
Human Resources Model
Training Plan
Headquarter Outcomes Plan
-17,7%
33,0%
67,0%
Employees involved in training
Employees not involved in training
Bank Employees
Human Resources
Copyright © 2009 Accenture All Rights Reserved, 25
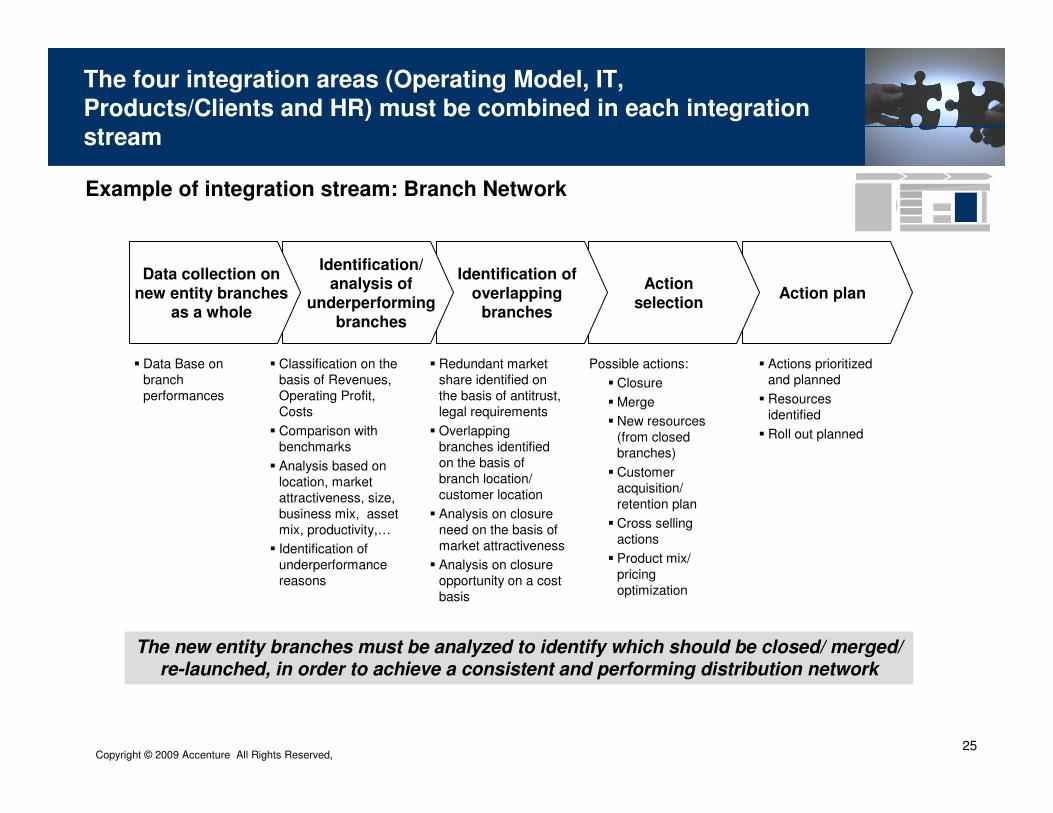
The new entity branches must be analyzed to identify which should be closed/ merged/ re-launched, in order to achieve a consistent and performing distribution network
Action planAction
selection
Identification of overlapping
branches
Identification/ analysis of
underperforming branches
Data collection on new entity branches
as a whole
� Data Base on branch performances
� Actions prioritized and planned
� Resources identified
� Roll out planned
� Classification on the basis of Revenues, Operating Profit, Costs
� Comparison with benchmarks
� Analysis based on location, market attractiveness, size, business mix, asset mix, productivity,…
� Identification of underperformance reasons
� Redundant market share identified on the basis of antitrust, legal requirements
� Overlapping branches identified on the basis of branch location/ customer location
� Analysis on closure need on the basis of market attractiveness
� Analysis on closure opportunity on a cost basis
Possible actions:
� Closure
� Merge
� New resources (from closed branches)
� Customer acquisition/ retention plan
� Cross selling actions
� Product mix/ pricing optimization
Example of integration stream: Branch Network
The four integration areas (Operating Model, IT, Products/Clients and HR) must be combined in each integration
stream
Copyright © 2009 Accenture All Rights Reserved, 26
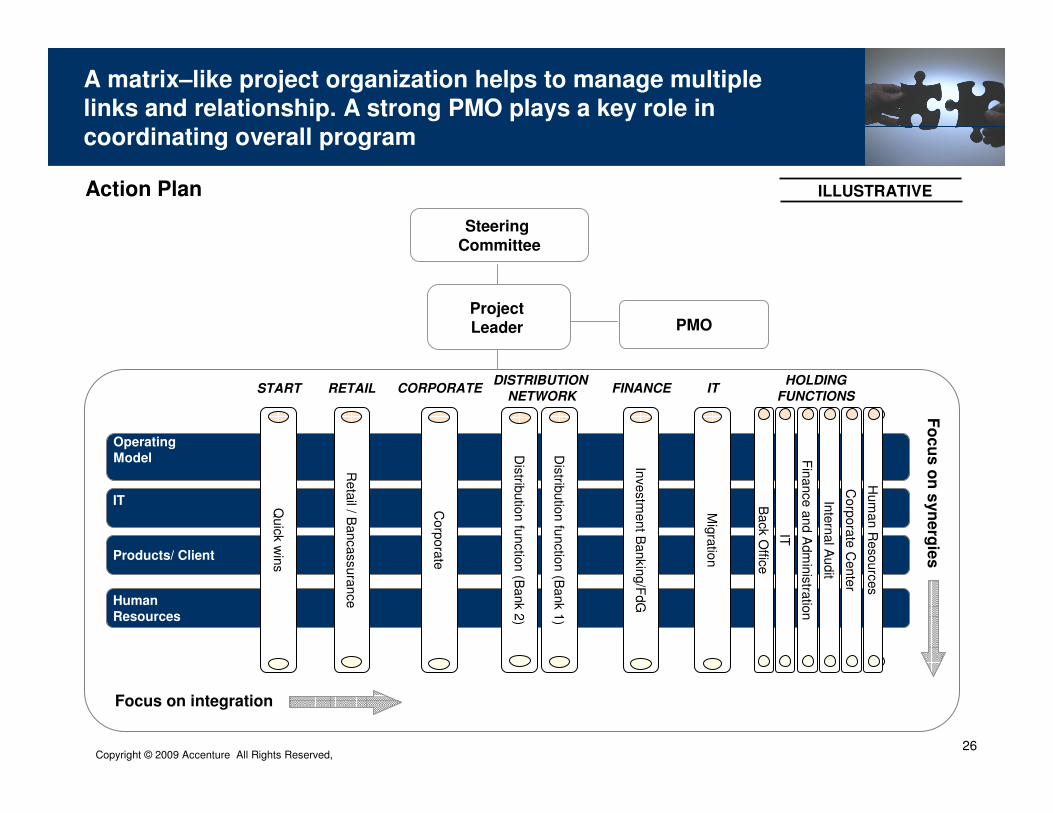
Steering Committee
PMO
Human
Resources
Operating
Model
IT
Products/ Client
START RETAIL CORPORATEDISTRIBUTION
NETWORKFINANCE IT
HOLDING
FUNCTIONS
Mig
ratio
n
Hum
an R
eso
urc
es
Corp
ora
te C
ente
r
Inte
rnal A
udit
Fin
ance a
nd A
dm
inis
tratio
n
Corp
ora
te
Quick
win
s
Project Leader
Action Plan
A matrix–like project organization helps to manage multiple links and relationship. A strong PMO plays a key role in
coordinating overall program
Focus on integration
Fo
cu
s o
n s
yn
erg
ies
IT
Back
Offic
e
Inve
stm
ent B
ankin
g/F
dG
Dis
tributio
n fu
nctio
n (B
ank 1
)
Dis
tributio
n fu
nctio
n (B
ank 2
)
Reta
il / Bancassura
nce
ILLUSTRATIVE
Copyright © 2009 Accenture All Rights Reserved, 27
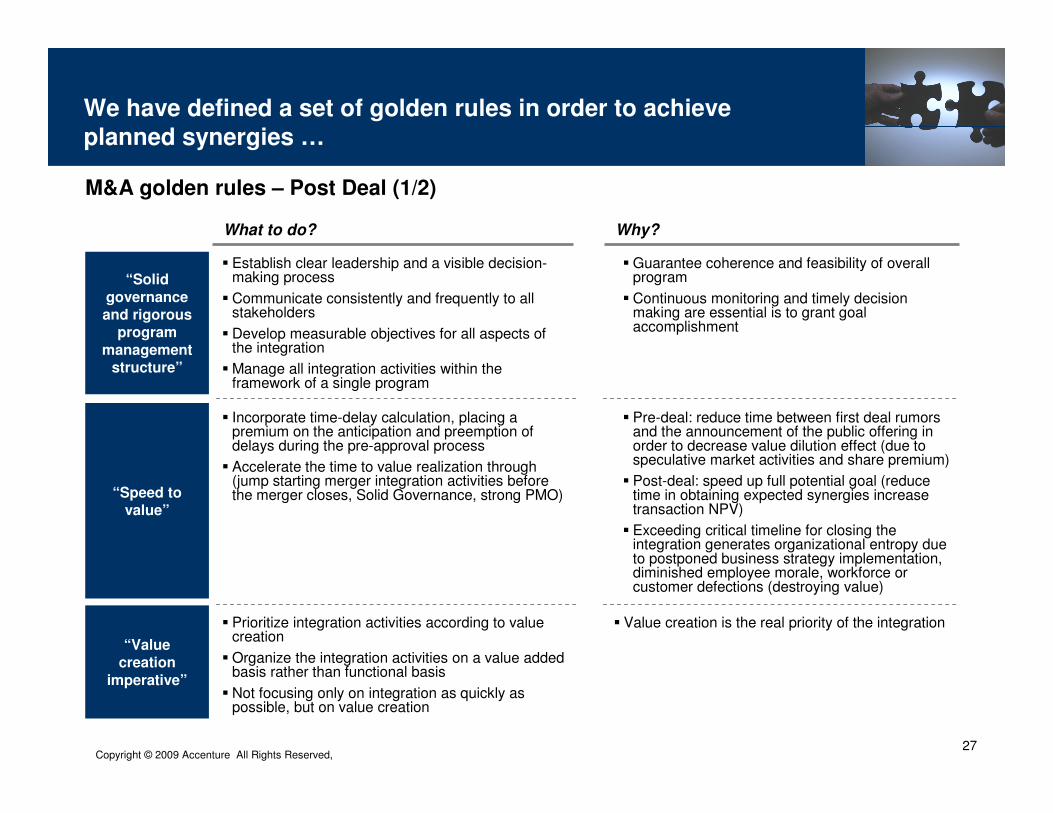
What to do? Why?
We have defined a set of golden rules in order to achieve
planned synergies …
� Establish clear leadership and a visible decision-making process
� Communicate consistently and frequently to all stakeholders
� Develop measurable objectives for all aspects of the integration
� Manage all integration activities within the framework of a single program
“Solid
governance and rigorous
program
management structure”
� Incorporate time-delay calculation, placing a premium on the anticipation and preemption of delays during the pre-approval process
� Accelerate the time to value realization through (jump starting merger integration activities before the merger closes, Solid Governance, strong PMO)“Speed to
value”
� Prioritize integration activities according to value creation
� Organize the integration activities on a value added basis rather than functional basis
� Not focusing only on integration as quickly as possible, but on value creation
� Value creation is the real priority of the integration
“Value creation
imperative”
M&A golden rules – Post Deal (1/2)
� Guarantee coherence and feasibility of overall program
� Continuous monitoring and timely decision making are essential is to grant goal accomplishment
� Pre-deal: reduce time between first deal rumors and the announcement of the public offering in order to decrease value dilution effect (due to speculative market activities and share premium)
� Post-deal: speed up full potential goal (reduce time in obtaining expected synergies increase transaction NPV)
� Exceeding critical timeline for closing the integration generates organizational entropy due to postponed business strategy implementation, diminished employee morale, workforce or customer defections (destroying value)
Copyright © 2009 Accenture All Rights Reserved, 28
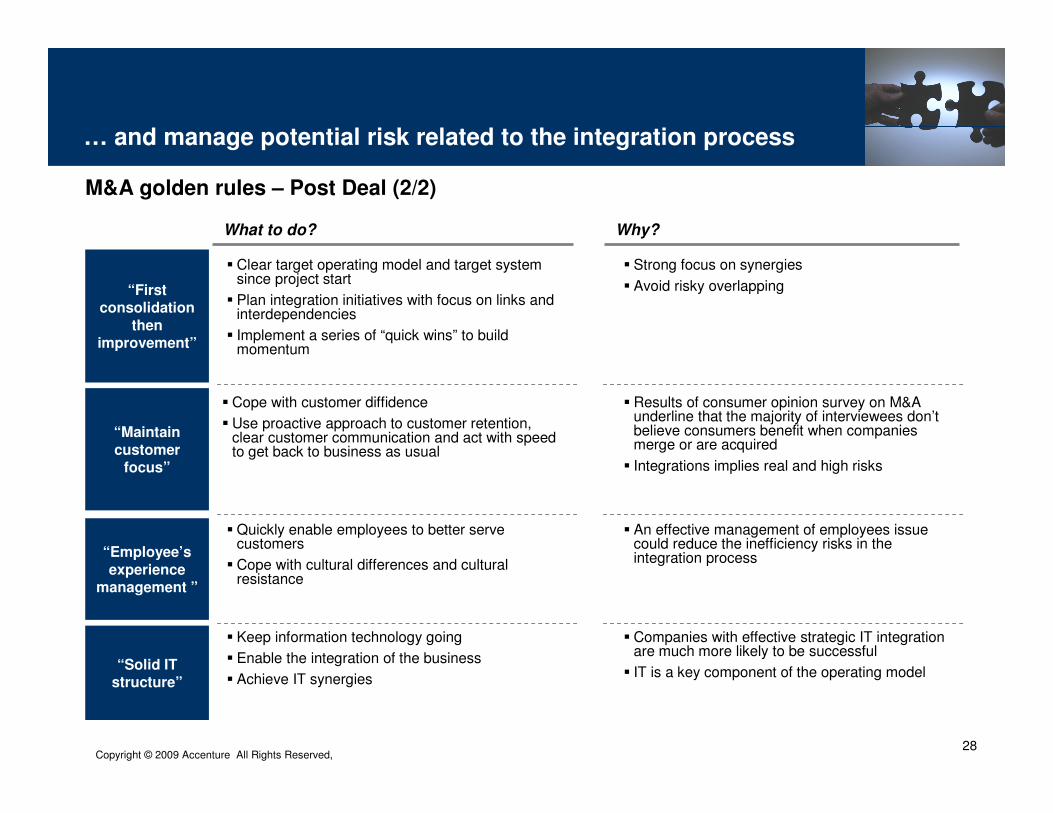
What to do? Why?
“First consolidation
then improvement”
� Cope with customer diffidence
� Use proactive approach to customer retention, clear customer communication and act with speed to get back to business as usual
� Results of consumer opinion survey on M&A underline that the majority of interviewees don’t believe consumers benefit when companies merge or are acquired
� Integrations implies real and high risks
“Maintain
customer focus”
“Employee’s
experience management ”
“Solid IT structure”
� Quickly enable employees to better serve customers
� Cope with cultural differences and cultural resistance
� An effective management of employees issue could reduce the inefficiency risks in the integration process
� Keep information technology going
� Enable the integration of the business
� Achieve IT synergies
� Companies with effective strategic IT integration are much more likely to be successful
� IT is a key component of the operating model
� Strong focus on synergies
� Avoid risky overlapping
� Clear target operating model and target system since project start
� Plan integration initiatives with focus on links and interdependencies
� Implement a series of “quick wins” to build momentum
M&A golden rules – Post Deal (2/2)
… and manage potential risk related to the integration process