sybil p. seitzinger international geosphere-biosphere program (igbp) stockholm, sweden modeling...
Post on 20-Dec-2015
215 views
TRANSCRIPT
Sybil P. SeitzingerInternational Geosphere-Biosphere Program (IGBP)
Stockholm, Sweden
Modeling global river export: N, P, C, Si


Coastal effects
Sellman et al. 2007
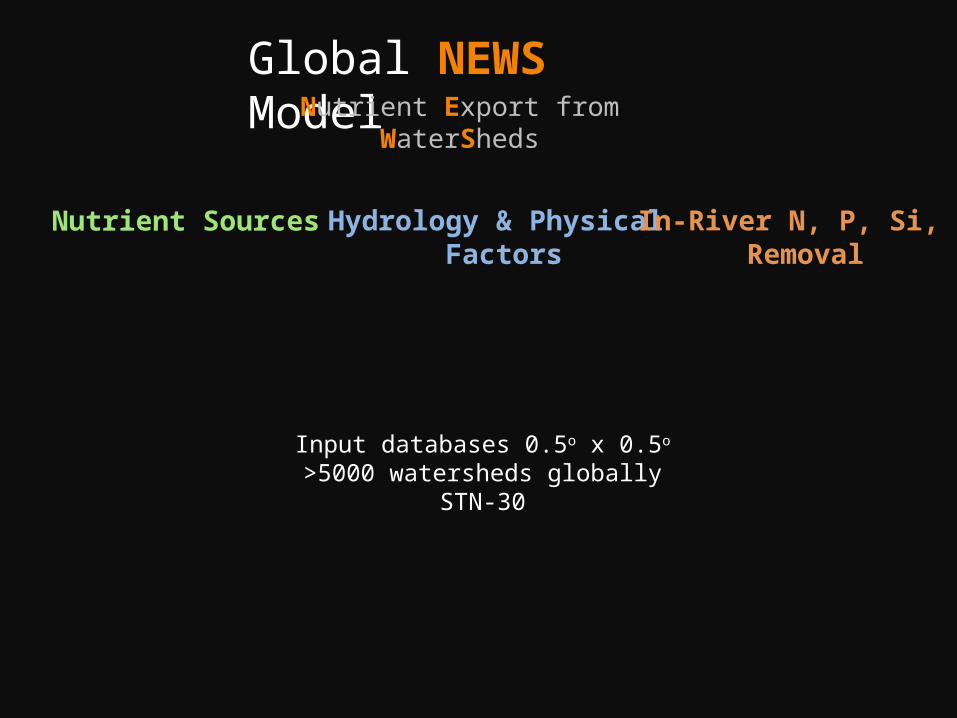
Nutrient Sources Hydrology & Physical Factors
In-River N, P, Si, CRemoval
Global NEWS ModelNutrient Export from WaterSheds
Input databases 0.5o x 0.5o
>5000 watersheds globallySTN-30

Nutrient Sources
NaturalN2-FixationP Weathering
AnthropogenicNon-PointFertilizer (by crop type)
N2-fixation - crops Manure (by animal species) Atmos. Dep. N PointSewage(pop.; treatment level)
Global WatershedsWater RunoffPrecip. IntensityLand-useSlope
Hydrology & Physical Factors
Rivers & Reservoir Consumptive Water Use
In-River N, P, Si, CRemoval
Nutrient Loading toCoastal Waters
Seitzinger et al. 2005, Mayorga et al. 2010Seitzinger et al. 2010
Global NEWS Model

At river mouths, predict export of:
Global NEWS ModelNutrient Export from WaterSheds
* DIC in prep.
Seitzinger et al. 2005, Mayorga et al. 2010Seitzinger et al. 2010
Dissolved ParticulateInorganic Organic
N DIN DON PN
P DIP DOP PP
C DIC* DOC POC
Si DSi

Equation for DIN as example
YldF = Feriv,F * [(RSpntF + Rsdifant,F) + Rsdifnat,F
Rsdifant,DIN = Fews,DIN * WSdifant,N + Agfr * (fDIN(Rnat) * ECDIN), where:
Fews,DIN = eDIN * fDIN(Rnat)
WSdifant,N = WSdiffe,N + WSdifma,N + WSdiffix,ant,N = WSdifdep,ant,N – WSdifex,N]

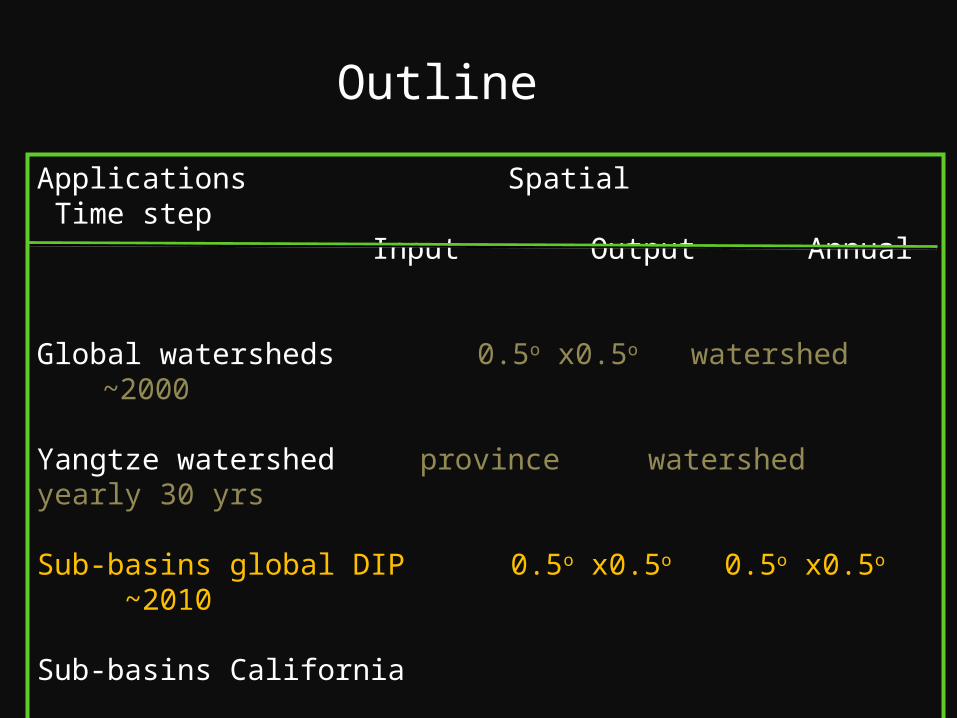
Outline
Applications Spatial Time step Input Output Annual
Global watersheds Yangtze watershed
Sub-basins global DIP
Sub-basins California
Scenarios – global

Outline
Applications Spatial Time step Input Output Annual
Global watersheds 0.5o x0.5o watershed ~2005 > 5000 watersheds
Yangtze watershed
Sub-basins global DIP
Sub-basins California
Scenarios – global

Nutrient Sources
NaturalN2-FixationP Weathering
AnthropogenicNon-PointFertilizer (by crop type)
N2-fixation - crops Manure (by animal species) Atmos. Dep. N PointSewage(pop.; treatment level)
Global WatershedsWater RunoffPrecip. IntensityLand-useSlope
Hydrology & Physical Factors
Rivers & Reservoir Consumptive Water Use
In-River N, P, Si, CRemoval
Nutrient Loading toCoastal Waters
Seitzinger et al. 2005, Mayorga et al. 2010Seitzinger et al. 2010
Global NEWS Model

Mod
eled
DIN
expo
rt(k
g N
bas
in-1
y-1)
Measured DI N export(kg N basin- 1 y- 1)
ChangJ iang
RhineMississippi
Elbe
Yukon
KolymaKamkatcha
Susquehanna
R2=0.79
DIN
Measured DOC yield(kg C km-2 yr-1)
Mod
eled
DO
C y
ield
(kg
C k
m-2 y
r-1)
Measured DIN export(kg N basin-1 yr-1)
Mod
eled
DIN
exp
ort
(kg
N b
asin
-1 y
r-1)
Colorado
Dnepr
Susquehanna
Gambia
Ganges
Rhine
R2=0.88
Ganges
Dumont et al. Harrison et al. Global Biogeochem Cycles 2005

River transport of DIN to coastkg N/km2/yr
>5000 watersheds
Seitzinger et al. 2005 Global Biogeochemical Cycles

Outline
Applications Spatial Time step Input Output Annual
Global watersheds 0.5o x0.5o watershed ~2005
Yangtze watershed province watershed yearly 30 yrs
Sub-basins global DIP
Sub-basins California
Scenarios – global

Yangtze river watershedannual 1970 – 2003
Yan et al. 2010 GBC
Atmos. N deposition
Model Predicted
Measured
Total N input
FertilizerManure
N2-fixation
Province level N input data
River DIN Export
Outline
Applications Spatial Time step Input Output Annual
Global watersheds 0.5o x0.5o watershed ~2000
Yangtze watershed province watershed yearly 30 yrs
Sub-basins global DIP 0.5o x0.5o 0.5o x0.5o ~2010
Sub-basins California
Scenarios – global

Hi resolution NEWS-DIPSub-basin0.5o x 0.5o
Harrison et al. 2010 GBC
Measured data Model vs Data

NEWS-Predicted DIP Yield(kg P / km2 / yr)NEWS-DIP-2005
NEWS-DIP-HD-2010
Harrison et al., GBC 2010
Basin
Sub-basin

Outline
Applications Spatial Time step Input Output Annual
Global watersheds 0.5o x0.5o watershed ~2005
Yangtze watershed province watershed yearly 30 yrs
Sub-basins global DIP 0.5o x0.5o 0.5o x0.5o ~2010
Sub-basins California 1 km watershed ~2000
Scenarios – global

Measured DOC Yield(kg C / km2 / yr)
(Data courtesy of R. Dahlgren and USGS)
Basin delineations: USGSRunoff: USGSPotential Runoff: DWRLand Use: Fire and ResourceAssessment Program (FRAP)Concentration: Dahlgren (1999-2004)
r2 validation = 0.80
n = 22
Harrison et al. In prep.
NEWS DOC Yield(kg C / km2 / yr)

Outline
Applications Spatial Time step Input Output Annual
Global watersheds 0.5o x0.5o watershed ~2005
Yangtze watershed province watershed yearly 30 yrs
Sub-basins global DIP 0.5o x0.5o 0.5o x0.5o ~2010
Sub-basins California various watershed ~2000
Scenarios – global 0.5o x0.5o watershed 2000-2030-2050
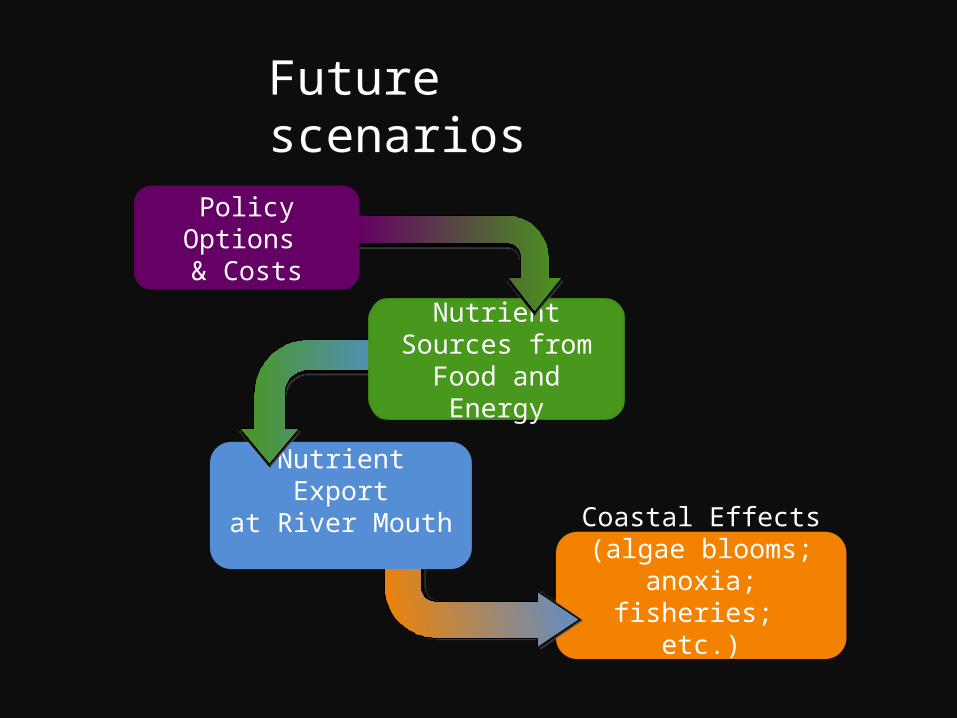
Coastal Effects(algae blooms; anoxia;
fisheries; etc.)
Nutrient Exportat River Mouth
Future scenarios
Nutrient Sources from Food and
Energy
Policy Options & Costs
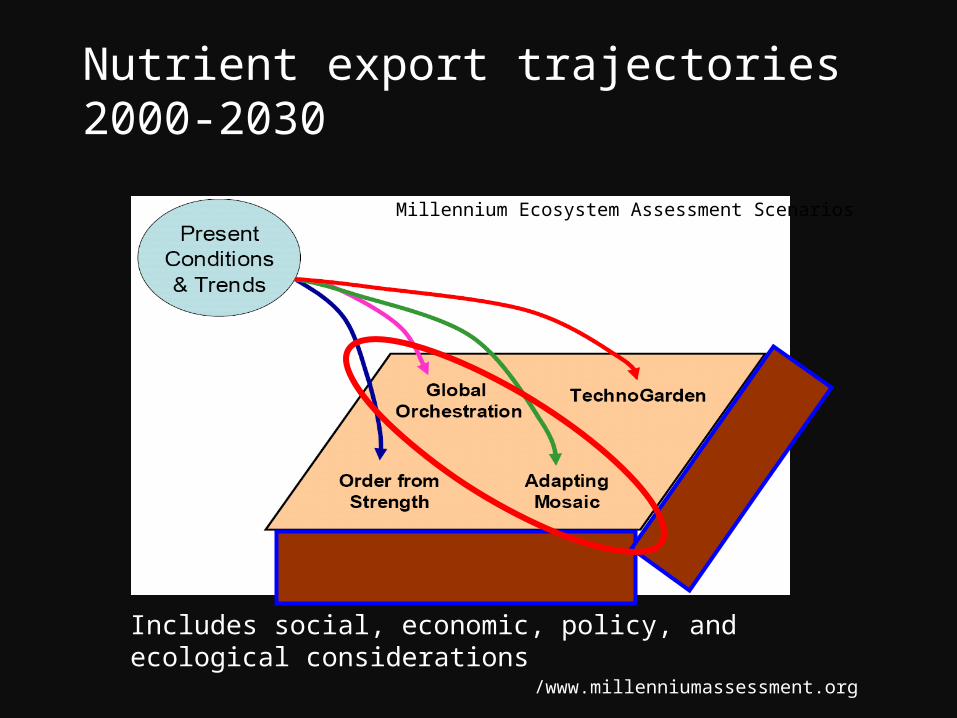
Nutrient export trajectories 2000-2030
Includes social, economic, policy, and ecological considerations
/www.millenniumassessment.org
Millennium Ecosystem Assessment Scenarios

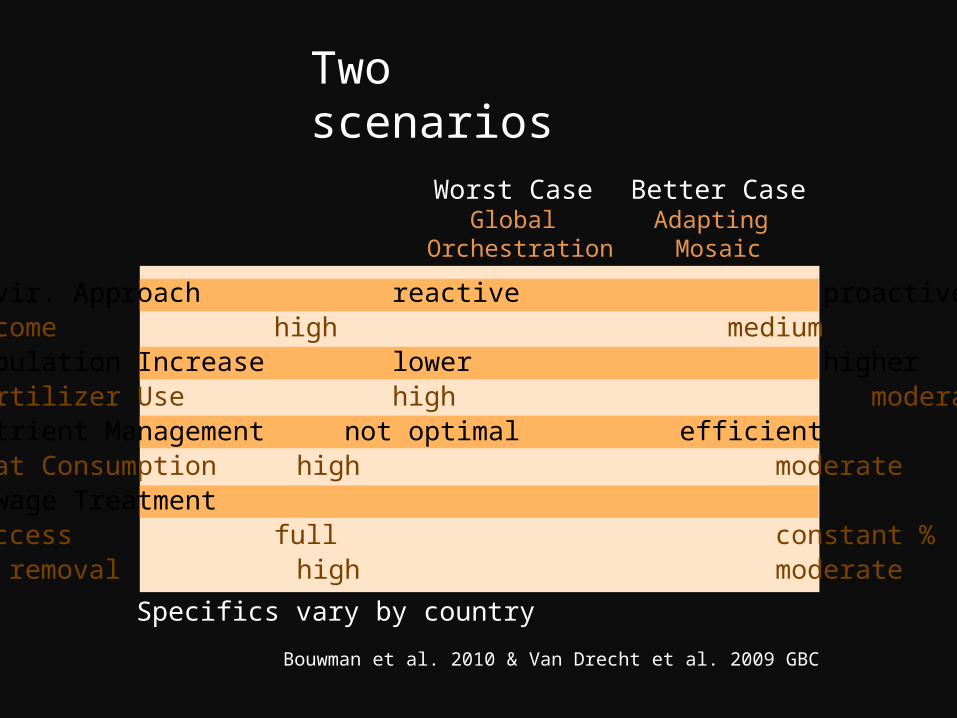
Worst CaseGlobal
Orchestration
Better CaseAdapting Mosaic
Envir. Approach reactive proactiveIncome high mediumPopulation Increase lower higherFertilizer Use high moderateNutrient Management not optimal efficientMeat Consumption high moderateSewage Treatment
access full constant %N removal high moderate
Specifics vary by country
Bouwman et al. 2010 & Van Drecht et al. 2009 GBC
Two scenarios
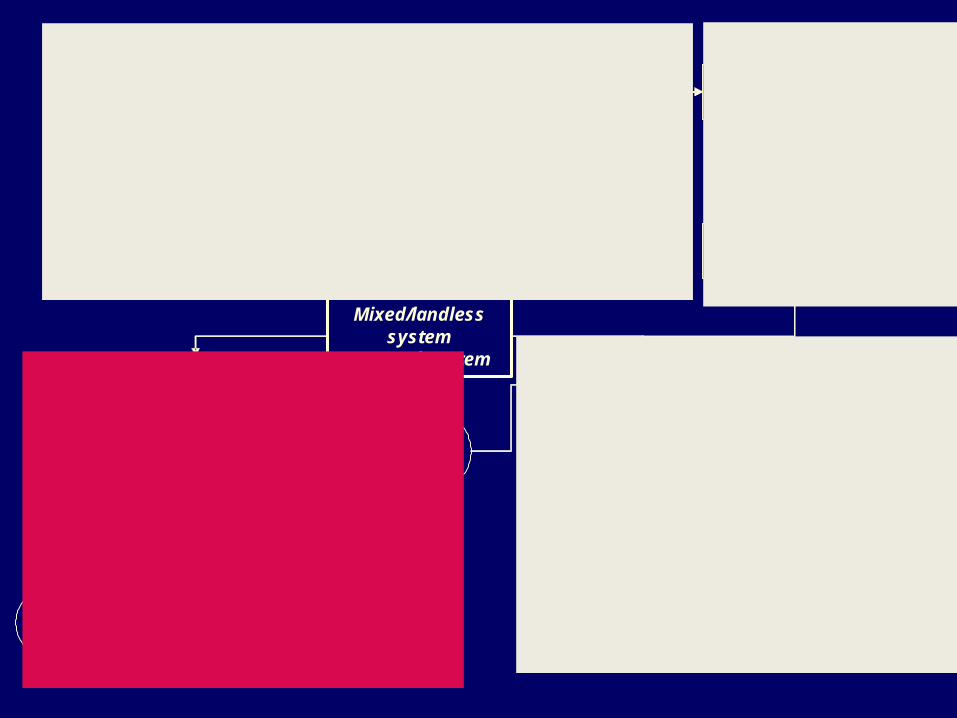
REFERENCE
Population
GDP
Agriculturaldemand
Agriculturaltrade
Domestic foodproduction
Mixed/landlesssystem
Pastoral systemMeat and
Milk production
Production per animal
Animalstocks
Grasslandarea
Croplandarea
Cropyield
Food/feed/energycrop production
Animalfeed
Fig. 1b
FeedcropsFig. 1b
Climate, CO2
AnimalmanureFig. 1c
Croppingintensity
Fertilizeruse
Fig. 1d
TIMER Energymodel
Energy cropproduction
MA scenario
Technology
Worst CaseGlobal
Orchestration
Better CaseAdapting Mosaic
Envir. Approach reactive proactiveIncome high mediumPopulation Increase lower higherFertilizer Use high moderateNutrient Management not optimal efficientMeat Consumption high moderateSewage Treatment
access full constant %N removal high moderate
Specifics vary by country
Bouwman et al. 2010 & Van Drecht et al. 2009 GBC
Two scenarios
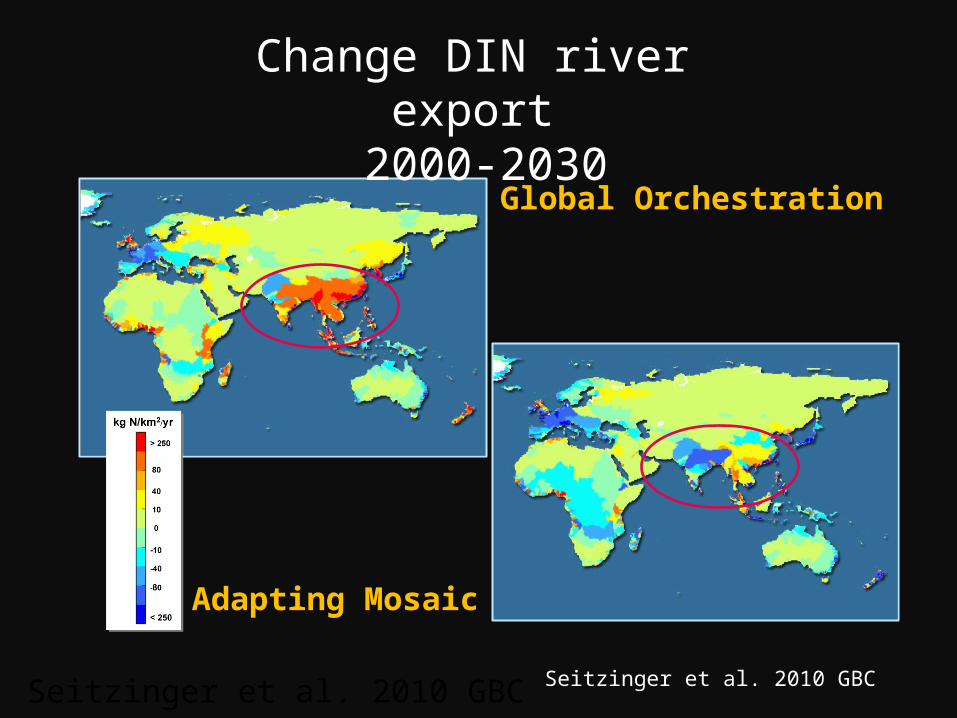
Global Orchestration
Adapting Mosaic
Seitzinger et al. 2010 GBC
Change DIN river export 2000-2030
Seitzinger et al. 2010 GBC

Contribution to river DIN exportSouth Asia
Seitzinger et al. 2010, GBC
How were improvements
achieved?
•Sewage connectivity constant %•Technological NOx controls•Lower meat consumption•Efficient management nitrogenin agriculture
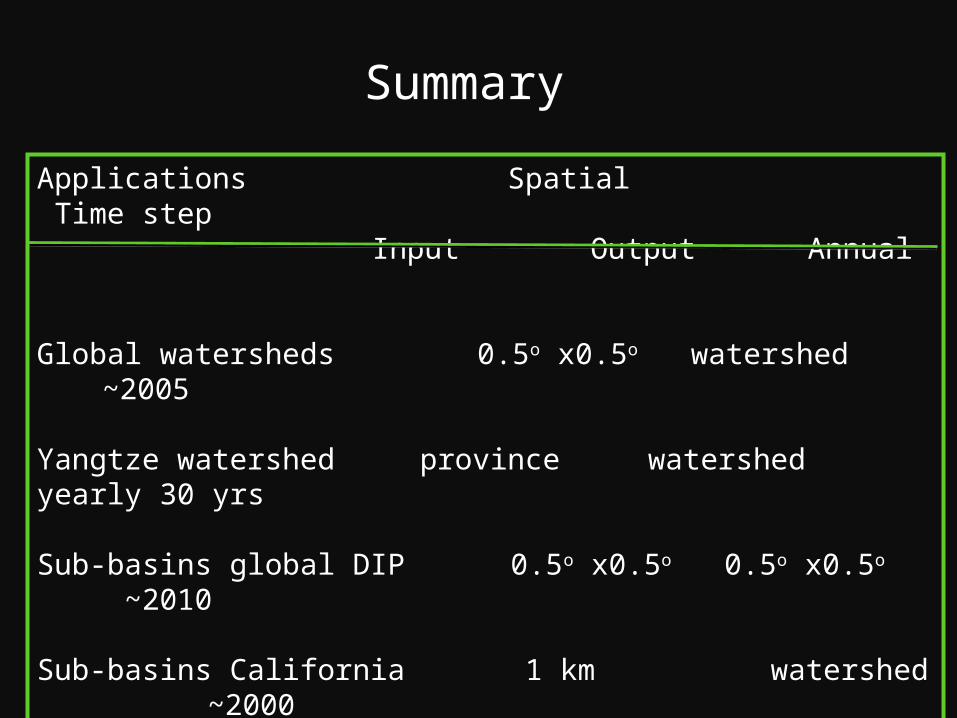
Summary
Applications Spatial Time step Input Output Annual
Global watersheds 0.5o x0.5o watershed ~2005
Yangtze watershed province watershed yearly 30 yrs
Sub-basins global DIP 0.5o x0.5o 0.5o x0.5o ~2010
Sub-basins California 1 km watershed ~2000
Scenarios – global 0.5o x0.5o watershed 2000-2030-2050
Mayorga et al. 2010 Model development, Envir. Modelling & Software
Global Biogeochemical Cycles 2010 - Special section
Seitzinger et al. overviewBouwman et al. agricultureVan Drecht et al. urban wastewaterFeteke et al. hydrologyHarrison et al. hi resolution DIPYan et al. Yangtze river
Acknowlegements and for more details


Nutrient Sources Hydrology & Physical Factors
In-River N, P, SiRemoval
Input Databases 0.5o x 0.5o
> 5000 watersheds globally
Global NEWS Model Nutrient Export from WaterSheds

DIN export change w/ 2030 climate
-1
0
1
2
3
4
Tg
N /y
r
GO 2030
2000 N Inputs w/ GO 2030 Climate
Change DIN vs. 2000
Water runoff change
DIN change - Climate onlyMayorga, Seitzinger in prep.

DIN export change
-1
0
1
2
3
4
Tg
N /y
r
GO 2030
2000 N Inputs w/ GO 2030 Climate
Change vs. 2000
Global Orchestration
Climate onlyMayorga, Seitzinger in prep.

Effect of climate change only on DIN river export?