swiss tourism statistics 2015 - federal council
TRANSCRIPT
Neuchâtel 2016
10Tourism
Swiss tourism statistics 2015
1074-1500

Topic of Tourism
Current publications linked with this topic
Almost all publications published by the FSO are available in electronic form on the website www.statistik.ch free of charge. Print publications can be ordered by telephone on 058 463 60 60 or by emailing [email protected].
Monthly press releases on the hotel sector,Neuchâtel 2016, 3 pages, free of charge,FSO number: 0353-1601-70
Annual press releases on campsites and youth hostels,Neuchâtel 2016, 1 page, free of charge,FSO number: 0353-1604-50
The revised Tourism Satellite Account for 2011,Neuchâtel 2015, 20 pages, free of charge,FSO number: 1009-1100
Reisen der Schweizer Wohnbevölkerung 2014,Neuchâtel 2015, 4 pages, free of charge,FSO number: 502-1400
Topic of Tourism online
www.statistics.ch R Look for statistics R 10 – Tourismor www.tourismus.bfs.admin.ch

Swiss tourism statistics
Contents Yves Strauss, FSO; Tatiana Amaudruz, FSO; Lisa Joly, FSO; Hanja Maksim, FSO; Jean-Luc Muralti, FSO; Christof Seewer, FSO; Jerry Suk FSO;
Published by: Federal Statistical Office (FSO)
Neuchâtel 2016
Swiss statistics

Published by: Federal Statistical Office (FSO)
Information: Yves Strauss, FSO, tel. 058 463 65 73
Contents: Yves Strauss, FSO; Tatiana Amaudruz, FSO; Lisa Joly, FSO; Hanja Maksim, FSO; Jean-Luc Muralti, FSO; Christof Seewer, FSO; Jerry Suk, FSO
Series: Swiss Statistics
Topic: 10 Tourism
Original text: French / German
Translation: FSO language services
Layout: DIAMSection,Prepress / Print
Graphics: DIAMSection,Prepress / Print
Maps: DIAM Section, ThemaKart
Front page: FSO;Concept:Netthoevel&Gaberthüel,Biel; Photograph:©SwitzerlandTourism/LuciaDegonda
Printed: in Switzerland
Copyright: FSO, Neuchâtel 2016 Reproduction with mention of source authorised (except for commercial purposes).
Print format orders: Federal Statistical Office, CH-2010 Neuchâtel, tel.+41584636060,fax+41584636061,[email protected]
Price: CHF 15.– (VAT not incl.)
Downloads: www.statistics.admin.ch (free of charge)
FSO number: 1074-1500
ISBN: 978-3-303-10468-2

32016 FSO SWISS TOURISM STATISTICS 2015
FACTS&FIGureS
Facts & Figures
FactsandFigures2015
10Tourism
Sources: FSO – Tourist accommodation statistics, Travel behaviour, Indicators of the tourism satellite account, © FSO Neuchâtel 2016 | gi-f-10.00.01_2016 index of consumer prices | [email protected]
hotel
5 055Hotels and health spas surveyed
51.5%roomoccupancyrate
2.04 nightsAverage length of stayin a hotel
Tourist regionsDistribution of overnight stays in millions
Zurich region 5.6
Graubünden 4.7
Bernese Oberland 3.7
Valais 3.7
Lucerne/Lake Lucerne 3.6
Geneva 3.0
Lake Geneva region 2.7
Ticino 2.2
Eastern Switzerland 1.9
Basel region 1.5
Bern region 1.0
Jura & Three Lakes 0.7
Aargau region 0.8
Fribourg region 0.5
55bedsavailable per establi-shment on average
63% share of trips(with overnight stays) abroad (2014)
Gross value addedfrom tourism (2014)
CHF 17.4 bill.
Number of tripsper person livingin switzerland (2014)
10.3 (without
overnight stays)
2.9 (with
overnight stays)
170 118Number of jobs in tourism (FTE)(2014)
35.6m overnight stays in hotelaccommodation
Switzerland 16.1mAmerica 2.4mAfrica 0.3mAsia 4.7mOceania 0.3mEurope 11.8m
–2.5% Growth in consumer pricesin hotel accommodation (2014/2015)

52016 FSO SWISS TOURISM STATISTICS 2015
TABLeOFCONTeNTS
Tableofcontents
Facts & Figures 3
1 Introduction 7
1.1 Objectives 7
1.2 Organisation 7
1.3 Statistics and surveys 71.3.1 Tourist accommodation statistics 71.3.2 Surveyonthetravelbehaviourofthepopulation
resident in Switzerland 81.3.3 Annual Indicators of the Tourism Satellite Accounts 8
2 Tourist accommodation statistics 9
2.1 Supply in tourist accommodation 92.1.1 Supply in 2015 92.1.2 Change in the supply 10
2.2 Demand in tourist accommodation 112.2.1 Generaltrendindemand 112.2.2 Monthly change in demand 122.2.3 Change in domestic and foreign demand 132.2.4 Changeindemandfromeurope 142.2.5 Change in demand from Asia 152.2.6 Change in demand from America,
Africa and Oceania 162.2.7 Changeindemandbytouristregion 17
2.3 Duration of stay 18
2.4 Room occupancy rate 19
2.5 Change in demand in the countries neighbouring Switzerland 19
3 Travel behaviour of the Swiss resident population in 2014 20
3.1 Trips with overnight stays 203.1.1 Travel destinations 213.1.2 Duration of trips 213.1.3 Accommodation 223.1.4 Main means of transport 223.1.5 Comparison with the countries
neighbouringSwitzerland 233.1.6 Long-term change in trips with overnight stays 23
3.2 Day trips 24
4 Annual Indicators of the Tourism Satellite Accounts 25
4.1 Gross value added by tourism 25
4.2 Tourism demand 26
4.3 Tourism employment 27
5 Economic indicators 28
5.1 Gross domestic product in real terms 28
5.2 Consumer confidence index 28
5.3 Household final consumption expenditure 28
5.4 Swiss consumer price index 30
5.5 Harmonised index of consumer prices 30
5.6 Price level index in international comparison 31
5.7 Exchange rate 31

6 SWISS TOURISM STATISTICS 2015 FSO 2016
TABLeOFCONTeNTS
6 General observations 32
6.1 Surveys 326.1.1 Historical considerations concerning the tourist
accommodation statistics 326.1.2 Methodologicalobservationsoncampsites 326.1.3 Holidayandtravelbehaviour
of the Swiss resident population 326.1.4 Methodologicalobservationsonthemonetary
tourism statistics 33
6.2 Dissemination of data 33
6.3 Symbols used in the charts 33
Glossary 35
Appendix 39

72016 FSO SWISS TOURISM STATISTICS 2015
INTrODuCTION
1.1 Objectives
Themainobjectiveof theSwiss tourismstatistics is toofferacollatedoverviewof the tourismsector. Itaims tobring to-gethertheresultsofvariousstatisticsconductedbytheFederal Statistical Office (FSO) specific to the field of tourism and to offer a detailed insight into these.
Somereflectionshavebeenmadeinordertorevisitthispubli-cation prior to the introduction of the supplementary accommo-dationstatistics.Thespecificchangeswillbepresentedinthe2017editionwhenthefinaldatafor2016willbepublished.None-theless,somenewmeasureshavealreadybeenimplementedinthis edition, with the aim of not only improving understanding ofthefieldoftourism,butalsohighlightingthekeymessagesand results.
1.2 Organisation
ThispublicationdescribestheresultsoftheFSO'sSwisstourismstatistics. The first section deals with the tourist accommodation statistics (hotel accommodation, campsites and youth hostels) and presents the main data for the year 2015. The second section ofthispublicationconcernsthe2014surveyonthetravelbehav-iour of the Swiss population. The tourism satellite account, in the third section, gives information on the values measuring the economic influence of tourism in Switzerland. The fourth section ofthepublicationpresentsaseriesofeconomicindicatorsmak-ingitpossibletoplacethefindingsfromthetourismstatisticsin a wider context.
upto2015,datafortouristaccommodationstatisticswerecollectedonlyfromhotels,healthestablishments,youthhostelsand campsites. Information on holiday homes and group accom-modationwillbepresentedfrom2017onwardsinthesupplemen-tary accommodation statistics.
1.3 Statistics and surveys
1.3.1 Tourist accommodation statistics
Thetouristaccommodationstatistics(HeSTA)isacomprehen-sive survey conducted at national level covering 6 000 hotels, healthestablishments,youthhostelsandcampsites.Itspurposeistogatherdataonthenumberofestablishments,roomsandbedsaswellasdataonarrivalsandovernightstaysbyvisitors'countryoforiginandbyseverallevelsofregionalisation.Inotherwords,thissurveymakesitpossibletomeasuretrendsinsupplyanddemandatnationallevelandinSwitzerland'stouristregions,cantons and communes.
For historical and technical reasons, data for campsites and youth hostels collected from the supplementary accommodation sectorarealsocollectedviathissurvey.Theseresultsarepub-lishednationallyandbytouristregion.
1 Introduction

8 SWISS TOURISM STATISTICS 2015 FSO 2016
INTrODuCTION
1.3.2 Survey on the travel behaviour of the population resident in Switzerland
ThesurveyontravelbehaviouranalysesthemobilityoftheSwissresident population beyond its everyday trips. These data arecollected annually from a sample of the population. The survey providesinformationonthenumberofjourneysmade,theirchar-acteristics and the profile of passengers. It also offers details of the duration, destination and the purpose of travel, the means of transportusedandpossibletypesofaccommodation.Italsocov-erspassengersbysex,language,ageandseveralothervariables.
1.3.3 Annual Indicators of the Tourism Satellite Accounts
The annual indicators of the tourism satellite accounts provide initial estimates of the main aggregates of the most important tourist products in simplified form. The production of these an-nual indicators is focused on directly estimating the three key areas of the tourism satellite accounts: the gross value added bytourism,tourismdemandaswellasemploymentintourisminfull-timeequivalentjobs.ThesereferencevaluesenabletheeconomicinfluenceoftourisminSwitzerlandtobemeasured.

92016 FSO SWISS TOURISM STATISTICS 2015
TOurISTACCOMMODATIONSTATISTICS
2.1 Supply in tourist accommodation
2.1.1 Supply in 2015
In 2015, the tourist accommodation statistics comprised, on annualaverage,4 509openhotelsandhealthestablishmentsinSwitzerland,correspondingto128 979roomsand247 625bedsavailable (G2.1.1a). The distribution of establishments differsaccordingtothetouristregions.Graubündenhasthelargestpro-portion(14.0%),followedbyValais(12.4%).Thenationalaveragecapacityofahotelestablishmentwas55availablebeds(G2.1.1b).
In the area of supplementary accommodation (youth hostels andcampsitesonly),thegeographicaldistributionofestablish-ments is only slightly different from that of hotels. In fact, of the 410 campsites taken into consideration in the 2015 statistics, the majoritywereinValais(14.9%)andtheBerneseOberland(12.9%).As far as the 51 youth hostels included in the 2015 survey are concerned,Graubündenhadthelargestshare(15.7%),followedbytheZurichregion(13.7%).
2 Tourist accommodation statistics
With126bedsonaverageperestablishment,GenevahadthehighestnumberofbedsinSwitzerland in 2015.know?youDid
Number of establishments open in hotels and health establishments and distribution by tourist region in 2015 G 2.1.1a
© FSO 2016Source: FSO – Tourist accommodation statistics
GraubündenEastern SwitzerlandZurich RegionLucerne/Lake LucerneBasel RegionBern RegionBernese Oberland
Jura & Three-LakesLake Geneva Region (Vaud)GenevaValaisTicinoFribourg RegionAargau Region
Total number of establishments open: 4 509
14,0%
11,3%
8,1%
9,8%
2,8%
3,7%9,2%
5,5%
6,2%2,7%
12,4%
7,7%
2,6% 3,7%

10 SWISS TOURISM STATISTICS 2015 FSO 2016
TOurISTACCOMMODATIONSTATISTICS
2.1.2 Change in the supply
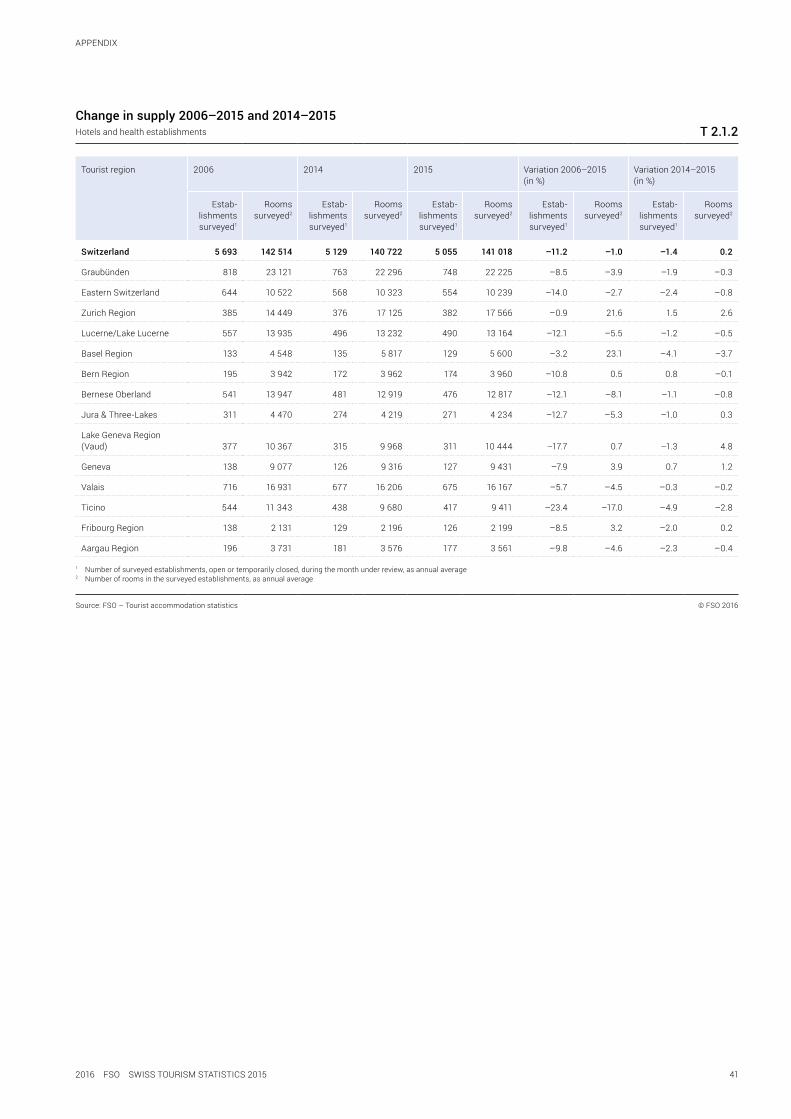
In 2015, a total of 5 055 establishments and 141 018 roomsweresurveyed inSwitzerland.Thenumberofestablishmentsdecreasedincomparisonwith2014(–74units/–1.4%)(G2.1.2a),whereas thenumberof rooms increased (+296units/+0.2%).Amongthetouristregions,thesupply,intermsofestablishments,alsodeclinedin11of14regionsbetween2014and2015.Intermsof rooms,despitean increaseobservedatnational level,only5 of 14regionsfollowedthistrend.
Overacomparativeperiodof10years(G2.1.2b),thenumberof surveyed establishments has diminished greatly. Thus in2006, thenumberof surveyedestablishments totalled5 693in Switzerland, corresponding in absolute terms to a declineover this period of more than 600 units (–11.2%). As far as the numberofroomsisconcerned,adropcanalsobeobservedincomparisonwith2006butthisislessmarkedthanforthenu-mberofestablishments(–1 496rooms/–1.0%).Forthisperiod,allthetouristregionssawadecreaseinsupplyforthenumberofestablishments.Ticinoregisteredthegreatestdeclinewith127 fewerestablishments(–23.4%).
–6% –4% –2% 0% 2% 4% 6%
Switzerland
Graubünden
Eastern Switzerland
Zurich Region
Lucerne/Lake Lucerne
Basel Region
Bern Region
Bernese Oberland
Jura & Three-Lakes
Lake Geneva Region (Vaud)
Geneva
Valais
Ticino
Fribourg Region
Aargau Region
Establishments surveyedRooms surveyed
Supply by tourist region in hotels and health establishments, change 2014–2015 G 2.1.2a
© FSO 2016Source: FSO – Tourist accommodation statistics
0
20
40
60
80
100
120
140
Beds
ava
ilabl
e
Switz
erla
nd
Gra
ubün
den
East
ern
Switz
erla
nd
Zuric
h R
egio
n
Luce
rne/
Lake
Luce
rne
Base
l Reg
ion
Bern
Reg
ion
Bern
ese
Obe
rland
Jura
&Th
ree-
Lake
s
Lake
Gen
eva
Reg
ion
(Vau
d)
Gen
eva
Vala
is
Tici
no
Frib
ourg
Reg
ion
Aarg
au R
egio
n
Average number of available beds per establishment in hotels and health establishments,per tourist region in 2015 G 2.1.1b
© FSO 2016Source: FSO – Tourist accommodation statistics

112016 FSO SWISS TOURISM STATISTICS 2015
TOurISTACCOMMODATIONSTATISTICS
Ofthe8regionsregisteringadecreaseinthenumberofrooms,Ticinoalsoregisteredthegreatestdecline(–1 932 units/–17.0%).Meanwhile the Zurich region showed the greatest increase(+3 117rooms/+21.6%).
2.2 Demand in tourist accommodation
Tobetterappreciatetheresultsofthedemandintouristaccom-modationinSwitzerland,theseshouldbecorrelatedwithstrikingeconomic events which have occurred over the past ten years.
Thisdecadehasbeenmarkedbyeconomicgrowthat inter-national level with the exception of 2009 (the decrease during which can be attributed to the world economic crisis). At na-tionallevel,theyear2011wascharacterisedbyastrongriseintheSwiss franc's valueagainst theeuroandother currencies. On 6th September 2011, the introduction of theminimum ex-changeratebytheSwissNationalBank(SNB)stabilisedexchangerates which nonetheless remained far lower than in previous years. On15thJanuary2015,theSNBannouncedtheendofthemini-mum exchange rate, resulting in renewed strength of the Swiss franccomparedwiththeeuro.
2.2.1 General trend in demand
Overthepasttenyears,theevolutioninthetotalnumberofover-nightstaysinhotelsandhealthestablishmentshasbeendiverse(G2.2.1).Asof2006,twoconsecutiveyearsofgrowthwereob-served and a total of 37.3 million overnight stays reached in 2008, whichwasthebestresultsince1990.However,thisgrowthcameto a halt the following year. In 2009 a strong decline in demand wasobserved(–4.7%comparedwiththepreviousyear).Despiteaslightrecoveryin2010(+1.7%),thenumberofovernightstays
fell again in 2011 and in 2012 (–2.0% for each year). The trend was reversed for the years 2013 (+2.5%) and 2014 (+0.9%) which showed a recovery of overnight stays. In 2015, the hotel industry recorded 35.6 million overnight stays, i.e. a decrease of 0.8% (–305 000overnightstays)comparedwith2014.
As for supplementary accommodation, the trend for campsite occupancy experienced a decline in 2015. With a total of 2.7 mil-lion overnight stays, demand showed a drop of 0.6% compared with 2014. This result was the sixth consecutive decline since 2010, i.e. a drop of 27.3% over this period (2010–2015). As far asyouthhostelswereconcerned,thetotalnumberofovernightstays registered in2015was814 000units, i.e.adecreaseof14.4% compared with 2014. It should be noted that in 2015,Genevahadoneestablishmentless,influencingthestructureofsupply and demand in youth hostels.
–30% –20% –10% 0% 10% 20% 30%
Establishments surveyedRooms surveyed
Supply by tourist region in hotels and health establishments, change 2006–2015 G 2.1.2b
© FSO 2016Source: FSO – Tourist accommodation statistics
Switzerland
Graubünden
Eastern Switzerland
Zurich Region
Lucerne/Lake Lucerne
Basel Region
Bern Region
Bernese Oberland
Jura & Three-Lakes
Lake Geneva Region (Vaud)
Geneva
Valais
Ticino
Fribourg Region
Aargau Region

12 SWISS TOURISM STATISTICS 2015 FSO 2016
TOurISTACCOMMODATIONSTATISTICS
2.2.2 Monthly change in demand
In the first six months of 2015, the total overnight stays was 17.0 mil-lion,whichcorrespondstoaslightdecrease(–58 000 units/–0.3%)comparedwiththesameperiodin2014(G2.2.2).The2ndhalf-yearrecordedagreaterdeclineof247 000 overnightstays(–1.3%).
With regard to supplementary accommodation, campsites showedadeclineof7.1%(–56 000overnightstays)duringthefirst half of 2015, compared with the same period of the pre-viousyear.However,thesecondhalf-yearsawthenumberofovernightstaysincrease(+40 000overnightstays/+2.1%),no-tablythankstothemonthofJulywhichregisteredthegreatest
increaseinthenumberofovernightstays(+84 000/+10.5%).Furthermore, the months of July and August together account for almost 60% of the annual demand.
Youth hostels recorded a decrease in overnight stays of 9.4% (–40 000units)forthefirstsixmonthsof2015comparedwiththesameperiodin2014.Adecreasewasalsoobservedduringthesecondhalfoftheyear(–18.6%/–97 000overnightstays).
–35%
–30%
–25%
–20%
–15%
–10%
–5%
0%
5%
10%
15%
20%
25%
Janu
ary
Febr
uary
Mar
ch
April
May
June
July
Augu
st
Sept
embe
r
Oct
ober
Nov
embe
r
Dec
embe
r
1st h
alf-y
ear
2nd
half-
year
Hotels and healthestablishments
Youth hostelsCampsites
Monthly variation in overnight stays by type of accommodation, 2014–2015 G 2.2.2
© FSO 2016Source: FSO – Tourist accommodation statistics
0
5
10
15
20
25
30
35
40
in m
illio
ns
2006 2007 2008 2009 2010 2011 2012 2013 2014 2015
Overnight stays in hotels and health establishments, 2006–2015 G 2.2.1
© FSO 2016Source: FSO – Tourist accommodation statistics

132016 FSO SWISS TOURISM STATISTICS 2015
TOurISTACCOMMODATIONSTATISTICS
2.2.3 Change in domestic and foreign demand
In 2015 in the hotel sector, foreign demand recorded 19.6 mil-lionovernightstays,i.e.adecreaseof1.7%(–331 000overnightstays)comparedwith2014.Domesticvisitorsgenerated16.1 mil-lion overnight stays, which represents a slight increase of 0.2% (+26 000overnightstays).
Lookingbackonthepast10years,foreignanddomesticde-mandregisteredcontinuedgrowthfrom2006to2008(G2.2.3a).In2009, thenumberof foreignandSwissovernightstaysfellconsiderably,whereasaslightrisewasseenin2010.From2011,however, differences were observed between both types ofdemand.Ontheonehand,domesticdemandwasquitestablebeforeincreasingonceagainfrom2013onwards(+1.3%com-paredwiththepreviousyear).Thenumberofdomesticovernightstays continued to increase in 2015 (+0.2%), the year with the
bestresultsince1991.Foreigndemandfellconsiderablyin2011(–3.5%)and2012(–3.3%)beforerecoveringin2013(+3.5%)andin2014(+0.9%).Forthesevisitors,thenumberofovernightstaysstarted to fall again in 2015 (–1.7%).
Over a ten year period, the trend in Swiss demand has proven morestablethanthatofforeignvisitors.
0
5
10
15
20
25
30
35
40
2006 2007 2008 2009 2010 2011 2012 2013 2014 2015
ForeignSwissTotal
Change in overnight stays by foreign and Swiss visitors in hotels and health establishments, 2006–2015 G 2.2.3a
© FSO 2016Source: FSO – Tourist accommodation statistics
in m
illio
ns
Share of overnight stays in hotels and healthestablishments in 2015 by visitors' residence G 2.2.3b
© FSO 2016Source: FSO – Tourist accommodation statistics
SwitzerlandEurope(withoutSwitzerland)
AfricaAmericaAsiaOceania
45,1%
33,1%
0,8%6,8%
13,3%
0,9%
In 2015, Swiss demand registered its bestresult since 1991.know?youDid
More than 78% of demand is accounted for bySwissandeuropeanvisitors.know?youDid
14 SWISS TOURISM STATISTICS 2015 FSO 2016
TOurISTACCOMMODATIONSTATISTICS
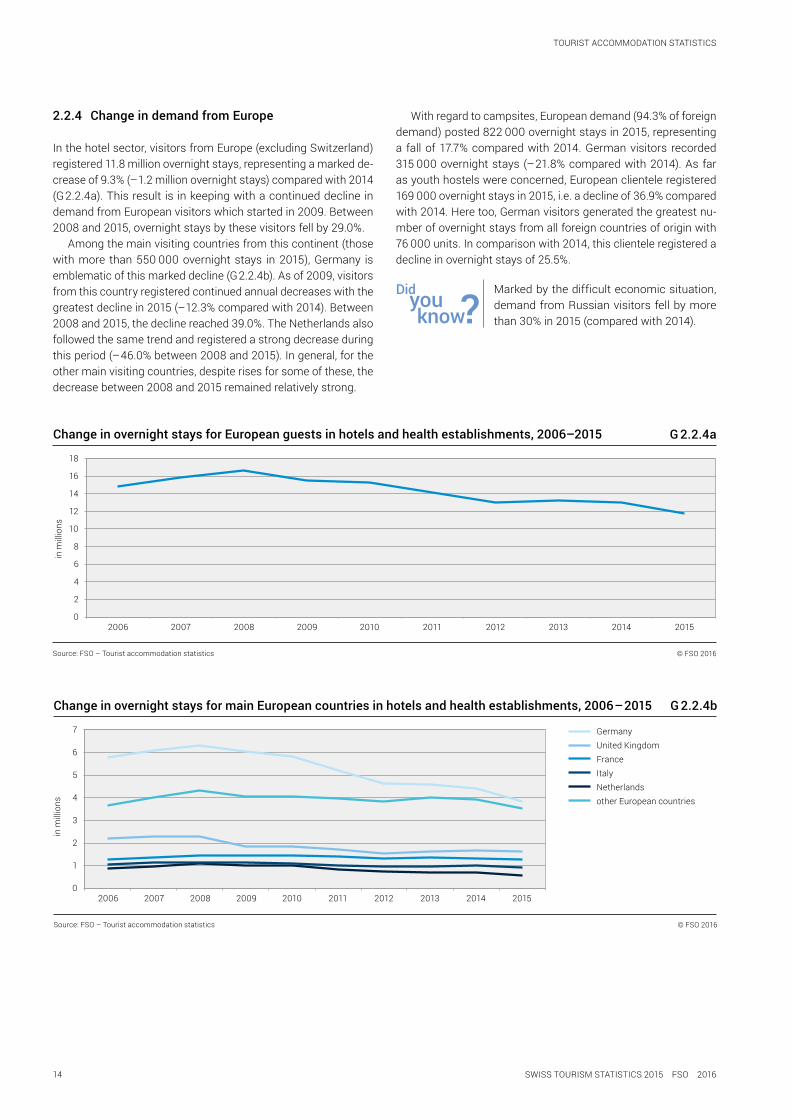
2.2.4 Change in demand from Europe
Inthehotelsector,visitorsfromeurope(excludingSwitzerland)registered 11.8 million overnight stays, representing a marked de-crease of 9.3% (–1.2 million overnight stays) compared with 2014 (G2.2.4a).Thisresult is inkeepingwithacontinueddeclineindemandfromeuropeanvisitorswhichstartedin2009.Between2008and2015,overnightstaysbythesevisitorsfellby29.0%.
Among the main visiting countries from this continent (those withmore than550 000overnight stays in2015),Germany isemblematicofthismarkeddecline(G2.2.4b).Asof2009,visitorsfrom this country registered continued annual decreases with the greatestdeclinein2015(–12.3%comparedwith2014).Between2008 and 2015, the decline reached 39.0%. The Netherlands also followed the same trend and registered a strong decrease during thisperiod(–46.0%between2008and2015).Ingeneral,fortheother main visiting countries, despite rises for some of these, the decreasebetween2008and2015remainedrelativelystrong.
Withregardtocampsites,europeandemand(94.3%offoreigndemand)posted822 000overnightstaysin2015,representinga fallof17.7%comparedwith2014.Germanvisitors recorded315 000overnightstays (–21.8%comparedwith2014).As farasyouthhostelswereconcerned,europeanclienteleregistered169 000overnightstaysin2015,i.e.adeclineof36.9%comparedwith2014.Heretoo,Germanvisitorsgeneratedthegreatestnu-mberofovernightstaysfromallforeigncountriesoforiginwith76 000units.Incomparisonwith2014,thisclienteleregisteredadecline in overnight stays of 25.5%.
0
1
2
3
4
5
6
7
2006 2007 2008 2009 2010 2011 2012 2013 2014 2015
GermanyUnited KingdomFranceItalyNetherlandsother European countries
Change in overnight stays for main European countries in hotels and health establishments, 2006–2015 G 2.2.4b
© FSO 2016Source: FSO – Tourist accommodation statistics
in m
illio
ns
0
2
4
6
8
10
12
14
16
18
in m
illio
ns
2006 2007 2008 2009 2010 2011 2012 2013 2014 2015
Change in overnight stays for European guests in hotels and health establishments, 2006–2015 G 2.2.4a
© FSO 2016Source: FSO – Tourist accommodation statistics
Markedbythedifficulteconomicsituation,demandfromrussianvisitors fellbymorethan 30% in 2015 (compared with 2014).know?youDid

152016 FSO SWISS TOURISM STATISTICS 2015
TOurISTACCOMMODATIONSTATISTICS
stays,hasslowlybutsteadilyseenitsnumberofovernightstaysfall. In 2015, Japanese demand registered 395 000 overnightstays (–10.3% compared with 2014).
As far as campsites were concerned, Asian clientele registered 16 000overnightstaysin2015,i.e.anincreaseof31.5%com-pared with 2014. As far as youth hostels were concerned, total Asiandemandwas72 000overnightstaysin2015,representinga drop of 13.9% compared with the previous year.
2.2.5 Change in demand from Asia
In 2015 the demand from Asian visitors in the hotel sector reg-istered 4.7 million overnight stays, exceeding the record value of4.0millionovernightstaysfor thefirst time(G2.2.5a).Thisresult represents a rise of 18.6% compared with 2014. From 2006 onwards, demand from these visitors has grown and this has beenparticularlymarkedsince2009.Asof2010,annualgrowthhasbeenbetween9.9%and18.6%.
Among the leading countries of origin from the Asian conti-nent(thosewithmorethan350 000overnightstaysin2015),twocountries stand out for their very strong growth over the past tenyears(G2.2.5b).Firstly,overnightstaysbyChineseclientèle(excludingHongKong)increasedfrom205 000overnightstaysin 2006 to 1.4 million in 2015, i.e. a more than sevenfold increase. TheGulfcountrieshavealsoobservedaverymarkedincreasewith more than threefold growth in overnight stays over this pe-riod.Incontrast,Japan,whichwasstillthegreatestcontributortodemandfromtheAsiancontinentin2006with595 000overnight
0
0,5
1
1,5
2
2,5
3
3,5
4
4,5
5
in m
illio
ns
2006 2007 2008 2009 2010 2011 2012 2013 2014 2015
Change in overnight stays for Asian guests in hotels and health establishments, 2006–2015 G 2.2.5a
© FSO 2016Source: FSO – Tourist accommodation statistics
0
200
400
600
800
1 000
1 200
1 400
2006 2007 2008 2009 2010 2011 2012 2013 2014 2015
China (without Hong Kong)Gulf statesJapanIndiaRepublic of Koreaother Asia
Change in overnight stays for main Asian countries in hotels and health establishments, 2006–2015 G 2.2.5b
© FSO 2016Source: FSO – Tourist accommodation statistics
In 10 years (2006-2015), demand from Asia hasmorethandoubled.know?youDid

16 SWISS TOURISM STATISTICS 2015 FSO 2016
TOurISTACCOMMODATIONSTATISTICS
2.2.6 Change in demand from America, Africa and Oceania
In the hotel sector, demand from visitors from the American continent registered a total 2.4 million overnight stays in 2015, i.e.anincreaseof4.7%comparedwith2014(G2.2.6a).Between2006 and 2015,overnightstaysbyvisitorsfromthiscontinentregularly increased (except for 2008 and 2009). In 2015, the total overnight stays was 10.5% higher than in 2006. Visitors from the unitedStates,whoconstitutedthegreaterpartofthedemandfrom this continent with more than 70% of overnight stays, ge-nerated1.7 millionovernightstaysin2015,i.e.growthof5.7%comparedwith 2014 (G2.2.6b). Visitors fromOceania posted325 000overnightstays(+3.4%)andthosefromAfrica302 000units (+7.5%) in 2015.
In the campsites, clientele from the American continent ge-nerated10 000overnightstaysin2015,i.e.aslightincreaseof5.5% compared with 2014. Visitors from Oceania registered a totalof22 000overnightstays(–10.3%).VisitorsfromtheAfricancontinent registered 740 overnight stays (–0.4%). With regard to youth hostels, visitors from the American continent registered 25 000 overnightstays(–32.3%).VisitorsfromOceaniaposted6 700overnightstays(–13.3%)andthosefromAfrica3 700units(–42.4%).
0
500
1 000
1 500
2 000
2 500
3 000
in th
ousa
nds
2006 2007 2008 2009 2010 2011 2012 2013 2014 2015
AmericaAfricaOceania
Change in overnight stays for guests from America, Africa and Oceania in hotels and healthestablishments, 2006–2015 G 2.2.6a
© FSO 2016Source: FSO – Tourist accommodation statistics
0100200300400500600700800900
1 0001 1001 2001 3001 4001 5001 6001 7001 8001 900
in th
ousa
nds
2006 2007 2008 2009 2010 2011 2012 2013 2014 2015
United States of AmericaCanadaBrazilother countries of America
Change in overnight stays for main American countries in hotels and health establishments, 2006–2015 G 2.2.6b
© FSO 2016Source: FSO – Tourist accommodation statistics
In2015,theunitedStatesregistereditsbestresult in the hotel sector since 2000.know?youDid

172016 FSO SWISS TOURISM STATISTICS 2015
TOurISTACCOMMODATIONSTATISTICS
2.2.7 Change in demand by tourist region
Seven of the fourteen tourist regions in Switzerland saw their numberofovernightstaysinthehotelsectordecreasein2015comparedwiththepreviousyear(G2.2.7).Themountainregionsweremost affected. In fact, the largest absolute declinewasobservedinGraubündenwheredemandrecordedadeclineof335 000overnightstays,(–6.6%).ThecantonofValaisalsoregis-teredadeclineinovernightstays(–149 000/–3.8%).Incontrast,aswas thecase for theZurichregion (+208 000/+3.9%), thetrendinurbanareasshowedpositiveresultswithanincreaseinovernight stays.
At national level, although the number of overnight staysfor domestic visitors remained relatively stable in 2015 com-pared with the previous year, demand from foreign visitors fell. Only three tourist regions followed this trend: Valais, the Lake Genevaregion and theAargauregion.Other tourist regionsregistered varying results.
0
1
2
3
4
5
6
in m
illio
ns
2011
2012
2013
2014
2015
2011
2012
2013
2014
2015
2011
2012
2013
2014
2015
2011
2012
2013
2014
2015
2011
2012
2013
2014
2015
2011
2012
2013
2014
2015
2011
2012
2013
2014
2015
SwissForeigners
Overnight stays in hotels and health establishments by tourist region, 2011–2015 (1/2) G 2.2.7
© FSO 2016Source: FSO – Tourist accommodation statistics
ZurichRegion
Graubünden BerneseOberland
Valais Lucerne/LakeLucerne
Geneva Lake Geneva Region (Vaud)
0
1
2
3
4
5
6
2011
2012
2013
2014
2015
2011
2012
2013
2014
2015
2011
2012
2013
2014
2015
2011
2012
2013
2014
2015
2011
2012
2013
2014
2015
2011
2012
2013
2014
2015
2011
2012
2013
2014
2015
Overnight stays in hotels and health establishments by tourist region, 2011–2015 (2/2) G 2.2.7
© FSO 2016Source: FSO – Tourist accommodation statistics
Ticino EasternSwitzerland
Bern RegionBasel Region Jura &Three-Lakes
Fribourg Region Aargau Region
0
1
2
3
4
5
6
in m
illio
ns
2011
2012
2013
2014
2015
2011
2012
2013
2014
2015
2011
2012
2013
2014
2015
2011
2012
2013
2014
2015
2011
2012
2013
2014
2015
2011
2012
2013
2014
2015
2011
2012
2013
2014
2015
SwissForeigners
In the camping sector, Ticino was the tourist region which generatedthegreatestnumberofovernightstaysin2015,with618 000overnightstaysrecorded.However,thisresultcorres-ponds to a fall of 11.2% compared with 2014. For youth hostels, Graubündenrecordedthegreatestnumberofovernightstaysin2015,i.e.138 000units.Thisresultcorrespondstoadeclineof7.6% compared with 2014.
In 2015, the Aargau Region joined the exist-ing thirteen tourist regions.know?youDid

18 SWISS TOURISM STATISTICS 2015 FSO 2016
TOurISTACCOMMODATIONSTATISTICS
2.3 Duration of stay
In2015,visitorsstayedanaverageof2.04 nightsinhotelsandhealthestablishmentsinSwitzerland.Thisdurationwas,howe-ver,longerforforeignvisitors(2.10 nights)thanforSwissvisitors(1.98 nights).
Over the past ten years, the length of stay at nationwide level hasgraduallydecreased,especiallyasof2009(G2.3a).In2006itwas2.35 nightswithadurationof2.50 nightsforforeignvisitorsand2.19 nightsforSwissvisitors.
Amongthetouristregions,Graubündenrecordedthelongeststayin2015with2.84 nights(G2.3b).Incontrast,theshortestlengthofstaywasobservedintheregionofFribourg(1.60 nights).At national level, too, the length of stay was longer for the foreign clientele than for domestic visitors in the majority of tourist re-gions.ThegreatestdifferencewasobservedinGraubündenwhereforeign visitors stayed for an average of 3.41 nightswhereasSwissvisitorsstayedfor2.55 nights.
In the supplementary accommodation sector, the average duration of stays on campsites in Switzerland amounted to 3.04 nightsin2015.ForSwissvisitorsitwas3.26 nights,whereasforeignvisitorsregisteredanaveragestayof2.67 nights.Ticinore-gisteredthelongestaveragelengthofstaywith3.83 nights.Asfortheaveragelengthofstayinyouthhostels,thiswas1.96 nightsin2015.Thisdurationis1.97 nightsforSwissguestsand1.93 nightsforforeignvisitors.Amongthetouristregions,Graubündenre-cordedthelongeststaywith2.51 nights.
1,80
1,90
2,00
2,10
2,20
2,30
2,40
2,50
2,60
Nig
hts
2006 2007 2008 2009 2010 2011 2012 2013 2014 2015
SwissForeignersTotal
Change in duration of stay in hotels and health establishments, 2006–2015 G 2.3a
© FSO 2016Source: FSO – Tourist accommodation statistics
SwissForeignersTotal
Duration of stay in hotels and health establishments in 2015 G 2.3b
© FSO 2016Source: FSO – Tourist accommodation statistics
0,00
0,50
1,00
1,50
2,00
2,50
3,00
3,50
4,00
Nig
hts
Switz
erla
nd
Gra
ubün
den
East
ern
Switz
erla
nd
Zuric
h R
egio
n
Luce
rne/
Lake
Luc
erne
Base
l Reg
ion
Bern
Reg
ion
Bern
ese
Obe
rland
Jura
&Th
ree-
Lake
s
Lake
Gen
eva
Reg
ion
(Vau
d)
Gen
eva
Vala
is
Tici
no
Frib
ourg
Reg
ion
Aarg
au R
egio
n
192016 FSO SWISS TOURISM STATISTICS 2015
TOurISTACCOMMODATIONSTATISTICS
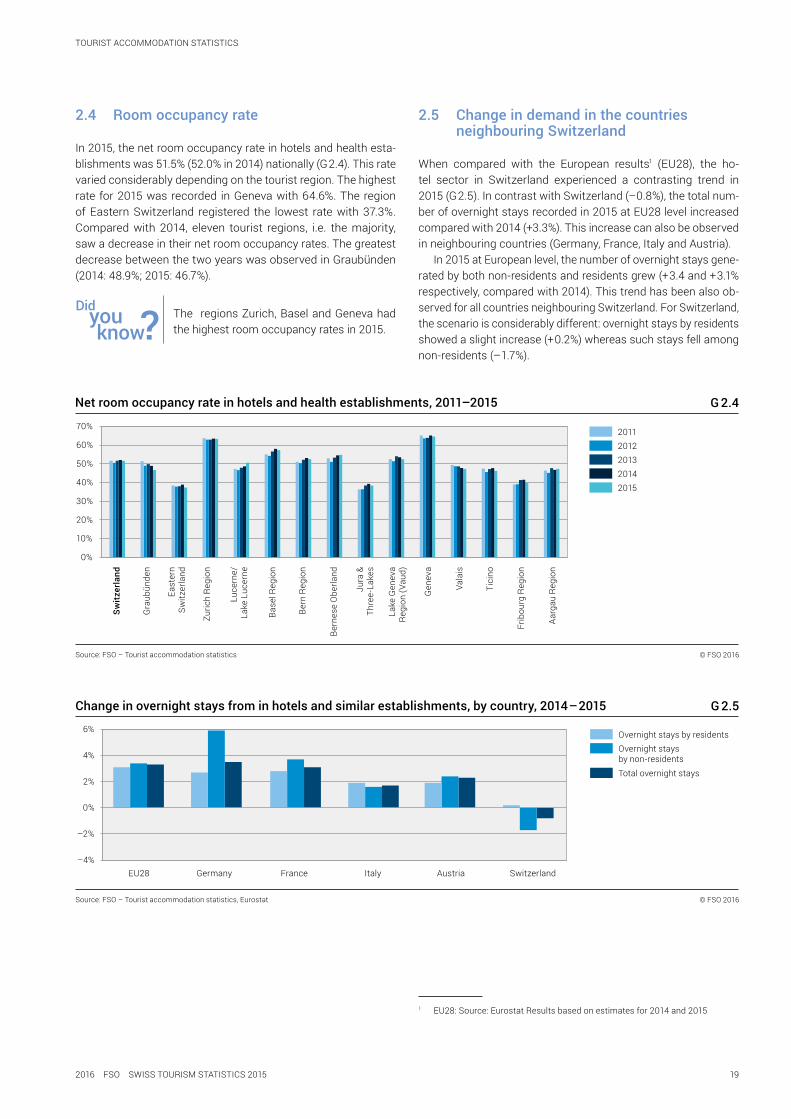
2.4 Room occupancy rate
In 2015, the net room occupancy rate in hotels and health esta-blishmentswas51.5%(52.0%in2014)nationally(G2.4).Thisratevariedconsiderablydependingonthetouristregion.Thehighestrate for2015wasrecorded inGenevawith64.6%.Theregionof easternSwitzerland registered the lowest ratewith 37.3%.Compared with 2014, eleven tourist regions, i.e. the majority, saw a decrease in their net room occupancy rates. The greatest decreasebetweenthetwoyearswasobservedinGraubünden(2014: 48.9%; 2015: 46.7%).
2.5 Change in demand in the countries neighbouring Switzerland
When compared with the european results1 (eu28), the ho-tel sector in Switzerland experienced a contrasting trend in 2015 (G2.5).IncontrastwithSwitzerland(–0.8%),thetotalnum-berofovernightstaysrecordedin2015ateu28levelincreasedcomparedwith2014(+3.3%).Thisincreasecanalsobeobservedinneighbouringcountries(Germany,France,ItalyandAustria).
In2015ateuropeanlevel,thenumberofovernightstaysgene-ratedbybothnon-residentsandresidentsgrew(+3.4 and +3.1%respectively,comparedwith2014).Thistrendhasbeenalsoob-servedforallcountriesneighbouringSwitzerland.ForSwitzerland,thescenarioisconsiderablydifferent:overnightstaysbyresidentsshowed a slight increase (+0.2%) whereas such stays fell among non-residents (–1.7%).
1 eu28:Source:eurostatresultsbasedonestimatesfor2014and2015
–4%
–2%
0%
2%
4%
6%
EU28 Germany France Italy Austria Switzerland
Overnight stays by residentsOvernight staysby non-residentsTotal overnight stays
Change in overnight stays from in hotels and similar establishments, by country, 2014–2015 G 2.5
© FSO 2016Source: FSO – Tourist accommodation statistics, Eurostat
20112012201320142015
Net room occupancy rate in hotels and health establishments, 2011–2015 G 2.4
© FSO 2016Source: FSO – Tourist accommodation statistics
0%
10%
20%
30%
40%
50%
60%
70%
Switz
erla
nd
Gra
ubün
den
East
ern
Switz
erla
nd
Zuric
h R
egio
n
Luce
rne/
Lake
Luc
erne
Base
l Reg
ion
Bern
Reg
ion
Bern
ese
Obe
rland
Jura
&Th
ree-
Lake
s
Lake
Gen
eva
Reg
ion
(Vau
d)
Gen
eva
Vala
is
Tici
no
Frib
ourg
Reg
ion
Aarg
au R
egio
n
The regionsZurich,BaselandGenevahadthe highest room occupancy rates in 2015.know?youDid

20 SWISS TOURISM STATISTICS 2015 FSO 2016
TrAVeLBeHAVIOurOFTHeSWISSreSIDeNTPOPuLATIONIN2014
3 TravelbehaviouroftheSwissresidentpopulation in 2014
In 2014 each person resident in Switzerland undertook on aver-age 2.9 trips with overnight stays and 10.3 day trips1. 63% trips with overnight stays had a destination abroad whereas those without an overnight stay mainly took place in Switzerland (90%).
3.1 Trips with overnight stays
87.5% of the resident population2 undertook at least one trip with one or more overnight stays away from home in 2014. The total numberoftripswas21.2million.
1 Travelofatleastthreehoursthatisnotpartofdailymobility2 Permanent resident population aged 6 and over 7,374,090 persons
While the frequency of these trips is roughly the same for both sexes, contrasting behaviours appear when comparingagegroupsandlinguisticregions(G3.1).Personsagedbetween25 and 44 yearsoldtravelledthemost,with3.2tripsonannualaverage compared with 2.2 for persons aged 65 and more. With 2.2 trips per person, persons living in Italian-speaking Switzerland travelledlessoftenthanthoselivinginGermanorFrench-speakingSwitzerland(both2.9tripsperperson).
in Switzerland 2013abroad 2013
Trips with overnight stays per personResident population aged 6 and over G 3.1
© FSO 2016Source: FSO – Travel behaviour
in Switzerland 2014abroad 2014
Total
Men
Women
6–14 year olds
15–24 year olds
25–44 year olds
45–64 year olds
65 year oldsor more
German-speakingSwitzerland
French-speakingSwitzerland
Italian-speakingSwitzerland
0,0 0,5 1,0 1,5 2,0 2,5 3,0 3,5 4,0

212016 FSO SWISS TOURISM STATISTICS 2015
TrAVeLBeHAVIOurOFTHeSWISSreSIDeNTPOPuLATIONIN2014
3.1.1 Travel destinations
Of the trips with overnight stays registered in 2014, 37% had a Swissdestination(G3.1.1).39%ofthejourneysweretoneigh-bouringcountries,inparticularGermany(12%),Italy(12%)andFrance(9%).18%oftripsweretoothereuropeancountriesand7%outsideofeurope.
3.1.2 Duration of trips
66% of trips abroad included four overnight stays or more(G3.1.2).TheythuslastedlongerthantripsinSwitzerland,whichwere mainly trips with one to three overnight stays (61%).
Trips with overnight stays by destinationResident population aged 6 and over G 3.1.1
© FSO 2016Source: FSO – Travel behaviour
0 2 4 6 8 10
Switzerland
Germany
Austria
Italy
France
South-East Europe1
South-West Europe2
Rest of Europe
Rest of world
2013
2014
1 Greece, Turkey, Croatia, Bosnia and Herzegovina, Serbia, Albania, Slovenia, Montenegro, Kosovo, Rumania, Bulgaria, Macedonia2 Spain, Portugal, Andorra, Gibraltar
in millions
in Switzerland 2013abroad 2013
Trips with overnight stays by trip durationResident population aged 6 and over G 3.1.2
© FSO 2016Source: FSO – Travel behaviour
in Switzerland 2014abroad 2014
in millions
0 2 4 6 8
1 overnight stay
2 overnight stays
3 overnight stays
4–7overnight stays
8–14overnight stays
more than 14overnight stays
89%oftripswithovernightstaysabroadhadaeuropeandestinationin2014.know?youDid

22 SWISS TOURISM STATISTICS 2015 FSO 2016
TrAVeLBeHAVIOurOFTHeSWISSreSIDeNTPOPuLATIONIN2014
3.1.3 Accommodation
Hotelaccommodationisthemostpopularchoicefortripsabroadof short and long duration, accounting for 68% and 48% respec-tivelyofaccommodation(G3.1.3.)Althoughhotelaccommoda-tion also comes first for trips in Switzerland of up to three over-night stays (41%), supplementary accommodation is preferred for longer trips of four overnight stays or more (50%). Staying with friends or family is also popular for short trips in Switzerland (29%), whereas it accounts for only 12% of longer trips.
3.1.4 Main means of transport
Motorised private transport is the means of transport most used fortripsofonetothreeovernightstays,bothforthosetakingplace in Switzerland (67%) and those abroad (56%) (G3.1.4). With regard to trips of four overnight stays or more, motorised
private transport is also preferred for long trips within Switzerland (70%), whereas the plane is most frequently used for long trips abroad(50%).
InSwitzerland,land-basedpublictransportisusedfor31%oftripsofshortdurationand24%oftripsoflongduration.18% ofshort duration trips abroad weremade by land-based publictransport,comparedwith8%ofjourneysoffour nightsormore.
0%
10%
20%
30%
40%
50%
60%
70%
80%
90%
100%
in Switzerland1–3 overnight stays
in Switzerland4 overnight stays or more
abroad1–3 overnight stays
abroad4 overnight stays or more
Hotels and healthestablishments
Supplementaryaccommodation
Visiting friends and relatives
own holiday home, holidayhome free of charge
other
Trips with overnight stays by accommodation type in 2014Resident population aged 6 and over G 3.1.3
© FSO 2016Source: FSO – Travel behaviour
0%
10%
20%
30%
40%
50%
60%
70%
80%
90%
100%
Motorised private transport
Land-based public transport
Aeroplane
other
Trips with overnight stays by main means of transport in 2014Resident population aged 6 and over G 3.1.4
© FSO 2016Source: FSO – Travel behaviour
in Switzerland1–3 overnight stays
in Switzerland4 overnight stays or more
abroad1–3 overnight stays
abroad4 overnight stays or more
Motorised private transport is the mode of transport most frequently used for trips with overnight stays in Switzerland.know?youDid

232016 FSO SWISS TOURISM STATISTICS 2015
TrAVeLBeHAVIOurOFTHeSWISSreSIDeNTPOPuLATIONIN2014
3.1.5 Comparison with the countries neighbouring Switzerland
Comparingthedestinationsoftripstakenbytheresidentpopula-tionaged15yearsandoverfromSwitzerlandanditsneighbouringcountries,noticeabledifferencescouldbeseenin2014(G3.1.5).In Switzerland, 35% of trips made for personal reasons with over-night stays had a destination within the country of residence. Thisfigureisfarhigheramongourneighbourswith88%ofdo-mestictripstakingplaceinFranceand79%inItaly.InGermanyand Austria, this percentage was 63% and 52% respectively.
3.1.6 Long-term change in trips with overnight stays
Having experienced a downward trend, the number of tripswith overnight stays made by the resident population aged15 and overhasstabilisedsince2012(G3.1.6).Nonetheless,incomparisonwiththeearlyyearsofthesurvey,thenumberoftripsin Switzerland with only one to three overnight stays fell from 36% in 1998 to 22% in 2014. On the other hand, trips with four ormoreovernightstaysabroadhavegainedgroundandin2014accounted for the largest share of trips (43%), a share which was only 29% in 1998.
0%
20%
40%
60%
80%
100%
Switzerland Germany France Italy Austria
domestic
abroad
Private trips with overnight stays by country of residence in 2014Resident population aged 15 and over G 3.1.5
© FSO 2016Sources: FSO, Eurostat
0,0
0,5
1,0
1,5
2,0
2,5
3,0
3,5
4,0
1998 2003 2008 2009 2010 2011 2012 2013 2014
abroad –4 overnight stays or more
abroad –1–3 overnight stays
in Switzerland –4 overnight stays or more
in Switzerland –1–3 overnight stays
Trips with overnight stays per person, 1998–2014Resident population aged 15 and over G 3.1.6
© FSO 2016Source: FSO – Travel behaviour

24 SWISS TOURISM STATISTICS 2015 FSO 2016
TrAVeLBeHAVIOurOFTHeSWISSreSIDeNTPOPuLATIONIN2014
3.2 Day trips
In addition to trips with overnight stays, there are also trips with-out overnight stays or day trips. The resident population aged 6 yearsandovermade75.8millionofthesein2014.
The purpose of 47% of day trips in 2014 was leisure and rec-reation(G3.2a).Conversely,businesstripsonlyrepresented4%of day trips.
Thenumberofdaytripscarriedoutbypersonsaged15or overdecreased compared with the first survey from 1998 which regis-tered 73 million day trips. After peaking at 87 million in 2003, the numberofdaytripsfellto68millionin2014.Whenconsideredperperson,thenumberofdaytripsdeclinedfrom14.8in2003to10.3in2014(G3.2b).
Day trips by trip purposeResident population aged 6 and over G 3.2a
© FSO 2016Source: FSO – Travel behaviour
0 5 10 15 20 25 30 35 40
in millions
Leisure, recreation and holidays
Visiting friends and relatives
Business purpose
other
20132014
0
2
4
6
8
10
12
14
16
1998 2003 2008 2009 2010 2011 2012 2013 2014
Day trips per person, 1998–2014Resident population aged 15 and over G 3.2b
© FSO 2016Source: FSO – Travel behaviour
Businesstripsrepresented4%ofdaytripsin2014.know?youDid

252016 FSO SWISS TOURISM STATISTICS 2015
ANNuALINDICATOrSOFTHeTOurISMSATeLLITeACCOuNTS
4 Annual Indicators of the Tourism Satellite Accounts
4.1 Gross value added by tourism
Witha3.5% increase, thegross valueaddedby tourism roseconsiderablyfrom2011to2014.Grossvalueaddedbytourismis composed of the two product categories: tourism-specific and non-tourism specific products. It amounts to 97% of sales of tourism-specific products. The gross value added generated bytourism-relatedproductsisalsopostedinthecategory“tour-ism-specific products”.
The share of gross value added in the total economy’s gross valueaddedthat isgeneratedbytourism-relatedproductsre-mainedpracticallyunchangedbetween2012and2014(around22%). Non-tourism specific products created some 3% of gross valueaddedbytourism.Thepercentageswere2.7%in2011and2012 and 2.6% in 2013 and 2014 respectively. This constancy shouldbehighlighted.
Despiteadeclinein2012(–1.9%),thegrossvalueaddedbytourism from “Accommodation” began togrowagain in 2013(+2.6%) and in 2014 (+0.8%). The difference is even more pro-nouncedforfoodandbeverageservingservicesinhotelsand
restaurants where the decline of 4.0% recorded in 2012 was followedbyincreasesof+2.2%and+1.7%respectivelyin2013and in 2014.
Thegrossvalueaddedbytourismfrompassengertransportincreasedbothin2012(+2.8%)andin2013(+3.2%).Itfellslightlythe next year (–0.3%). With a 3.5% increase from 2011 to 2014, the gross value added by tourism recorded a positive trend. The negative figures surveyed in the past few years for some products have only weakened general growth (+0.2% in 2012, +1.5% in 2013, +1.7% in 2014).
0
500
1 000
1 500
2 000
2 500
3 000
3 500
4 000
4 500
Accommodation Food andbeverage
serving services
Transport services Travel agency, tour operator
and touristguide services
Culture Sport andentertainment
Miscellaneousservices
A.2 Tourism-related products
B. Non tourism-specific products
A.1 Tourism-characteristic products
A.Tourism-specific products
20111 2012 2013 2014
Gross value added by tourism, by product, in CHF million, 2011–2014 G 4.1
© FSO 2016Source: FSO – Indicators of the Tourism Satellite Accounts
1 Values TSA 2011
In2014, thegrossvalueaddedby tourismincreasedby1.8%comparedwith2013.know?youDid

26 SWISS TOURISM STATISTICS 2015 FSO 2016
ANNuALINDICATOrSOFTHeTOurISMSATeLLITeACCOuNTS
4.2 Tourism demand
Tourism demand is the total expenditure on products or ser-vices consumed by tourists. This includes both expenditurebytouristsaswellasthatbythirdpartiesonbehalfoftourists. The indicators of the last four years show that on average, 65% of tourism demand consisted of tourism characteristic products. Accordingly, tourism characteristic products carry a large weight inthetotaltourismdemand(G4.2).Between2012and2014,thedemand for tourism characteristic products remained almost stable (+0.4%). The total tourismdemand, after having fallenslightlyin2012(–0.1%)andin2013(–0.2%),begantogrowagainslightly in 2013 (+1%), giving an average growth of +0.8% from 2011to2014.Theproducts"accommodation","foodandbever-age serving services" and "passenger transport" accounted for over45%oftourismdemand.Between2011and2014,theywereevenresponsibleformorethan70%ofdemandinthecategoryof tourism characteristic products.
After having registered a decrease of 2.2% in 2012, tourism demand for accommodation increased slightly the following year (+2.4%). Following a decline of 0.4% in 2014, growth over the period from 2011 to 2014 corresponded to a decline of 0.4% on average. Themarkeddecreaseindemandforfoodandbeverageservingservices in hotels and restaurants that was registered in 2012 (–3.3%)gavewaytoanincreasein2013(+1.6%),stabilisingthefol-lowingyear(0%).Thiswasfollowedbyadecreaseof1.8%overtheperiod 2011 to 2014. With regard to passenger transport, the trend was positive for 2012 (+3.6%), 2013 (+2.5%) and 2014 (+1.0%). Therefore,growthreached7.2%overtheperiod2011 to 2014.
0
2 000
4 000
6 000
8 000
10 000
12 000
Tourist demand, by product, in CHF million, 2011–2014 G 4.2
Accommodation Food andbeverage
serving services
Transport services Travel agency, tour operator
and touristguide services
Culture Sport andentertainment
Miscellaneousservices
A.2 Tourism-related products
B. Non tourism-specific products
A.1 Tourism-characteristic products
A.Tourism-specific products
20111 2012 2013 2014
© FSO 2016Source: FSO – Indicators of the Tourism Satellite Accounts
1 Values TSA 2011

272016 FSO SWISS TOURISM STATISTICS 2015
ANNuALINDICATOrSOFTHeTOurISMSATeLLITeACCOuNTS
4.3 Tourism employment
The total volume of tourism employment in 2014 corresponded to170,118full-timeequivalentjobs.Thiscorrespondedtoa4.3%share in employment in the Swiss economy as a whole.
There was a very slight increase in tourism employment in 2012 (+0.1%) and a somewhat greater increase in 2013 (+1.3%). It lost paceagainin2014(+0.4%)sothatovertheperiod2011 to 2014,the increase was 1.9%.
Accommodationandfoodandbeverageservingservicesgen-erate a lot of employment and are thus particularly important to employment in tourism.
employment in touristaccommodation fellslightly in2012(–0.6%) before registering a clear increase in 2013 (+3.3%). The followingyearwasonceagaincharacterisedbynegativegrowth (–0.8%). During the period 2011 to 2014, this was followed byanincreaseof1.9%.
employmentfellin2012(–0.8%)butincreasedthefollowingtwoyears(+0.1%and+0.8%).Itthereforeremainedalmoststableover the period 2011 to 2014 (+0.2%). Finally, strong employ-ment growth in passenger transport (2012: +4.4%, 2013: +2.1%, 2014: +0.6%) resulted in a jump in total tourism employment from 2011 to2014(+7.2%).
05 000
10 00015 00020 00025 00030 00035 00040 00045 00050 000
Tourism employment, by product, in full-time equivalents, 2011–2014 G 4.3
Accommodation Food andbeverage
serving services
Transport services Travel agency, tour operator
and touristguide services
Culture Sport andentertainment
Miscellaneousservices
A.2 Tourism-related products
B. Non tourism-specific products
A.1 Tourism-characteristic products
A.Tourism-specific products
20111 2012 2013 2014
© FSO 2016Source: FSO – Indicators of the Tourism Satellite Accounts
1 Values TSA 2011

28 SWISS TOURISM STATISTICS 2015 FSO 2016
eCONOMICINDICATOrS
5 economicindicators
This chapter presents indicators providing an economic con-text to the findings of the tourism statistics. From an economic perspective, the choice of these indicators is restricted to im-portant general topics.
5.1 Gross domestic product in real terms
Overthelast10years,Switzerland'sGDPexpressedinrealterms(constant prices) has evolved in a similar manner to that of the eu28(G5.1).Someyearsnonethelessshowparticularcharacter-istics,suchastheyear2012inwhichSwitzerlandshowedGDPgrowthof1.1%althoughtheeu28registeredadecreaseof0.5%.Lastly,Switzerland'sGDProseby1.8%in2013whilethatoftheeu28registeredaveryslightincrease(+0.2%).Finally,theeu28registeredagreater increase inGDP(+1.9%)thanSwitzerland(+0.8%) in 2015 for the first time in 10 years.
5.2 Consumer confidence index
The consumer confidence index has had contrasting fortunes during the last 10 years (G5.2). Between January 2006 andApril 2008,alltheresultsshowedpositivevalues.Afterthis, itwas not until July 2010 (or April 2010 for the new index ) that positive values were seen again. Nevertheless, from July 2011 (or April 2011 for the new index1) negative values were again
1 From the second quarter 2007, Seco amended its questionnaire to improve theSwissindex'scompatibilitywitheuropeanindices.
registered and this trend continued until the end of 2013. Values stabilisedsomewhatinthefirsthalfof2014andsubsequentlyreturned towards a negative trend. This trend towards negative values was also confirmed in 2015.
5.3 Household final consumption expenditure
IfacomparisonismadeforSwitzerlandbetweenthetotalhouse-hold consumption expenditure and that assigned specifically to the restaurant and hotel sector, the expenditure in this sector has, overall, seen more significant fluctuation of its annual var-iationsbetween2005and2014(G5.3a).Whereasthetrendfortotal household consumption expenditure showed not a single negative result during this period, the restaurant and hotel sector showed six in total.
In 2010 and 2011, household expenditure in Switzerland in the restaurantandhotelsectorregisteredadecline,followedbytwoconsecutiveincreasesin2012and2013(G5.3b).
In 2014, this sector registered another fall. In comparison, inverse trends were observed in the countries neighbouringSwitzerland in 2010 and 2011 (G5.3b). In 2012 and 2013,Switzerlandregisteredpositivegrowth,asdidGermanyandAus-tria, while Italy and France registered negative results. However, in2014,Switzerlandshowedadecreasewhileallitsneighbouringcountries registered an increase.
–6%–5%–4%–3%–2%–1%
0%1%2%3%4%5%
2006 2007 2008 2009 2010 2011 2012 2013 2014 2015
SwitzerlandEuropean Union (EU28)GermanyFranceItalyAustria
Real gross domestic product growth rate, 2006–2015 G 5.1
© FSO 2016Sources: FSO – National accounts, Eurostat

292016 FSO SWISS TOURISM STATISTICS 2015
eCONOMICINDICATOrS
–3%
–2%
–1%
0%
1%
2%
3%
2005 2006 2007 2008 2009 2010 2011 2012 2013 2014
Total consumption expenditureRestaurant and hotelexpenditure
Household consumption expenditure in Switzerland, 2005–2014Variation compared with previous year, at previous year's prices
G 5.3a
© FSO 2016Source: FSO – National accounts
–60
–50
–40
–30
–20
–10
0
10
20
30
Janu
ary
2006
Janu
ary
2007
Janu
ary
2008
Janu
ary
2009
Janu
ary
2010
Janu
ary
2011
Janu
ary
2012
Janu
ary
2013
Janu
ary
2014
Janu
ary
2015
old Indexnew Index
Consumer confidence index, 2006–2015 G 5.2
© FSO 2016Source: Seco
Poin
ts
Hotel and restaurant expenditure in European comparison, 2010–2014Variation compared with previous year, at previous year’s prices G 5.3b
© FSO 2016Source: Eurostat
–6%–5%–4%–3%–2%–1%
0%1%2%3%4%
Switzerland European Union(EU28)
Germany France Italy Austria
20102011201220132014

30 SWISS TOURISM STATISTICS 2015 FSO 2016
eCONOMICINDICATOrS
5.4 Swiss consumer price index
During the last 10 years, prices in the restaurant and hotel sector havehadcontrastingfortunes,fluctuatingbetweenrises(+3.2%in2006)andfalls(–2.5%in2015)(G5.4).Duringthissameperiod,prices in supplementary accommodation registered an increase with the exception of 2015 which showed a decrease (–0.6%). Furthermore, prices in the tourist accommodation sector showed a more marked decline in 2015 (–1.9% compared with 2014) than that of the Swiss Consumer Price Index (–1.1%).
5.5 Harmonised index of consumer prices
Comparedwith the eu28, inflation in the restaurant and ho-tel sector has beenweaker in Switzerland over the past fiveyears (G5.5). It should be noted that inflation in Switzerlandin 2015wasnegative(–0.2%).Aninversetrendwasalsoobservedwhen comparing price increases in this sector in Switzerland with thatoftheneighbouringcountriesin2015.
Tourist accomodationHotelsSupplementary accomodation
Swiss Consumer Price Index, 2006–2015Average annual price increase (%), structure of the standard basket 2015
G 5.4
© FSO 2016Source: FSO – Swiss Consumer Price Index
–3%
–2%
–1%
0%
1%
2%
3%
4%
2006 2007 2008 2009 2010 2011 2012 2013 2014 2015
Total index
–1%
0%
1%
2%
3%
4%
5%
6%
7%
Switzerland European Union(EU28)
Germany France Italy Austria
20112012201320142015
Harmonised index of consumer prices: restaurants and hotels, 2011–2015Variation (in%) compared with previous year G 5.5
© FSO 2016Source: Eurostat
312016 FSO SWISS TOURISM STATISTICS 2015
eCONOMICINDICATOrS
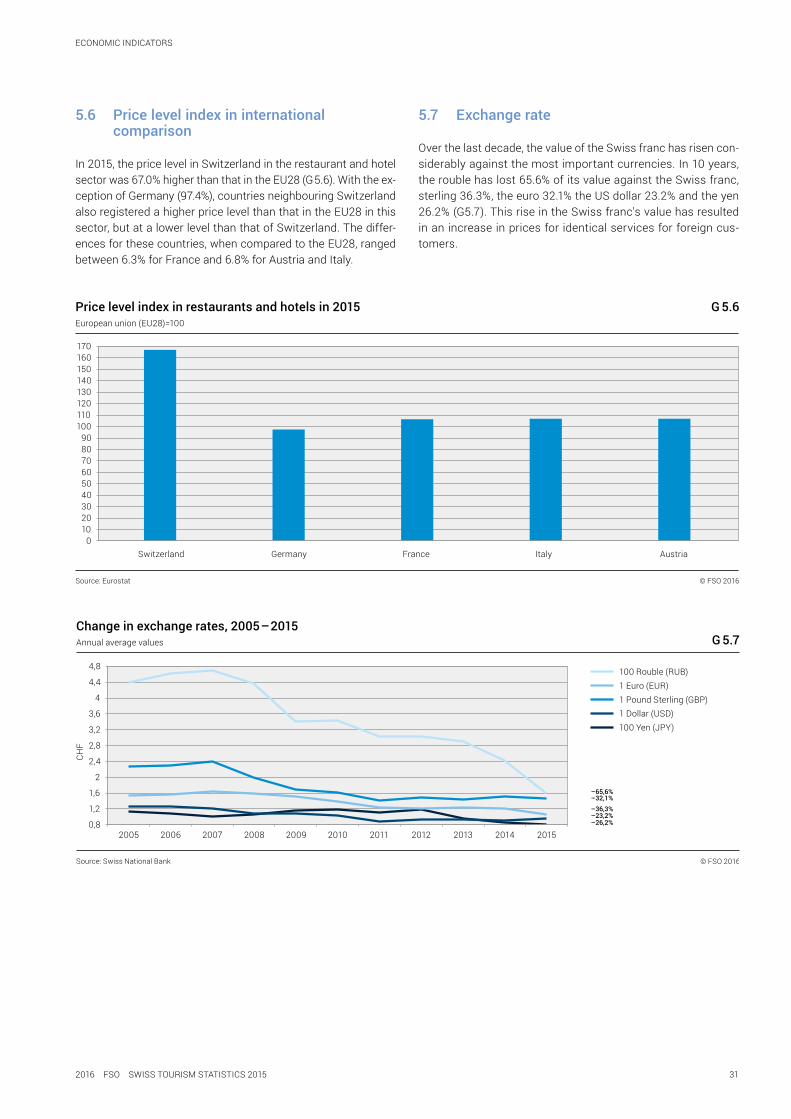
5.6 Price level index in international comparison
In 2015, the price level in Switzerland in the restaurant and hotel sectorwas67.0%higherthanthatintheeu28(G5.6).Withtheex-ceptionofGermany(97.4%),countriesneighbouringSwitzerlandalsoregisteredahigherpricelevelthanthatintheeu28inthissector,butatalowerlevelthanthatofSwitzerland.Thediffer-encesforthesecountries,whencomparedtotheeu28,rangedbetween6.3%forFranceand6.8%forAustriaandItaly.
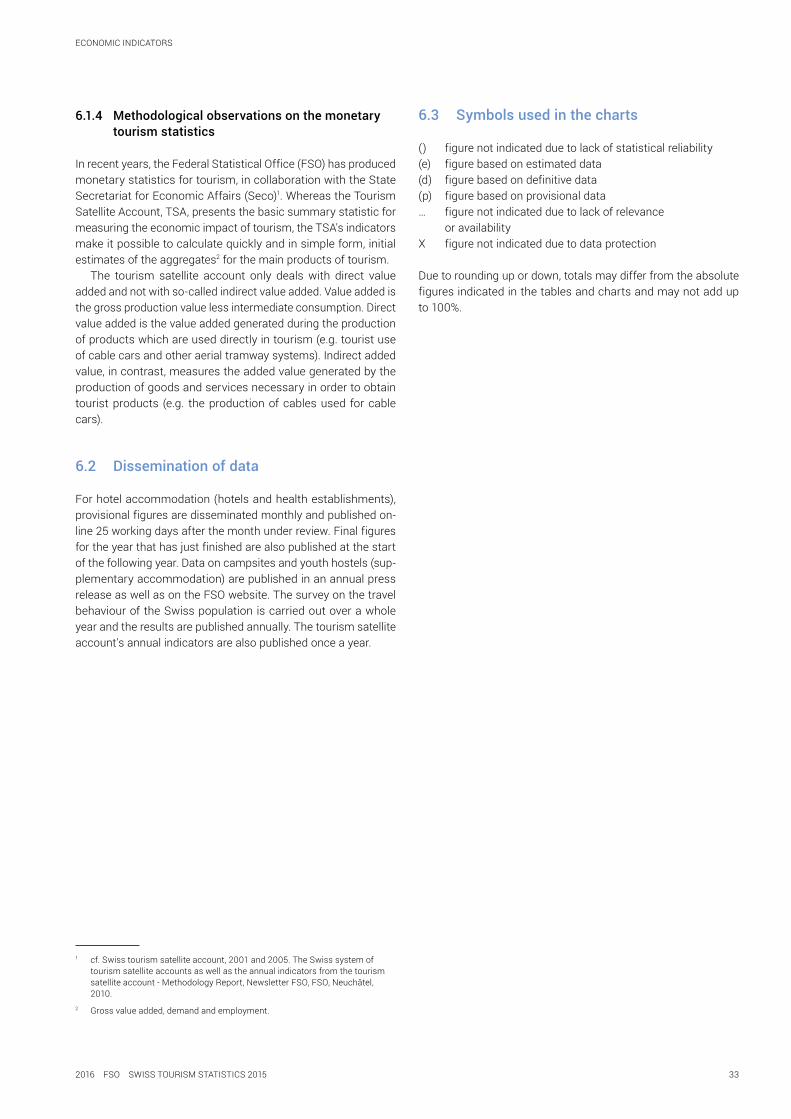
5.7 Exchange rate
Over the last decade, the value of the Swiss franc has risen con-siderablyagainstthemostimportantcurrencies.In10 years,theroublehaslost65.6%ofitsvalueagainsttheSwissfranc,sterling36.3%,theeuro32.1%theuSdollar23.2%andtheyen26.2%(G5.7).ThisriseintheSwissfranc'svaluehasresultedin an increase in prices for identical services for foreign cus-tomers.
0102030405060708090
100110120130140150160170
Switzerland Germany France Italy Austria
Price level index in restaurants and hotels in 2015European union (EU28)=100
G 5.6
© FSO 2016Source: Eurostat
0,8
1,2
1,6
2
2,4
2,8
3,2
3,6
4
4,4
4,8
2005 2006 2007 2008 2009 2010 2011 2012 2013 2014 2015
100 Rouble (RUB)1 Euro (EUR)1 Pound Sterling (GBP)1 Dollar (USD)100 Yen (JPY)
Change in exchange rates, 2005–2015Annual average values G 5.7
© FSO 2016Source: Swiss National Bank
CHF
–65,6%–32,1%
–23,2%–26,2%
–36,3%

32 SWISS TOURISM STATISTICS 2015 FSO 2016
GeNerALOBSerVATIONS
6 Generalobservations
6.1 Surveys
6.1.1 Historical considerations concerning the tourist accommodation statistics
The need for tourist accommodation statistics on foreign visitors isnotnew.Asearlyas1851,surveyscovering thenumberoftourists visiting Switzerland during the high season were planned. However, the task was postponed up to and including 1933 and lefttolocalandprivateorganisations.On1stNovember1934,Switzerland finally set up its national tourism statistics covering allhotelbusinessesthathadatleasttwobedsforguests.Thesestatistics were compiled continuously until 2003. In May 2003, followingbudgetcutsbytheFederalCouncil,theFederalStatisti-cal Office (FSO) announced its decision to discontinue the tourist accommodation statistics at the end of that year. At the same time,theFSOsaidthatitwasopentooffersofcollaborationandfunding. The cantons, regions and tourism associations joined to-gethertoreintroducethesestatisticsonaco-fundedbasis.Thissolution, coordinatedby theSwissTourismFederation (STF),enabledthereintroductiontotakeplaceon1stJanuary2005.However,thepreviousformatofthestatisticshadtoberevisedas it no longer met the needs and expectations of all those con-cerned. The decision was made to invest in a completely new solutionwhichwouldbemoreefficientandaccessible.Theaimof the new survey is to produce improved statistics as far as content is concerned and to simplify and modernise the format andprocess.Theaimistoobtainmonthly,comprehensivedatafromboththedemandsideandthesupplyside.
6.1.2 Methodological observations on campsites
The methodology used for the campsite statistics was revised in 2010.Between2005and2009,thestatisticincludedcampsiteswhose main activity conformed to the description "camping grounds" in the Business and enterprise register (Ber) andwhere the weekly period of work was at least 20 hours. From 2010 the criteria of a minimum working week no longer applies andthestatisticincludesallcampsitesmentionedintheBer.Duetothismodification,theresultspublishedonthebasisofthenewmethodologycannotbecomparedwiththosepublishedforthe years from 2005 to 2009. The results for the years 2008 and 2009have,however,beenrecalculatedtoenableacomparison
over several years. The data collection for the campsite statistic is a comprehensive survey. Weighting is only made for missing responses.
6.1.3 Holiday and travel behaviour of the Swiss resident population
ThesurveyonthetravelbehaviouroftheSwissresidentpop-ulation was first carried out in 1989. In 1998 and 2003, the survey was repeated in a modified format and since 2008 has beenintroducedasacontinuoussurveyinthisformat.In2014,approximately 3400 Swiss residents aged 6 and over were ran-domly selectedand interviewedon the telephoneabout theirpersonaltravelbehaviourinthepreviousmonths.until2011,onlypersons aged 15 years and older were interviewed. The questions areabouttraveldestinations,typeofaccommodation,modesoftransportused,organisationofthetrip,thenumberofovernightstays and expenditure.
A trip isdefinedas travel that isnotpartofdailymobility,during which a person leaves their usual environment for at least three hours (day trip) up to a maximum of 365 days (trip with overnight stays). Changes in location in connection with activities thattakeplaceonaregularandrepetitivebasis(onceorseveraltimes a week) are not included.
The differences mentioned in the text are significant from a statistical point of view. However, given the size of the samples, thosethatcanbeseeninthegraphsarenotnecessarilyallsig-nificant.
332016 FSO SWISS TOURISM STATISTICS 2015
eCONOMICINDICATOrS
6.1.4 Methodological observations on the monetary tourism statistics
In recent years, the Federal Statistical Office (FSO) has produced monetarystatisticsfortourism,incollaborationwiththeStateSecretariatforeconomicAffairs(Seco)1. Whereas the Tourism SatelliteAccount,TSA,presentsthebasicsummarystatisticformeasuringtheeconomicimpactoftourism,theTSA'sindicatorsmakeitpossibletocalculatequicklyandinsimpleform,initialestimates of the aggregates2 for the main products of tourism.
The tourism satellite account only deals with direct value added and not with so-called indirect value added. Value added is the gross production value less intermediate consumption. Direct value added is the value added generated during the production of products which are used directly in tourism (e.g. tourist use ofcablecarsandotheraerialtramwaysystems).Indirectaddedvalue,incontrast,measurestheaddedvaluegeneratedbytheproductionofgoodsandservicesnecessaryinordertoobtaintouristproducts (e.g. theproductionofcablesused forcablecars).
6.2 Dissemination of data
Forhotelaccommodation(hotelsandhealthestablishments),provisionalfiguresaredisseminatedmonthlyandpublishedon-line 25 working days after the month under review. Final figures fortheyearthathasjustfinishedarealsopublishedatthestartof the following year. Data on campsites and youth hostels (sup-plementaryaccommodation)arepublishedinanannualpressreleaseaswellasontheFSOwebsite.ThesurveyonthetravelbehaviouroftheSwisspopulation iscarriedoutoverawholeyearandtheresultsarepublishedannually.Thetourismsatelliteaccount'sannualindicatorsarealsopublishedonceayear.
1 cf. Swiss tourism satellite account, 2001 and 2005. The Swiss system of tourism satellite accounts as well as the annual indicators from the tourism satellite account - Methodology Report, Newsletter FSO, FSO, Neuchâtel, 2010.
2 Grossvalueadded,demandandemployment.
6.3 Symbols used in the charts
() figurenotindicatedduetolackofstatisticalreliability(e) figurebasedonestimateddata(d) figurebasedondefinitivedata(p) figurebasedonprovisionaldata… figure not indicated due to lack of relevance
oravailabilityX figure not indicated due to data protection
Duetoroundingupordown,totalsmaydifferfromtheabsolutefiguresindicatedinthetablesandchartsandmaynotaddupto 100%.

352016 FSO SWISS TOURISM STATISTICS 2015
GLOSSAry
Glossary
Arrivals:numberofguests(includingchildren)whoarriveatahotel or supplementary accommodation with the intention of spending one or more nights there.
Rooms:Rooms available:Numberofroomsinopenestablishments,onaverage for the period under review.Rooms surveyed:Numberofroomsintheestablishmentssur-veyed, on average for the period under review.
Swiss household consumption expenditure: Household con-sumption expenditure is all the expenditure households devote to purchasing consumer goods and services in Switzerland. (Charges, taxes, donations, remittances and other disburse-ments are not included). Final household consumption is there-fore the value of goods and services used to meet human needs directly.
Establishments:Open establishments:Numberofestablishmentsopenatleastone day during the month under review, on average for the period under review.Establishments surveyed:Numberofestablishmentssurveyed(open or temporarily closed) during the month under review, on average for the period under review.
Health establishments:healthestablishmentsarepointsofcareofferingservicessimilartohotels,withoutpublicfunding.exam-ples: medical health resorts, therapeutic clinics, high altitude clinics,clinicsforrheumatism,spaestablishments.
Duration of stay:numberofnightsonaverageinahotelorsup-plementaryaccommodation.Thedurationofstayiscalculatedbydividingthenumberofovernightstaysbythenumberofarrivals.
Major region (7): the Nomenclature of territorial units for statis-tics(NuTS)isaredefinitionofboundariesintendedtofacilitatecomparisons between countries or regions of the sameunit.usedbyeurostat, itthusdividestheeconomicterritoryoftheeuropeanunion(eu)intodifferentregionallevels.Onthisbasis,Switzerland is divided into seven major regions:Lake Geneva region:Vaud,Valais,GenevaEspace Mitteland:Bern,Fribourg,Solothurn,Neuchâtel,JuraNorthwest Switzerland:Basel-Stadt,Basel-Land,Aargau
Zurich:ZurichEastern Switzerland:Glarus,Schaffhausen,Appenzell Ausserrhoden,AppenzellInnerrhoden,St.Gallen,Graubünden,Thurgau.Central Switzerland:Lucerne,uri,Schwyz,Obwalden,Nidwalden,ZugTicino: Ticino
Tourist accommodation: refers to any infrastructure used for commercial purposes and intended to regularly accommodate tourists (hotels, campsites, etc.).
Hotel accommodation: includes the types of accommodation "hotels"and"healthestablishments".
Hotels: establishmentsofferingaccommodationaswellassev-eralotherservicessuchasroomcleaningorareception.exam-ples: hotels, motels, guesthouses, inns offering accommodation, etc.
Price level index in international comparison: The price level indexmakesitpossibletocomparedifferencesinthepricesofgoodsorservicesbetweencountries,whileeliminatingtheim-pact of exchange rates. In other words, it compares price levels in certain countries with the average price level of a group of refer-encecountries(e.g.theeu28).Theyarecalculatedbasedonthequotientformedbypurchasingpowerparityandtheexchangerate(onannualaverage)andmultipliedby100.
The consumer price index (CPI): CPI measures the change in the priceofashoppingbasketofrepresentativegoodsandservicesfor private household consumption. It is used to measure the inflation of goods and services and the variation in Swiss private households'purchasingpower.Inotherwords,itindicateshowmuch consumers have to increase or decrease their expenditure to maintain the same volume of consumption despite variations in price.
Harmonized Index of Consumer Prices (HICP): The HICP is aboveallusedtocomparethepricetrendbetweendifferentcoun-tries. This instrument offers Switzerland an indicator to measure the price trend of consumer goods and services according to the samecriteriaasthoseusedbyeuropeancountriesandcountriesintheeuropeanFreeTradeAssociation(eFTA).
36 SWISS TOURISM STATISTICS 2015 FSO 2016
GLOSSAry
Consumer confidence index: every quarter, a survey is carried outof1200householdsandcommissionedbySeCO.Thiscoverssubjectiveinformationontheevaluationsandexpectationsofprivate households as regards their economic situation, their budget,pricetrends,jobsecurity,etc.
Beds:Beds available:numberofbedsinopenestablishments,onav-erage for the period under review.Beds surveyed:numberofbedsintheestablishmentssurveyed,on average for the period under review.
Overnight stays:numberofnightsspentbyvisitors(includingchildren)inanestablishmentusedforcommercialornon-com-mercial purposes.
Supplementary accommodation: includes all types of accom-modation not included under hotels.
Country of origin: countries in which visitors have their perma-nent residence. The term "domestic visitors" denotes tourists who are resident in Switzerland and the term "foreign visitors" denotes touristswhoareresidentabroad.
Gross domestic product (GDP):GDPmeasuresanationalecon-omy'sperformanceduringoneyear.Itmeasuresthevalueofthegoods and services produced in the relevant country, provided that they are not used to produce other goods and services. In other words, it defines the total value of the production of wealth byeconomicagentsresidingwithintheterritory.GDPiscalcu-latedbasedoncurrentprices,aswellasonconstantpricesforagivenyear.usingconstantprices,realeconomicdevelopmentisrepresented without taking into account the influence of prices.
Tourism characteristic products: products which are essential for fulfilling tourism needs or which, without tourism, would not beproducedoronlyproducedininsignificantquantities.Maincomponents:accommodation,foodandbeverageservingser-vices in hotels and restaurants, passenger transport.
Tourism-related products: products which have an important roleinfulfillingtourismneeds.examples:retailtrade,petrolsta-tions, health, communication.
Tourism-specific products: refer to all tourism characteristic products and tourism-related products.
Tourist Region (14): at the decision of the Swiss Conference of regionalTourismDirectors(rDK/CDr),theSwissterritory,asatourist country, is organised into fourteen main tourist regions:Graubünden:cantonofGraubünden.Eastern Switzerland:cantonsofGlaris,AppenzellAusser-rhoden,Appenzell Appenzell Innerrhoden, Thurgau, Schaffhausen (ex-cludingpartofthedistrictofSchaffhausen),cantonofSt. Gallen(excludingpartoftheelectoraldistrictofSeeGaster).
Zurich Region:cantonsofZurich,Zug;cantonofAargau:districtofBaden;cantonSchwyz:HöfedistrictandpartoftheMarchdistrict; canton of St. Gallen: parts of the electoral district ofSee Gaster; canton of Schaffhausen: part of the district of Schaffhausen.Lucerne/Lake Lucerne:cantonsofLucerne,uri,Obwalden,Nid-walden,cantonSchwyz(excludingthedistrictsofHöfeandpartof the district of March).Basel Region: cantons of Basel-Stadt, Basel-Land, canton ofSolothurn, districts of Dorneck and Thierstein.Bern Region:cantonofBern:administrativedistrictofemmental,Oberaargau,BernMittelland,partsoftheadministrativedistrictof Seeland and Thun.Bernese Oberland: canton of Bern: administrative district ofFrutigen-Niedersimmental, Interlaken-Oberhasli,Obersimmen-tal-Saanen, part of the administrative district of Thun.Jura and Three Lakes Region: cantons of Neuchâtel, Jura; can-tonofBern:administrativedistrictsofBerneseJura,Biel/Bienne,part of Seeland; canton of Solothurn: district of Solothurn, of Bucheggberg,ofLebern,ofThal,andofWasseramt.Lake Geneva Region: Canton Vaud.Geneva:cantonofGeneva.Valais: canton of Valais.Ticino: canton of Ticino.Fribourg Region:cantonofFribourg.Aargau Region:cantonofAargauexcludingthedistrictofBaden;cantonofSolothurn:districtofGösgen,OltenandGäu.
Summer tourist season:MaytoOctober.
Winter tourist season:NovembertoApril.
Occupancy rate:Asapercentageofbedsorroomsoccupiedinhotel or supplementary accommodation.
Gross room occupancy rate:Numberofoccupiedroomsdividedbythetotalgrossroomoccupancyrateoftheperiodunderre-view,asapercentage.(Thegrossroomcapacityisthenumberofavailableroomsofanestablishmentduringthemonthunderreview,multipliedbythenumberofdaysthisestablishmentisopen during this month).
Gross bed occupancy rate:Numberofovernightstaysdividedbythetotalgrossroomcapacityoftheperiodunderreview,asapercentage.(Thegrossbedcapacityisthenumberofavailablebedsinanestablishmentduringthemonthunderreview,multi-pliedbythenumberofthismonth).
Net room occupancy rate:Numberofoccupiedroomsdividedbythetotalnetroomcapacityoftheperiodunderreview,asapercentage.(Thenetroomcapacityisthenumberofavailableroomsofanestablishmentduringthemonthunderreview,mul-tipliedbythenumberofdaysthisestablishmentwasopenduringthat month).

372016 FSO SWISS TOURISM STATISTICS 2015
GLOSSAry
Net bed occupancy rate:Numberofovernightstaysdividedbythetotalnetbedcapacityoftheperiodunderreview,asaper-centage.(Thenetbedcapacityisthenumberofavailablebedsinanestablishmentduringthemonthunderreview,multipliedbythenumberofdaysthisestablishmentwasopenduringthatmonth).
Campsites: accommodation on delimited campsites on which a caravan,mobilehomeortentmaybeleftforalimitedstay.
Exchange rate: The exchange rate expresses the rate at which one currency is exchanged for another.
Motorised private transport: Motorised private transport in-cludescars,motorbikes,mopedsandcampingcars.
Overland public transport:Overlandpublictransportincludestrains,buses,Postbuses,tramsandundergroundtrains.
Gross value added: Increase in the value of goods generated by theproductivesystembeforedeductions fordepreciation. The gross value added is calculated as the gross production value(atbaseprices)minusintermediaryconsumption(atpur-chase prices).
Gross production value: Value of goods and services produced inthecountry,atbaseprices.
Trip: A trip is defined as travel during which a person leaves their usual environment for at least three hours (day trip) up to a maxi-mum of 365 days (trip with overnight stays). A distinction is made betweenshorttripsofonetothreeovernightstaysandlongtripsof four nights or more. Changes in location in connection with activitiesthattakeplaceonaregularandrepetitivebasis(onceor several times a week) are not included.Business trips: All trips for professional reasons, even if the re-spondent only accompanies another person from their household.Trips made for personal reasons: All non-professional trips such as excursions, holidays, visits, accompaniment, pilgrimages or treatments.


Appendix

40 SWISS TOURISM STATISTICS 2015 FSO 2016
APPeNDIx
Supply in 2015 T2.1.1
Tourist region Hotelsandhealthestablishments Youth hostels Campsites
establish-ments open1
Rooms available2
Bedsavailable2
Availablebedsperes-tablishment
Distributionofestab-
lishments (in %)
estab-lishments surveyed3
Distributionofestab-
lishments (in %)
estab-lishments surveyed3
Distributionofestab-
lishments (in %)
Switzerland 4 509 128 979 247 625 54,9 100 51 100 410 100
Graubünden 633 18 508 38 461 60,8 14,0 8 15,7 44 10,7
easternSwitzerland 510 9 713 19 223 37,7 11,3 5 9,8 37 9,0
Zurichregion 367 17 266 29 698 81,0 8,1 7 13,7 23 5,6
Lucerne/LakeLucerne 444 12 310 24 178 54,5 9,8 4 7,8 39 9,5
Baselregion 127 5 574 10 028 79,0 2,8 2 3,9 6 1,5
Bernregion 168 3 889 6 985 41,5 3,7 1 2,0 9 2,2
BerneseOberland 417 11 449 23 309 55,9 9,2 5 9,8 53 12,9
Jura & Three-Lakes 249 3 949 7 487 30,0 5,5 3 5,9 38 9,3
LakeGenevaregion(Vaud) 282 9 612 18 210 64,7 6,2 4 7,8 40 9,8
Geneva 121 9 282 15 249 125,7 2,7 0 0,0 4 1,0
Valais 558 13 779 28 558 51,1 12,4 4 7,8 61 14,9
Ticino 347 8 102 15 993 46,1 7,7 4 7,8 33 8,0
Fribourgregion 119 2 095 4 310 36,2 2,6 1 2,0 13 3,2
Aargau Region 167 3 452 5 935 35,6 3,7 3 5,9 10 2,4
1 Numberofestablishmentsopenatleastonedayduringthemonthunderreview,asannualaverage 2 Numberofrooms/bedsinopenestablishments,asannualaverage 3 Numberofsurveyedestablishments,openortemporarilyclosed,duringthemonthunderreview,asannualaverage
Source: FSO – Tourist accommodation statistics © FSO 2016
412016 FSO SWISS TOURISM STATISTICS 2015
APPeNDIx
Change in supply 2006–2015 and 2014–2015Hotelsandhealthestablishments T 2.1.2
Tourist region 2006 2014 2015 Variation 2006–2015 (in %)
Variation 2014–2015 (in %)
estab-lishments surveyed1
Rooms surveyed2
estab-lishments surveyed1
Rooms surveyed2
estab-lishments surveyed1
Rooms surveyed2
estab-lishments surveyed1
Rooms surveyed2
estab-lishments surveyed1
Rooms surveyed2
Switzerland 5 693 142 514 5 129 140 722 5 055 141 018 –11.2 –1.0 –1.4 0.2
Graubünden 818 23 121 763 22 296 748 22 225 –8.5 –3.9 –1.9 –0.3
easternSwitzerland 644 10 522 568 10 323 554 10 239 –14.0 –2.7 –2.4 –0.8
Zurichregion 385 14 449 376 17 125 382 17 566 –0.9 21.6 1.5 2.6
Lucerne/LakeLucerne 557 13 935 496 13 232 490 13 164 –12.1 –5.5 –1.2 –0.5
Baselregion 133 4 548 135 5 817 129 5 600 –3.2 23.1 –4.1 –3.7
Bernregion 195 3 942 172 3 962 174 3 960 –10.8 0.5 0.8 –0.1
BerneseOberland 541 13 947 481 12 919 476 12 817 –12.1 –8.1 –1.1 –0.8
Jura & Three-Lakes 311 4 470 274 4 219 271 4 234 –12.7 –5.3 –1.0 0.3
LakeGenevaregion(Vaud) 377 10 367 315 9 968 311 10 444 –17.7 0.7 –1.3 4.8
Geneva 138 9 077 126 9 316 127 9 431 –7.9 3.9 0.7 1.2
Valais 716 16 931 677 16 206 675 16 167 –5.7 –4.5 –0.3 –0.2
Ticino 544 11 343 438 9 680 417 9 411 –23.4 –17.0 –4.9 –2.8
Fribourgregion 138 2 131 129 2 196 126 2 199 –8.5 3.2 –2.0 0.2
Aargau Region 196 3 731 181 3 576 177 3 561 –9.8 –4.6 –2.3 –0.4
1 Numberofsurveyedestablishments,openortemporarilyclosed,duringthemonthunderreview,asannualaverage 2 Numberofroomsinthesurveyedestablishments,asannualaverage
Source: FSO – Tourist accommodation statistics © FSO 2016

42 SWISS TOURISM STATISTICS 2015 FSO 2016
APPeNDIx
Demand from 2006 to 2015 T 2.2.1
Year Overnight stays Variation in overnight stays (in %) Distribution(in%)
Swiss Foreigners Total Swiss Foreigners Total Swiss Foreigners
Hotel accommodation1
2006 15 203 977 19 644 449 34 848 426 4,0 7,2 5,8 43,6 56,4
2007 15 447 065 20 917 735 36 364 800 1,6 6,5 4,4 42,5 57,5
2008 15 825 473 21 508 296 37 333 769 2,4 2,8 2,7 42,4 57,6
2009 15 424 468 20 164 425 35 588 893 –2,5 –6,2 –4,7 43,3 56,7
2010 15 765 304 20 442 508 36 207 812 2,2 1,4 1,7 43,5 56,5
2011 15 752 367 19 733 889 35 486 256 –0,1 –3,5 –2,0 44,4 55,6
2012 15 690 035 19 076 238 34 766 273 –0,4 –3,3 –2,0 45,1 54,9
2013 15 889 226 19 734 657 35 623 883 1,3 3,5 2,5 44,6 55,4
2014 16 026 135 19 907 377 35 933 512 0,9 0,9 0,9 44,6 55,4
2015 16 052 181 19 576 295 35 628 476 0,2 –1,7 –0,8 45,1 54,9
Supplementary accommodation2
Campsites
2014 1 626 604 1 045 938 2 672 542 –4,3 –10,2 –6,7 60,9 39,1
2015 1 785 874 871 406 2 657 280 9,8 –16,7 –0,6 67,2 32,8
Youth hostels
2014 547 753 403 284 951 037 –0,1 1,1 0,4 57,6 42,4
2015 536 636 276 999 813 635 –2,1 –31,3 –14,4 66,0 34,0
1 Hotelsandhealthestablishments 2 Youth hostels and campsites only
Source: FSO – Tourist accommodation statistics © FSO 2016

432016 FSO SWISS TOURISM STATISTICS 2015
APPeNDIx
Monthly change in demand from 2014 to 2015 T 2.2.2
Hotelsandhealthestablishments Youth hostels Campsites
Overnight stays 2014
Overnight stays 2015
Variation (in %)
Overnight stays 2014
Overnight stays 2015
Variation (in %)
Overnight stays 2014
Overnight stays 2015
Variation (in %)
January 2 782 625 2 765 550 –0.6% 50 098 47 851 –4.5% 24 402 23 848 –2.3%
February 2 919 251 3 115 410 6.7% 56 217 58 168 3.5% 24 017 26 155 8.9%
March 3 227 446 2 987 195 –7.4% 64 378 55 797 –13.3% 33 893 25 806 –23.9%
April 2 356 682 2 344 338 –0.5% 77 391 68 086 –12.0% 124 406 127 104 2.2%
May 2 619 867 2 616 805 –0.1% 79 847 69 802 –12.6% 188 382 229 019 21.6%
June 3 198 713 3 216 833 0.6% 101 007 88 914 –12.0% 384 957 292 480 –24.0%
July 3 920 638 4 075 726 4.0% 128 676 116 031 –9.8% 802 535 886 903 10.5%
August 4 258 511 4 123 659 –3.2% 121 801 100 557 –17.4% 681 633 676 954 –0.7%
September 3 384 577 3 360 603 –0.7% 98 848 80 849 –18.2% 262 219 227 560 –13.2%
October 2 782 427 2 686 864 –3.4% 85 903 68 459 –20.3% 112 552 105 974 –5.8%
November 1 867 454 1 866 861 0.0% 38 251 25 142 –34.3% 11 862 14 399 21.4%
December 2 615 321 2 468 632 –5.6% 48 620 33 979 –30.1% 21 684 21 078 –2.8%
1st half-year 17 104 584 17 046 131 –0.3% 428 938 388 618 –9.4% 780 057 724 412 –7.1%
2nd half-year 18 828 928 18 582 345 –1.3% 522 099 425 017 –18.6% 1 892 485 1 932 868 2.1%
Total 35 933 512 35 628 476 –0.8% 951 037 813 635 –14.4% 2 672 542 2 657 280 –0.6%
Source: FSO – Tourist accommodation statistics © FSO 2016

44 SWISS TOURISM STATISTICS 2015 FSO 2016
APPeNDIx
Change in overnight stays by main countries of residence by continent from 2006 to 2015Hotelsandhealthestablishments T 2.2.3–6
Overnight stays
2006 2007 2008 2009 2010 2011 2012 2013 2014 2015
Switzerland 15 203 977 15 447 065 15 825 473 15 424 468 15 765 304 15 752 367 15 690 035 15 889 226 16 026 135 16 052 181
Total Foreigners 19 644 449 20 917 735 21 508 296 20 164 425 20 442 508 19 733 889 19 076 238 19 734 657 19 907 377 19 576 295
Europe (without Switzerland) 14 813 529 15 836 517 16 612 340 15 533 089 15 225 824 14 109 851 13 020 632 13 257 669 13 003 781 11 788 182
Germany 5 757 096 6 081 920 6 313 240 6 031 325 5 816 520 5 207 892 4 625 384 4 573 496 4 394 457 3 853 180
unitedKingdom 2 202 324 2 275 895 2 281 701 1 856 220 1 853 557 1 699 747 1 544 236 1 640 091 1 667 437 1 640 457
France 1 269 871 1 367 457 1 439 158 1 433 452 1 449 278 1 394 166 1 318 460 1 350 164 1 337 882 1 254 447
Italy 1 057 218 1 133 626 1 157 902 1 137 588 1 074 447 1 007 519 971 776 980 646 1 014 058 936 913
Netherlands 871 272 948 011 1 080 840 1 026 308 989 543 847 438 726 636 709 937 681 671 583 831
Othereuropeancountries 3 655 748 4 029 608 4 339 499 4 048 196 4 042 479 3 953 089 3 834 140 4 003 335 3 908 276 3 519 354
Asia 2 144 436 2 304 965 2 258 022 2 235 312 2 609 346 2 958 042 3 307 446 3 635 911 3 996 839 4 741 090
China(without Hong Kong) 205 355 230 180 214 349 271 717 404 218 595 264 743 656 894 316 1 034 275 1 378 434
GulfStates 291 428 350 085 403 590 374 737 423 438 418 609 518 842 623 205 770 725 929 799
Japan 594 951 554 861 493 901 474 720 507 138 479 743 509 757 491 651 439 894 394 784
India 284 390 336 966 327 300 324 280 392 852 460 440 474 882 467 967 485 216 591 924
republicofKorea 136 289 160 916 137 376 106 700 135 377 167 866 172 467 187 966 263 189 317 022
Other Asian countries 632 023 671 957 681 506 683 158 746 323 836 120 887 842 970 806 1 003 540 1 129 127
America 2 189 216 2 224 548 2 081 131 1 908 158 2 086 735 2 115 099 2 159 916 2 238 949 2 310 768 2 419 448
unitedStatesof America 1 659 064 1 664 929 1 518 376 1 382 856 1 506 435 1 492 131 1 525 178 1 585 467 1 644 424 1 738 838
Canada 205 120 215 064 213 403 207 353 225 140 228 137 231 642 230 189 230 848 234 218
Brazil 127 780 142 821 159 058 144 977 168 771 194 492 201 298 206 378 222 211 225 239
Other American countries 197 252 201 734 190 294 172 972 186 389 200 339 201 798 216 915 213 285 221 153
Africa 291 080 298 820 301 137 270 546 267 577 280 247 303 534 293 649 281 179 302 201
Oceania 206 188 252 885 255 666 217 320 253 026 270 650 284 710 308 479 314 810 325 374
Total 34 848 426 36 364 800 37 333 769 35 588 893 36 207 812 35 486 256 34 766 273 35 623 883 35 933 512 35 628 476
Source: FSO – Tourist accommodation statistics © FSO 2016
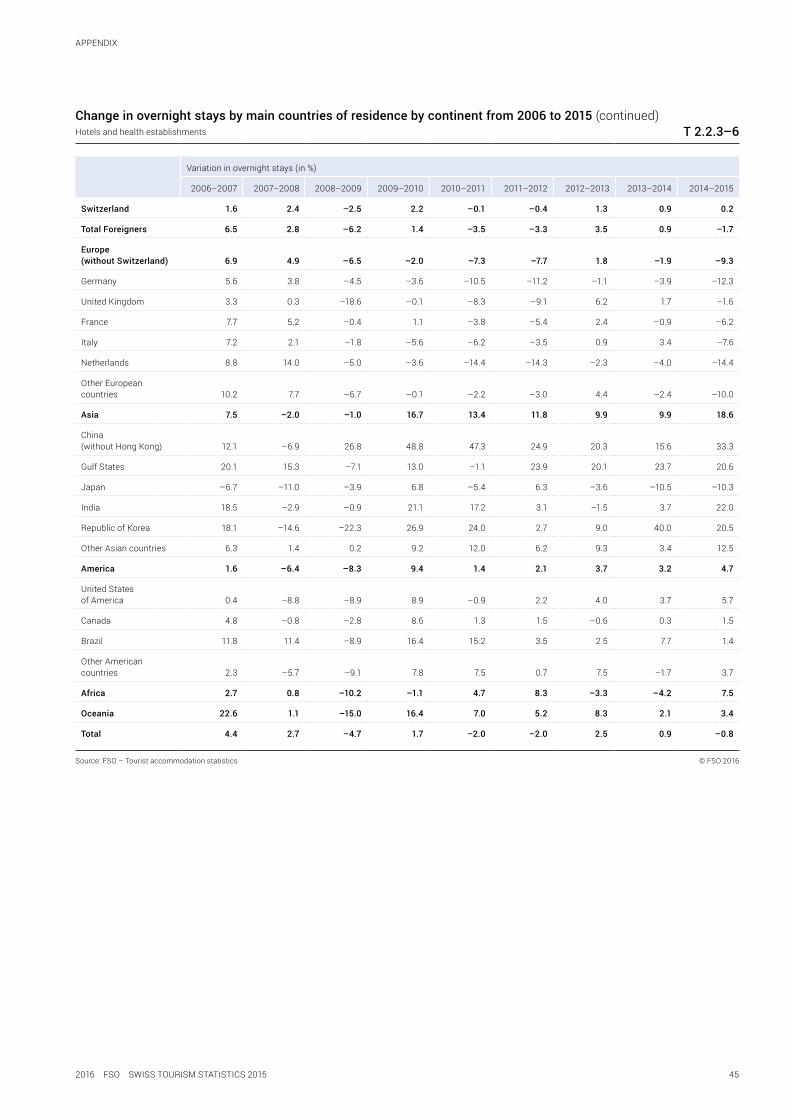
452016 FSO SWISS TOURISM STATISTICS 2015
APPeNDIx
Change in overnight stays by main countries of residence by continent from 2006 to 2015 (continued)Hotelsandhealthestablishments T 2.2.3–6
Variation in overnight stays (in %)
2006–2007 2007–2008 2008–2009 2009–2010 2010–2011 2011–2012 2012–2013 2013–2014 2014–2015
Switzerland 1.6 2.4 –2.5 2.2 –0.1 –0.4 1.3 0.9 0.2
Total Foreigners 6.5 2.8 –6.2 1.4 –3.5 –3.3 3.5 0.9 –1.7
Europe(without Switzerland) 6.9 4.9 –6.5 –2.0 –7.3 –7.7 1.8 –1.9 –9.3
Germany 5.6 3.8 –4.5 –3.6 –10.5 –11.2 –1.1 –3.9 –12.3
unitedKingdom 3.3 0.3 –18.6 –0.1 –8.3 –9.1 6.2 1.7 –1.6
France 7.7 5.2 –0.4 1.1 –3.8 –5.4 2.4 –0.9 –6.2
Italy 7.2 2.1 –1.8 –5.6 –6.2 –3.5 0.9 3.4 –7.6
Netherlands 8.8 14.0 –5.0 –3.6 –14.4 –14.3 –2.3 –4.0 –14.4
Othereuropeancountries 10.2 7.7 –6.7 –0.1 –2.2 –3.0 4.4 –2.4 –10.0
Asia 7.5 –2.0 –1.0 16.7 13.4 11.8 9.9 9.9 18.6
China(without Hong Kong) 12.1 –6.9 26.8 48.8 47.3 24.9 20.3 15.6 33.3
GulfStates 20.1 15.3 –7.1 13.0 –1.1 23.9 20.1 23.7 20.6
Japan –6.7 –11.0 –3.9 6.8 –5.4 6.3 –3.6 –10.5 –10.3
India 18.5 –2.9 –0.9 21.1 17.2 3.1 –1.5 3.7 22.0
republicofKorea 18.1 –14.6 –22.3 26.9 24.0 2.7 9.0 40.0 20.5
Other Asian countries 6.3 1.4 0.2 9.2 12.0 6.2 9.3 3.4 12.5
America 1.6 –6.4 –8.3 9.4 1.4 2.1 3.7 3.2 4.7
unitedStatesof America 0.4 –8.8 –8.9 8.9 –0.9 2.2 4.0 3.7 5.7
Canada 4.8 –0.8 –2.8 8.6 1.3 1.5 –0.6 0.3 1.5
Brazil 11.8 11.4 –8.9 16.4 15.2 3.5 2.5 7.7 1.4
Other American countries 2.3 –5.7 –9.1 7.8 7.5 0.7 7.5 –1.7 3.7
Africa 2.7 0.8 –10.2 –1.1 4.7 8.3 –3.3 –4.2 7.5
Oceania 22.6 1.1 –15.0 16.4 7.0 5.2 8.3 2.1 3.4
Total 4.4 2.7 –4.7 1.7 –2.0 –2.0 2.5 0.9 –0.8
Source: FSO – Tourist accommodation statistics © FSO 2016
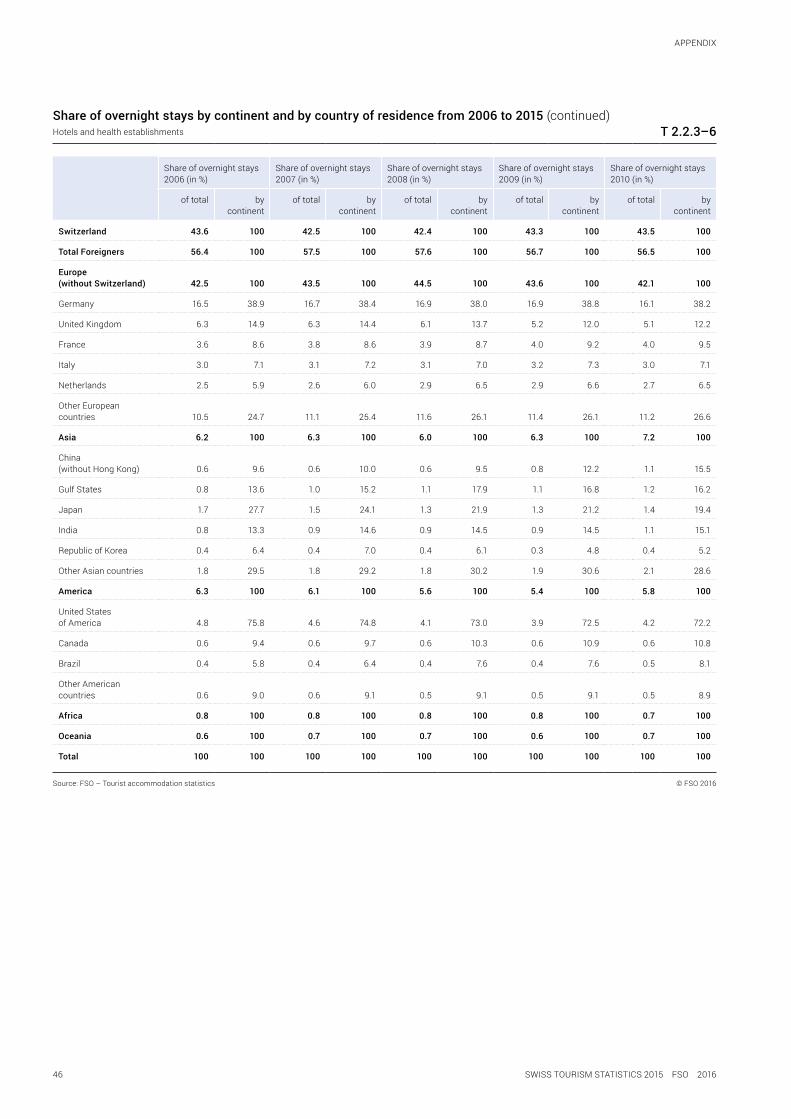
46 SWISS TOURISM STATISTICS 2015 FSO 2016
APPeNDIx
Share of overnight stays by continent and by country of residence from 2006 to 2015 (continued)Hotelsandhealthestablishments T 2.2.3–6
Share of overnight stays 2006 (in %)
Share of overnight stays 2007 (in %)
Share of overnight stays 2008 (in %)
Share of overnight stays 2009 (in %)
Share of overnight stays 2010 (in %)
of total bycontinent
of total bycontinent
of total bycontinent
of total bycontinent
of total bycontinent
Switzerland 43.6 100 42.5 100 42.4 100 43.3 100 43.5 100
Total Foreigners 56.4 100 57.5 100 57.6 100 56.7 100 56.5 100
Europe(without Switzerland) 42.5 100 43.5 100 44.5 100 43.6 100 42.1 100
Germany 16.5 38.9 16.7 38.4 16.9 38.0 16.9 38.8 16.1 38.2
unitedKingdom 6.3 14.9 6.3 14.4 6.1 13.7 5.2 12.0 5.1 12.2
France 3.6 8.6 3.8 8.6 3.9 8.7 4.0 9.2 4.0 9.5
Italy 3.0 7.1 3.1 7.2 3.1 7.0 3.2 7.3 3.0 7.1
Netherlands 2.5 5.9 2.6 6.0 2.9 6.5 2.9 6.6 2.7 6.5
Othereuropeancountries 10.5 24.7 11.1 25.4 11.6 26.1 11.4 26.1 11.2 26.6
Asia 6.2 100 6.3 100 6.0 100 6.3 100 7.2 100
China(without Hong Kong) 0.6 9.6 0.6 10.0 0.6 9.5 0.8 12.2 1.1 15.5
GulfStates 0.8 13.6 1.0 15.2 1.1 17.9 1.1 16.8 1.2 16.2
Japan 1.7 27.7 1.5 24.1 1.3 21.9 1.3 21.2 1.4 19.4
India 0.8 13.3 0.9 14.6 0.9 14.5 0.9 14.5 1.1 15.1
republicofKorea 0.4 6.4 0.4 7.0 0.4 6.1 0.3 4.8 0.4 5.2
Other Asian countries 1.8 29.5 1.8 29.2 1.8 30.2 1.9 30.6 2.1 28.6
America 6.3 100 6.1 100 5.6 100 5.4 100 5.8 100
unitedStatesof America 4.8 75.8 4.6 74.8 4.1 73.0 3.9 72.5 4.2 72.2
Canada 0.6 9.4 0.6 9.7 0.6 10.3 0.6 10.9 0.6 10.8
Brazil 0.4 5.8 0.4 6.4 0.4 7.6 0.4 7.6 0.5 8.1
Other American countries 0.6 9.0 0.6 9.1 0.5 9.1 0.5 9.1 0.5 8.9
Africa 0.8 100 0.8 100 0.8 100 0.8 100 0.7 100
Oceania 0.6 100 0.7 100 0.7 100 0.6 100 0.7 100
Total 100 100 100 100 100 100 100 100 100 100
Source: FSO – Tourist accommodation statistics © FSO 2016

472016 FSO SWISS TOURISM STATISTICS 2015
APPeNDIx
Share of overnight stays by continent and by country of residence from 2006 to 2015 (continued)Hotelsandhealthestablishments T 2.2.3–6
Share of overnight stays 2011 (in %)
Share of overnight stays 2012 (in %)
Share of overnight stays 2013 (in %)
Share of overnight stays 2014 (in %)
Share of overnight stays 2015 (in %)
of total bycontinent
of total bycontinent
of total bycontinent
of total bycontinent
of total bycontinent
Switzerland 44.4 100 45.1 100 44.6 100 44.6 100 45.1 100
Total Foreigners 55.6 100 54.9 100 55.4 100 55.4 100 54.9 100
Europe(without Switzerland) 39.8 100 37.5 100 37.2 100 36.2 100 33.1 100
Germany 14.7 36.9 13.3 35.5 12.8 34.5 12.2 33.8 10.8 32.7
unitedKingdom 4.8 12.0 4.4 11.9 4.6 12.4 4.6 12.8 4.6 13.9
France 3.9 9.9 3.8 10.1 3.8 10.2 3.7 10.3 3.5 10.6
Italy 2.8 7.1 2.8 7.5 2.8 7.4 2.8 7.8 2.6 7.9
Netherlands 2.4 6.0 2.1 5.6 2.0 5.4 1.9 5.2 1.6 5.0
Othereuropeancountries 11.1 28.0 11.0 29.4 11.2 30.2 10.9 30.1 9.9 29.9
Asia 8.3 100 9.5 100 10.2 100 11.1 100 13.3 100
China(without Hong Kong) 1.7 20.1 2.1 22.5 2.5 24.6 2.9 25.9 3.9 29.1
GulfStates 1.2 14.2 1.5 15.7 1.7 17.1 2.1 19.3 2.6 19.6
Japan 1.4 16.2 1.5 15.4 1.4 13.5 1.2 11.0 1.1 8.3
India 1.3 15.6 1.4 14.4 1.3 12.9 1.4 12.1 1.7 12.5
republicofKorea 0.5 5.7 0.5 5.2 0.5 5.2 0.7 6.6 0.9 6.7
Other Asian countries 2.4 28.3 2.6 26.8 2.7 26.7 2.8 25.1 3.2 23.8
America 6.0 100 6.2 100 6.3 100 6.4 100 6.8 100
unitedStatesof America 4.2 70.5 4.4 70.6 4.5 70.8 4.6 71.2 4.9 71.9
Canada 0.6 10.8 0.7 10.7 0.6 10.3 0.6 10.0 0.7 9.7
Brazil 0.5 9.2 0.6 9.3 0.6 9.2 0.6 9.6 0.6 9.3
Other American countries 0.6 9.5 0.6 9.3 0.6 9.7 0.6 9.2 0.6 9.1
Africa 0.8 100 0.9 100 0.8 100 0.8 100 0.8 100
Oceania 0.8 100 0.8 100 0.9 100 0.9 100 0.9 100
Total 100 100 100 100 100 100 100 100 100 100
Source: FSO – Tourist accommodation statistics © FSO 2016

48 SWISS TOURISM STATISTICS 2015 FSO 2016
APPeNDIx
Share of overnight stays by continent and by country of residence from 2014 to 2015 (continued)Campsites T 2.2.3–6
Overnight stays Variation in overnight stays (in %) Share of overnight stays 2015 (in %)
2014 2015 2014–2015 of total
Total 2 672 542 2 657 280 –0.6 100
Switzerland 1 626 604 1 785 874 9.8 67.2
Total Foreigners 1 045 938 871 406 –16.7 32.8
Europe (without Switzerland) 998 085 821 735 –17.7 30.9
Germany 403 024 315 313 –21.8 11.9
Othereuropeancountries 595 061 506 422 –14.9 19.1
Oceania 25 048 22 461 –10.3 0.8
Asia 12 304 16 176 31.5 0.6
republicofKorea 5 442 6 346 16.6 0.2
Other Asian countries 6 862 9 830 43.3 0.4
America 9 760 10 293 5.5 0.4
unitedStatesofAmerica 5 856 6 203 5.9 0.2
Other American countries 3 904 4 090 4.8 0.2
Africa 744 741 –0.4 0.0
Source: FSO – Tourist accommodation statistics © FSO 2016
Share of overnight stays by continent and by country of residence from 2014 to 2015 (end)Youth hostels T 2.2.3–6
Overnight stays Variation in overnight stays (in %) Share of overnight stays 2015 (in %)
2014 2015 2014–2015 of total
Total 951 037 813 635 –14.4 100
Switzerland 547 753 536 636 –2.0 66.0
Total Foreigners 403 284 276 999 –31.3 34.0
Europe (without Switzerland) 268 045 169 151 –36.9 20.8
Germany 101 495 75 637 –25.5 9.3
Othereuropeancountries 166 550 93 514 –43.9 11.5
Asia 84 207 72 480 –13.9 8.9
China (without Hong Kong) 19 953 32 992 65.3 4.1
Other Asian countries 64 254 39 488 –38.5 4.9
America 36 992 25 044 –32.3 3.1
unitedStatesofAmerica 19 823 14 639 –26.2 1.8
Other American countries 17 169 10 405 –39.4 1.3
Oceania 7 667 6 651 –13.3 0.8
Africa 6 373 3 673 –42.4 0.5
Source: FSO – Tourist accommodation statistics © FSO 2016

492016 FSO SWISS TOURISM STATISTICS 2015
APPeNDIx
Tourist region Hotelsandhealthestablishments
Overnight stays 2014 Overnight stays 2015 Variation 2011–2012 (in %)
Swiss Foreigners Total Swiss Foreigners Total Swiss Foreigners Total
Switzerland 16 026 135 19 907 377 35 933 512 16 052 181 19 576 295 35 628 476 –0.4 –3.3 –2.0
Graubünden 2 868 239 2 183 986 5 052 225 2 790 412 1 926 889 4 717 301 –0.4 –11.6 –5.6
easternSwitzerland 1 246 029 732 494 1 978 523 1 213 874 671 206 1 885 080 –1.6 –1.8 –1.7
Zurichregion 1 556 213 3 847 018 5 403 231 1 652 679 3 958 840 5 611 519 –0.5 3.0 2.0
Lucerne/LakeLucerne 1 446 973 2 008 173 3 455 146 1 483 902 2 122 745 3 606 647 0.0 –2.7 –1.6
Baselregion 534 032 964 896 1 498 928 552 443 968 490 1 520 933 1.2 –0.9 –0.2
Bernregion 536 242 515 508 1 051 750 510 946 525 650 1 036 596 –2.0 0.4 –0.9
BerneseOberland 1 563 439 2 120 468 3 683 907 1 542 265 2 179 780 3 722 045 –4.5 –4.0 –4.2
Jura & Three-Lakes 452 229 316 140 768 369 448 201 296 793 744 994 4.7 –4.0 1.1
LakeGenevaregion(Vaud) 1 110 276 1 545 420 2 655 696 1 194 524 1 479 736 2 674 260 1.2 –7.7 –4.3
Geneva 582 727 2 356 441 2 939 168 565 854 2 386 805 2 952 659 –8.4 1.1 –0.9
Valais 2 048 918 1 838 427 3 887 345 2 061 095 1 677 331 3 738 426 3.8 –8.4 –2.2
Ticino 1 396 905 916 134 2 313 039 1 347 852 832 493 2 180 345 –0.9 –5.8 –3.0
Fribourgregion 289 101 180 705 469 806 282 718 169 150 451 868 3.9 10.1 6.1
Aargau Region 394 812 381 567 776 379 405 416 380 387 785 803 –1.1 1.2 –0.1
Source: FSO – Tourist accommodation statistics © FSO 2016
Change in demand by tourist region from 2011 to 2015 T 2.2.7
Tourist region Hotelsandhealthestablishments
Overnight stays 2011 Overnight stays 2012 Overnight stays 2013
Swiss Foreigners Total Swiss Foreigners Total Swiss Foreigners Total
Switzerland 15 752 367 19 733 889 35 486 256 15 690 035 19 076 238 34 766 273 15 889 226 19 734 657 35 623 883
Graubünden 2 863 056 2 502 566 5 365 622 2 852 180 2 212 015 5 064 195 2 904 212 2 256 763 5 160 975
easternSwitzerland 1 208 414 763 563 1 971 977 1 188 752 749 494 1 938 246 1 187 762 745 294 1 933 056
Zurichregion 1 500 355 3 516 821 5 017 176 1 493 421 3 621 945 5 115 366 1 531 265 3 739 567 5 270 832
Lucerne/LakeLucerne 1 409 237 1 888 340 3 297 577 1 409 057 1 837 161 3 246 218 1 408 673 1 928 872 3 337 545
Baselregion 458 727 915 198 1 373 925 464 348 907 143 1 371 491 471 663 940 079 1 411 742
Bernregion 545 023 476 474 1 021 497 533 970 478 217 1 012 187 547 342 500 306 1 047 648
BerneseOberland 1 651 722 1 991 419 3 643 141 1 577 516 1 911 067 3 488 583 1 586 938 2 062 392 3 649 330
Jura & Three-Lakes 428 032 304 374 732 406 448 079 292 166 740 245 451 865 312 856 764 721
LakeGenevaregion(Vaud) 990 182 1 573 967 2 564 149 1 002 296 1 452 713 2 455 009 1 079 948 1 522 555 2 602 503
Geneva 593 220 2 245 009 2 838 229 543 361 2 268 719 2 812 080 553 812 2 329 433 2 883 245
Valais 2 057 619 2 020 195 4 077 814 2 136 657 1 849 512 3 986 169 2 020 402 1 867 310 3 887 712
Ticino 1 352 150 1 019 953 2 372 103 1 339 668 960 355 2 300 023 1 437 432 968 002 2 405 434
Fribourgregion 277 323 153 221 430 544 288 079 168 755 456 834 293 705 179 692 473 397
Aargau Region 417 307 362 789 780 096 412 651 366 976 779 627 414 207 381 536 795 743

50 SWISS TOURISM STATISTICS 2015 FSO 2016
APPeNDIx
Change in demand by tourist region from 2011 to 2015 (continued) T 2.2.7
Tourist region Hotelsandhealthestablishments
Variation 2012–2013 (in %) Variation 2013–2014 (in %) Variation 2014–2015 (in %) Distributionofover-night stays 2015 (in %)
Swiss Foreign-ers
Total Swiss Foreign-ers
Total Swiss Foreign-ers
Total Swiss Foreign-ers
Switzerland 1.3 3.5 2.5 0.9 0.9 0.9 0.2 –1.7 –0.8 45.1 54.9
Graubünden 1.8 2.0 1.9 –1.2 –3.2 –2.1 –2.7 –11.8 –6.6 59.2 40.8
easternSwitzerland –0.1 –0.6 –0.3 4.9 –1.7 2.4 –2.6 –8.4 –4.7 64.4 35.6
Zurichregion 2.5 3.2 3.0 1.6 2.9 2.5 6.2 2.9 3.9 29.5 70.5
Lucerne/LakeLucerne 0.0 5.0 2.8 2.7 4.1 3.5 2.6 5.7 4.4 41.1 58.9
Baselregion 1.6 3.6 2.9 13.2 2.6 6.2 3.4 0.4 1.5 36.3 63.7
Bernregion 2.5 4.6 3.5 –2.0 3.0 0.4 –4.7 2.0 –1.4 49.3 50.7
BerneseOberland 0.6 7.9 4.6 –1.5 2.8 0.9 –1.4 2.8 1.0 41.4 58.6
Jura & Three-Lakes 0.8 7.1 3.3 0.1 1.0 0.5 –0.9 –6.1 –3.0 60.2 39.8
LakeGenevaregion(Vaud) 7.7 4.8 6.0 2.8 1.5 2.0 7.6 –4.3 0.7 44.7 55.3
Geneva 1.9 2.7 2.5 5.2 1.2 1.9 –2.9 1.3 0.5 19.2 80.8
Valais –5.4 1.0 –2.5 1.4 –1.5 0.0 0.6 –8.8 –3.8 55.1 44.9
Ticino 7.3 0.8 4.6 –2.8 –5.4 –3.8 –3.5 –9.1 –5.7 61.8 38.2
Fribourgregion 2.0 6.5 3.6 –1.6 0.6 –0.8 –2.2 –6.4 –3.8 62.6 37.4
Aargau Region 0.4 4.0 2.1 –4.7 0.0 –2.4 2.7 –0.3 1.2 51.6 48.4
Tourist region Youth hostels
Overnight stays 2014 Overnight stays 2015 Variation 2014–2015 (in %)
Switzerland 951 037 813 635 –14.4
Graubünden 149 786 138 333 –7.6
easternSwitzerland 48 444 44 244 –8.7
Zurichregion 120 161 106 600 –11.3
Lucerne/LakeLucerne 62 205 58 439 –6.1
Baselregion X X X
Bernregion X X X
BerneseOberland 95 127 97 629 2.6
Jura & Three-Lakes X X X
LakeGenevaregion(Vaud) 82 063 78 880 –3.9
Geneva X 0 X
Valais 58 753 69 800 18.8
Ticino 89 276 84 545 –5.3
Fribourgregion X X X
Aargau Region X X X
Source: FSO – Tourist accommodation statistics © FSO 2016

512016 FSO SWISS TOURISM STATISTICS 2015
APPeNDIx
Change in demand by tourist region from 2011 to 2015 (end) T 2.2.7
Tourist region Campsites
Overnight stays 2014 Overnight stays 2015 Variation 2014–2015 (in %)
Switzerland 2 672 542 2 657 280 –0.6
Graubünden 246 575 266 645 8.1
easternSwitzerland 154 777 159 900 3.3
Zurichregion 98 465 111 954 13.7
Lucerne/LakeLucerne 241 280 236 906 –1.8
Baselregion 9 610 6 847 –28.8
Bernregion 51 347 51 966 1.2
BerneseOberland 285 934 268 896 –6.0
Jura & Three-Lakes 182 522 183 988 0.8
LakeGenevaregion(Vaud)/Geneva1 250 137 305 874 22.3
Valais 378 894 361 974 –4.5
Ticino 695 252 617 552 –11.2
Fribourgregion 46 934 49 870 6.3
Aargau Region 30 815 34 908 13.3
1 LakeGenevaregion(Vaud)andGenevacombinedfordataprotectionreasons(fewerthan3establishmentsopenfortheGenevatouristregion,onannualaverage)
Source: FSO – Tourist accommodation statistics © FSO 2016

52 SWISS TOURISM STATISTICS 2015 FSO 2016
APPeNDIx
Tourist region Average duration of stay in 2009(in nights)
Average duration of stay in 2010(in nights)
Average duration of stay in 2011(in nights)
Hotelsandhealthestablishments
Swiss Foreigners Total Swiss Foreigners Total Swiss Foreigners Total
Switzerland 2.12 2.43 2.29 2.08 2.37 2.23 2.05 2.31 2.19
Graubünden 2.74 3.71 3.15 2.69 3.63 3.08 2.64 3.56 3.00
easternSwitzerland 2.08 2.25 2.14 2.08 2.30 2.16 2.03 2.36 2.15
Zurichregion 1.64 1.88 1.81 1.63 1.87 1.79 1.63 1.86 1.78
Lucerne/LakeLucerne 1.90 2.01 1.96 1.90 1.93 1.92 1.87 1.86 1.86
Baselregion 1.81 2.04 1.95 1.77 2.08 1.96 1.72 2.09 1.95
Bernregion 1.64 1.98 1.79 1.55 1.90 1.70 1.60 1.97 1.76
BerneseOberland 2.32 2.94 2.62 2.28 2.79 2.54 2.18 2.57 2.38
Jura & Three-Lakes 1.55 2.13 1.75 1.57 2.10 1.76 1.56 2.06 1.74
LakeGenevaregion(Vaud) 1.91 2.52 2.27 1.90 2.51 2.24 1.90 2.48 2.22
Geneva 1.82 2.17 2.09 1.79 2.16 2.07 1.83 2.18 2.10
Valais 2.51 3.48 2.95 2.43 3.27 2.80 2.39 3.13 2.71
Ticino 2.24 2.29 2.26 2.22 2.28 2.25 2.20 2.30 2.24
Fribourgregion 1.63 1.78 1.68 1.60 1.77 1.66 1.59 1.82 1.66
Aargau Region 2.07 2.25 2.16 2.06 2.24 2.13 2.00 2.25 2.11
Source: FSO – Tourist accommodation statistics © FSO 2016
Duration of stay 2006–2015 T 2.3
Tourist region Average duration of stay in 2006(in nights)
Average duration of stay in 2007(in nights)
Average duration of stay in 2008(in nights)
Hotelsandhealthestablishments
Swiss Foreigners Total Swiss Foreigners Total Swiss Foreigners Total
Switzerland 2.19 2.50 2.35 2.15 2.48 2.33 2.14 2.50 2.33
Graubünden 2.84 3.85 3.26 2.80 3.77 3.22 2.71 3.80 3.16
easternSwitzerland 2.22 2.33 2.26 2.15 2.34 2.22 2.08 2.29 2.15
Zurichregion 1.72 1.90 1.84 1.68 1.93 1.84 1.66 1.91 1.83
Lucerne/LakeLucerne 1.97 2.06 2.02 1.89 2.02 1.97 1.92 2.08 2.01
Baselregion 1.90 2.19 2.09 1.93 2.13 2.06 1.88 2.12 2.03
Bernregion 1.58 2.01 1.78 1.58 1.99 1.78 1.61 2.04 1.81
BerneseOberland 2.39 3.03 2.71 2.36 2.91 2.65 2.36 3.06 2.71
Jura & Three-Lakes 1.60 2.31 1.83 1.60 2.27 1.83 1.58 2.21 1.81
LakeGenevaregion(Vaud) 2.01 2.66 2.38 1.96 2.64 2.35 1.97 2.65 2.37
Geneva 1.79 2.22 2.12 1.84 2.25 2.16 1.85 2.22 2.14
Valais 2.58 3.44 2.97 2.54 3.48 2.98 2.57 3.54 3.02
Ticino 2.25 2.29 2.27 2.27 2.25 2.26 2.27 2.29 2.28
Fribourgregion 1.78 1.83 1.80 1.65 1.80 1.71 1.60 1.83 1.69
Aargau Region 1.97 2.55 2.21 2.02 2.47 2.21 2.04 2.34 2.17
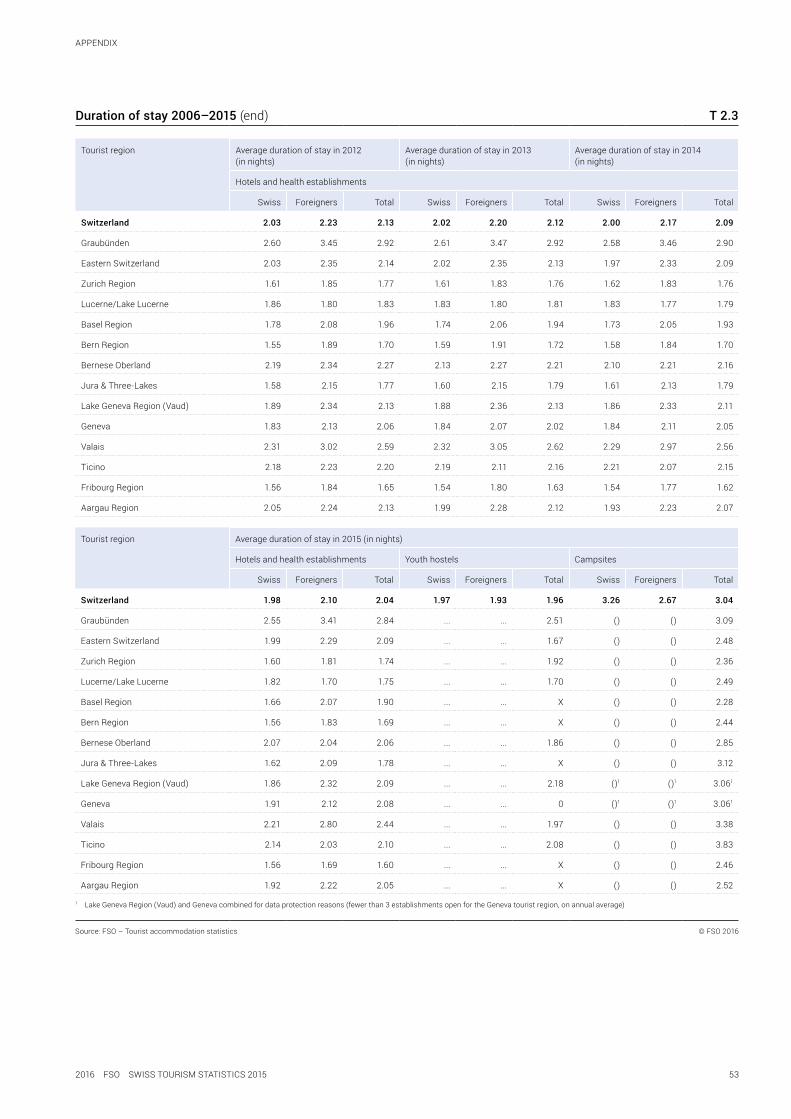
532016 FSO SWISS TOURISM STATISTICS 2015
APPeNDIx
Duration of stay 2006–2015 (end) T 2.3
Tourist region Average duration of stay in 2012(in nights)
Average duration of stay in 2013(in nights)
Average duration of stay in 2014(in nights)
Hotelsandhealthestablishments
Swiss Foreigners Total Swiss Foreigners Total Swiss Foreigners Total
Switzerland 2.03 2.23 2.13 2.02 2.20 2.12 2.00 2.17 2.09
Graubünden 2.60 3.45 2.92 2.61 3.47 2.92 2.58 3.46 2.90
easternSwitzerland 2.03 2.35 2.14 2.02 2.35 2.13 1.97 2.33 2.09
Zurichregion 1.61 1.85 1.77 1.61 1.83 1.76 1.62 1.83 1.76
Lucerne/LakeLucerne 1.86 1.80 1.83 1.83 1.80 1.81 1.83 1.77 1.79
Baselregion 1.78 2.08 1.96 1.74 2.06 1.94 1.73 2.05 1.93
Bernregion 1.55 1.89 1.70 1.59 1.91 1.72 1.58 1.84 1.70
BerneseOberland 2.19 2.34 2.27 2.13 2.27 2.21 2.10 2.21 2.16
Jura & Three-Lakes 1.58 2.15 1.77 1.60 2.15 1.79 1.61 2.13 1.79
LakeGenevaregion(Vaud) 1.89 2.34 2.13 1.88 2.36 2.13 1.86 2.33 2.11
Geneva 1.83 2.13 2.06 1.84 2.07 2.02 1.84 2.11 2.05
Valais 2.31 3.02 2.59 2.32 3.05 2.62 2.29 2.97 2.56
Ticino 2.18 2.23 2.20 2.19 2.11 2.16 2.21 2.07 2.15
Fribourgregion 1.56 1.84 1.65 1.54 1.80 1.63 1.54 1.77 1.62
Aargau Region 2.05 2.24 2.13 1.99 2.28 2.12 1.93 2.23 2.07
Tourist region Average duration of stay in 2015 (in nights)
Hotelsandhealthestablishments Youth hostels Campsites
Swiss Foreigners Total Swiss Foreigners Total Swiss Foreigners Total
Switzerland 1.98 2.10 2.04 1.97 1.93 1.96 3.26 2.67 3.04
Graubünden 2.55 3.41 2.84 ... ... 2.51 () () 3.09
easternSwitzerland 1.99 2.29 2.09 ... ... 1.67 () () 2.48
Zurichregion 1.60 1.81 1.74 ... ... 1.92 () () 2.36
Lucerne/LakeLucerne 1.82 1.70 1.75 ... ... 1.70 () () 2.49
Baselregion 1.66 2.07 1.90 ... ... X () () 2.28
Bernregion 1.56 1.83 1.69 ... ... X () () 2.44
BerneseOberland 2.07 2.04 2.06 ... ... 1.86 () () 2.85
Jura & Three-Lakes 1.62 2.09 1.78 ... ... X () () 3.12
LakeGenevaregion(Vaud) 1.86 2.32 2.09 ... ... 2.18 ()1 ()1 3.061
Geneva 1.91 2.12 2.08 ... ... 0 ()1 ()1 3.061
Valais 2.21 2.80 2.44 ... ... 1.97 () () 3.38
Ticino 2.14 2.03 2.10 ... ... 2.08 () () 3.83
Fribourgregion 1.56 1.69 1.60 ... ... X () () 2.46
Aargau Region 1.92 2.22 2.05 ... ... X () () 2.52
1 LakeGenevaregion(Vaud)andGenevacombinedfordataprotectionreasons(fewerthan3establishmentsopenfortheGenevatouristregion,onannualaverage)
Source: FSO – Tourist accommodation statistics © FSO 2016

54 SWISS TOURISM STATISTICS 2015 FSO 2016
APPeNDIx
Change in demand in Europe and in the neighbouring countries of Switzerland from 2014 to 2015Hotelsandsimilarestablishments T 2.5
Country Overnight stays Change 2014–2015, in %
Residents 2014
Residents 2015
Non-residents 2014
Non-residents 2015
Total 2014 Total 2015 Overnight staysby
residents
Overnight staysby
non-resi-dents
Totalovernight
stays
eu28 874 773 916 902 140 000 866 858 220 896 406 325 1 741 632 136 1 798 546 325 3.1 3.4 3.3
Germany 202 138 285 207 613 397 61 255 200 64 897 598 263 393 485 272 510 995 2.7 5.9 3.5
France 128 341 140 131 986 625 73 552 946 76 239 833 201 894 089 208 226 458 2.8 3.7 3.1
Italy 127 812 142 130 242 161 127 440 294 129 443 830 255 252 436 259 685 991 1.9 1.6 1.7
Austria 23 481 554 23 938 412 61 829 801 63 327 449 85 311 355 87 265 861 1.9 2.4 2.3
Switzerland 16 026 135 16 052 181 19 907 377 19 576 295 35 933 512 35 628 476 0.2 –1.7 –0.8
Sources:FSO,eurostat ©FSO2016
Net room occupancy rate from 2011 to 2015Hotelsandhealthestablishments T 2.4
Tourist region Net room occupancy rate1 (in %)
2011 2012 2013 2014 2015 Winter season 2014–20152
Summerseason 20153
Switzerland 51.6 50.5 51.6 52.0 51.5 47.4 55.7
Graubünden 51.4 49.0 49.8 48.9 46.7 51.6 42.6
easternSwitzerland 38.4 37.8 38.0 38.9 37.3 32.9 41.3
Zurichregion 63.7 62.9 62.9 63.5 63.3 56.5 70.4
Lucerne/LakeLucerne 47.3 46.6 47.9 48.6 50.6 41.1 59.3
Baselregion 55.0 54.2 56.6 58.0 57.3 54.4 60.4
Bernregion 51.0 50.4 52.2 53.1 52.5 46.5 58.2
BerneseOberland 52.9 51.0 53.3 54.5 54.8 46.9 61.7
Jura & Three-Lakes 36.3 36.4 38.4 39.3 38.4 32.6 43.8
LakeGenevaregion(Vaud) 52.5 51.4 54.0 53.5 52.5 46.3 58.4
Geneva 65.1 63.6 63.8 65.1 64.6 60.1 68.9
Valais 49.3 48.7 48.6 47.8 47.3 49.6 45.7
Ticino 47.4 45.6 47.1 47.7 46.2 32.8 55.5
Fribourgregion 39.0 39.1 41.4 41.5 39.9 34.3 46.1
Aargau Region 46.4 45.1 47.7 46.8 47.3 42.9 52.0
1 Numberofoccupiedroomsdividedbythetotalnetroomcapacityfortheperiodunderreview,asapercentage (Thenetroomcapacityisthenumberofroomsinanestablishmentduringthemonthunderreviewmultipliedbythenumberofdaystheestablishmentisopenduringthismonth.) 2 Wintertouristseason:November2014toApril2015 3 Summertouristseason:May2015toOctober2015
Source: FSO – Tourist accommodation statistics © FSO 2016

552016 FSO SWISS TOURISM STATISTICS 2015
APPeNDIx
Change in demand in Europe and in the neighbouring countries of Switzerland from 2014 to 2015 (end) Hotelsandsimilarestablishments T 2.5
Country Overnight stays
Residents 2014 Residents 2015 Non-residents 2014 Non-residents 2015 Total 2014 Total 2015
eu28 (d) (e) (d) (e) (d) (e)
Germany (d) (d) (d) (d) (d) (d)
France (d) (d) (d) (d) (d) (d)
Italy (d) (d) (d) (d) (d) (d)
Austria (d) (d) (d) (d) (d) (d)
Switzerland (d) (d) (d) (d) (d) (d)
Sources:FSO,eurostat ©FSO2016
Trips with overnight stays Net travel propensity as a percentage1 T 3.1
2012 2013 2014
Total 86.5 87.5 87.5
1 Percentage of persons aged 6 and over who undertook at least one private trip with at least one overnight stay during the survey year.
Source:FSO–Travelbehaviour ©FSO2016
Number of trips with overnight stays per person (end) T 3.1
2012 2013 2014
Total Switzerland Abroad Total Switzerland Abroad Total Switzerland Abroad
Total 2.8 1.0 1.8 3.0 1.2 1.9 2.9 1.0 1.8
Sex
Men 2.7 1.0 1.8 3.1 1.2 1.9 2.9 1.0 1.9
Women 2.9 1.1 1.8 3.0 1.2 1.8 2.8 1.1 1.8
Age
6–14 year olds 2.4 1.2 1.3 3.6 2.0 1.6 3.0 1.7 1.3
15–24 year olds 2.5 1.2 1.3 2.8 1.1 1.7 2.5 0.9 1.6
25–44 year olds 3.3 1.1 2.2 3.6 1.2 2.4 3.2 1.0 2.2
45–64 year olds 3.0 1.0 2.0 3.0 1.1 1.9 3.0 1.0 2.0
≥65yearolds 1.9 0.8 1.2 2.1 0.9 1.2 2.2 0.9 1.4
Place of residencebylanguageregion
German-speakingSwitzerland 2.8 1.1 1.7 3.1 1.3 1.8 2.9 1.1 1.8
French-speaking Switzerland 3.1 0.9 2.2 3.1 1.0 2.0 2.9 0.9 2.0
Italian-speaking Switzerland 2.2 0.6 1.6 2.0 0.6 1.4 2.2 0.8 1.4
Swiss resident population aged 6 and over
Source:FSO–Travelbehaviour ©FSO2016

56 SWISS TOURISM STATISTICS 2015 FSO 2016
APPeNDIx
Number of trips with overnight stays by destination, in thousands T 3.1.1
2012 2013 2014
Total 20 341 22 217 21 159
Destination
Switzerland 7 417 8 648 7 732
Germany 3 053 2 952 2 639
Austria 949 981 1 019
Italy 2 091 1 951 2 557
France1 2 042 2 247 2 003
South-easteurope2 764 933 972
South-Westeurope3 1 084 1 310 1 497
restofeurope 1 396 1 616 1 283
Rest of world 1 544 1 575 1 454
unknown – 4 3
1 Including the overseas departments and Monaco 2 Greece,Turkey,Croatia,Bosnia-Herzegovina,Serbia,Albania,Slovenia,Montenegro,Kosovo,romania,Bulgaria,Macedonia 3 Spain,Portugal,Andorra,Gibraltar
Swiss resident population aged 6 and over
Source:FSO–Travelbehaviour ©FSO2016
Number of trips with overnight stays by trip duration, in thousands T 3.1.2
2012 2013 2014
Total Switzerland Abroad Total Switzerland Abroad Total Switzerland Abroad
Total 20 341 7 417 12 924 22 217 8 648 13 569 21 159 7 732 13 427
Trip duration
1 overnight stay 3 288 2 111 1 177 3 893 2 558 1 335 3 367 2 127 1 240
2 overnight stays 3 184 1 500 1 684 3 686 2 050 1 636 3 269 1 628 1 641
3 overnight stays 2 591 956 1 635 2 706 980 1 726 2 590 956 1 634
4–7 overnight stays 6 427 2 094 4 333 6 720 2 384 4 336 6 802 2 274 4 528
8–14 overnight stays 3 065 621 2 444 3 383 553 2 830 3 420 561 2 859
More than 14 overnight stays 1 786 135 1 651 1 830 124 1 706 1 711 186 1 525
Swiss resident population aged 6 and over
Source:FSO–Travelbehaviour ©FSO2016

572016 FSO SWISS TOURISM STATISTICS 2015
APPeNDIx
Number of trips with overnight stays, in thousands T 3.1.3-4
2014
In Switzerland 1–3 overnight
stays
In Switzerland4 overnight stays
or more
Abroad1–3 overnight
stays
Abroad4 overnight stays
or more
Total 4 711 3 021 4 515 8 912
Accommodation type
Hotelsandhealthestablishments 1 943 636 3 077 4 242
Supplementary accomodation1 802 1 504 423 1 817
Visiting friends and relatives 1 353 357 891 2 172
Own holiday home, holiday home free of charge 578 477 81 397
Other2 30 47 43 285
unknown 4 – – –
Main means of transport
Motorised private transport3 3 148 2 125 2 535 3 359
Land-basedpublictransport4 1 481 727 814 676
Aeroplane 3 – 1 057 4 448
Other5 80 169 109 429
1 Rented holiday homes, campsites, group accommodation, youth hostels 2 Other forms of accommodation (e.g. ship) 3 Car, motorcycle, moped, campervan 4 Train,bus/postalbus,tram,underground 5 Onfoot,byship,bicycle,taxi,coach,others
Swiss resident population aged 6 and over
Source:FSO–Travelbehaviour ©FSO2016
Comparison with neighbouring countriesNumberofprivatetripswithovernightstayspercountryofresidence,inthousands T 3.1.5
2014
Total Domestic Abroad
Switzerland 17 839 6 312 11 526
Germany 197 189 123 741 73 448
France 205 904 181 739 24 165
Italy 46 881 37 223 9 658
Austria 18 341 9 573 8 768
Resident population aged 15 and over
Sources:FSO,eurostat ©FSO2016

58 SWISS TOURISM STATISTICS 2015 FSO 2016
APPeNDIx
Long-term change of trips with overnight staysTrips with overnight stays per person T 3.1.6
1998 2003 2008 2009 2010 2011 2012 2013 2014
Number of trips 3.5 3.0 3.2 2.7 2.6 2.5 2.9 3.0 2.9
In Switzerland
Duration 1-3 overnight stays 1.3 1.1 1.0 0.6 0.7 0.6 0.7 0.7 0.6
Duration 4 overnight stays or more 0.5 0.4 0.4 0.4 0.4 0.3 0.4 0.4 0.4
Abroad
Duration 1-3 overnight stays 0.7 0.5 0.8 0.6 0.5 0.5 0.7 0.7 0.7
Duration 4 overnight stays or more 1.0 1.0 1.0 1.1 1.1 1.2 1.2 1.2 1.2
Swiss resident population aged 15 and over
Source:FSO–Travelbehaviour ©FSO2016
Day tripsNumberofdaytrips,inthousands T 3.2a
2012 2013 2014
Total 71 651 76 447 75 780
In Switzerland 62 723 67 987 68 268
Main purpose of trip
Leisure, recreation and holidays 34 064 35 258 35 514
Visiting friends and relatives 15 472 17 002 15 570
Businesspurpose 3 942 3 909 2 680
Other 18 101 20 193 22 015
unknown 73 85 –
Swiss resident population aged 6 and over
Source:FSO–Travelbehaviour ©FSO2016
Long-term change of day tripsDay trips per person T 3.2b
1998 2003 2008 2009 2010 2011 2012 2013 2014
Number of trips per person 12.5 14.8 12.7 12.0 10.7 9.9 9.9 10.2 10.3
Swiss resident population aged 15 and over
Source:FSO–Travelbehaviour ©FSO2016

592016 FSO SWISS TOURISM STATISTICS 2015
APPeNDIx
Gross value added by tourism T 4.1
2011 2012 2013 20141
At current prices in CHF million
At current prices in CHF million
At current prices in CHF million
At current prices in CHF million
Total 16 793 16 829 17 084 17 386
A. Tourism-specific products 16 339 16 382 16 635 16 938
A.1 Tourism-characteristic products 12 662 12 634 12 856 13 073
1. Accommodation 4 006 3 930 4 033 4 065
of which accommodation in hotels 2 149 2 094 2 166 2 183
2. Food and drink serving services 2 784 2 671 2 730 2 775
3. Transport services 3 899 4 009 4 138 4 126
ofwhichcableways 514 531 543 559
of which air transport 1 918 1 966 2 045 1 980
4. Travel agency, tour operator and tourist guide services 885 869 873 1 017
5. Culture 90 82 84 86
6. Sport and entertainment 719 786 704 730
7. Miscellaneous services 279 288 294 275
A.2 Tourism-related products 3 678 3 749 3 778 3 865
B.Nontourism-specficproducts 453 447 449 448
2011–2012 2012–2013 2013–20141 2011–20141
Change in % Change in % Change in % Change in %
Total 0.2 1.5 1.8 3.5
A. Tourism-specific products 0.3 1.5 1.8 3.7
A.1 Tourism-characteristic products –0.2 1.8 1.7 3.3
1. Accommodation –1.9 2.6 0.8 1.5
of which accommodation in hotels –2.6 3.4 0.8 1.6
2. Food and drink serving services –4.1 2.2 1.7 –0.3
3. Transport services 2.8 3.2 –0.3 5.8
ofwhichcableways 3.3 2.4 2.9 8.8
of which air transport 2.5 4.0 –3.2 3.2
4. Travel agency, tour operator and tourist guide services –1.8 0.5 16.4 14.8
5. Culture –9.5 2.7 2.1 –5.1
6. Sport and entertainment 9.3 –10.4 3.8 1.6
7. Miscellaneous services 3.2 2.4 –6.6 –1.4
A.2 Tourism-related products 1.9 0.8 2.3 5.1
B.Nontourism-specficproducts –1.4 0.5 –0.4 –1.2
1 Provisional values
Source: FSO – Indicators of the tourism satellite account © FSO 2016

60 SWISS TOURISM STATISTICS 2015 FSO 2016
APPeNDIx
Tourist demand T 4.2
2011 2012 2013 20141
At current prices in CHF million
At current prices in CHF million
At current prices in CHF million
At current prices in CHF million
Total 47 440 47 385 47 304 47 808
A. Tourism-specific products 36 414 36 328 36 337 36 799
A.1 Tourism-characteristic products 31 066 30 854 30 833 31 179
1. Accommodation 5 466 5 343 5 469 5 445
of which accommodation in hotels 4 641 4 572 4 719 4 762
2. Food and drink serving services 6 337 6 126 6 222 6 220
3. Transport services 9 528 9 870 10 113 10 215
ofwhichcableways 1 069 1 117 1 152 1 161
of which air transport 5 613 5 772 5 905 5 967
4. Travel agency, tour operator and tourist guide services 7 861 7 568 7 243 7 475
5. Culture 137 123 124 126
6. Sport and entertainment 1 259 1 331 1 154 1 217
7. Miscellaneous services 480 493 508 481
A.2 Tourism-related products 5 348 5 473 5 504 5 620
B.Nontourism-specficproducts 11 026 11 057 10 967 11 010
2011–2012 2012–2013 2013–20141 2011–20141
Change in % Change in % Change in % Change in %
Total –0.1 –0.2 1.1 0.8
A. Tourism-specific products –0.2 0.0 1.3 1.1
A.1 Tourism-characteristic products –0.7 –0.1 1.1 0.4
1. Accommodation –2.2 2.4 –0.4 –0.4
of which accommodation in hotels –1.5 3.2 0.9 2.6
2. Food and drink serving services –3.3 1.6 –0.0 –1.8
3. Transport services 3.6 2.5 1.0 7.2
ofwhichcableways 4.5 3.2 0.7 8.6
of which air transport 2.8 2.3 1.0 6.3
4. Travel agency, tour operator and tourist guide services –3.7 –4.3 3.2 –4.9
5. Culture –9.7 0.9 1.4 –7.7
6. Sport and entertainment 5.7 –13.2 5.4 –3.3
7. Miscellaneous services 2.8 2.9 –5.3 0.2
A.2 Tourism-related products 2.3 0.6 2.1 5.1
B.Nontourism-specficproducts 0.3 –0.8 0.4 –0.1
1 Provisional values
Source: FSO – Indicators of the tourism satellite account © FSO 2016

612016 FSO SWISS TOURISM STATISTICS 2015
APPeNDIx
Tourism employment T 4.3
2011 2012 2013 20141
In full-timeequivalents
In full-timeequivalents
In full-timeequivalents
In full-timeequivalents
Total 166 935 167 180 169 427 170 118
A. Tourism-specific products 165 423 165 654 167 896 168 582
A.1 Tourism-characteristic products 129 816 130 265 132 212 132 687
1. Accommodation 34 212 33 994 35 133 34 852
of which accommodation in hotels 31 097 30 860 31 934 31 679
2. Food and drink serving services 46 458 46 106 46 169 46 543
3. Transport services 27 942 29 175 29 779 29 966
ofwhichcableways 5 465 5 760 5 983 6 031
of which air transport 6 287 6 632 6 871 6 899
4. Travel agency, tour operator and tourist guide services 12 980 12 753 12 655 12 773
5. Culture 2 713 2 717 2 798 2 821
6. Sport and entertainment 4 300 4 293 4 427 4 469
7. Miscellaneous services 1 210 1 226 1 252 1 262
A.2 Tourism-related products 35 607 35 389 35 684 35 894
B.Nontourism-specficproducts 1 512 1 525 1 531 1 536
2011–2012 2012–2013 2013–20141 2011–20141
Change in % Change in % Change in % Change in %
Total 0.1 1.3 0.4 1.9
A. Tourism-specific products 0.1 1.4 0.4 1.9
A.1 Tourism-characteristic products 0.3 1.5 0.4 2.2
1. Accommodation –0.6 3.3 –0.8 1.9
of which accommodation in hotels –0.8 3.5 –0.8 1.9
2. Food and drink serving services –0.8 0.1 0.8 0.2
3. Transport services 4.4 2.1 0.6 7.2
ofwhichcableways 5.4 3.9 0.8 10.4
of which air transport 5.5 3.6 0.4 9.7
4. Travel agency, tour operator and tourist guide services –1.8 –0.8 0.9 –1.6
5. Culture 0.1 3.0 0.8 4.0
6. Sport and entertainment –0.2 3.1 1.0 3.9
7. Miscellaneous services 1.3 2.2 0.8 4.4
A.2 Tourism-related products –0.6 0.8 0.6 0.8
B.Nontourism-specficproducts 0.9 0.4 0.3 1.6
1 Provisional values
Source: FSO – Indicators of the tourism satellite account © FSO 2016

62 SWISS TOURISM STATISTICS 2015 FSO 2016
APPeNDIx
Real gross domestic product growth rate, in % T 5.1
2006 2007 2008 2009 2010 2011 2012 2013 2014 2015
Switzerland 4.0 4.1 2.3 –2.1 3.0 1.8 1.1 1.8 2.0 0.8
europeanunion(eu28) 3.3 3.1 0.5 –4.4 2.1 1.8 –0.5 0.2 1.4 1.9
Germany 3.7 3.3 1.1 –5.6 4.1 3.7 0.4 0.3 1.6 1.7
France 2.4 2.4 0.2 –2.9 2.0 2.1 0.2 0.7 0.2 1.2
Italy 2.0 1.5 –1.1 –5.5 1.7 0.6 –2.8 –1.7 –0.3 0.8
Austria 3.4 3.6 1.5 –3.8 1.9 2.8 0.8 0.3 0.4 0.9
Sources:FSO–Nationalaccounts,eurostat ©FSO2016
Household consumption expenditure in SwitzerlandVariationin%comparedwithpreviousyear,atpreviousyear'sprices T 5.3a
2005 2006 2007 2008 2009 2010 2011 2012 2013 2014
Total consumption expenditure 1.5 1.4 2.3 1.4 1.2 1.7 0.8 2.6 2.2 1.2
Hotel and restaurant expenditure –0.4 2.6 –0.4 –1.0 1.4 –2.0 –2.3 0.8 1.6 –0.7
Sources:FSO–Nationalaccounts,eurostat ©FSO2016
Consumer confidence index T 5.2
Old index New index
January April July October January April July October
2006 2 7 12 13 – – – –
2007 17 20 15 15 – 16 8 15
2008 14 2 –17 –27 4 0 –17 –35
2009 –23 –38 –42 –30 –38 –49 –39 –14
2010 –22 –4 1 2 –7 14 16 7
2011 6 5 –6 –18 10 –1 –17 –24
2012 –18 –9 –13 –11 –19 –8 –17 –17
2013 –2 –5 –6 –1 –6 –5 –9 –5
2014 3 0 –1 –5 2 1 –1 –11
2015 –1 –7 –17 –15 –6 –6 –19 –18
Source: Seco © FSO 2016

632016 FSO SWISS TOURISM STATISTICS 2015
APPeNDIx
Restaurant and hotel expenditure, European comparisonVariationin%comparedwithpreviousyear,atpreviousyear'sprices T 5.3b
2010 2011 2012 2013 2014
Switzerland –2.0 –2.3 0.8 1.6 –0.7
europeanunion(eu28) 0.6 0.8 –1.0 –0.2 1.7
Germany 2.2 2.8 0.9 0.5 3.0
France 1.7 1.3 –1.8 –1.4 0.6
Italy 0.9 0.8 –1.1 –1.5 0.3
Austria 1.7 2.6 2.3 0.5 1.1
Source:eurostat ©FSO2016
Swiss consumer price indexAverageannualrpiceincrease(%),structureofthestandardbasket2015 T 5.4
2006 2007 2008 2009 2010 2011 2012 2013 2014 2015
Total index 1.1 0.7 2.4 –0.5 0.7 0.2 –0.7 –0.2 0.0 –1.1
Tourist accommodation 3.1 0.6 2.2 1.0 0.6 0.4 –0.2 0.4 0.1 –1.9
Hotels 3.2 0.2 2.7 0.4 0.2 –0.3 –0.4 –0.1 –0.4 –2.5
Supplementary accomodation 1.1 2.0 2.4 2.7 1.4 2.3 0.8 1.7 1.1 –0.6
Source: FSO – National accounts © FSO 2016
Harmonised index of consumer pricesVariation in % compared with previous year T 5.5
Restaurants and hotels
2011 2012 2013 2014 2015
Switzerland 1,3 0,5 0,7 0,5 –0,2
europeanunion(eu28) 2,4 2,2 2,3 1,7 1,7
Germany 1,5 1,8 6,5 2,1 2,6
France 2,0 2,8 2,2 2,7 1,4
Italy 2,1 1,5 1,5 0,8 1,3
Austria 3,7 3,2 3,2 2,9 2,9
Source:eurostat ©FSO2016

64 SWISS TOURISM STATISTICS 2015 FSO 2016
APPeNDIx
Comparative price level index in 2015europeanunion(eu28)=100 T 5.6
Restaurants and hotels
Switzerland 167.0
Germany 97.4
France 106.3
Italy 106.8
Austria 106.8
Source:eurostat ©FSO2016
Change in exchange ratesAnnual average values 2006–2015 T 5.7
Swiss francs (CHF) Variation (in %)
2006 2007 2008 2009 2010 2011 2012 2013 2014 2015 2006–2015
100rouble(ruB) 4.61 4.69 4.36 3.42 3.44 3.02 3.02 2.91 2.42 1.58 –65.6
1euro(eur) 1.57 1.64 1.59 1.51 1.38 1.23 1.21 1.23 1.21 1.07 –32.1
1Livresterling(GBP) 2.31 2.40 2.00 1.70 1.61 1.42 1.49 1.45 1.51 1.47 –36.3
1Dollar(uSD) 1.25 1.20 1.08 1.09 1.04 0.89 0.94 0.93 0.92 0.96 –23.2
100 Yen (JPY) 1.08 1.02 1.05 1.16 1.19 1.11 1.18 0.95 0.87 0.80 –26.2
Source:SNB ©FSO2016

The FSO's publications
As the central statistical agency of the Confederation, the Fed-eral Statistical Office (FSO) has the task of providing Swiss statistical information to a wide range of users. Dissemination is done by topic with different information media via several channels.
The statistical topics
00 Statistical basis and overviews01 Population02 Territory and environment03 Work and income04 National economy05 Prices06 Industry and services07 Agriculture and forestry08 Energy09 Construction and housing10 Tourism11 Mobility and transport12 Money, banks and insurance13 Social security14 Health15 Education and science16 Culture, media, information society, sports 17 Politics18 General Government and finance19 Crime and criminal justice20 Economic and social situation of the population21 Sustainable development, regional
and international disparities
The key publications
Statistical Yearbook of Switzerland
Verlag Neue Zürcher Zeitung
Statistisches Jahrbuch der Schweiz 2016
Annuaire statistique de la Suisse 2016
with English supplement/con supplemento italiano
ISBN 978-3-03810-144-4
9 7 8 3 0 3 8 1 0 1 4 4 4
ISBN 978-3 -03810-144-4
Statistisches Jahrbuch der Schweiz
Annuaire statistique de la Suisse
2016
www.nzz-libro.ch
The “Statistical Yearbook of Switzerland” (Ger-man/French) published by the Federal Statistical Office has been the standard reference book for Swiss statistics since 1891. It contains the most important statistical findings regarding the Swiss population, society, government, economy and environment.
Statistical Data on Switzerland
00
Statistical Data on Switzerland 2016
Statistical base and overviews
025-1600
Memento_EN.indb 1 22.01.2016 17:46:15
Statistical Data on Switzerland is an appealing and entertaining summary of the year's most important figures. With 52 pages in a practical A5/6 format, the publication is free of charge and available in five languages (German, French, Italian, Romansch and English).
The FSO online – www.statistics.admin.ch
The Swiss Statistics website offers you a modern, attractive and up-to-date gateway to all statistical information. We would like to draw your attention to the following popular offerings:
Publication database – publications offering further information Almost all publications published by the FSO are available in electronic form on the website free of charge. Print publications can be ordered by telephone on 058 463 60 60 or by emailing [email protected]. www.statistics.admin.ch R Look for statistics R Catalogues and Databases R Publications
NewsMail – always up to dateEmail subscriptions by topic with details and information on the latest findings and activities. www.news-stat.admin.ch
STAT-TAB – the interactive statistical databaseThe interactive statistical database offers simple and customis-able access to statistical results as well as the option of down-loads in various formats.www.stattab.bfs.admin.ch
Stat@tlas Switzerland – regional database and interactive maps
Atlas
With more than 3 000 interactive thematic maps, the Statistical Atlas of Switzerland gives you an up-to-date and permanently available overview of captivating regional issues covering all FSO topics. Available in German and French.www.statatlas-switzerland.admin.ch
SwissStats – statistics on the goSelected, popular digital publications for tablets with interactive content, available from the Apple App Store and the Google Play Store. The App is regularly updated and upgraded.
Individual inquires
The FSO's statistical information service058 463 60 11, [email protected]

The aim of this publication is to present in detail the results of the FSO’s tourism statistics and to provide a summarised overview of the tourism sector. The first section deals with the tourist accom-modation statistics (HESTA) and describes the main results for 2015. The second section concerns the 2014 survey on the travel behaviour of the Swiss population. The tourism satellite account’s annual indicators, in the third section, give information on the reference values for measuring the economic impact of tourism on Switzerland. The final, and fourth section, presents a series of economic indicators making it easier to contextualise the data.
Print format orders Tel. 058463 60 60Fax058463 60 [email protected]
Price CHF 15.– (VAT not incl.)
Downloadswww.statistics.admin.ch (free of charge)
FSO number 1074-1500
ISBN 978-3-303-10468-2
Statisticscounts for you.
www.statistics-counts.ch