swipp - user manual (v5.7) · 2017-10-29 · swipp user manual (version 5.7) october 2017. page...
TRANSCRIPT
SWIPP User Manual
(Version 5.7)
October 2017

Page left intentionally blank
Document Information
Date Version Updated by Changes
10/2015 5.1 Ron Minnema General changes to
Version 5.0
10/2015 5.2 Ron Minnema General changes to
Version 5.1 incorporating
feedback from GHD
11/2015 5.3 Ron Minnema General changes to
Version 5.2 following
SWIP work shops
01/2016 5.4 Ron Minnema Formula changes,
Appendix 1
08/2016 5.5 Ron Minnema Alterations to Appendix 2
07/2017 5.6 Ron Minnema General update
following the release of
the SWIPP 2017
update#1
10/2017 5.7 Ron Minnema BCR’s updated in
exercises 1 to 4

Page left intentionally blank
5
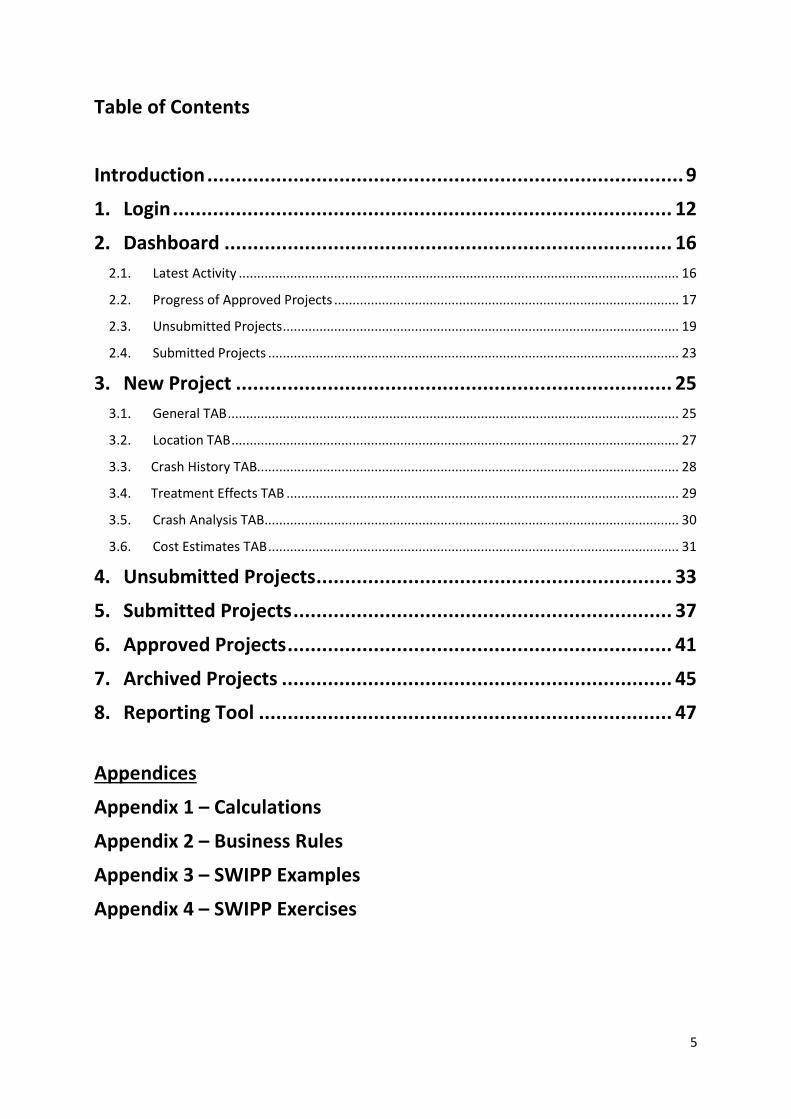
Table of Contents
Introduction ................................................................................... 9
1. Login ....................................................................................... 12
2. Dashboard .............................................................................. 16
2.1. Latest Activity ........................................................................................................................ 16
2.2. Progress of Approved Projects .............................................................................................. 17
2.3. Unsubmitted Projects ............................................................................................................ 19
2.4. Submitted Projects ................................................................................................................ 23
3. New Project ............................................................................ 25
3.1. General TAB ........................................................................................................................... 25
3.2. Location TAB .......................................................................................................................... 27
3.3. Crash History TAB................................................................................................................... 28
3.4. Treatment Effects TAB ........................................................................................................... 29
3.5. Crash Analysis TAB ................................................................................................................. 30
3.6. Cost Estimates TAB ................................................................................................................ 31
4. Unsubmitted Projects .............................................................. 33
5. Submitted Projects .................................................................. 37
6. Approved Projects ................................................................... 41
7. Archived Projects .................................................................... 45
8. Reporting Tool ........................................................................ 47
Appendices
Appendix 1 – Calculations
Appendix 2 – Business Rules
Appendix 3 – SWIPP Examples
Appendix 4 – SWIPP Exercises

6
Page left intentionally blank
7
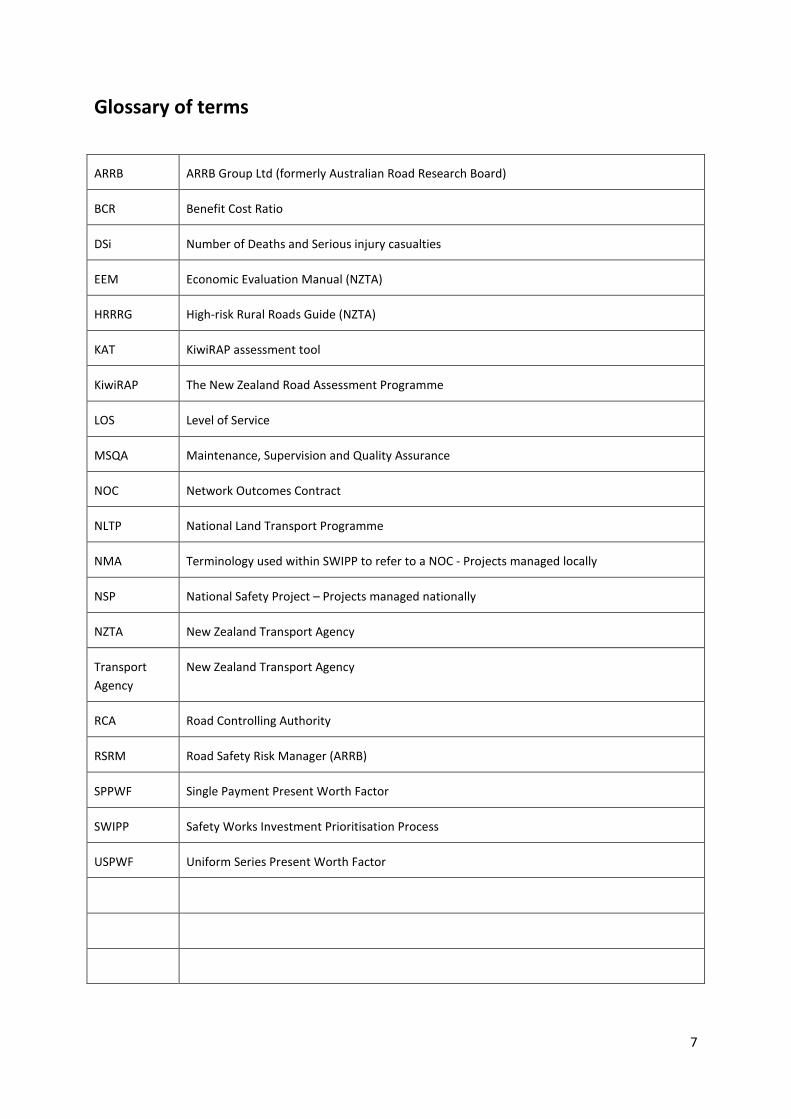
Glossary of terms
ARRB ARRB Group Ltd (formerly Australian Road Research Board)
BCR Benefit Cost Ratio
DSi Number of Deaths and Serious injury casualties
EEM Economic Evaluation Manual (NZTA)
HRRRG High-risk Rural Roads Guide (NZTA)
KAT KiwiRAP assessment tool
KiwiRAP The New Zealand Road Assessment Programme
LOS Level of Service
MSQA Maintenance, Supervision and Quality Assurance
NOC Network Outcomes Contract
NLTP National Land Transport Programme
NMA Terminology used within SWIPP to refer to a NOC - Projects managed locally
NSP National Safety Project – Projects managed nationally
NZTA New Zealand Transport Agency
Transport
Agency
New Zealand Transport Agency
RCA Road Controlling Authority
RSRM Road Safety Risk Manager (ARRB)
SPPWF Single Payment Present Worth Factor
SWIPP Safety Works Investment Prioritisation Process
USPWF Uniform Series Present Worth Factor

8
Page left intentionally blank
9
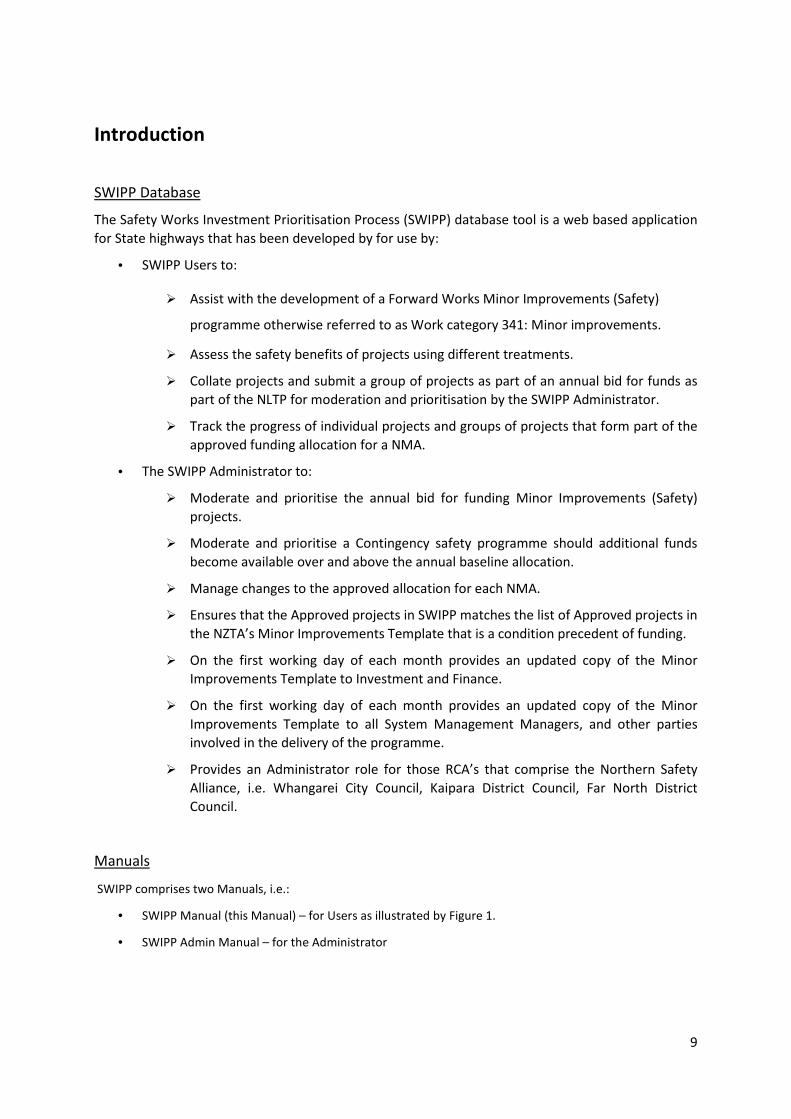
Introduction
SWIPP Database
The Safety Works Investment Prioritisation Process (SWIPP) database tool is a web based application
for State highways that has been developed by for use by:
• SWIPP Users to:
� Assist with the development of a Forward Works Minor Improvements (Safety)
programme otherwise referred to as Work category 341: Minor improvements.
� Assess the safety benefits of projects using different treatments.
� Collate projects and submit a group of projects as part of an annual bid for funds as
part of the NLTP for moderation and prioritisation by the SWIPP Administrator.
� Track the progress of individual projects and groups of projects that form part of the
approved funding allocation for a NMA.
• The SWIPP Administrator to:
� Moderate and prioritise the annual bid for funding Minor Improvements (Safety)
projects.
� Moderate and prioritise a Contingency safety programme should additional funds
become available over and above the annual baseline allocation.
� Manage changes to the approved allocation for each NMA.
� Ensures that the Approved projects in SWIPP matches the list of Approved projects in
the NZTA’s Minor Improvements Template that is a condition precedent of funding.
� On the first working day of each month provides an updated copy of the Minor
Improvements Template to Investment and Finance.
� On the first working day of each month provides an updated copy of the Minor
Improvements Template to all System Management Managers, and other parties
involved in the delivery of the programme.
� Provides an Administrator role for those RCA’s that comprise the Northern Safety
Alliance, i.e. Whangarei City Council, Kaipara District Council, Far North District
Council.
Manuals
SWIPP comprises two Manuals, i.e.:
• SWIPP Manual (this Manual) – for Users as illustrated by Figure 1.
• SWIPP Admin Manual – for the Administrator
10
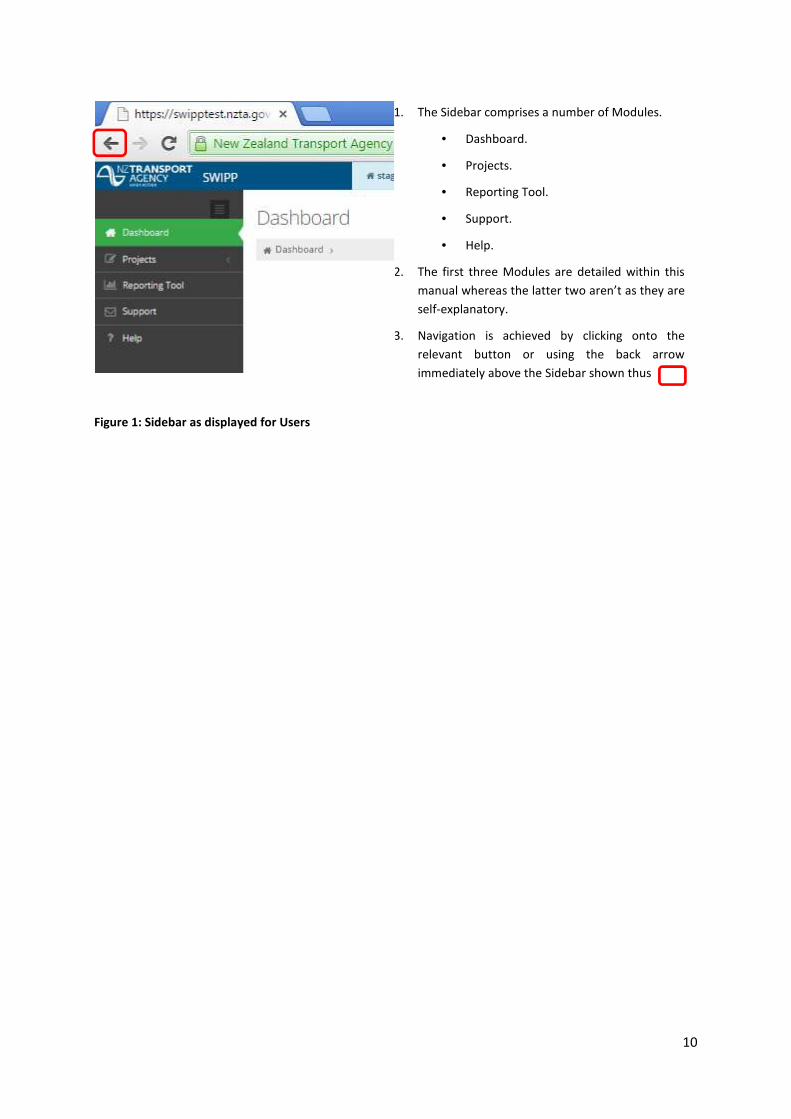
1. The Sidebar comprises a number of Modules.
• Dashboard.
• Projects.
• Reporting Tool.
• Support.
• Help.
2. The first three Modules are detailed within this
manual whereas the latter two aren’t as they are
self-explanatory.
3. Navigation is achieved by clicking onto the
relevant button or using the back arrow
immediately above the Sidebar shown thus
Figure 1: Sidebar as displayed for Users
11
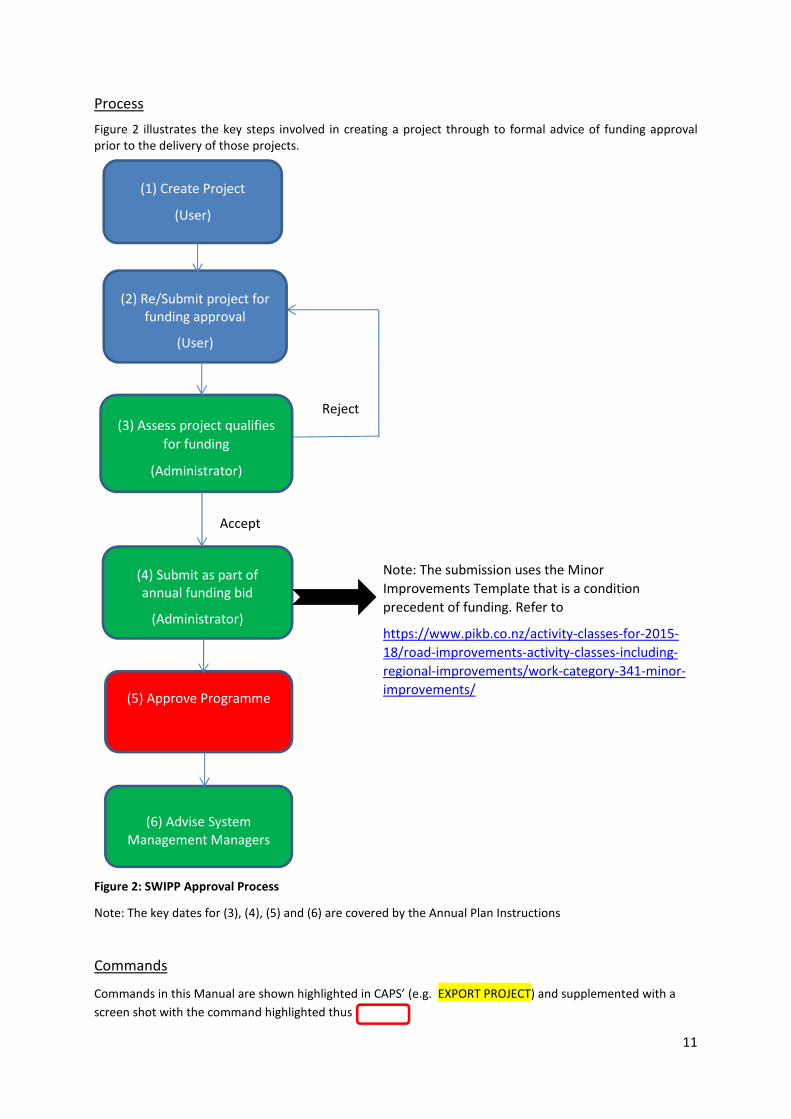
Process
Figure 2 illustrates the key steps involved in creating a project through to formal advice of funding approval
prior to the delivery of those projects.
Figure 2: SWIPP Approval Process
Note: The key dates for (3), (4), (5) and (6) are covered by the Annual Plan Instructions
Commands
Commands in this Manual are shown highlighted in CAPS’ (e.g. EXPORT PROJECT) and supplemented with a
screen shot with the command highlighted thus
(1) Create Project
(User)
Refer to Section 4
(2) Re/Submit project for
funding approval
(User)
(3) Assess project qualifies
for funding
(Administrator)
(4) Submit as part of
annual funding bid
(Administrator)
(5) Approve Programme
(P and I)
(6) Advise System
Management Managers
Reject
Accept
Note: The submission uses the Minor
Improvements Template that is a condition
precedent of funding. Refer to
https://www.pikb.co.nz/activity-classes-for-2015-
18/road-improvements-activity-classes-including-
regional-improvements/work-category-341-minor-
improvements/

12
Page left intentionally blank
13
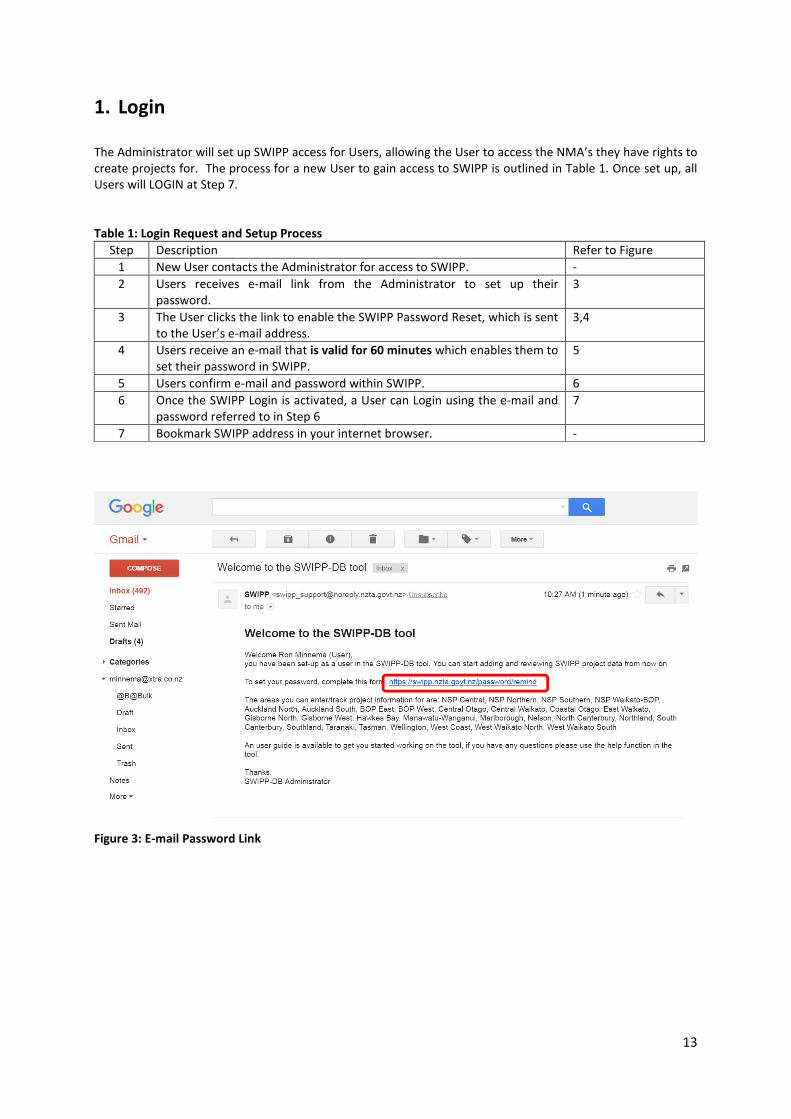
1. Login
The Administrator will set up SWIPP access for Users, allowing the User to access the NMA’s they have rights to
create projects for. The process for a new User to gain access to SWIPP is outlined in Table 1. Once set up, all
Users will LOGIN at Step 7.
Table 1: Login Request and Setup Process
Step Description Refer to Figure
1 New User contacts the Administrator for access to SWIPP. -
2 Users receives e-mail link from the Administrator to set up their
password.
3
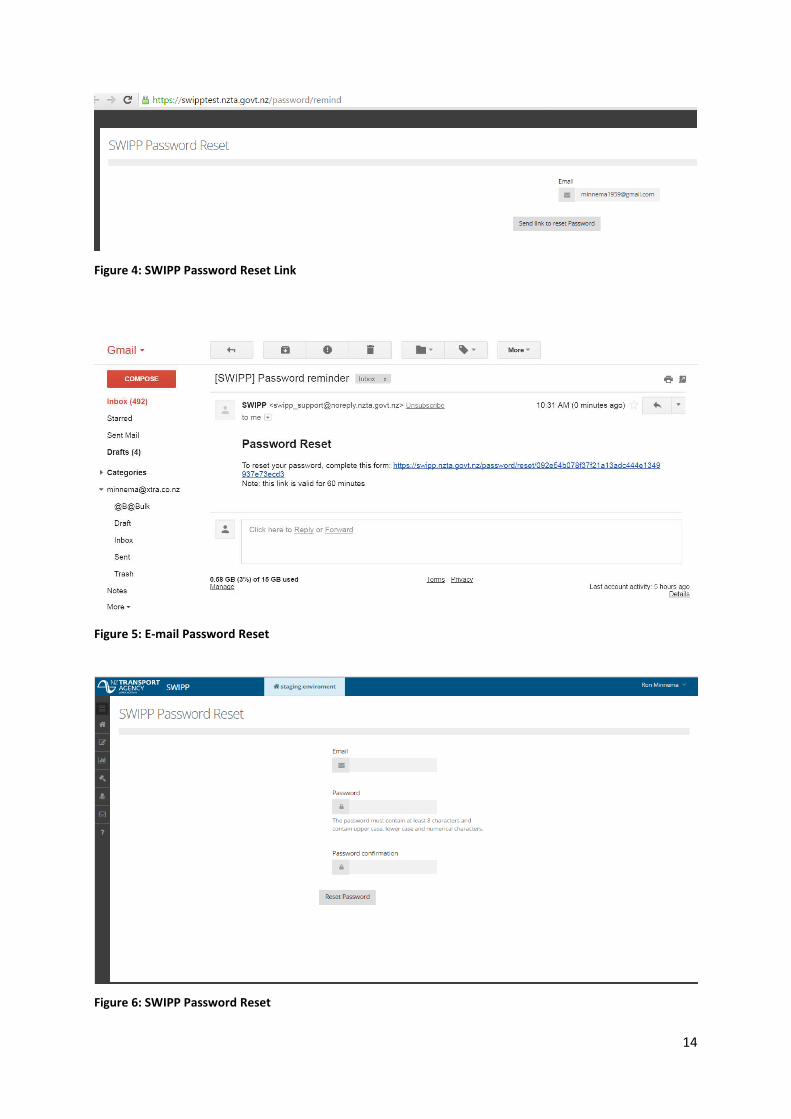
3 The User clicks the link to enable the SWIPP Password Reset, which is sent
to the User’s e-mail address.
3,4
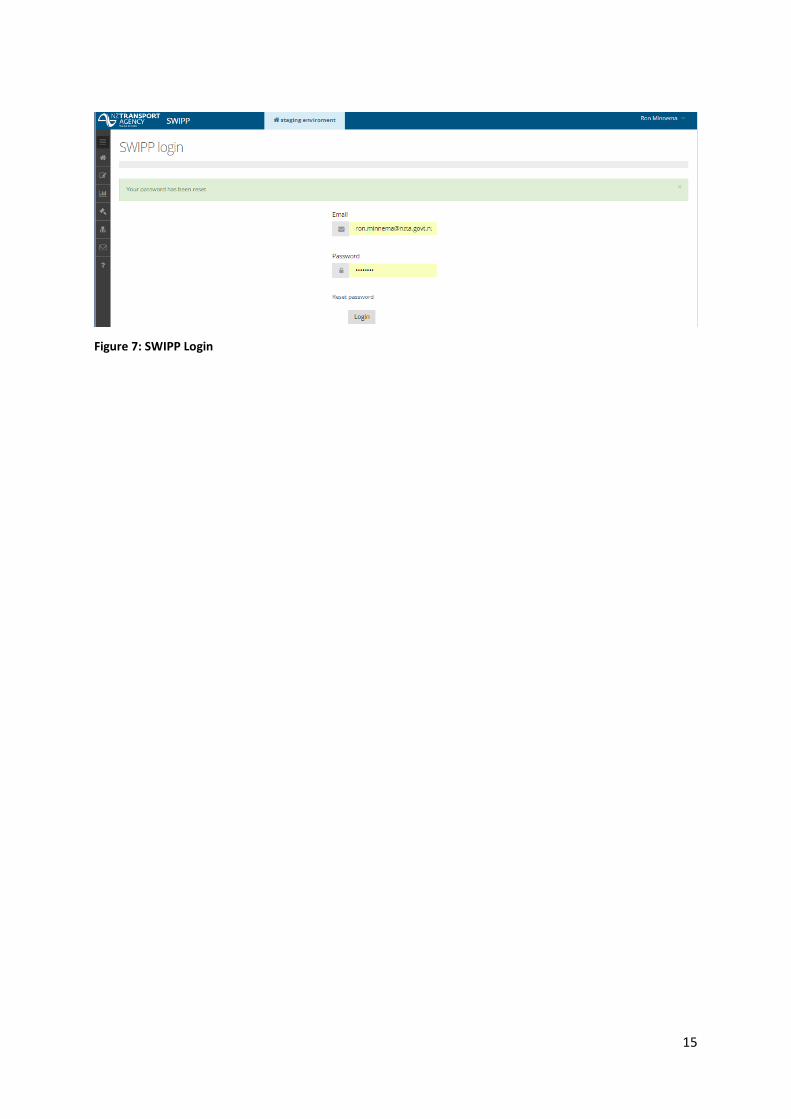
4 Users receive an e-mail that is valid for 60 minutes which enables them to
set their password in SWIPP.
5
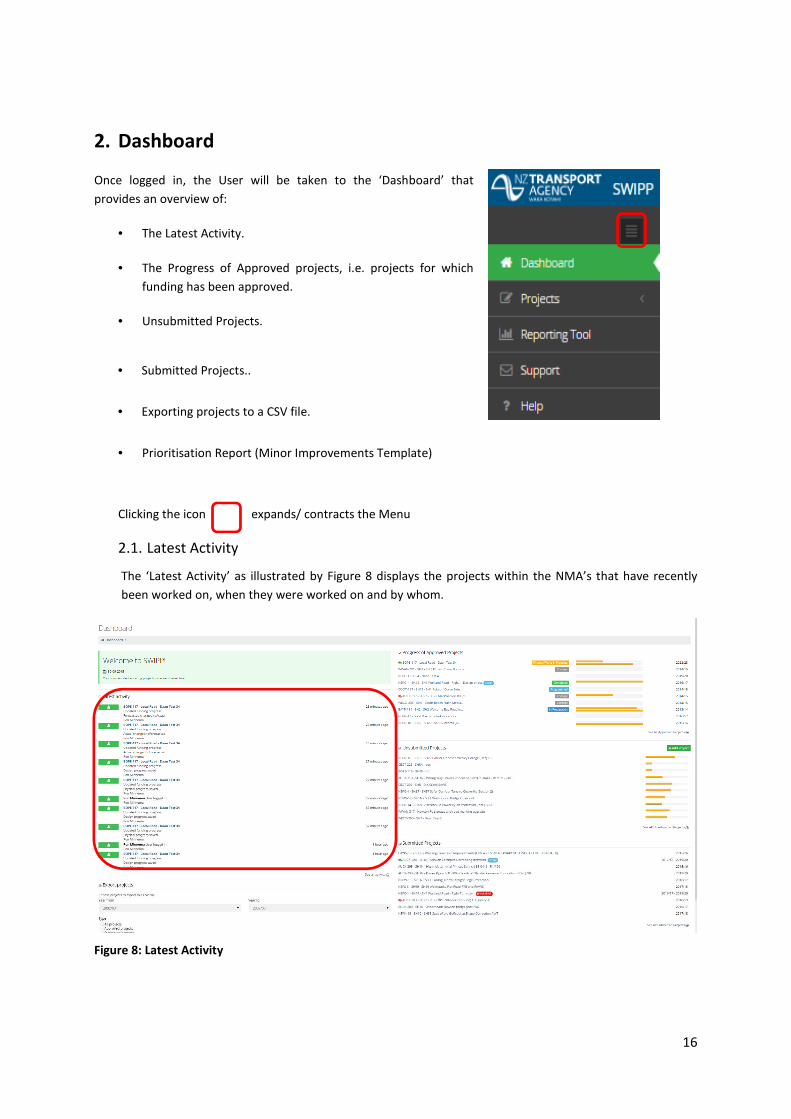
5 Users confirm e-mail and password within SWIPP. 6
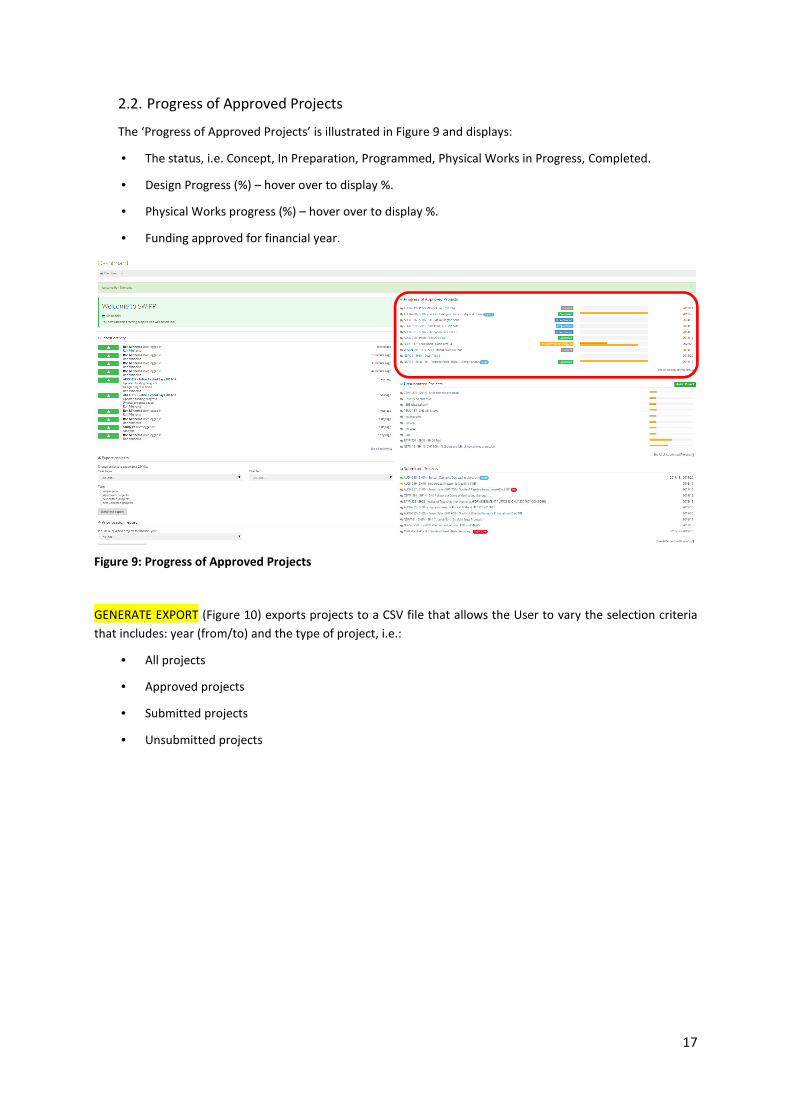
6 Once the SWIPP Login is activated, a User can Login using the e-mail and
password referred to in Step 6
7
7 Bookmark SWIPP address in your internet browser. -
Figure 3: E-mail Password Link
14
Figure 4: SWIPP Password Reset Link
Figure 5: E-mail Password Reset
Figure 6: SWIPP Password Reset
15
Figure 7: SWIPP Login
16
2. Dashboard
Once logged in, the User will be taken to the ‘Dashboard’ that
provides an overview of:
• The Latest Activity.
• The Progress of Approved projects, i.e. projects for which
funding has been approved.
• Unsubmitted Projects.
• Submitted Projects..
• Exporting projects to a CSV file.
• Prioritisation Report (Minor Improvements Template)
Clicking the icon expands/ contracts the Menu
2.1. Latest Activity
The ‘Latest Activity’ as illustrated by Figure 8 displays the projects within the NMA’s that have recently
been worked on, when they were worked on and by whom.
Figure 8: Latest Activity
17
2.2. Progress of Approved Projects
The ‘Progress of Approved Projects’ is illustrated in Figure 9 and displays:
• The status, i.e. Concept, In Preparation, Programmed, Physical Works in Progress, Completed.
• Design Progress (%) – hover over to display %.
• Physical Works progress (%) – hover over to display %.
• Funding approved for financial year.
Figure 9: Progress of Approved Projects
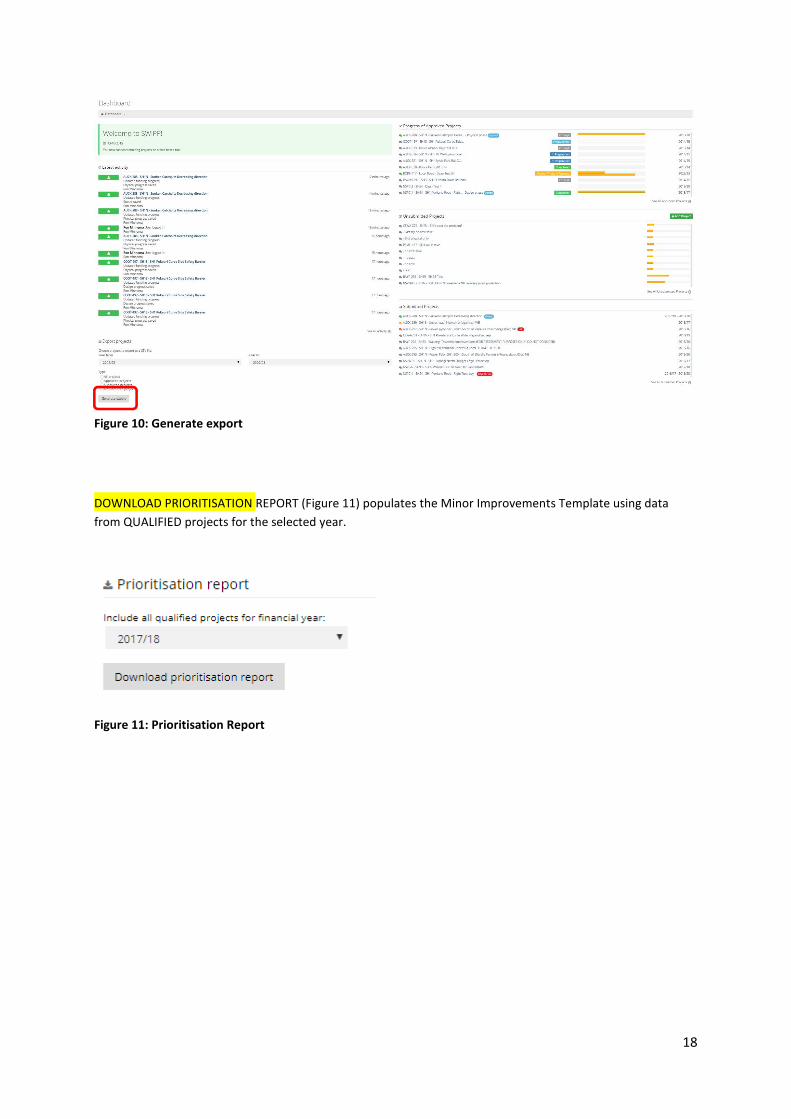
GENERATE EXPORT (Figure 10) exports projects to a CSV file that allows the User to vary the selection criteria
that includes: year (from/to) and the type of project, i.e.:
• All projects
• Approved projects
• Submitted projects
• Unsubmitted projects
18
Figure 10: Generate export
DOWNLOAD PRIORITISATION REPORT (Figure 11) populates the Minor Improvements Template using data
from QUALIFIED projects for the selected year.
Figure 11: Prioritisation Report
19
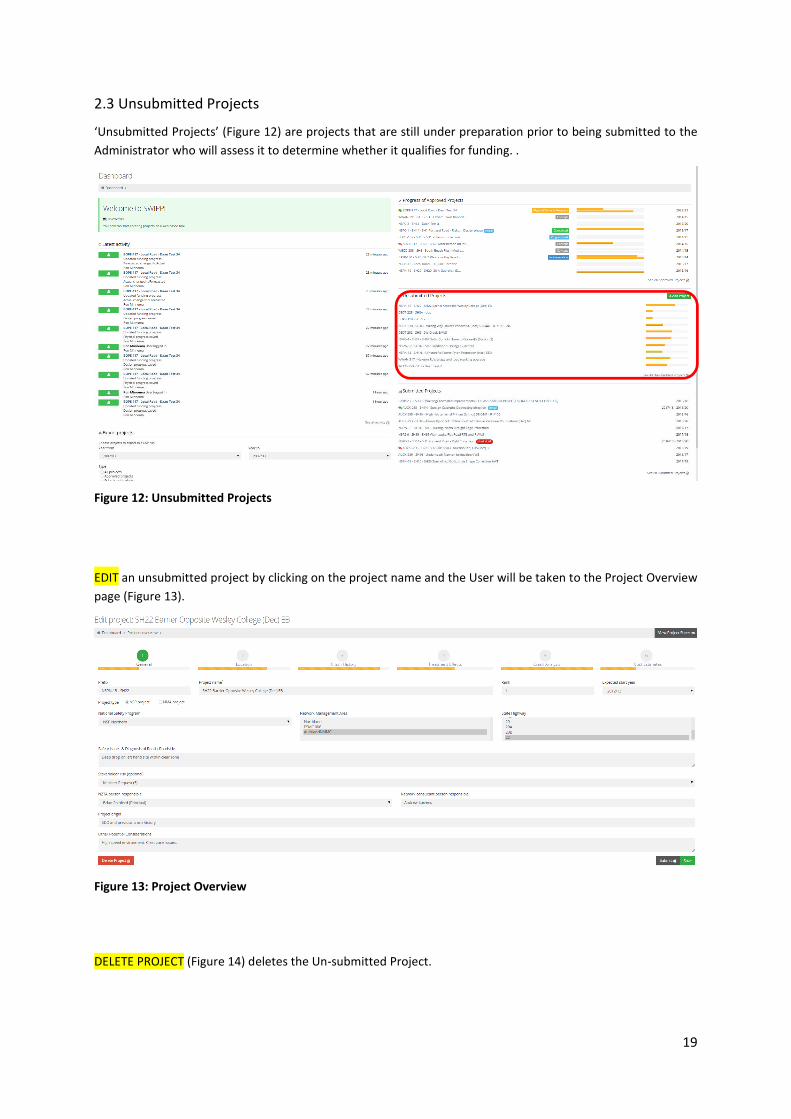
2.3 Unsubmitted Projects
‘Unsubmitted Projects’ (Figure 12) are projects that are still under preparation prior to being submitted to the
Administrator who will assess it to determine whether it qualifies for funding. .
Figure 12: Unsubmitted Projects
EDIT an unsubmitted project by clicking on the project name and the User will be taken to the Project Overview
page (Figure 13).
Figure 13: Project Overview
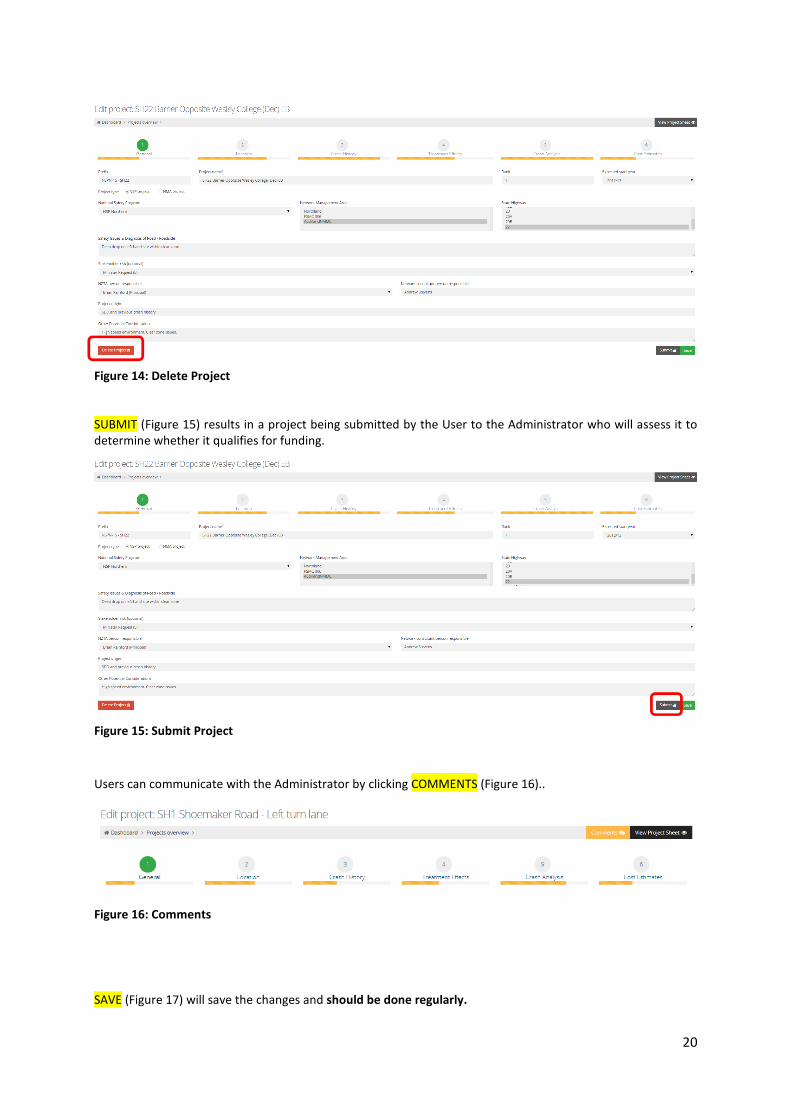
DELETE PROJECT (Figure 14) deletes the Un-submitted Project.
20
Figure 14: Delete Project
SUBMIT (Figure 15) results in a project being submitted by the User to the Administrator who will assess it to
determine whether it qualifies for funding.
Figure 15: Submit Project
Users can communicate with the Administrator by clicking COMMENTS (Figure 16)..
Figure 16: Comments
SAVE (Figure 17) will save the changes and should be done regularly.

21
Figure 17: Save Project
To copy a project first View the Project Sheet (Figure 18).
Figure 18: View Project Sheet
Then select COPY (Figure 19) will copy a project so that only the fields that need changing will need to be
populated. This is especially useful when:
• Copying a project from another NMA .
• Creating numerous generic projects.
Figure 19: Copy Project
22
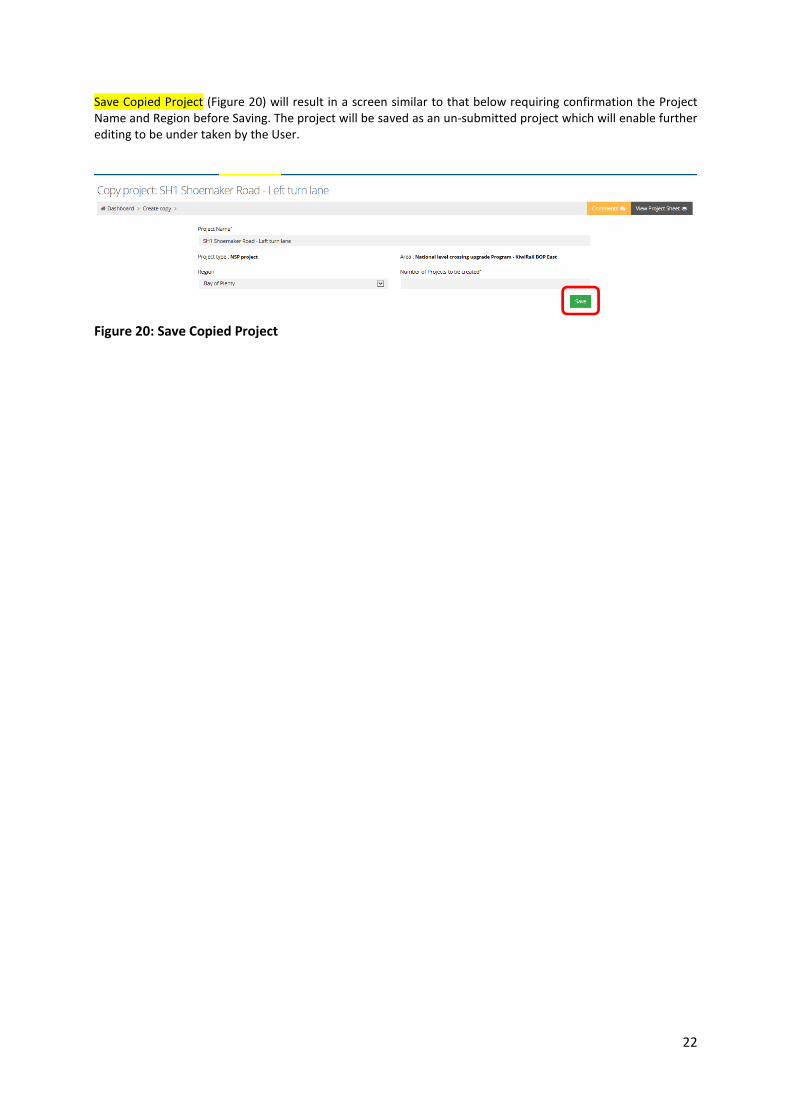
Save Copied Project (Figure 20) will result in a screen similar to that below requiring confirmation the Project
Name and Region before Saving. The project will be saved as an un-submitted project which will enable further
editing to be under taken by the User.
Figure 20: Save Copied Project

23
2.4 Submitted Projects
‘Submitted Projects’ (Figure 21) are projects that have been submitted to the Administrator to assess whether
they qualify for funding. Once the project has been submitted it cannot be edited.
Figure 21: Submitted Projects
VIEW details of the project by clicking on the project name as for Un-submitted Projects.
REQUEST IMMEDIATE APPROVAL (Figure 22) allows the User to request immediate funding approval for urgent
projects which will result in a SWIPP system generated e-mail being sent to the Administrator.
Figure 22: Request Immediate Approval

24
Page left intentionally blank
25
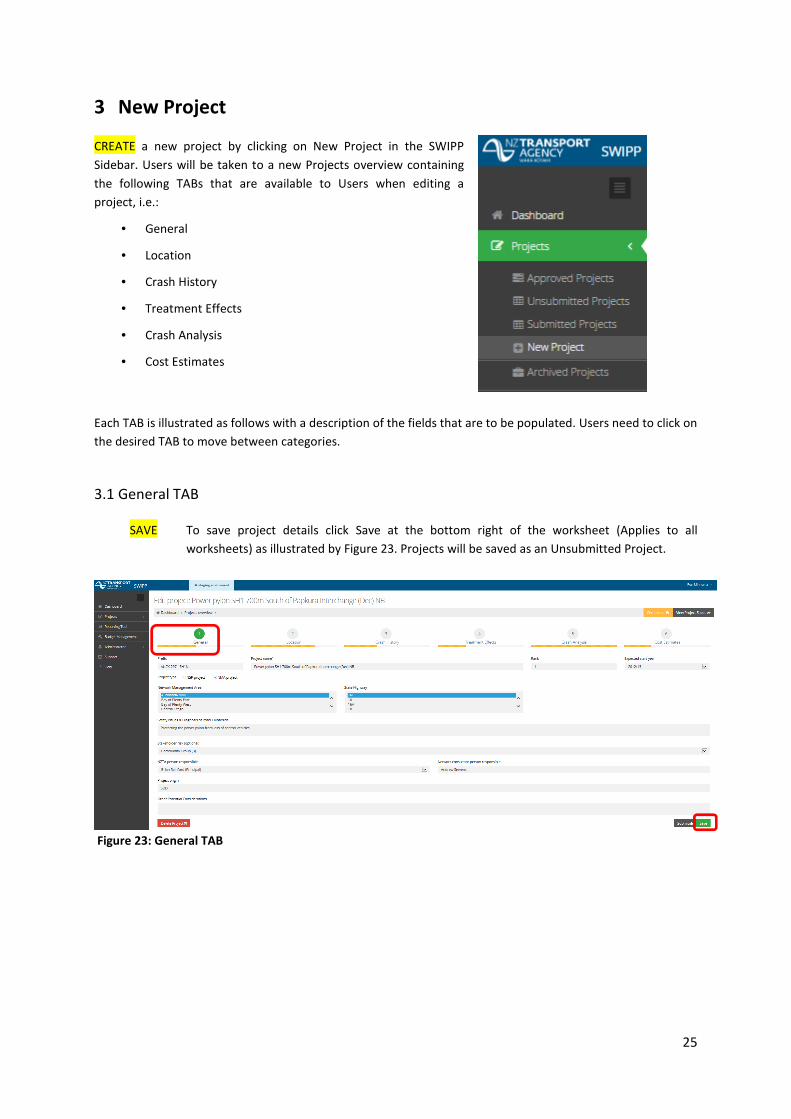
3 New Project
CREATE a new project by clicking on New Project in the SWIPP
Sidebar. Users will be taken to a new Projects overview containing
the following TABs that are available to Users when editing a
project, i.e.:
• General
• Location
• Crash History
• Treatment Effects
• Crash Analysis
• Cost Estimates
Each TAB is illustrated as follows with a description of the fields that are to be populated. Users need to click on
the desired TAB to move between categories.
3.1 General TAB
SAVE
To save project details click Save at the bottom right of the worksheet (Applies to all
worksheets) as illustrated by Figure 23. Projects will be saved as an Unsubmitted Project.
Figure 23: General TAB
26
Notes:
Prefix
This is an auto generated prefix that will identify the project. The prefix will appear after you have saved
your entry for the first time. It consists of the code of the selected NSP or NMA, a unique project number
for that area, and the selected State Highway.
Project Name The name of the project should be modelled on the examples (right click cell) to ensure compliance with
the Annual Plan Instructions.
Rank The local rank should only be given to those projects where the DSI provided does not support the risk. It is
expected that in any bid for funding, there may be no more than three projects that are ranked using this
method. In many bids no projects will be ranked using ‘Rank’.
Expected Start Year The year for which funding is being requested.
NSP Project National Safety Project – Projects managed nationally
NMA Project User selects the NMA where the project resides - Projects managed locally
State Highway Select which State Highway the project is located on. The list only shows the State highways for the
selected NMA. There is also the option to choose Local Road for when the Transport Agency is working
with an RCA to resolve a significant safety issue.
Region RTC Region automatically selected based on NMA. Can be over written.
Safety Issues &
Diagnosis of
Road/Roadside
A brief description of the issues at the project location.
Stakeholder risk
(optional)
Description of the concerns that underlie the project that can be left blank.
NZTA people
responsible
The Transport Agency staff responsible for the project who will all receive all communications from SWIPP
and the Administrator via e-mail
Network Consultant
person responsible
The Network Consultant responsible for the project.
Project Origin A brief description of the projects origin, .e.g. Crash Reduction Study.
Other Potential
Considerations
Describe any other options considered and discarded and any Design Departures from recognised safety
standards for OIA purposes, e.g. WRB installed at back of footpath as narrowness of foopath makes it
impractical to construct immediately behind kerb.
27
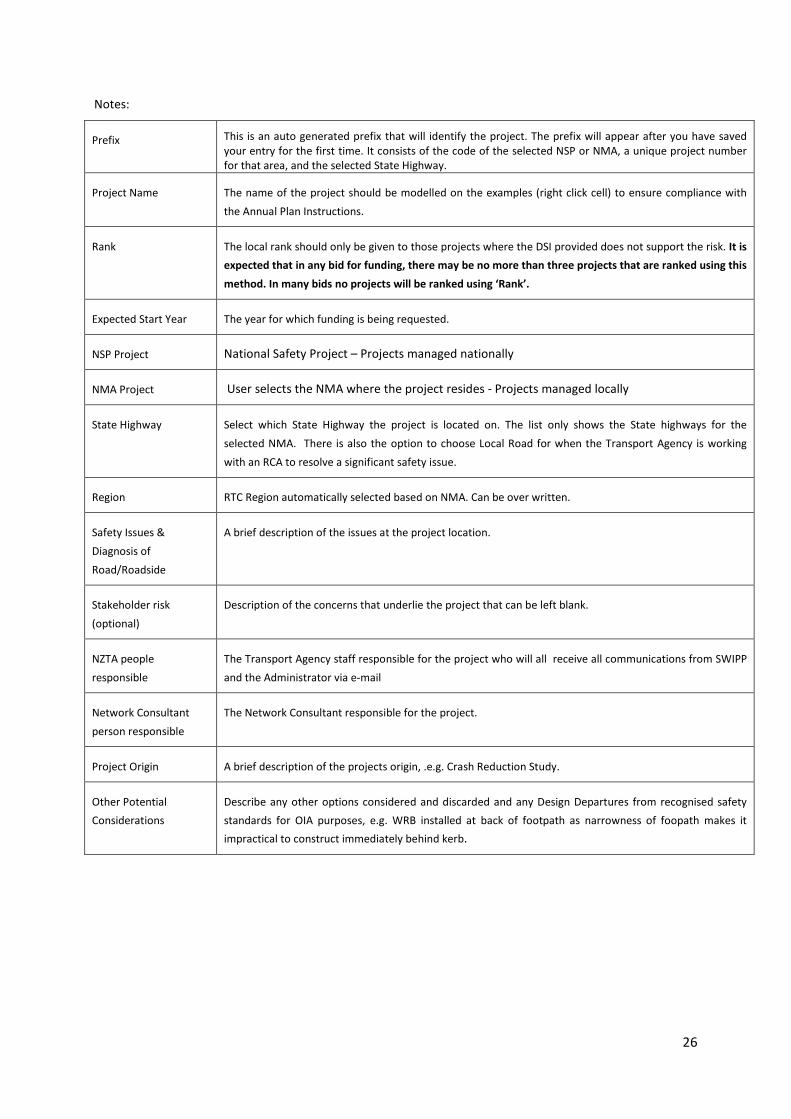
3.2 Location TAB
Figure 24: Location TAB
Notes:
Location road type Midblock or intersection
Start/ End RS/ RP The extent of the State highway project defined by Route Position
Location length (km) This is the manually calculated distance that the physical works will influence
a reduction in risk and is used to calculate the Actual (Existing) DSi per
kilometre per year (Appendix 1). E.g. the extent of the State highway project
may be 0.5km, but the Location length may be 1km.
Manage project images The user has the option to upload pictures illustrating the safety issues at the
project location.
Detailed location description Additional text description if required to supplement the Start/End RS/RP
Environment Select either Motorway, Rural, or Urban from the drop down menu. These
fields and associated costs are used to calculate the BCR.
One Network Road
classification
Select One Network road classification from the drop down menu.
Posted speed limit Select from the drop down menu. Note that 100 km/h is the default.
AADT Annual Average daily traffic.
Year measured Year that the AADT was measured.
Count station Describe Count Station where AADT was measured, e.g. ID:02900034
28
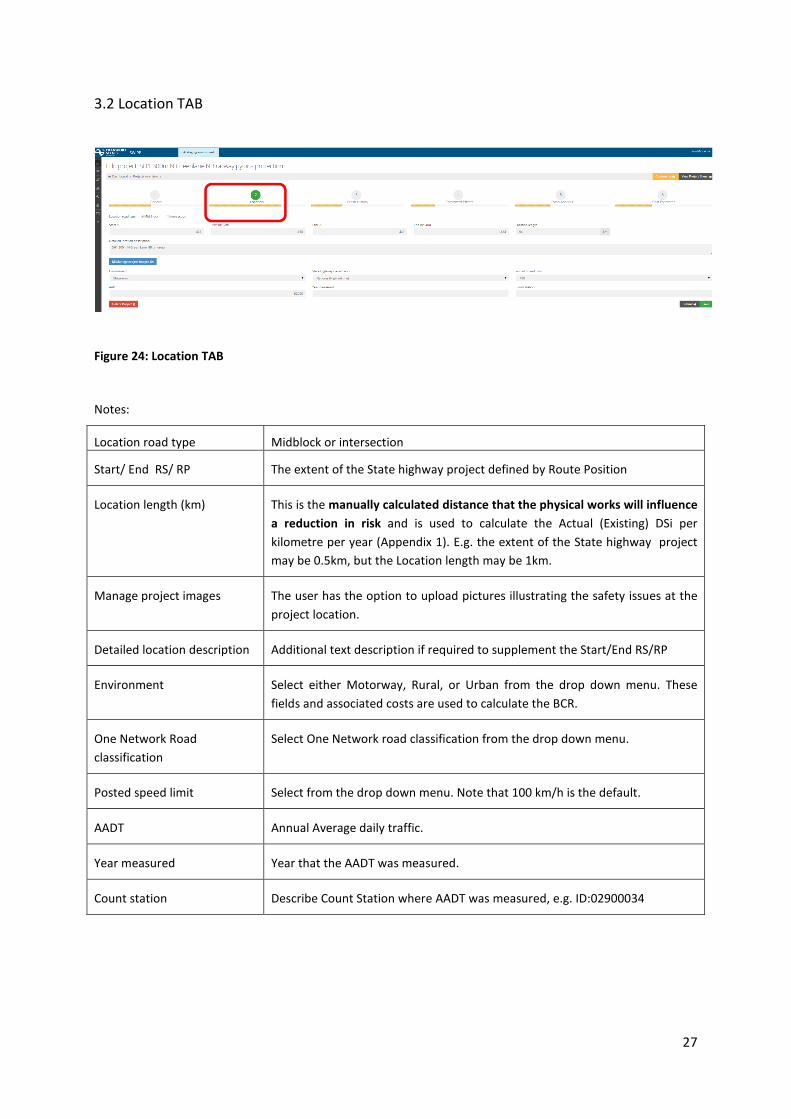
3.3 Crash History
Crash history period
The period you are entering crash data for. This can be either 5 or 10 years. Based on the AADT a message will
be shown “If AADT is less than 5000 it is advised to use a 10 year period for the crash history”. This is an advise,
the user may still choose to use a different number of years for the crash period.
Latest crash data year used
The last year of the 5 or 10 year period you are entering crash data for.
Figure 25: Crash History TAB
Notes:
Enter crash statistics into the table provided (the sum of the Run-Off Road, Head-On, and Intersection crashes
cannot be greater than the total)
• Description of
crash
characteristics
Details around the type and cause of crashes at the project location, particularly
looking at significant trends or the key issues.
• CALCULATE
DSi per kilometre
per year
Calculates the Di per kilometre per year using ‘All crashes’.
For equation refer to Appendix 1
If a parameter is missing an error message will be displayed highlighting the missing
value, e.g.
• CALCULATE
Pre-treatment
Crash Social Cost
($ per year)
Calculates the Pre-treatment Crash Social Cost per year taking into account the
Environment, Posted Speed Limit, FSMNI costs.
For equation refer to Appendix 1
29
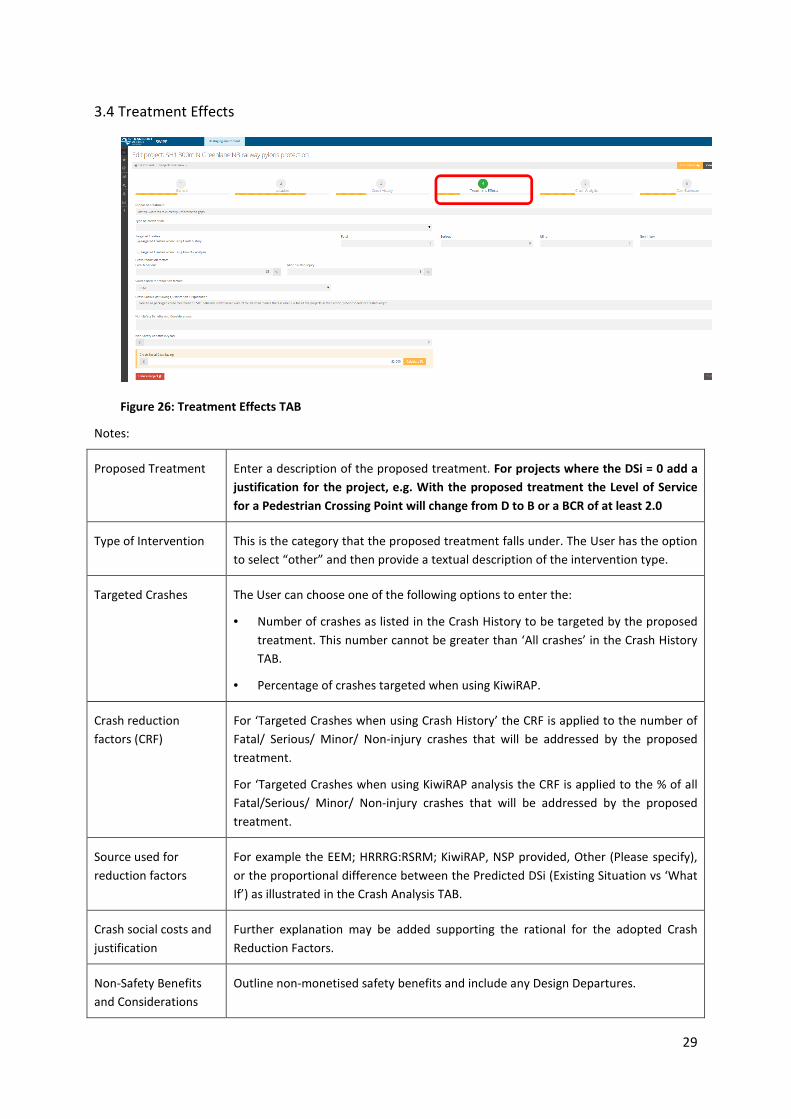
3.4 Treatment Effects
Figure 26: Treatment Effects TAB
Notes:
Proposed Treatment Enter a description of the proposed treatment. For projects where the DSi = 0 add a
justification for the project, e.g. With the proposed treatment the Level of Service
for a Pedestrian Crossing Point will change from D to B or a BCR of at least 2.0
Type of Intervention This is the category that the proposed treatment falls under. The User has the option
to select “other” and then provide a textual description of the intervention type.
Targeted Crashes
The User can choose one of the following options to enter the:
• Number of crashes as listed in the Crash History to be targeted by the proposed
treatment. This number cannot be greater than ‘All crashes’ in the Crash History
TAB.
• Percentage of crashes targeted when using KiwiRAP.
Crash reduction
factors (CRF)
For ‘Targeted Crashes when using Crash History’ the CRF is applied to the number of
Fatal/ Serious/ Minor/ Non-injury crashes that will be addressed by the proposed
treatment.
For ‘Targeted Crashes when using KiwiRAP analysis the CRF is applied to the % of all
Fatal/Serious/ Minor/ Non-injury crashes that will be addressed by the proposed
treatment.
Source used for
reduction factors
For example the EEM; HRRRG:RSRM; KiwiRAP, NSP provided, Other (Please specify),
or the proportional difference between the Predicted DSi (Existing Situation vs ‘What
If’) as illustrated in the Crash Analysis TAB.
Crash social costs and
justification
Further explanation may be added supporting the rational for the adopted Crash
Reduction Factors.
Non-Safety Benefits
and Considerations
Outline non-monetised safety benefits and include any Design Departures.
30
Administrator
comments and
recommendation
The Administrator may provide comments here supporting the decision to fund a
project. This field is exported to the Notes Column in the Minor Improvements
Template. This field can be viewed by Users but not over written.
Non-Safety Benefits
($/year)
As stated
CALCULATE Crash
Social Cost Saving
To ensure that the Pre-treatment Crash Social Cost per year is calculated click
Calculate. This needs to be done to update the BCR ratio and will be automated in the
next update of SWIPPDB.
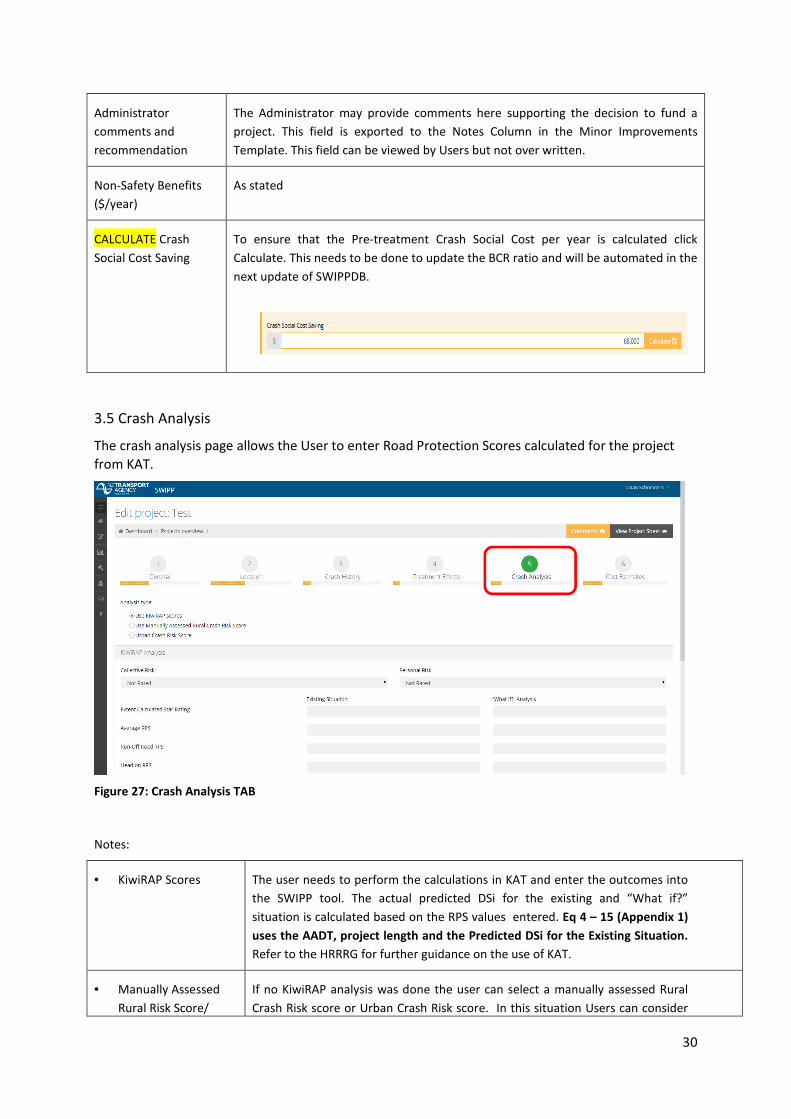
3.5 Crash Analysis
The crash analysis page allows the User to enter Road Protection Scores calculated for the project
from KAT.
Figure 27: Crash Analysis TAB
Notes:
• KiwiRAP Scores The user needs to perform the calculations in KAT and enter the outcomes into
the SWIPP tool. The actual predicted DSi for the existing and “What if?”
situation is calculated based on the RPS values entered. Eq 4 – 15 (Appendix 1)
uses the AADT, project length and the Predicted DSi for the Existing Situation.
Refer to the HRRRG for further guidance on the use of KAT.
• Manually Assessed
Rural Risk Score/
If no KiwiRAP analysis was done the user can select a manually assessed Rural
Crash Risk score or Urban Crash Risk score. In this situation Users can consider
31
Urban Crash Risk
Score
submitting a project using alternative risk metrics such as a Benefit Cost Ratio
that is typically used for low costs projects or for example ‘With the installation
of the Pedestrian Refuge the LOS with reduce from D to B’. These scores have
no effect on the DSI saved/10 years/ $100m spent and may be removed in
future updates of SWIPP.
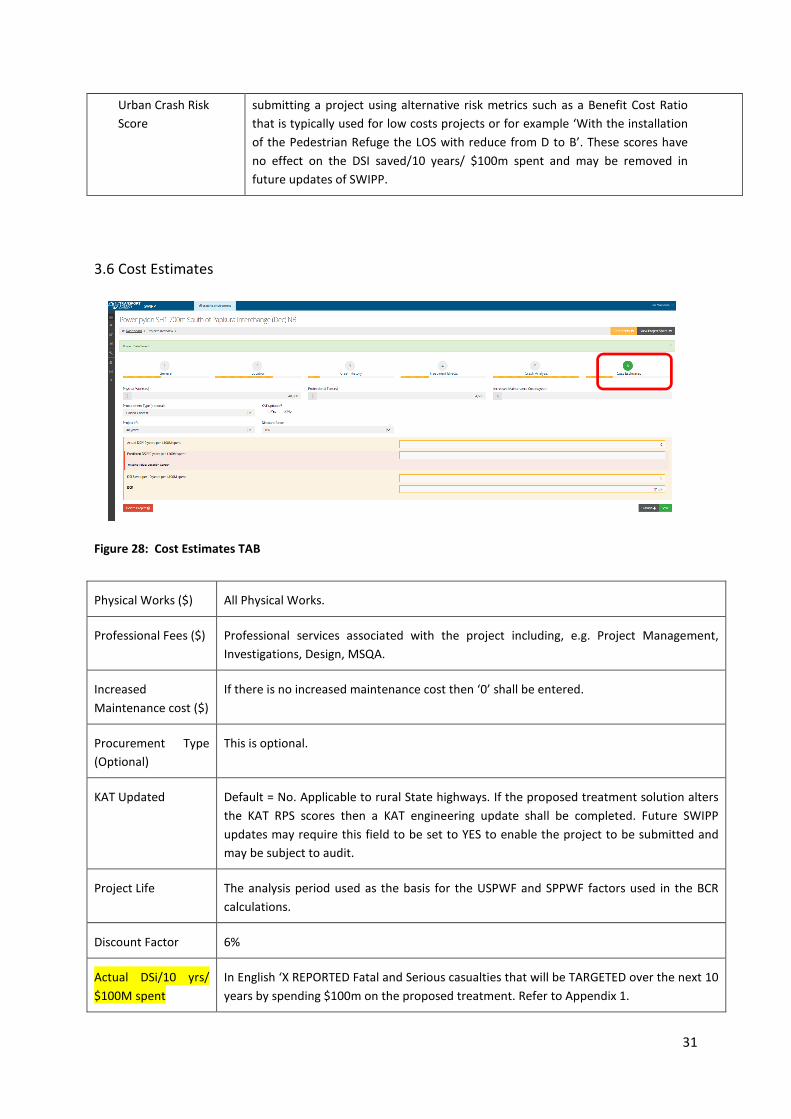
3.6 Cost Estimates
Figure 28: Cost Estimates TAB
Physical Works ($) All Physical Works.
Professional Fees ($) Professional services associated with the project including, e.g. Project Management,
Investigations, Design, MSQA.
Increased
Maintenance cost ($)
If there is no increased maintenance cost then ‘0’ shall be entered.
Procurement Type
(Optional)
This is optional.
KAT Updated Default = No. Applicable to rural State highways. If the proposed treatment solution alters
the KAT RPS scores then a KAT engineering update shall be completed. Future SWIPP
updates may require this field to be set to YES to enable the project to be submitted and
may be subject to audit.
Project Life The analysis period used as the basis for the USPWF and SPPWF factors used in the BCR
calculations.
Discount Factor 6%
Actual DSi/10 yrs/
$100M spent
In English ‘X REPORTED Fatal and Serious casualties that will be TARGETED over the next 10
years by spending $100m on the proposed treatment. Refer to Appendix 1.

32
Predicted DSi/10 yrs/
$100M spent
In English ‘X PREDICTED Fatal and Serious casualties that will be TARGETED over the next
10 years by spending $100m on the proposed treatment. Refer to Appendix 1.
DSi Saved/10 yrs/
$100M spent
In English ‘X Fatal and Serious casualties that will be SAVED over the next 10 years by
spending $100m on the proposed treatment and is the metric that is used by National
Office for PRIORITISING projects. Refer to Appendix 1.
BCR Benefit Cost Ratio, and is automatically calculated. Refer to Appendix 1. BCR changes only
when the Project Life Period and the Increased Maintenance Costs are populated.
33
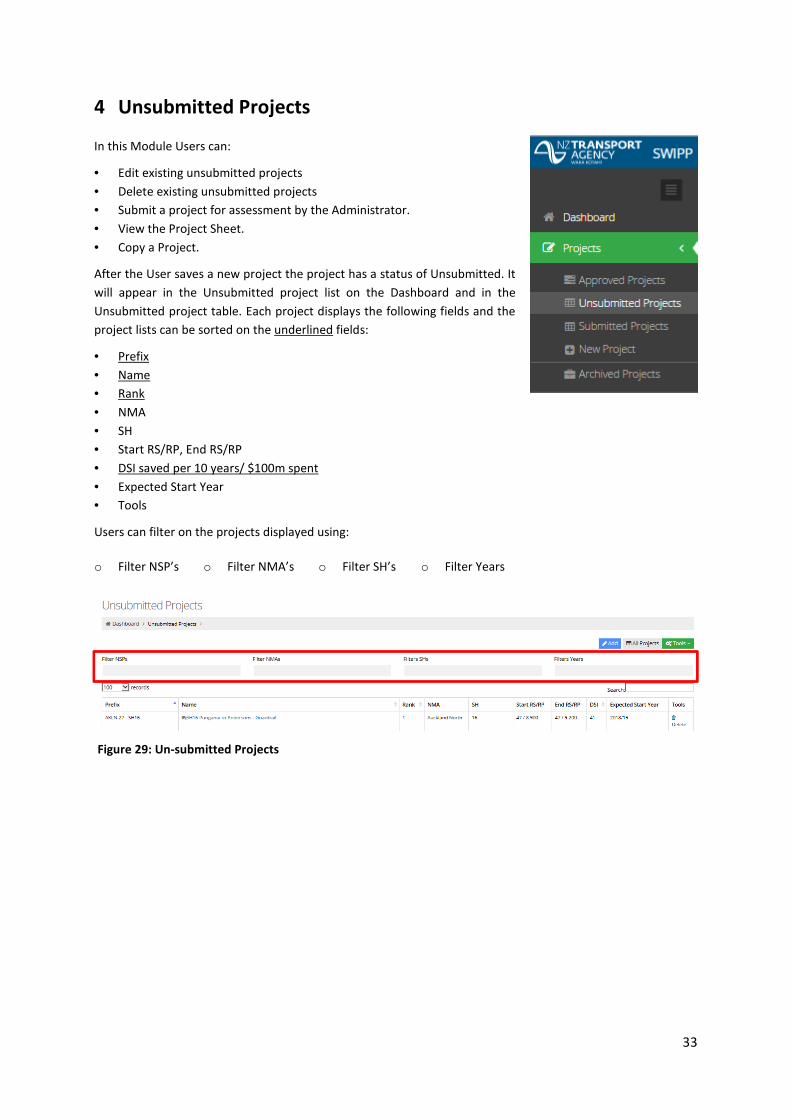
4 Unsubmitted Projects
In this Module Users can:
• Edit existing unsubmitted projects
• Delete existing unsubmitted projects
• Submit a project for assessment by the Administrator.
• View the Project Sheet.
• Copy a Project.
After the User saves a new project the project has a status of Unsubmitted. It
will appear in the Unsubmitted project list on the Dashboard and in the
Unsubmitted project table. Each project displays the following fields and the
project lists can be sorted on the underlined fields:
• Prefix
• Name
• Rank
• NMA
• SH
• Start RS/RP, End RS/RP
• DSI saved per 10 years/ $100m spent
• Expected Start Year
• Tools
Users can filter on the projects displayed using:
o Filter NSP’s o Filter NMA’s o Filter SH’s o Filter Years
Figure 29: Un-submitted Projects
34
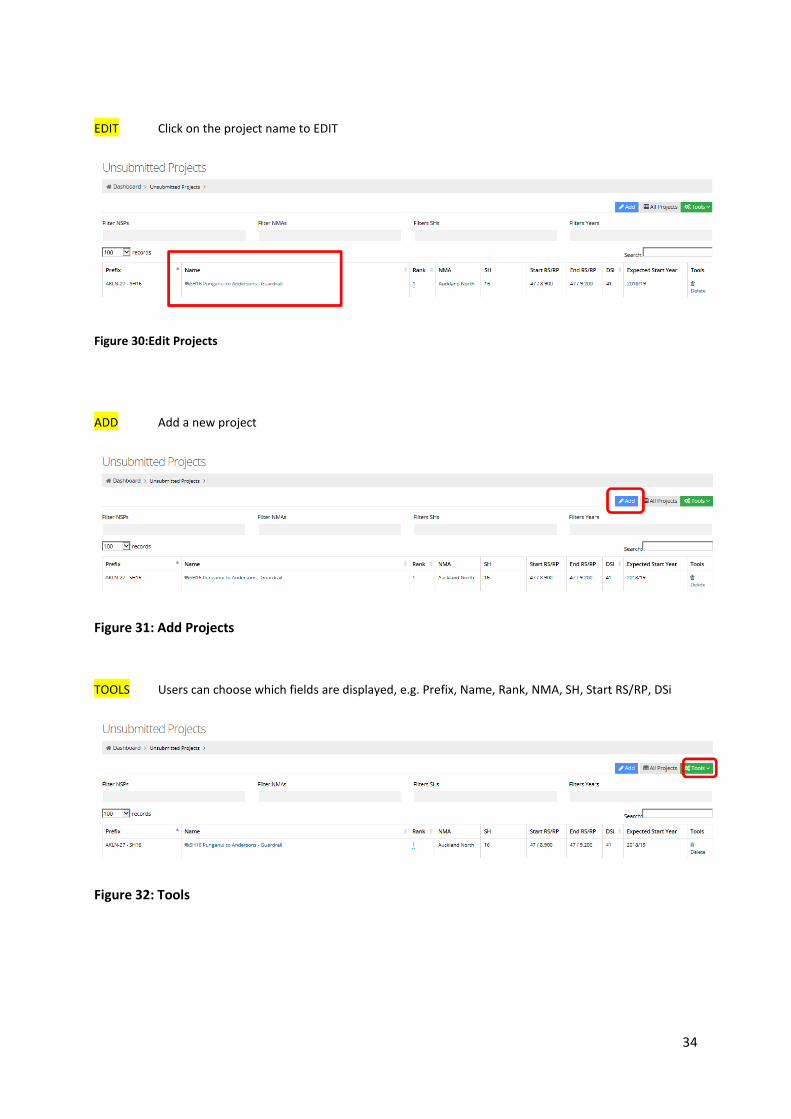
EDIT Click on the project name to EDIT
Figure 30:Edit Projects
ADD Add a new project
Figure 31: Add Projects
TOOLS Users can choose which fields are displayed, e.g. Prefix, Name, Rank, NMA, SH, Start RS/RP, DSi
Figure 32: Tools
35
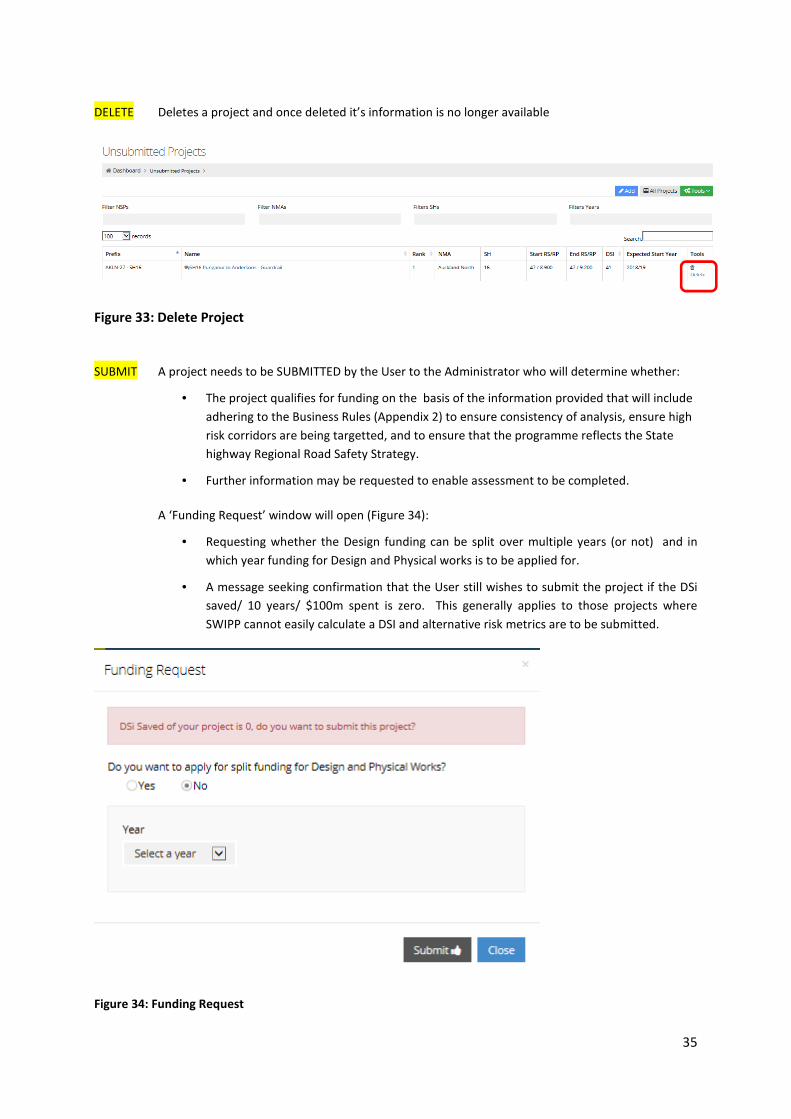
DELETE Deletes a project and once deleted it’s information is no longer available
Figure 33: Delete Project
SUBMIT
A project needs to be SUBMITTED by the User to the Administrator who will determine whether:
• The project qualifies for funding on the basis of the information provided that will include
adhering to the Business Rules (Appendix 2) to ensure consistency of analysis, ensure high
risk corridors are being targetted, and to ensure that the programme reflects the State
highway Regional Road Safety Strategy.
• Further information may be requested to enable assessment to be completed.
A ‘Funding Request’ window will open (Figure 34):
• Requesting whether the Design funding can be split over multiple years (or not) and in
which year funding for Design and Physical works is to be applied for.
• A message seeking confirmation that the User still wishes to submit the project if the DSi
saved/ 10 years/ $100m spent is zero. This generally applies to those projects where
SWIPP cannot easily calculate a DSI and alternative risk metrics are to be submitted.
Figure 34: Funding Request
36
The minimum required information in order to SUBMIT a project are the fields that are required to
populate the Minor Improvements Template, i.e.:
• Project Name • Start/ End RS and RP’s
• NMA • One Network Road classification
• State Highway • Proposed Treatment
• Region • Type of Intervention
• Safety Issues & Diagnosis of Road / Roadside • Physical works ($)
• Project Origin • Professional fees ($)
At any time prior to the Administrator qualifying the project for funding the User can UNSUBMIT the project to
make changes and then resubmit.
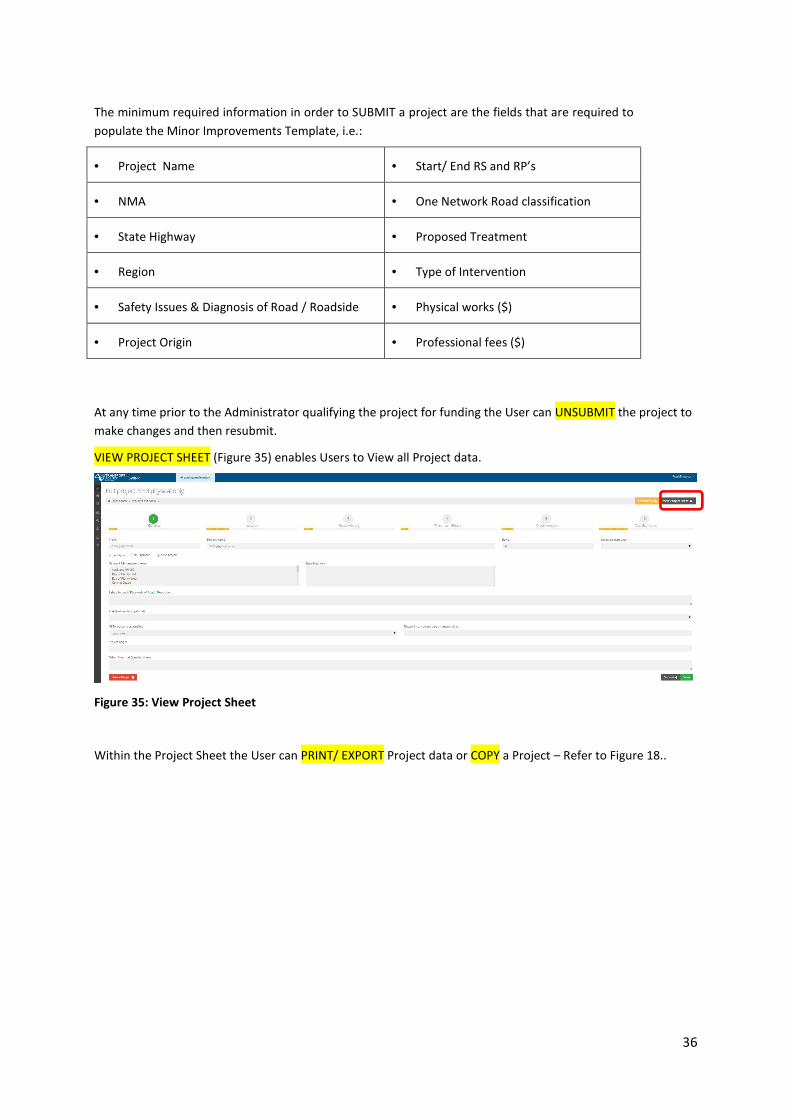
VIEW PROJECT SHEET (Figure 35) enables Users to View all Project data.
Figure 35: View Project Sheet
Within the Project Sheet the User can PRINT/ EXPORT Project data or COPY a Project – Refer to Figure 18..
37
5 Submitted Projects
In this Module Users can :
• View projects a projects status, i.e.:
o Submitted – Non qualified.
o Submitted - Qualified.
• Un-submit projects
• Print the Project Sheets.
• Copy a Project
• Request Immediate Funding Approval
After a project has been submitted, it will become a Submitted Project. It will
appear in the Submitted project list on the Dashboard and cannot be edited.
Projects are displayed as for Un-Submitted projects.
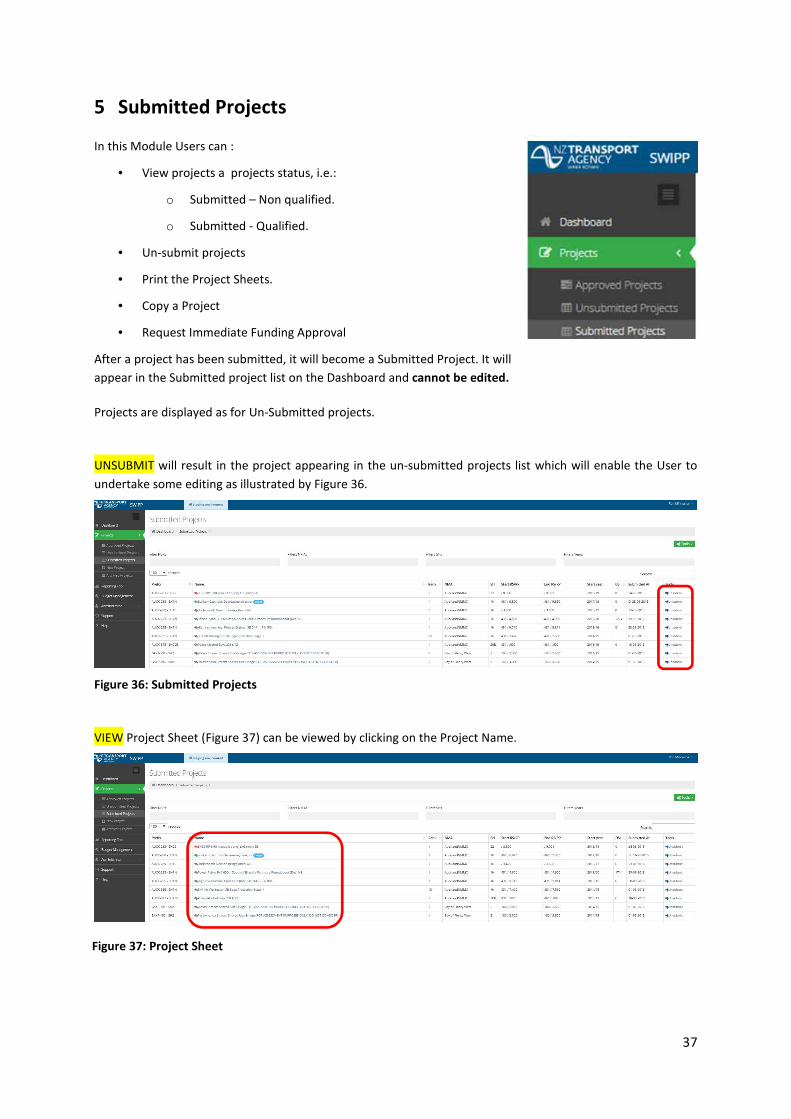
UNSUBMIT will result in the project appearing in the un-submitted projects list which will enable the User to
undertake some editing as illustrated by Figure 36.
Figure 36: Submitted Projects
VIEW Project Sheet (Figure 37) can be viewed by clicking on the Project Name.
Figure 37: Project Sheet
38
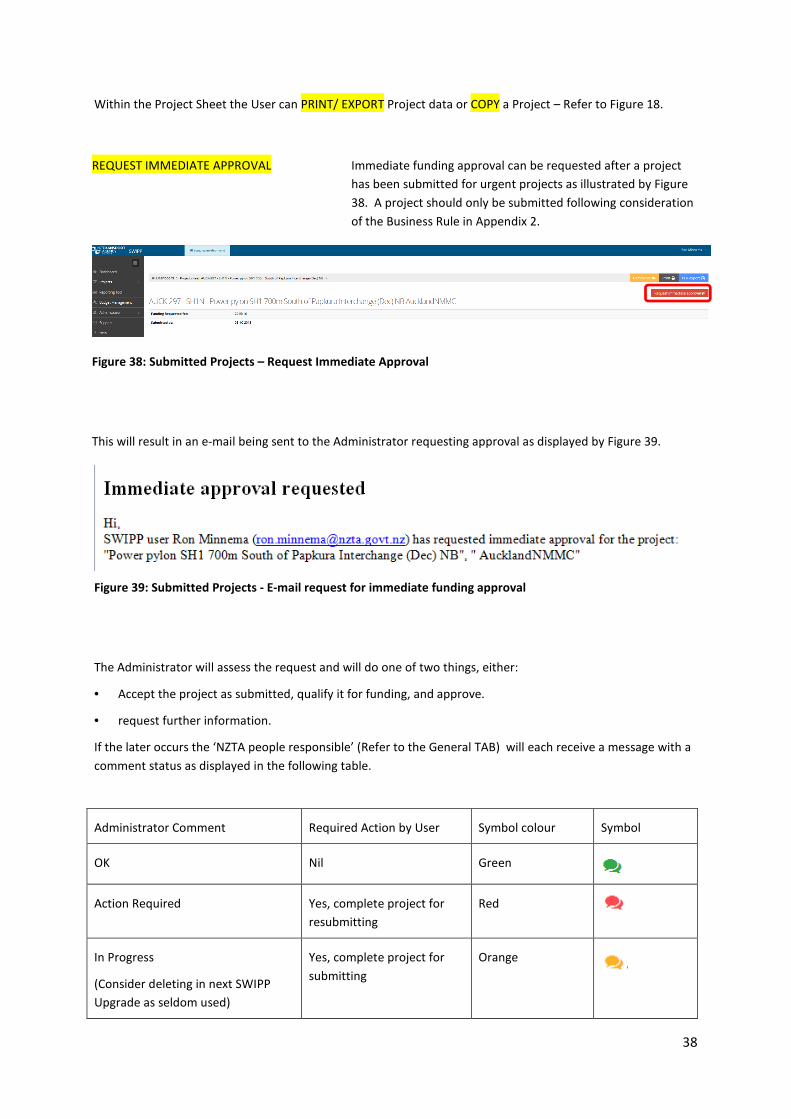
Within the Project Sheet the User can PRINT/ EXPORT Project data or COPY a Project – Refer to Figure 18.
REQUEST IMMEDIATE APPROVAL
Immediate funding approval can be requested after a project
has been submitted for urgent projects as illustrated by Figure
38. A project should only be submitted following consideration
of the Business Rule in Appendix 2.
Figure 38: Submitted Projects – Request Immediate Approval
This will result in an e-mail being sent to the Administrator requesting approval as displayed by Figure 39.
Figure 39: Submitted Projects - E-mail request for immediate funding approval
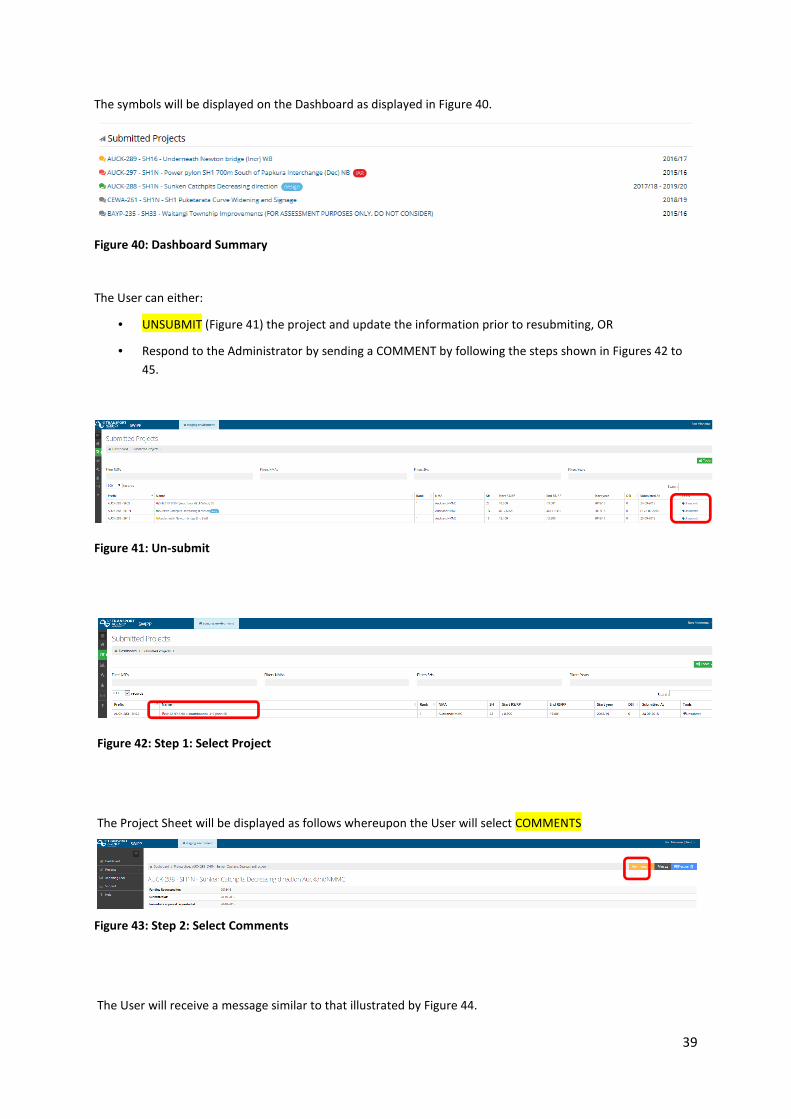
The Administrator will assess the request and will do one of two things, either:
• Accept the project as submitted, qualify it for funding, and approve.
• request further information.
If the later occurs the ‘NZTA people responsible’ (Refer to the General TAB) will each receive a message with a
comment status as displayed in the following table.
Administrator Comment Required Action by User Symbol colour Symbol
OK Nil Green
Action Required Yes, complete project for
resubmitting
Red
In Progress
(Consider deleting in next SWIPP
Upgrade as seldom used)
Yes, complete project for
submitting
Orange
39
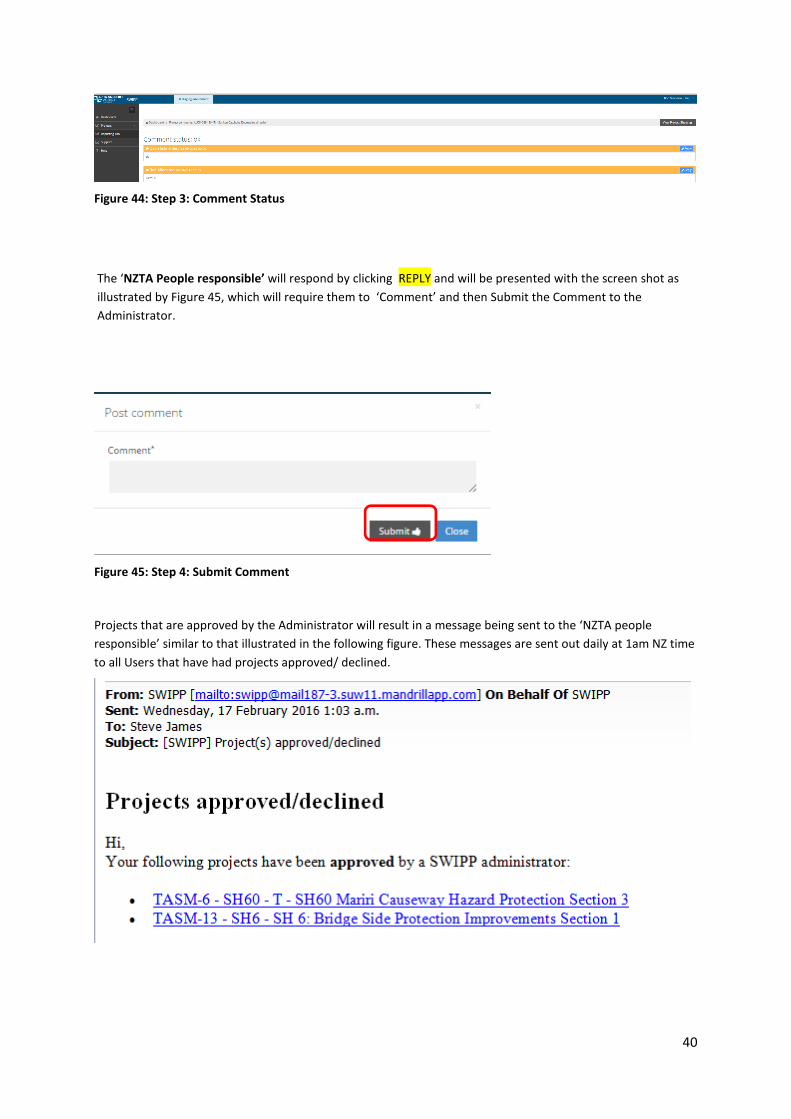
The symbols will be displayed on the Dashboard as displayed in Figure 40.
Figure 40: Dashboard Summary
The User can either:
• UNSUBMIT (Figure 41) the project and update the information prior to resubmiting, OR
• Respond to the Administrator by sending a COMMENT by following the steps shown in Figures 42 to
45.
Figure 41: Un-submit
Figure 42: Step 1: Select Project
The Project Sheet will be displayed as follows whereupon the User will select COMMENTS
Figure 43: Step 2: Select Comments
The User will receive a message similar to that illustrated by Figure 44.
40
Figure 44: Step 3: Comment Status
The ‘NZTA People responsible’ will respond by clicking REPLY and will be presented with the screen shot as
illustrated by Figure 45, which will require them to ‘Comment’ and then Submit the Comment to the
Administrator.
Figure 45: Step 4: Submit Comment
Projects that are approved by the Administrator will result in a message being sent to the ‘NZTA people
responsible’ similar to that illustrated in the following figure. These messages are sent out daily at 1am NZ time
to all Users that have had projects approved/ declined.
41
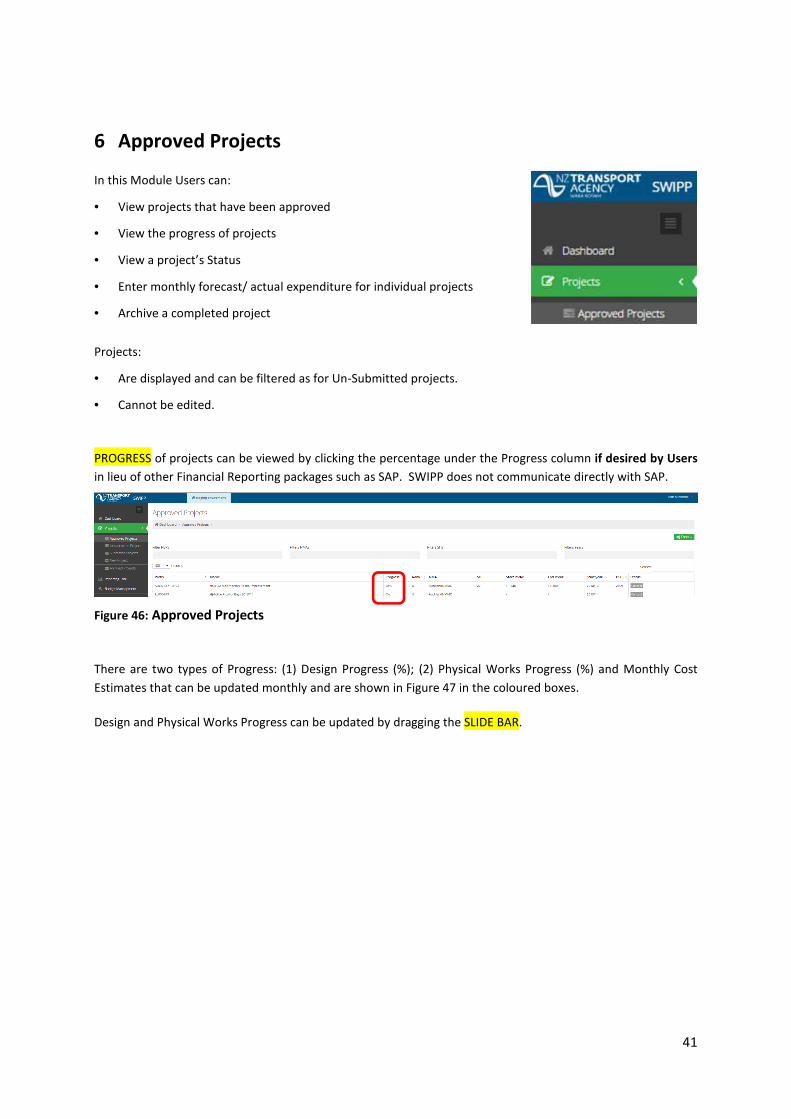
6 Approved Projects
In this Module Users can:
• View projects that have been approved
• View the progress of projects
• View a project’s Status
• Enter monthly forecast/ actual expenditure for individual projects
• Archive a completed project
Projects:
• Are displayed and can be filtered as for Un-Submitted projects.
• Cannot be edited.
PROGRESS of projects can be viewed by clicking the percentage under the Progress column if desired by Users
in lieu of other Financial Reporting packages such as SAP. SWIPP does not communicate directly with SAP.
Figure 46: Approved Projects
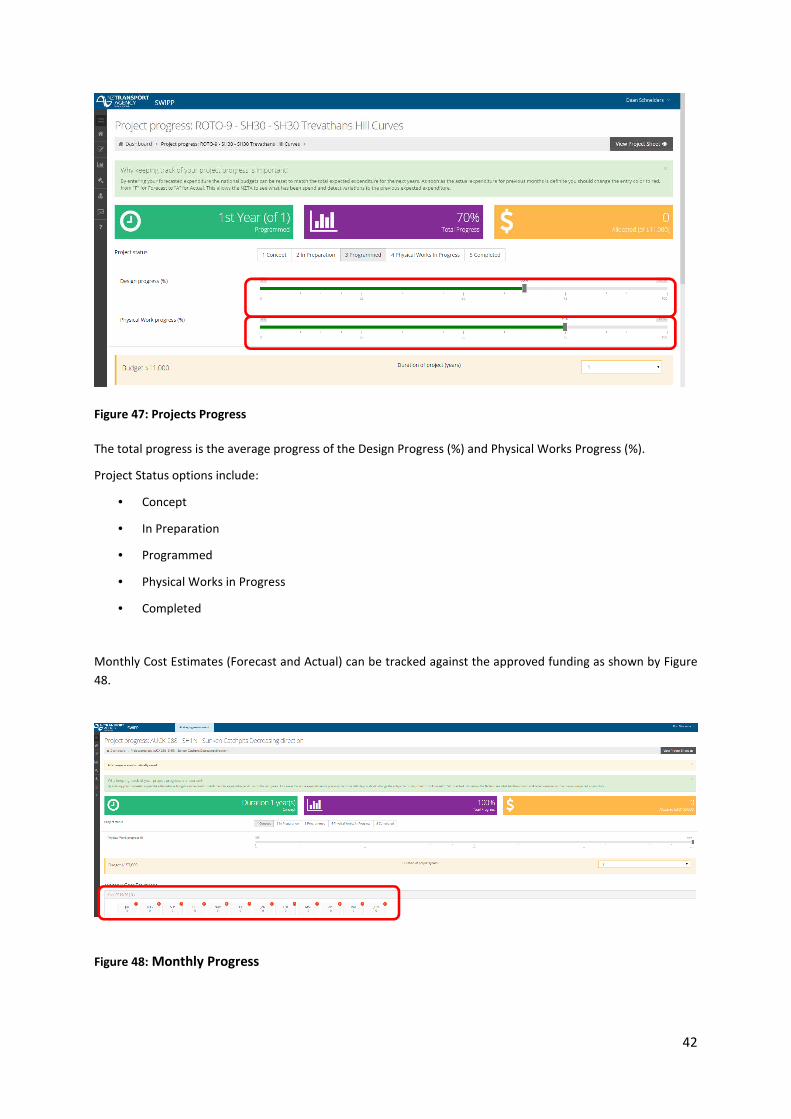
There are two types of Progress: (1) Design Progress (%); (2) Physical Works Progress (%) and Monthly Cost
Estimates that can be updated monthly and are shown in Figure 47 in the coloured boxes.
Design and Physical Works Progress can be updated by dragging the SLIDE BAR.
42
Figure 47: Projects Progress
The total progress is the average progress of the Design Progress (%) and Physical Works Progress (%).
Project Status options include:
• Concept
• In Preparation
• Programmed
• Physical Works in Progress
• Completed
Monthly Cost Estimates (Forecast and Actual) can be tracked against the approved funding as shown by Figure
48.
Figure 48: Monthly Progress
43
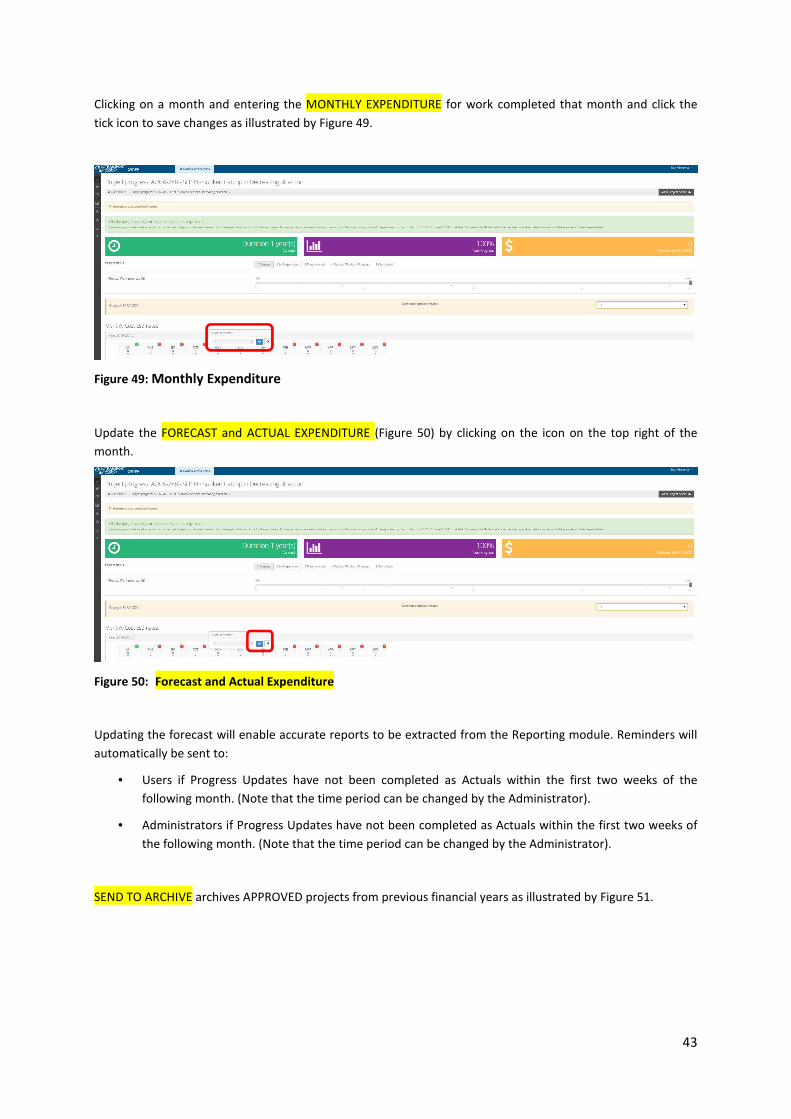
Clicking on a month and entering the MONTHLY EXPENDITURE for work completed that month and click the
tick icon to save changes as illustrated by Figure 49.
Figure 49: Monthly Expenditure
Update the FORECAST and ACTUAL EXPENDITURE (Figure 50) by clicking on the icon on the top right of the
month.
Figure 50: Forecast and Actual Expenditure
Updating the forecast will enable accurate reports to be extracted from the Reporting module. Reminders will
automatically be sent to:
• Users if Progress Updates have not been completed as Actuals within the first two weeks of the
following month. (Note that the time period can be changed by the Administrator).
• Administrators if Progress Updates have not been completed as Actuals within the first two weeks of
the following month. (Note that the time period can be changed by the Administrator).
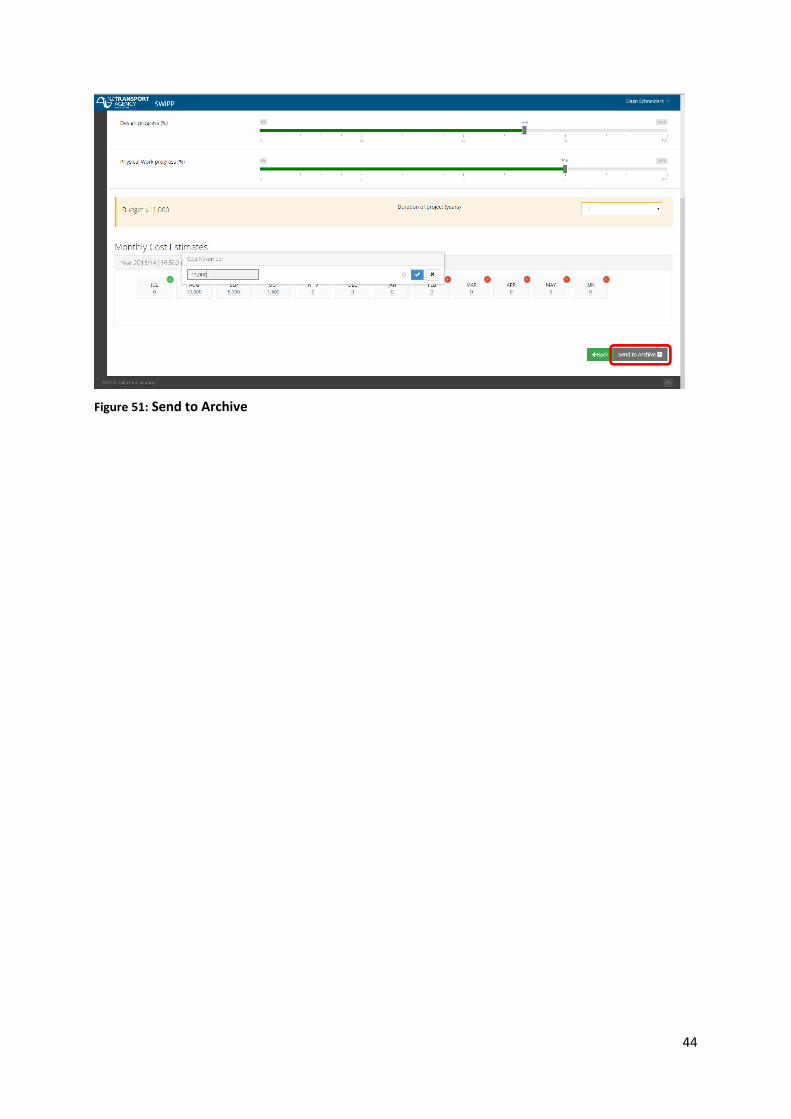
SEND TO ARCHIVE archives APPROVED projects from previous financial years as illustrated by Figure 51.
44
Figure 51: Send to Archive
45
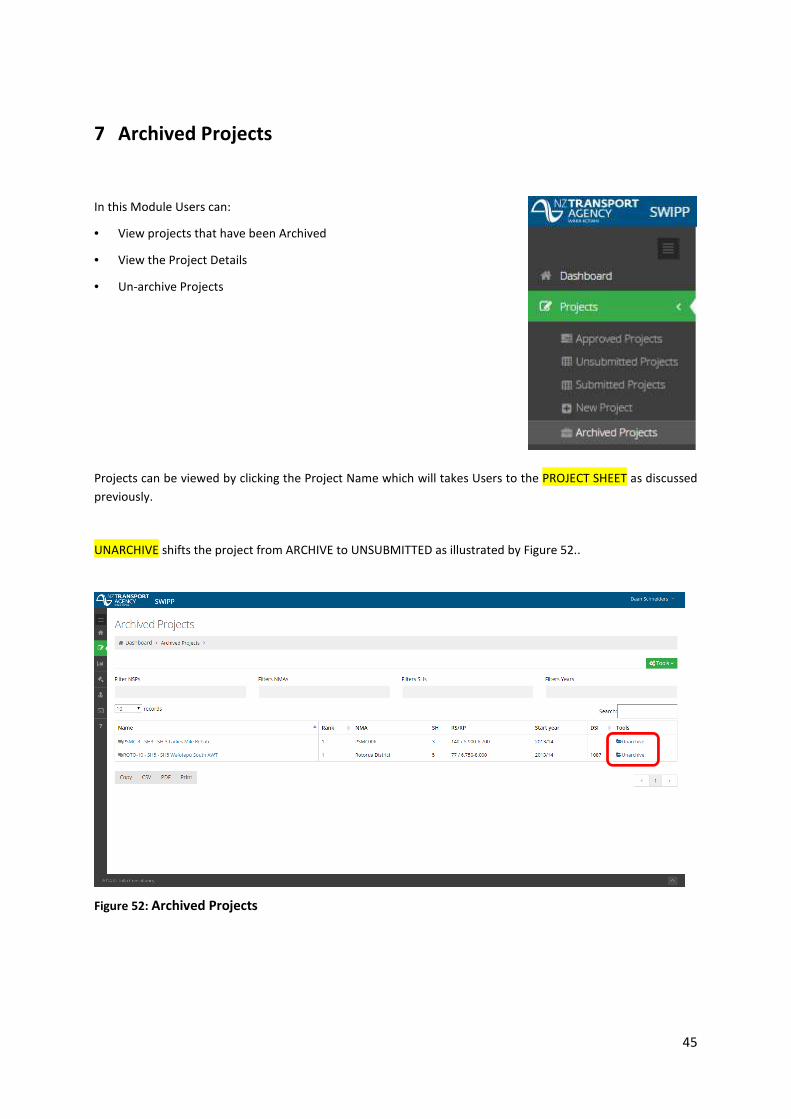
7 Archived Projects
In this Module Users can:
• View projects that have been Archived
• View the Project Details
• Un-archive Projects
Projects can be viewed by clicking the Project Name which will takes Users to the PROJECT SHEET as discussed
previously.
UNARCHIVE shifts the project from ARCHIVE to UNSUBMITTED as illustrated by Figure 52..
Figure 52: Archived Projects

46
Page left intentionally blank
47
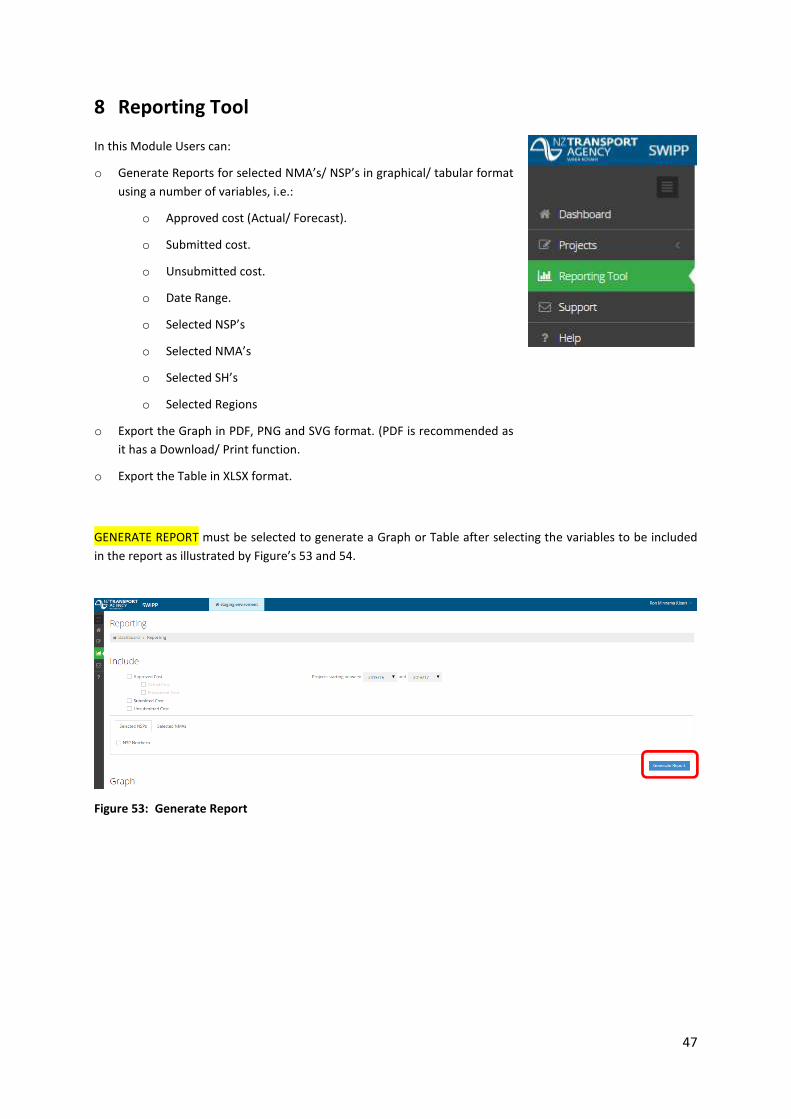
8 Reporting Tool
In this Module Users can:
o Generate Reports for selected NMA’s/ NSP’s in graphical/ tabular format
using a number of variables, i.e.:
o Approved cost (Actual/ Forecast).
o Submitted cost.
o Unsubmitted cost.
o Date Range.
o Selected NSP’s
o Selected NMA’s
o Selected SH’s
o Selected Regions
o Export the Graph in PDF, PNG and SVG format. (PDF is recommended as
it has a Download/ Print function.
o Export the Table in XLSX format.
GENERATE REPORT must be selected to generate a Graph or Table after selecting the variables to be included
in the report as illustrated by Figure’s 53 and 54.
Figure 53: Generate Report
48
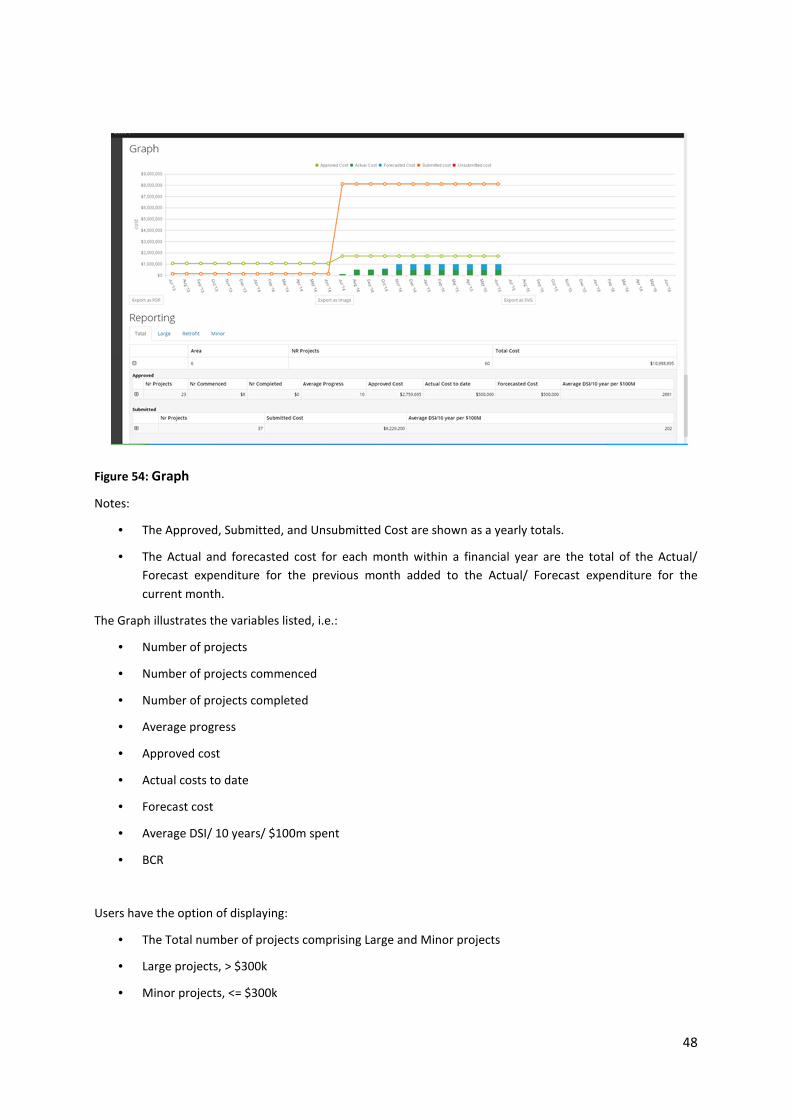
Figure 54: Graph
Notes:
• The Approved, Submitted, and Unsubmitted Cost are shown as a yearly totals.
• The Actual and forecasted cost for each month within a financial year are the total of the Actual/
Forecast expenditure for the previous month added to the Actual/ Forecast expenditure for the
current month.
The Graph illustrates the variables listed, i.e.:
• Number of projects
• Number of projects commenced
• Number of projects completed
• Average progress
• Approved cost
• Actual costs to date
• Forecast cost
• Average DSI/ 10 years/ $100m spent
• BCR
Users have the option of displaying:
• The Total number of projects comprising Large and Minor projects
• Large projects, > $300k
• Minor projects, <= $300k
49
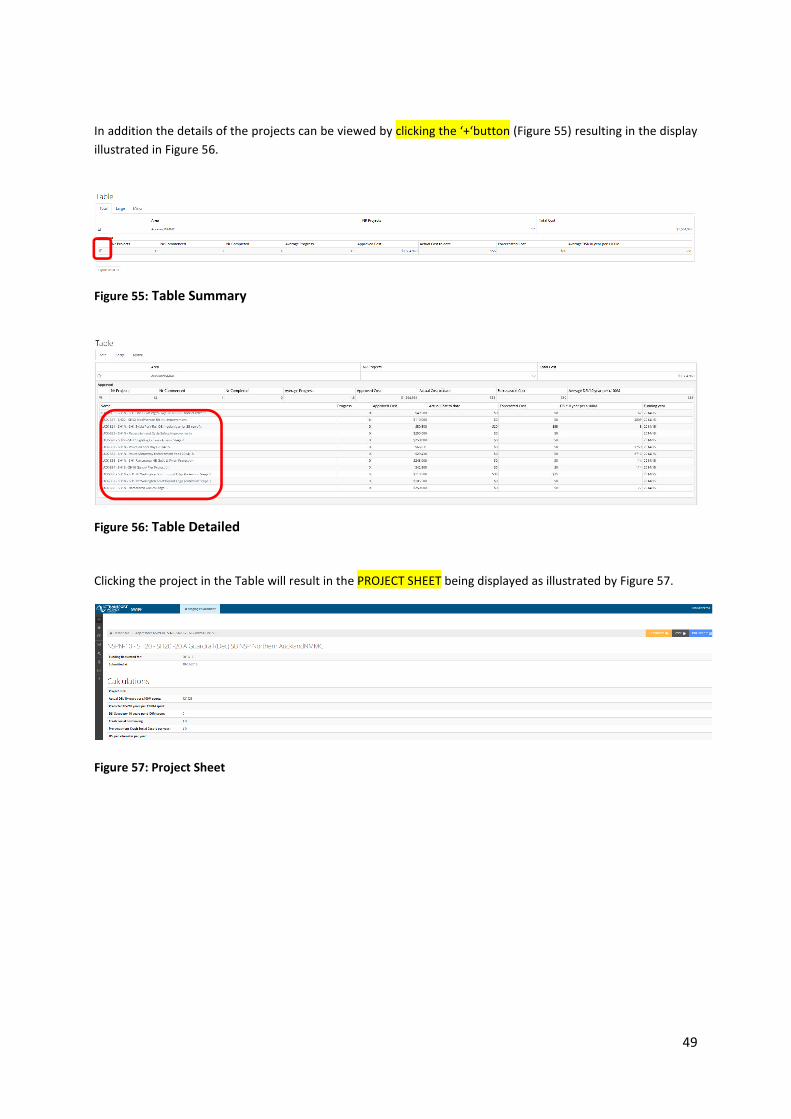
In addition the details of the projects can be viewed by clicking the ‘+‘button (Figure 55) resulting in the display
illustrated in Figure 56.
Figure 55: Table Summary
Figure 56: Table Detailed
Clicking the project in the Table will result in the PROJECT SHEET being displayed as illustrated by Figure 57.
Figure 57: Project Sheet

50
Page left intentionally blank

51
Appendices

52
Page left intentionally blank
53
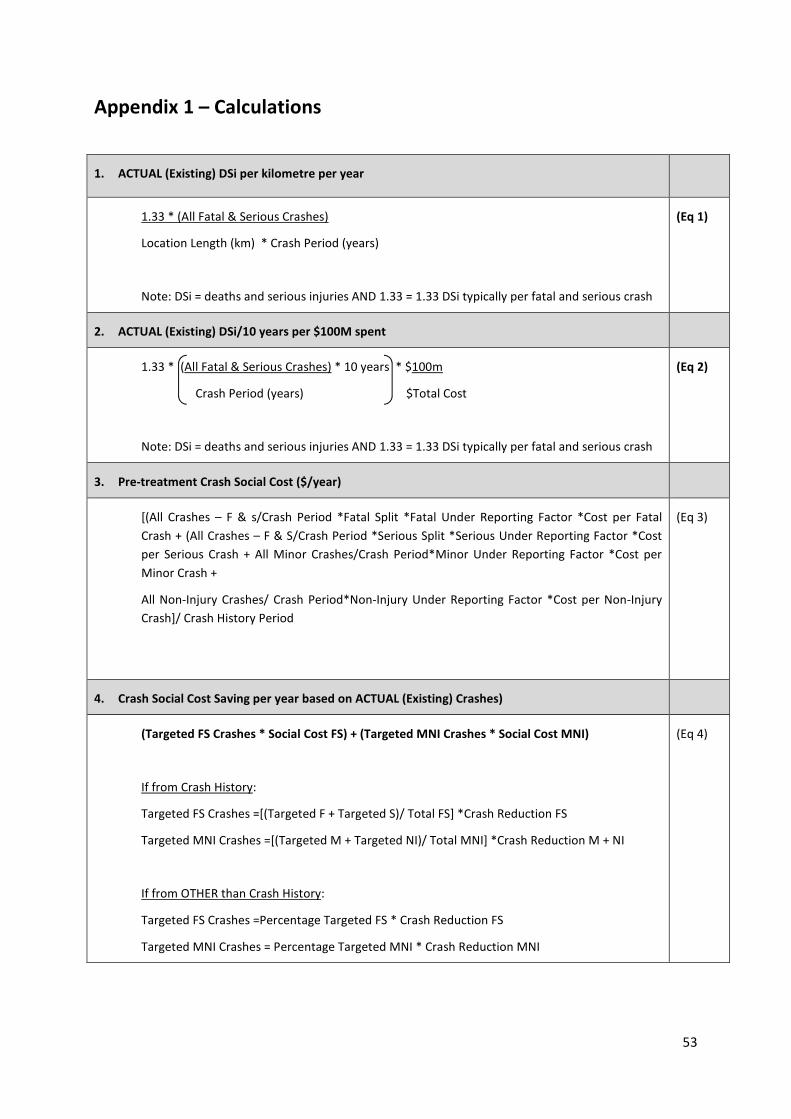
Appendix 1 – Calculations
1. ACTUAL (Existing) DSi per kilometre per year
1.33 * (All Fatal & Serious Crashes)
Location Length (km) * Crash Period (years)
Note: DSi = deaths and serious injuries AND 1.33 = 1.33 DSi typically per fatal and serious crash
(Eq 1)
2. ACTUAL (Existing) DSi/10 years per $100M spent
1.33 * (All Fatal & Serious Crashes) * 10 years * $100m
Crash Period (years) $Total Cost
Note: DSi = deaths and serious injuries AND 1.33 = 1.33 DSi typically per fatal and serious crash
(Eq 2)
3. Pre-treatment Crash Social Cost ($/year)
[(All Crashes – F & s/Crash Period *Fatal Split *Fatal Under Reporting Factor *Cost per Fatal
Crash + (All Crashes – F & S/Crash Period *Serious Split *Serious Under Reporting Factor *Cost
per Serious Crash + All Minor Crashes/Crash Period*Minor Under Reporting Factor *Cost per
Minor Crash +
All Non-Injury Crashes/ Crash Period*Non-Injury Under Reporting Factor *Cost per Non-Injury
Crash]/ Crash History Period
(Eq 3)
4. Crash Social Cost Saving per year based on ACTUAL (Existing) Crashes)
(Targeted FS Crashes * Social Cost FS) + (Targeted MNI Crashes * Social Cost MNI)
If from Crash History:
Targeted FS Crashes =[(Targeted F + Targeted S)/ Total FS] *Crash Reduction FS
Targeted MNI Crashes =[(Targeted M + Targeted NI)/ Total MNI] *Crash Reduction M + NI
If from OTHER than Crash History:
Targeted FS Crashes =Percentage Targeted FS * Crash Reduction FS
Targeted MNI Crashes = Percentage Targeted MNI * Crash Reduction MNI
(Eq 4)
54
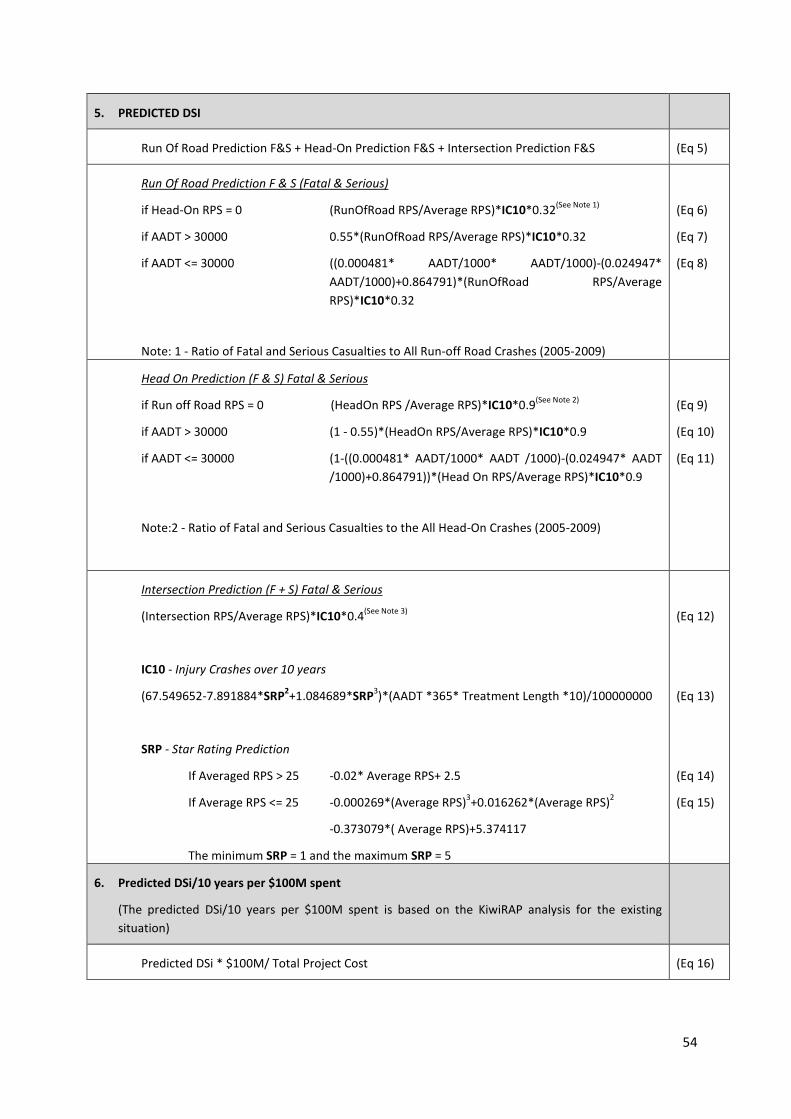
5. PREDICTED DSI
Run Of Road Prediction F&S + Head-On Prediction F&S + Intersection Prediction F&S (Eq 5)
Run Of Road Prediction F & S (Fatal & Serious)
if Head-On RPS = 0 (RunOfRoad RPS/Average RPS)*IC10*0.32(See Note 1)
if AADT > 30000 0.55*(RunOfRoad RPS/Average RPS)*IC10*0.32
if AADT <= 30000 ((0.000481* AADT/1000* AADT/1000)-(0.024947*
AADT/1000)+0.864791)*(RunOfRoad RPS/Average
RPS)*IC10*0.32
Note: 1 - Ratio of Fatal and Serious Casualties to All Run-off Road Crashes (2005-2009)
(Eq 6)
(Eq 7)
(Eq 8)
Head On Prediction (F & S) Fatal & Serious
if Run off Road RPS = 0 (HeadOn RPS /Average RPS)*IC10*0.9(See Note 2)
if AADT > 30000 (1 - 0.55)*(HeadOn RPS/Average RPS)*IC10*0.9
if AADT <= 30000 (1-((0.000481* AADT/1000* AADT /1000)-(0.024947* AADT
/1000)+0.864791))*(Head On RPS/Average RPS)*IC10*0.9
Note:2 - Ratio of Fatal and Serious Casualties to the All Head-On Crashes (2005-2009)
(Eq 9)
(Eq 10)
(Eq 11)
Intersection Prediction (F + S) Fatal & Serious
(Intersection RPS/Average RPS)*IC10*0.4(See Note 3)
IC10 - Injury Crashes over 10 years
(67.549652-7.891884*SRP2+1.084689*SRP
3)*(AADT *365* Treatment Length *10)/100000000
SRP - Star Rating Prediction
If Averaged RPS > 25 -0.02* Average RPS+ 2.5
If Average RPS <= 25 -0.000269*(Average RPS)3+0.016262*(Average RPS)
2
-0.373079*( Average RPS)+5.374117
The minimum SRP = 1 and the maximum SRP = 5
(Eq 12)
(Eq 13)
(Eq 14)
(Eq 15)
6. Predicted DSi/10 years per $100M spent
(The predicted DSi/10 years per $100M spent is based on the KiwiRAP analysis for the existing
situation)
Predicted DSi * $100M/ Total Project Cost (Eq 16)
55
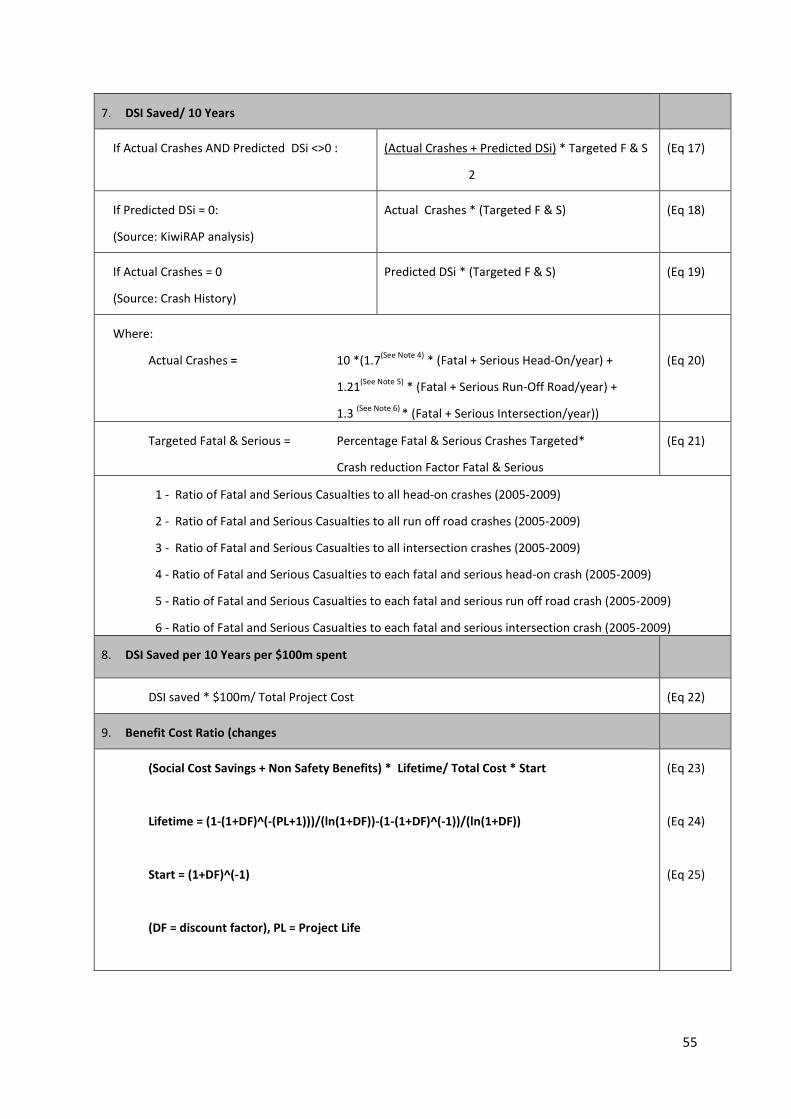
7. DSI Saved/ 10 Years
If Actual Crashes AND Predicted DSi <>0 : (Actual Crashes + Predicted DSi) * Targeted F & S
2
(Eq 17)
If Predicted DSi = 0:
(Source: KiwiRAP analysis)
Actual Crashes * (Targeted F & S) (Eq 18)
If Actual Crashes = 0
(Source: Crash History)
Predicted DSi * (Targeted F & S) (Eq 19)
Where:
Actual Crashes = 10 *(1.7(See Note 4)
* (Fatal + Serious Head-On/year) +
1.21(See Note 5)
* (Fatal + Serious Run-Off Road/year) +
1.3 (See Note 6)
* (Fatal + Serious Intersection/year))
(Eq 20)
Targeted Fatal & Serious = Percentage Fatal & Serious Crashes Targeted*
Crash reduction Factor Fatal & Serious
(Eq 21)
1 - Ratio of Fatal and Serious Casualties to all head-on crashes (2005-2009)
2 - Ratio of Fatal and Serious Casualties to all run off road crashes (2005-2009)
3 - Ratio of Fatal and Serious Casualties to all intersection crashes (2005-2009)
4 - Ratio of Fatal and Serious Casualties to each fatal and serious head-on crash (2005-2009)
5 - Ratio of Fatal and Serious Casualties to each fatal and serious run off road crash (2005-2009)
6 - Ratio of Fatal and Serious Casualties to each fatal and serious intersection crash (2005-2009)
8. DSI Saved per 10 Years per $100m spent
DSI saved * $100m/ Total Project Cost (Eq 22)
9. Benefit Cost Ratio (changes
(Social Cost Savings + Non Safety Benefits) * Lifetime/ Total Cost * Start
Lifetime = (1-(1+DF)^(-(PL+1)))/(ln(1+DF))-(1-(1+DF)^(-1))/(ln(1+DF))
Start = (1+DF)^(-1)
(DF = discount factor), PL = Project Life
(Eq 23)
(Eq 24)
(Eq 25)

56
Page left intentionally blank
57
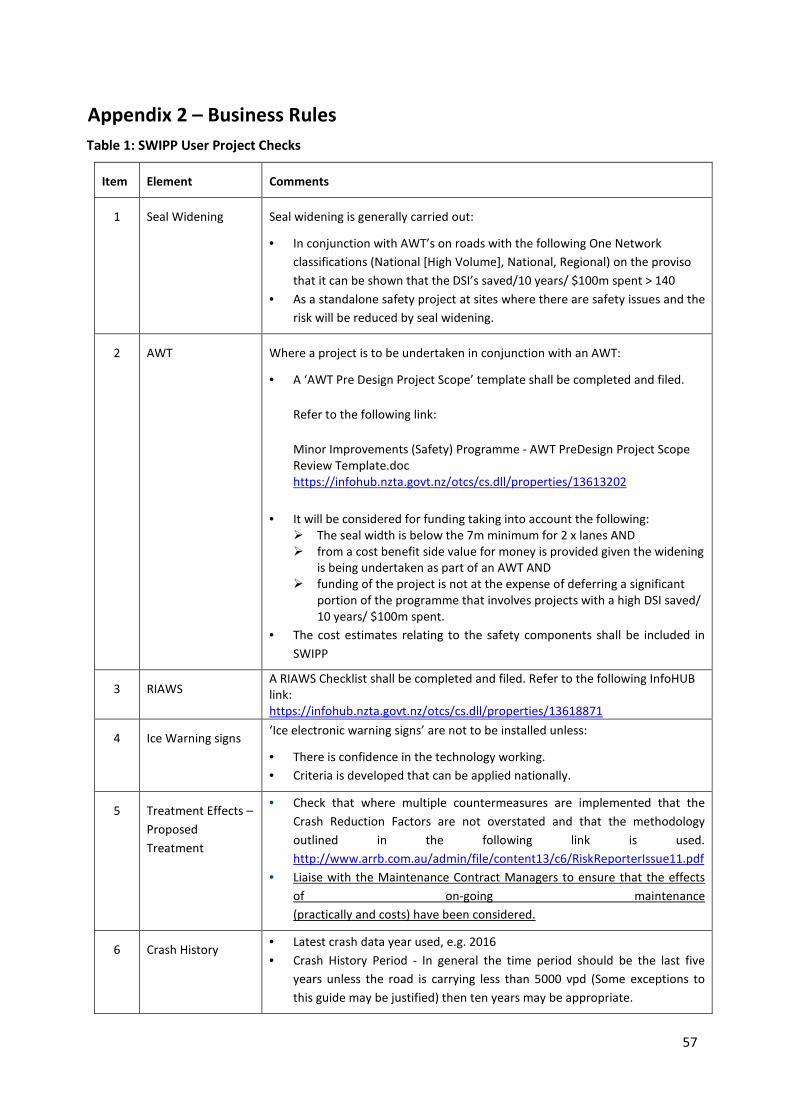
Appendix 2 – Business Rules
Table 1: SWIPP User Project Checks
Item Element Comments
1 Seal Widening Seal widening is generally carried out:
• In conjunction with AWT’s on roads with the following One Network
classifications (National [High Volume], National, Regional) on the proviso
that it can be shown that the DSI’s saved/10 years/ $100m spent > 140
• As a standalone safety project at sites where there are safety issues and the
risk will be reduced by seal widening.
2 AWT Where a project is to be undertaken in conjunction with an AWT:
• A ‘AWT Pre Design Project Scope’ template shall be completed and filed.
Refer to the following link:
Minor Improvements (Safety) Programme - AWT PreDesign Project Scope
Review Template.doc
https://infohub.nzta.govt.nz/otcs/cs.dll/properties/13613202
• It will be considered for funding taking into account the following:
� The seal width is below the 7m minimum for 2 x lanes AND
� from a cost benefit side value for money is provided given the widening
is being undertaken as part of an AWT AND
� funding of the project is not at the expense of deferring a significant
portion of the programme that involves projects with a high DSI saved/
10 years/ $100m spent.
• The cost estimates relating to the safety components shall be included in
SWIPP
3 RIAWS A RIAWS Checklist shall be completed and filed. Refer to the following InfoHUB
link:
https://infohub.nzta.govt.nz/otcs/cs.dll/properties/13618871
4 Ice Warning signs ‘Ice electronic warning signs’ are not to be installed unless:
• There is confidence in the technology working.
• Criteria is developed that can be applied nationally.
5 Treatment Effects –
Proposed
Treatment
• Check that where multiple countermeasures are implemented that the
Crash Reduction Factors are not overstated and that the methodology
outlined in the following link is used.
http://www.arrb.com.au/admin/file/content13/c6/RiskReporterIssue11.pdf
• Liaise with the Maintenance Contract Managers to ensure that the effects
of on-going maintenance
(practically and costs) have been considered.
6 Crash History • Latest crash data year used, e.g. 2016
• Crash History Period - In general the time period should be the last five
years unless the road is carrying less than 5000 vpd (Some exceptions to
this guide may be justified) then ten years may be appropriate.

58
7 Treatment Effects -
Staging
• Check that staging of interventions has been considered, e.g. wide
centreline followed by Wire Rope Barrier.
8 ATP In addition to the technical requirements to install edge line ATP it is expected
that the project will be discussed with local cycling representatives before
proceeding
9 Inter regional
routes
Where State highways span two different NMA’s and that section of State
highway has the same SafetyNET treatment philosophy it is expected that the
adjoining treatment philosophies will be similar.
10 New Signs Where funding is being sought for new signs it shall be supported by the DSI
saved / 10 years/ $100m spent. Qualifying activities may include:
• Signs at specific locations such as Active Warning Signs
• On routes – review and upgrade all curve warning signage/ chevron boards
to address a Loss of Control Type problem on bends.
• Mass Action
11 Benefit Cost Ratio’s This risk metric may be used as an alternative to DSI saved/ 10 years/ $100m
spent for low cost projects where a DSI cannot easily be calculated, e.g. ‘With
the installation of the Pedestrian Refuge the LOS with reduce from D to B’.
It will not generally be accepted for high cost projects, e.g. > $50k projects
should be able to be supported by a DSI saved/ 10 years/ $100m spent.
12 Price Level
Increases
• Once the annual funding bid is approved for the financial year System
Management Managers shall manage their projects within the approved
allocation including projects that are approved within SWIPP subsequent to
the funding approval.
• A review will be undertaken annually in November that may result in:
o Surplus funds being distributed between System Management
Areas across all three activities.
o Funds being compulsory surplused where the Forecast expenditure
is signficantly less than the Approved Allocation.
13 Capital Works
Projects
Projects shall not be submitted to complete a Capital Works Project.
14 Professional
Services Fees
These shall be included as part of the total project cost and shall NOT be
entered as a single line item covering all projects. The exception may be a
project that involves professional services fees for investgations only may be
approved on the provisio that:
• The project focuses on a particular issue.
• A number of physical projects being identifed that will be the subjetc of
a seperate funding application.
15 High Risk
Motorycling Routes
Minor Improvements State highway Safety projects that are on High Risk
Motorcycling routes (using the NZTA methodology from an investment
perspective) shall be checked as follows - Where the project involves the
construction of barriers the project scope shall be checked to ensure that
allowance has been made to for the inclusion of Continuous Motorcycling
Protection Systems (CMPS) for rigid/ semi rigid barriers and Discontinuous
Motorcycling Protection Systems (DMPS) for flexible barrier systems such as
WRSB should they be required
59
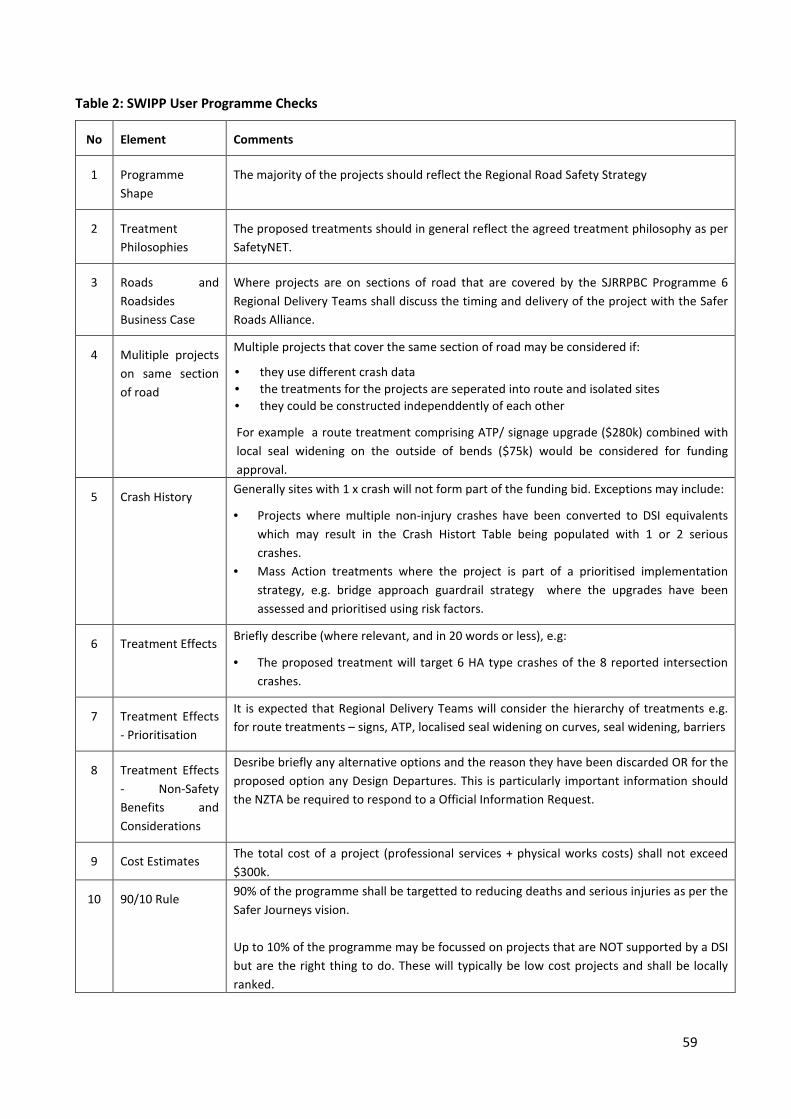
Table 2: SWIPP User Programme Checks
No Element Comments
1 Programme
Shape
The majority of the projects should reflect the Regional Road Safety Strategy
2 Treatment
Philosophies
The proposed treatments should in general reflect the agreed treatment philosophy as per
SafetyNET.
3 Roads and
Roadsides
Business Case
Where projects are on sections of road that are covered by the SJRRPBC Programme 6
Regional Delivery Teams shall discuss the timing and delivery of the project with the Safer
Roads Alliance.
4 Mulitiple projects
on same section
of road
Multiple projects that cover the same section of road may be considered if:
• they use different crash data
• the treatments for the projects are seperated into route and isolated sites
• they could be constructed independdently of each other
For example a route treatment comprising ATP/ signage upgrade ($280k) combined with
local seal widening on the outside of bends ($75k) would be considered for funding
approval.
5 Crash History Generally sites with 1 x crash will not form part of the funding bid. Exceptions may include:
• Projects where multiple non-injury crashes have been converted to DSI equivalents
which may result in the Crash Histort Table being populated with 1 or 2 serious
crashes.
• Mass Action treatments where the project is part of a prioritised implementation
strategy, e.g. bridge approach guardrail strategy where the upgrades have been
assessed and prioritised using risk factors.
6 Treatment Effects Briefly describe (where relevant, and in 20 words or less), e.g:
• The proposed treatment will target 6 HA type crashes of the 8 reported intersection
crashes.
7 Treatment Effects
- Prioritisation
It is expected that Regional Delivery Teams will consider the hierarchy of treatments e.g.
for route treatments – signs, ATP, localised seal widening on curves, seal widening, barriers
8 Treatment Effects
- Non-Safety
Benefits and
Considerations
Desribe briefly any alternative options and the reason they have been discarded OR for the
proposed option any Design Departures. This is particularly important information should
the NZTA be required to respond to a Official Information Request.
9 Cost Estimates The total cost of a project (professional services + physical works costs) shall not exceed
$300k.
10 90/10 Rule 90% of the programme shall be targetted to reducing deaths and serious injuries as per the
Safer Journeys vision.
Up to 10% of the programme may be focussed on projects that are NOT supported by a DSI
but are the right thing to do. These will typically be low cost projects and shall be locally
ranked.
60
Table 3: Administrator Checks
No Element Comments
1 Work Category Check that the submitted project qualifies for funding under W/C 341 Minor
Improvements, and that the proposed project is not being submitted to
complete a Capital Works Project.
2 Programme size The size of the submitted funding bid should be equivalent to what a NOC
could reasonably expect to deliver over 18 months
3 Assessment The funding bid shall comprise projects that reflects the Regional Road
Safety as required by the State highway safe network management activity
manual.
The bulk of the projects that comprise the funding bid shall be supported by
a DSI saved/ 10 years/ $100m spent.
The balance of the projects that comprise the funding bid should be
supported by alternative risk metrics, e.g. LOS using the Pedestrian Crossing
Facility Calculation Tool, BCR, Meets criteria as per Traffic Note ‘x’, high road
environment risk as defined in ‘SAFER Journeys for Rural Schools’, Simplified
procedures – SP11 Walking and Cycling Facilities, conflict studies, crash
prediction models .
In general support will not be given to projects where the DSI saved/ 10
years/ $100m spent is based on one crash UNLESS an acceptable explanation
is provided, i.e. the one crash is based on a DSI equivalent.
Where corridor treatments are proposed these will be checked to ensure
they reflect the agreed treatment philosophies in SafetyNET.
Projects that meet the above criteria will ‘qualify’ for funding.
4 Funding Allocation The amount of funding allocated to a REGION will take into account:
a. The annual funding
allocated for safety
X No. F & S casualties (Region) over 5 yrs
No. F & S casualties (National) over 5 yrs
b. Whether the region has made available surplus funds to other regions,
i.e. the amount of surplus will be added to a) and then adjusted based
on the following criteria
c. Whether the region has been advanced funds over and above the
intial funding allocation, i.e. the amount of advanced funds will be
subtracted from a).
d. The track record of the region spending previous funding allocations.
e. Whether the Region has spent the funds allocated for approved
projects on those projects.

61
Appendix 3 - SWIPP Examples

62
Page left intentionally blank
63
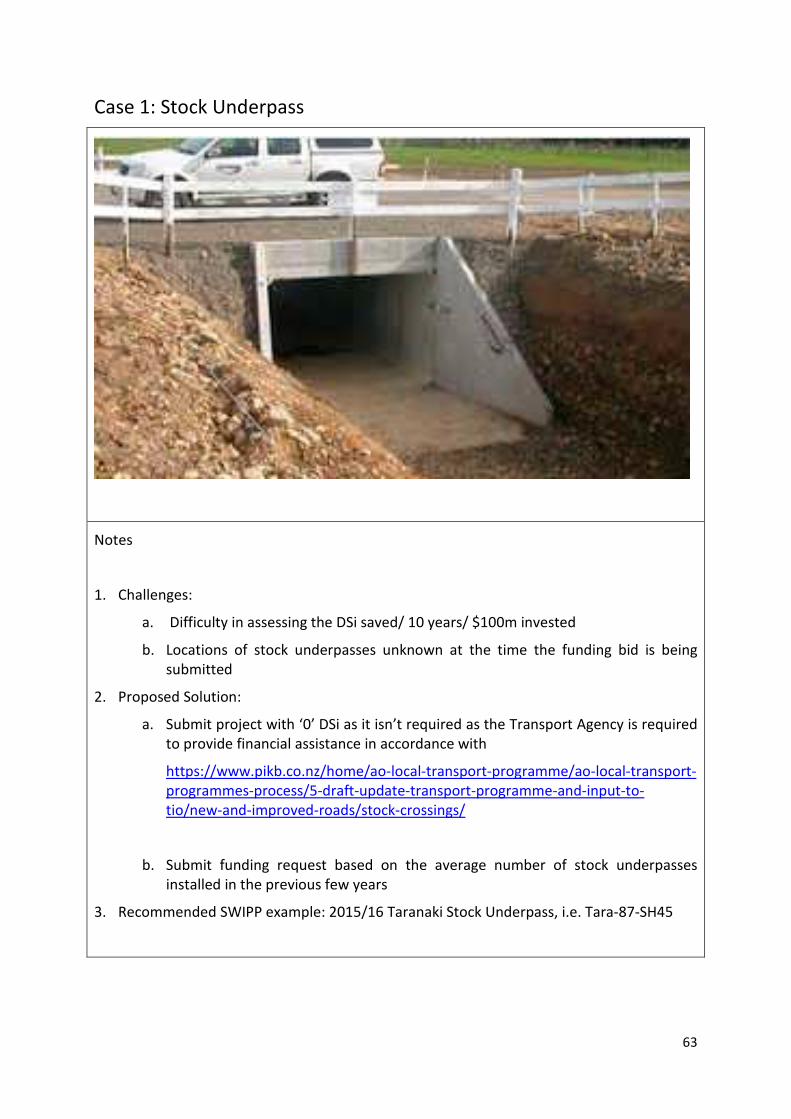
Case 1: Stock Underpass
Notes
1. Challenges:
a. Difficulty in assessing the DSi saved/ 10 years/ $100m invested
b. Locations of stock underpasses unknown at the time the funding bid is being
submitted
2. Proposed Solution:
a. Submit project with ‘0’ DSi as it isn’t required as the Transport Agency is required
to provide financial assistance in accordance with
https://www.pikb.co.nz/home/ao-local-transport-programme/ao-local-transport-
programmes-process/5-draft-update-transport-programme-and-input-to-
tio/new-and-improved-roads/stock-crossings/
b. Submit funding request based on the average number of stock underpasses
installed in the previous few years
3. Recommended SWIPP example: 2015/16 Taranaki Stock Underpass, i.e. Tara-87-SH45
64
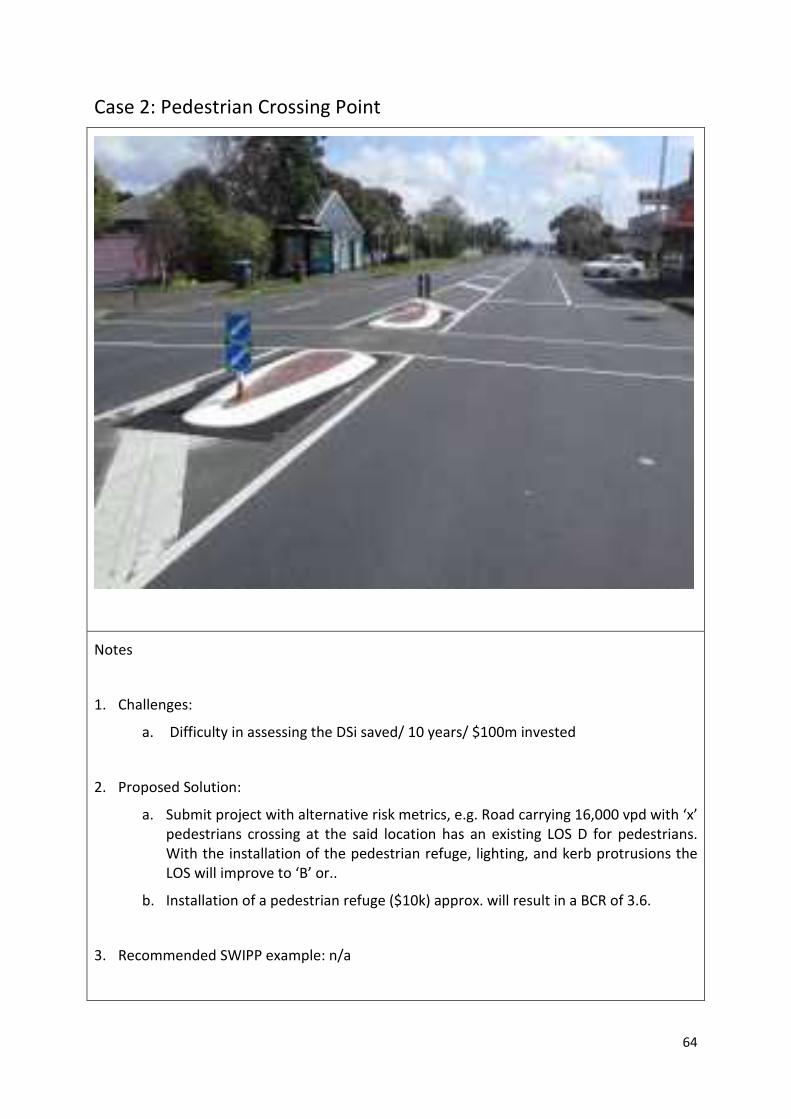
Case 2: Pedestrian Crossing Point
Notes
1. Challenges:
a. Difficulty in assessing the DSi saved/ 10 years/ $100m invested
2. Proposed Solution:
a. Submit project with alternative risk metrics, e.g. Road carrying 16,000 vpd with ‘x’
pedestrians crossing at the said location has an existing LOS D for pedestrians.
With the installation of the pedestrian refuge, lighting, and kerb protrusions the
LOS will improve to ‘B’ or..
b. Installation of a pedestrian refuge ($10k) approx. will result in a BCR of 3.6.
3. Recommended SWIPP example: n/a
65
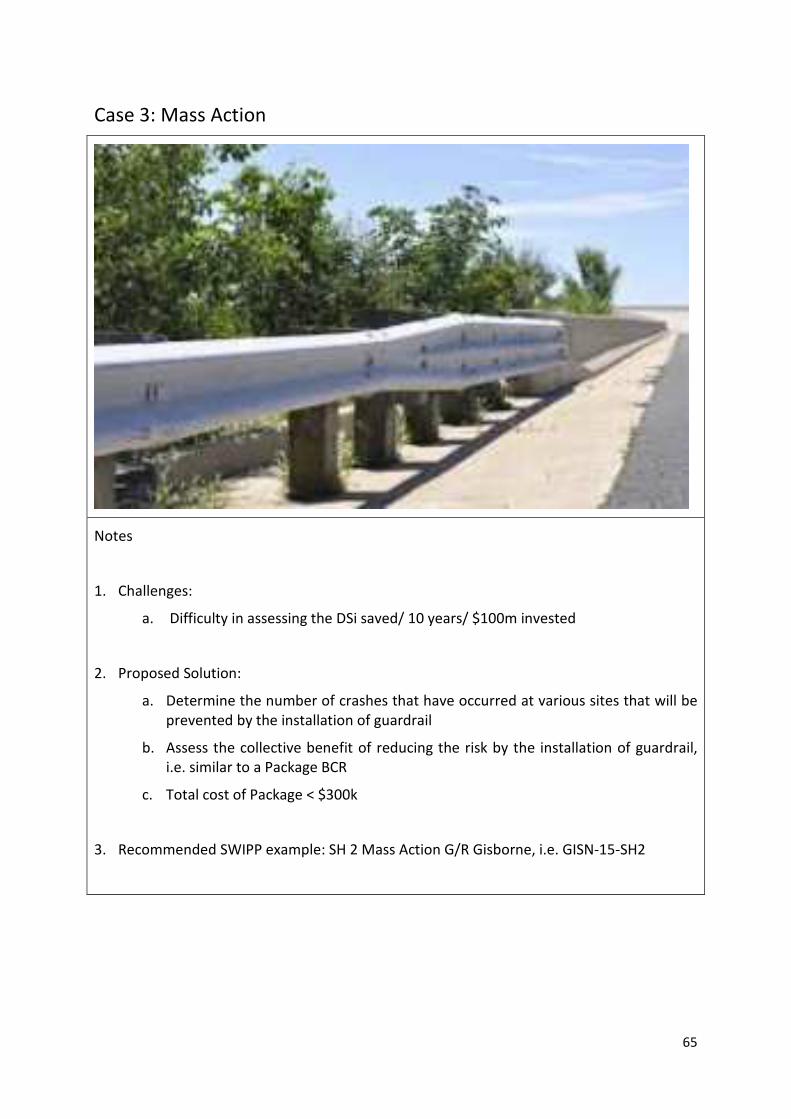
Case 3: Mass Action
Notes
1. Challenges:
a. Difficulty in assessing the DSi saved/ 10 years/ $100m invested
2. Proposed Solution:
a. Determine the number of crashes that have occurred at various sites that will be
prevented by the installation of guardrail
b. Assess the collective benefit of reducing the risk by the installation of guardrail,
i.e. similar to a Package BCR
c. Total cost of Package < $300k
3. Recommended SWIPP example: SH 2 Mass Action G/R Gisborne, i.e. GISN-15-SH2
66
Case 4: Crash Cluster
Notes
1. Challenge:
a. Difficulty in demonstrating a risk metric to enable a bid for funding treatment
options to be submitted as SWIPP provides heavy bias to Fatal and Serious
Crashes only and minimal weighting to the likelihood that a Minor crash could
have resulted in a fatality or serious injury.
2. Proposed Solution:
a. Convert the Minor Injury Rural 2 lane Mid-block Crashes to DSi equivalents using
the severity indices for the appropriate crash types. Where the site is mid-block
and rural the crash indices in the following example can be used. If urban than
the crash indices will need to be sourced from the High Risk Intersection Guide.
3. Recommended SWIPP example follows:
67
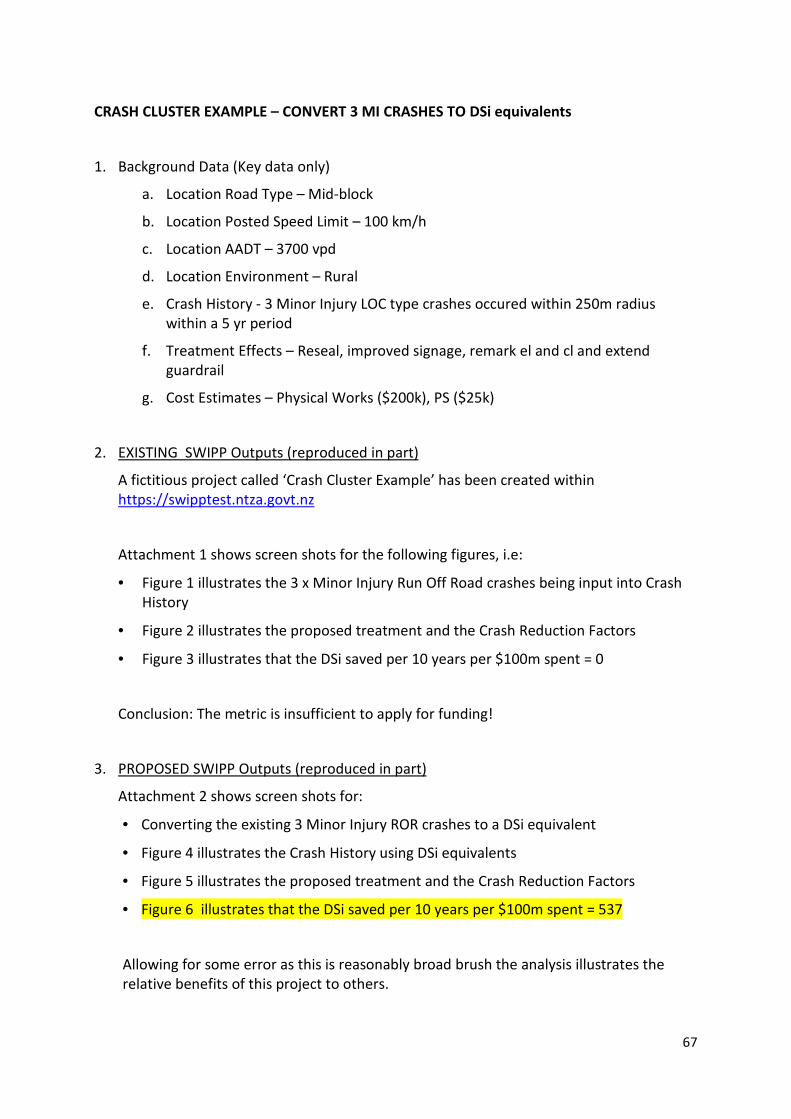
CRASH CLUSTER EXAMPLE – CONVERT 3 MI CRASHES TO DSi equivalents
1. Background Data (Key data only)
a. Location Road Type – Mid-block
b. Location Posted Speed Limit – 100 km/h
c. Location AADT – 3700 vpd
d. Location Environment – Rural
e. Crash History - 3 Minor Injury LOC type crashes occured within 250m radius
within a 5 yr period
f. Treatment Effects – Reseal, improved signage, remark el and cl and extend
guardrail
g. Cost Estimates – Physical Works ($200k), PS ($25k)
2. EXISTING SWIPP Outputs (reproduced in part)
A fictitious project called ‘Crash Cluster Example’ has been created within
https://swipptest.ntza.govt.nz
Attachment 1 shows screen shots for the following figures, i.e:
• Figure 1 illustrates the 3 x Minor Injury Run Off Road crashes being input into Crash
History
• Figure 2 illustrates the proposed treatment and the Crash Reduction Factors
• Figure 3 illustrates that the DSi saved per 10 years per $100m spent = 0
Conclusion: The metric is insufficient to apply for funding!
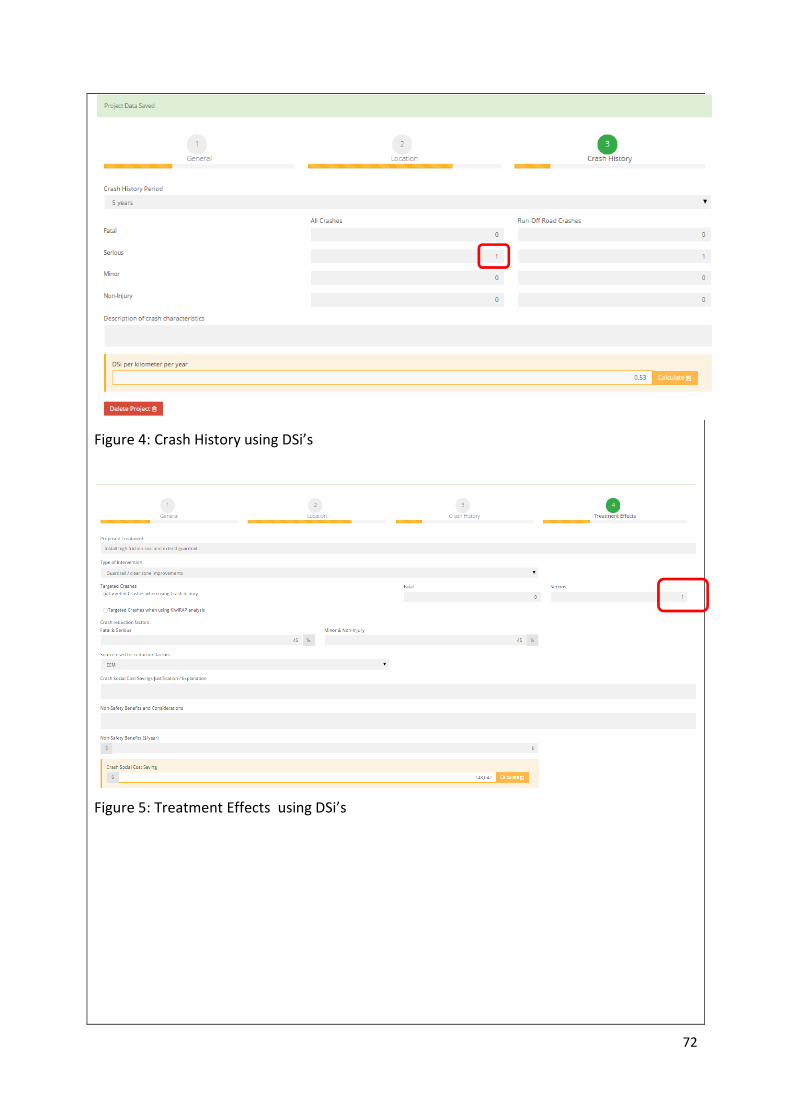
3. PROPOSED SWIPP Outputs (reproduced in part)
Attachment 2 shows screen shots for:
• Converting the existing 3 Minor Injury ROR crashes to a DSi equivalent
• Figure 4 illustrates the Crash History using DSi equivalents
• Figure 5 illustrates the proposed treatment and the Crash Reduction Factors
• Figure 6 illustrates that the DSi saved per 10 years per $100m spent = 537
Allowing for some error as this is reasonably broad brush the analysis illustrates the
relative benefits of this project to others.
68
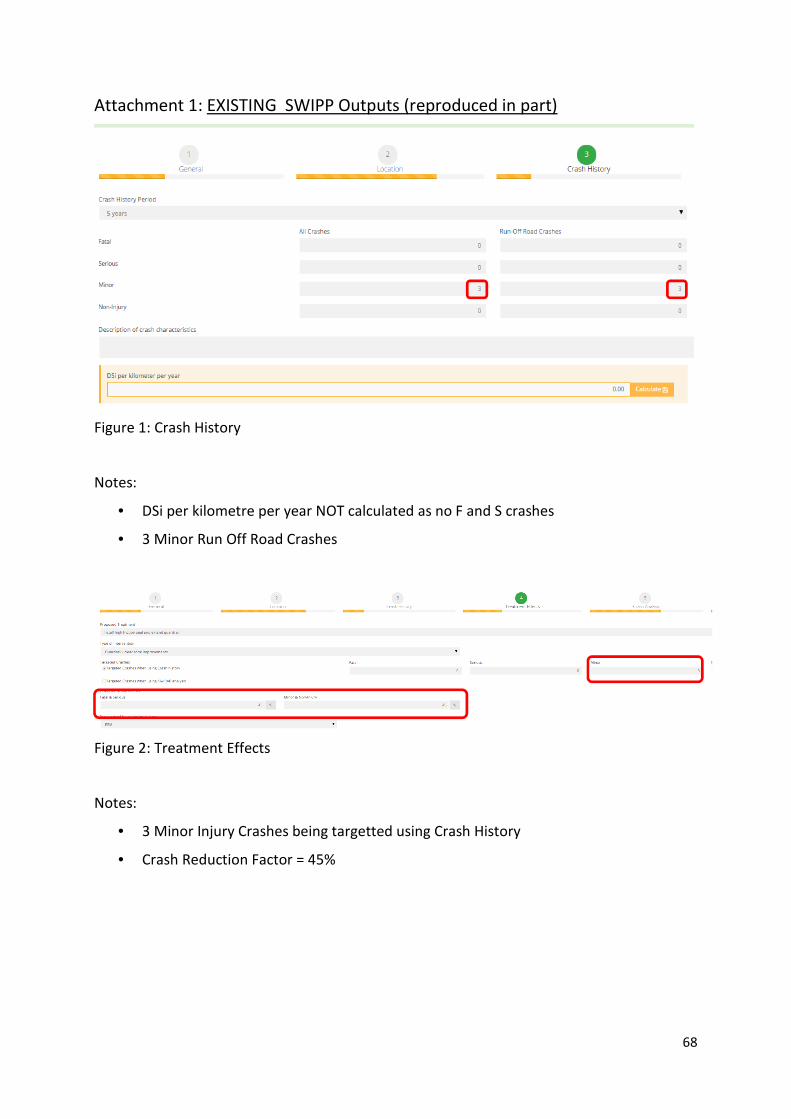
Attachment 1: EXISTING SWIPP Outputs (reproduced in part)
Figure 1: Crash History
Notes:
• DSi per kilometre per year NOT calculated as no F and S crashes
• 3 Minor Run Off Road Crashes
Figure 2: Treatment Effects
Notes:
• 3 Minor Injury Crashes being targetted using Crash History
• Crash Reduction Factor = 45%
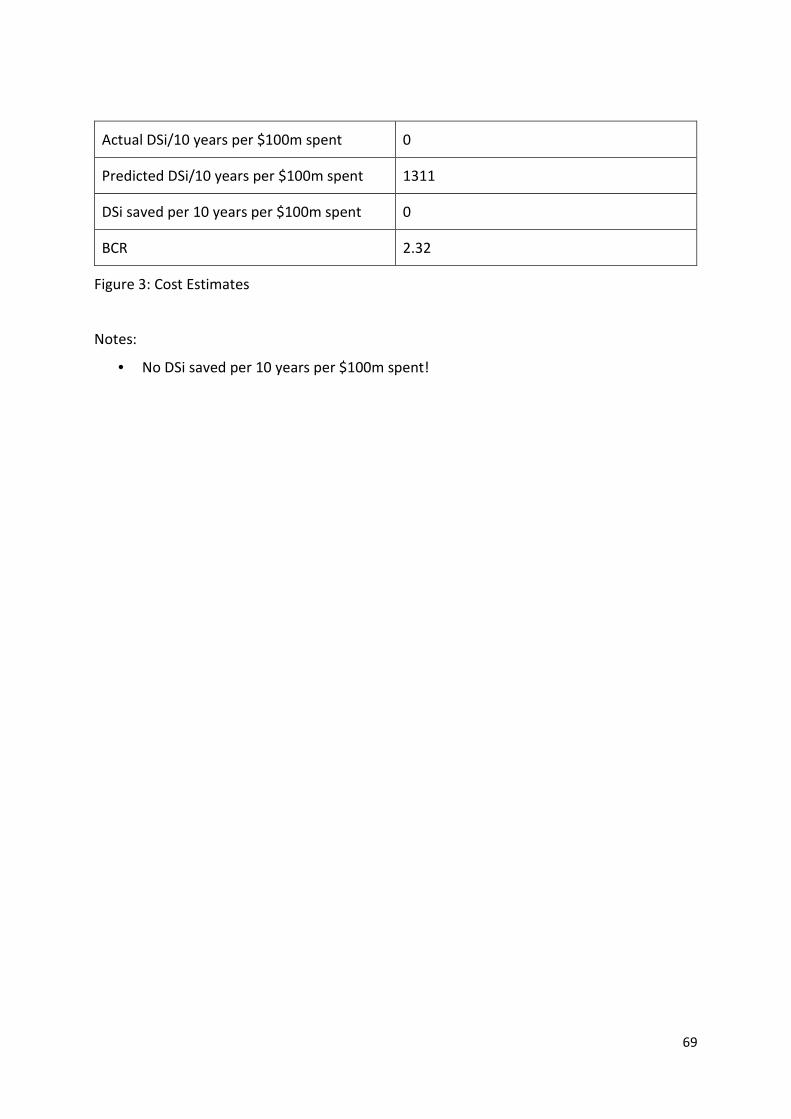
69
Actual DSi/10 years per $100m spent 0
Predicted DSi/10 years per $100m spent 1311
DSi saved per 10 years per $100m spent 0
BCR 2.32
Figure 3: Cost Estimates
Notes:
• No DSi saved per 10 years per $100m spent!
70
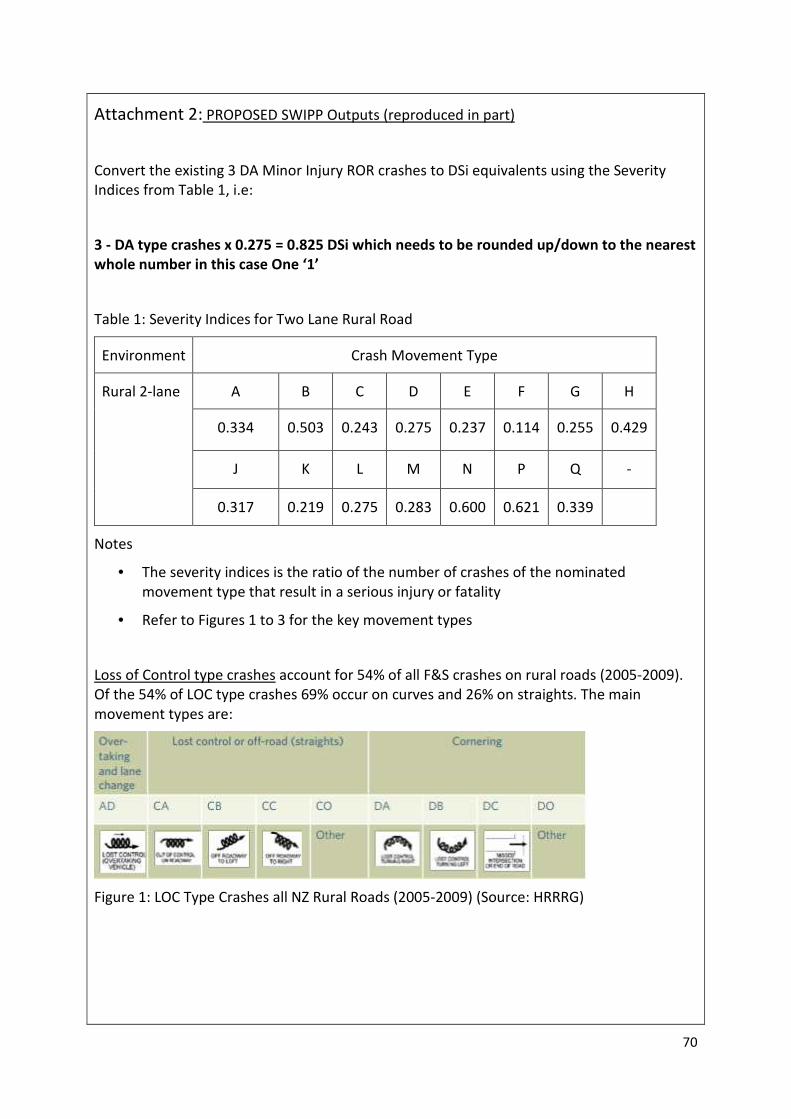
Attachment 2: PROPOSED SWIPP Outputs (reproduced in part)
Convert the existing 3 DA Minor Injury ROR crashes to DSi equivalents using the Severity
Indices from Table 1, i.e:
3 - DA type crashes x 0.275 = 0.825 DSi which needs to be rounded up/down to the nearest
whole number in this case One ‘1’
Table 1: Severity Indices for Two Lane Rural Road
Environment Crash Movement Type
Rural 2-lane A B C D E F G H
0.334 0.503 0.243 0.275 0.237 0.114 0.255 0.429
J K L M N P Q -
0.317 0.219 0.275 0.283 0.600 0.621 0.339
Notes
• The severity indices is the ratio of the number of crashes of the nominated
movement type that result in a serious injury or fatality
• Refer to Figures 1 to 3 for the key movement types
Loss of Control type crashes account for 54% of all F&S crashes on rural roads (2005-2009).
Of the 54% of LOC type crashes 69% occur on curves and 26% on straights. The main
movement types are:
Figure 1: LOC Type Crashes all NZ Rural Roads (2005-2009) (Source: HRRRG)
71
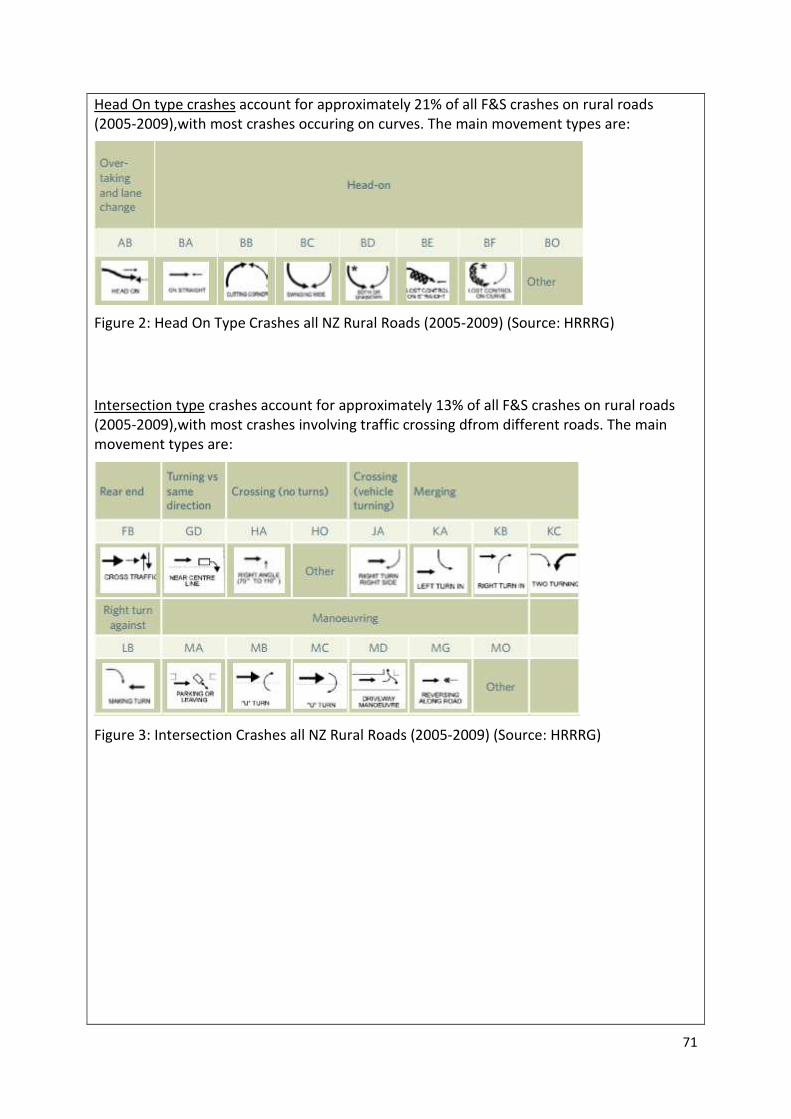
Head On type crashes account for approximately 21% of all F&S crashes on rural roads
(2005-2009),with most crashes occuring on curves. The main movement types are:
Figure 2: Head On Type Crashes all NZ Rural Roads (2005-2009) (Source: HRRRG)
Intersection type crashes account for approximately 13% of all F&S crashes on rural roads
(2005-2009),with most crashes involving traffic crossing dfrom different roads. The main
movement types are:
Figure 3: Intersection Crashes all NZ Rural Roads (2005-2009) (Source: HRRRG)
72
Figure 4: Crash History using DSi’s
Figure 5: Treatment Effects using DSi’s
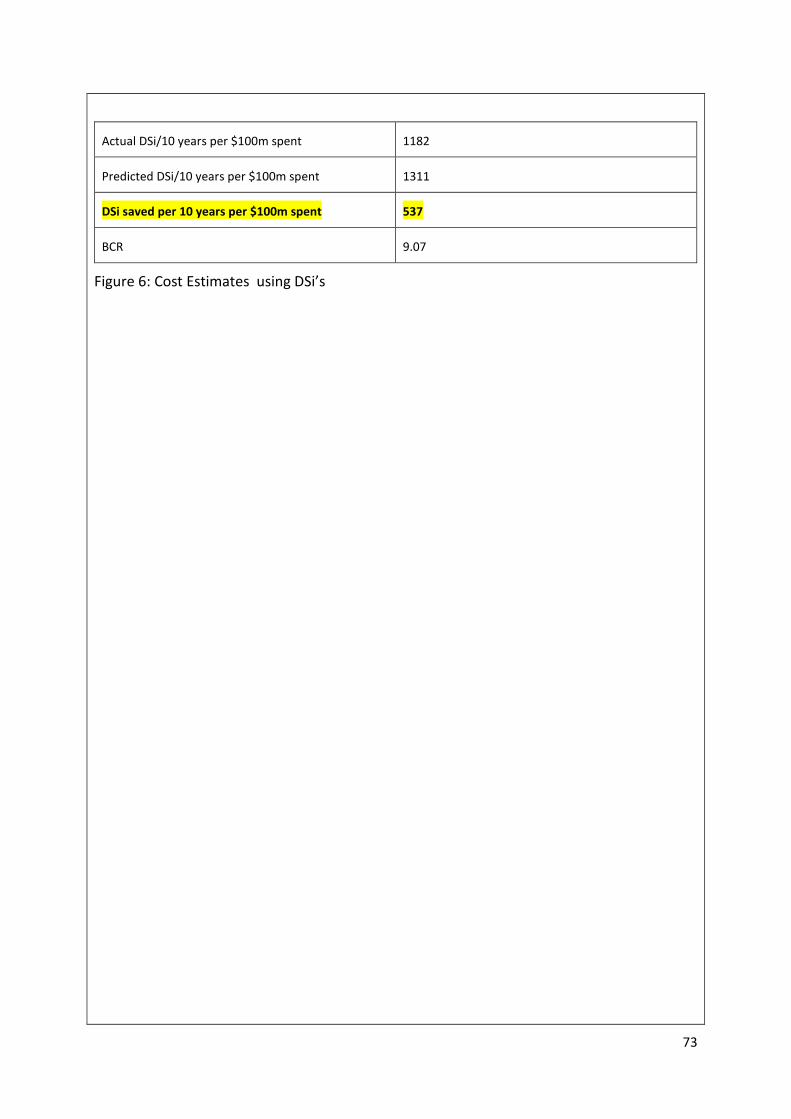
73
Actual DSi/10 years per $100m spent 1182
Predicted DSi/10 years per $100m spent 1311
DSi saved per 10 years per $100m spent 537
BCR 9.07
Figure 6: Cost Estimates using DSi’s
74
Case 5: Schools Study
Notes
1. Challenges:
a. Difficulty in responding to schools for requests for engineering treatments such
as reduced speed limits
2. Proposed Solution:
a. Stage 1 involves undertaking an area wide study in year 1.
b. DSi saved/ 10 years/ $100m spent based on the number of crashes outside
schools and an assumed reduction following the implementation of treatment
options as part of Stage 2.
c. Stage 2 involves the implementation of treatment options identified in Stage 1
and may be based on the risk metrics contained with ‘safer Journeys for Rural
Schools’
3. Recommended SWIPP example: TARA-85-SH3

75
Appendix 4 – SWIPP Exercises

76
Page left intentionally blank
77
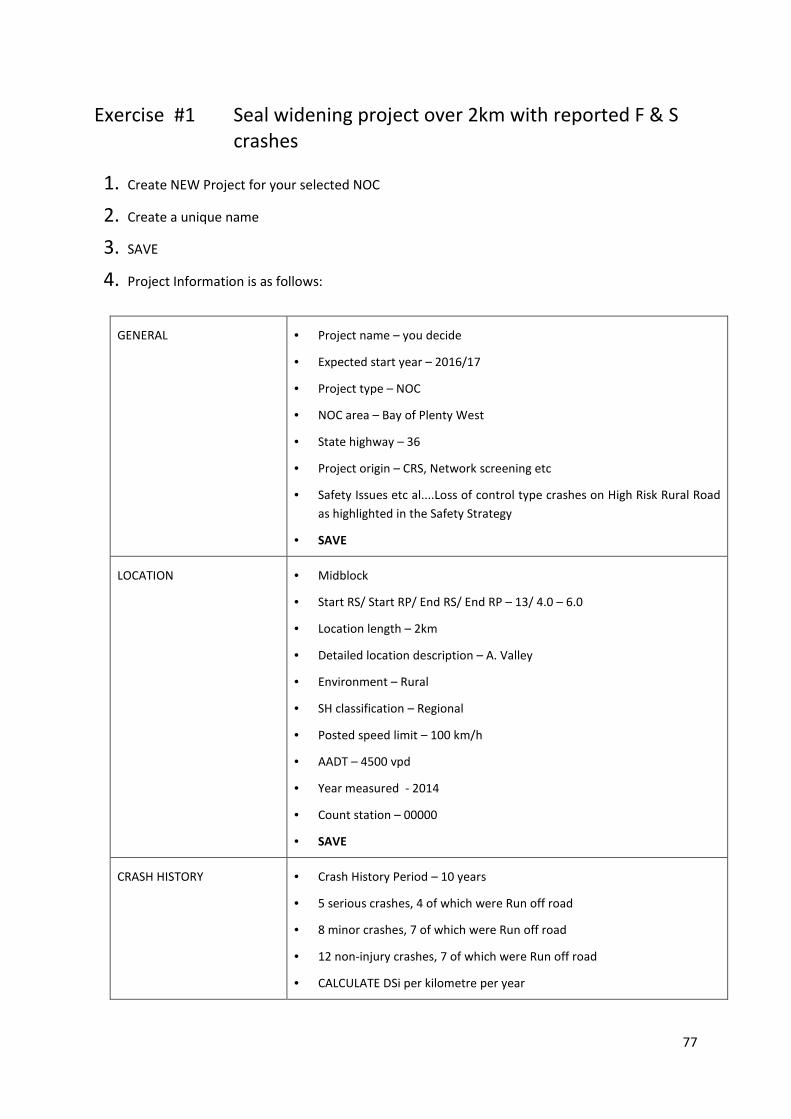
Exercise #1 Seal widening project over 2km with reported F & S
crashes
1. Create NEW Project for your selected NOC
2. Create a unique name
3. SAVE
4. Project Information is as follows:
GENERAL • Project name – you decide
• Expected start year – 2016/17
• Project type – NOC
• NOC area – Bay of Plenty West
• State highway – 36
• Project origin – CRS, Network screening etc
• Safety Issues etc al....Loss of control type crashes on High Risk Rural Road
as highlighted in the Safety Strategy
• SAVE
LOCATION • Midblock
• Start RS/ Start RP/ End RS/ End RP – 13/ 4.0 – 6.0
• Location length – 2km
• Detailed location description – A. Valley
• Environment – Rural
• SH classification – Regional
• Posted speed limit – 100 km/h
• AADT – 4500 vpd
• Year measured - 2014
• Count station – 00000
• SAVE
CRASH HISTORY • Crash History Period – 10 years
• 5 serious crashes, 4 of which were Run off road
• 8 minor crashes, 7 of which were Run off road
• 12 non-injury crashes, 7 of which were Run off road
• CALCULATE DSi per kilometre per year
78
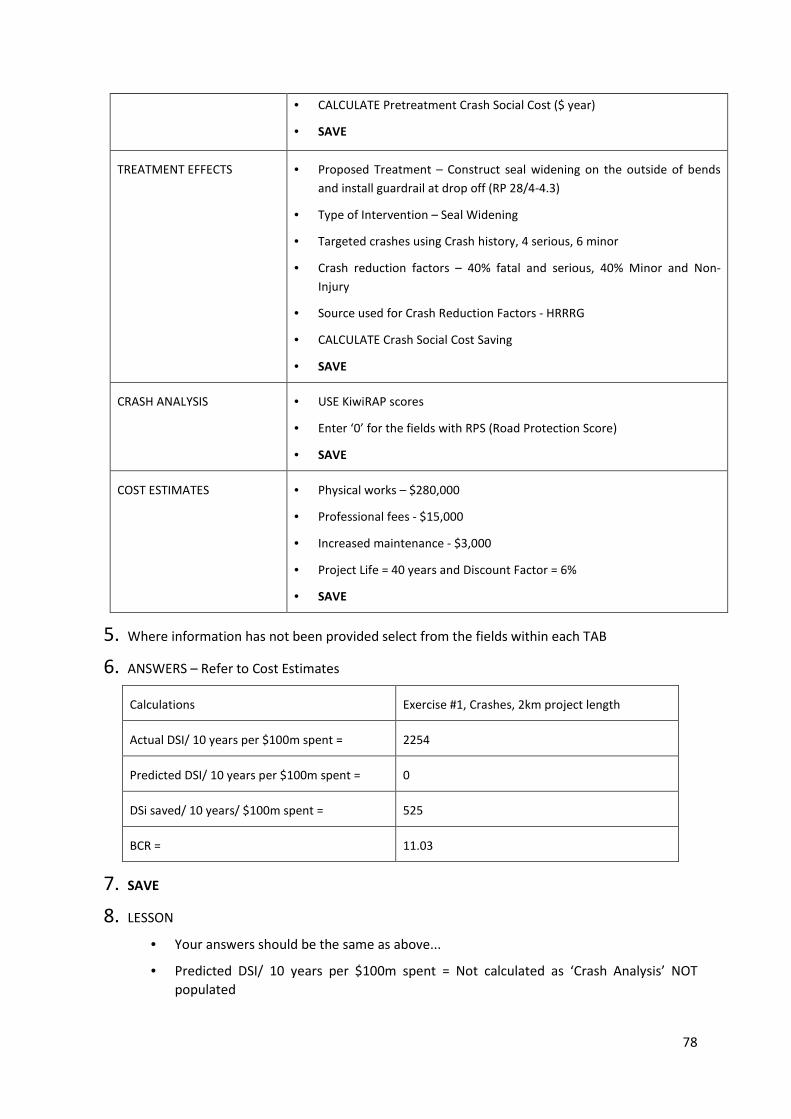
5. Where information has not been provided select from the fields within each TAB
6. ANSWERS – Refer to Cost Estimates
Calculations Exercise #1, Crashes, 2km project length
Actual DSI/ 10 years per $100m spent = 2254
Predicted DSI/ 10 years per $100m spent = 0
DSi saved/ 10 years/ $100m spent = 525
BCR = 11.03
7. SAVE
8. LESSON
• Your answers should be the same as above...
• Predicted DSI/ 10 years per $100m spent = Not calculated as ‘Crash Analysis’ NOT
populated
• CALCULATE Pretreatment Crash Social Cost ($ year)
• SAVE
TREATMENT EFFECTS • Proposed Treatment – Construct seal widening on the outside of bends
and install guardrail at drop off (RP 28/4-4.3)
• Type of Intervention – Seal Widening
• Targeted crashes using Crash history, 4 serious, 6 minor
• Crash reduction factors – 40% fatal and serious, 40% Minor and Non-
Injury
• Source used for Crash Reduction Factors - HRRRG
• CALCULATE Crash Social Cost Saving
• SAVE
CRASH ANALYSIS • USE KiwiRAP scores
• Enter ‘0’ for the fields with RPS (Road Protection Score)
• SAVE
COST ESTIMATES • Physical works – $280,000
• Professional fees - $15,000
• Increased maintenance - $3,000
• Project Life = 40 years and Discount Factor = 6%
• SAVE
79
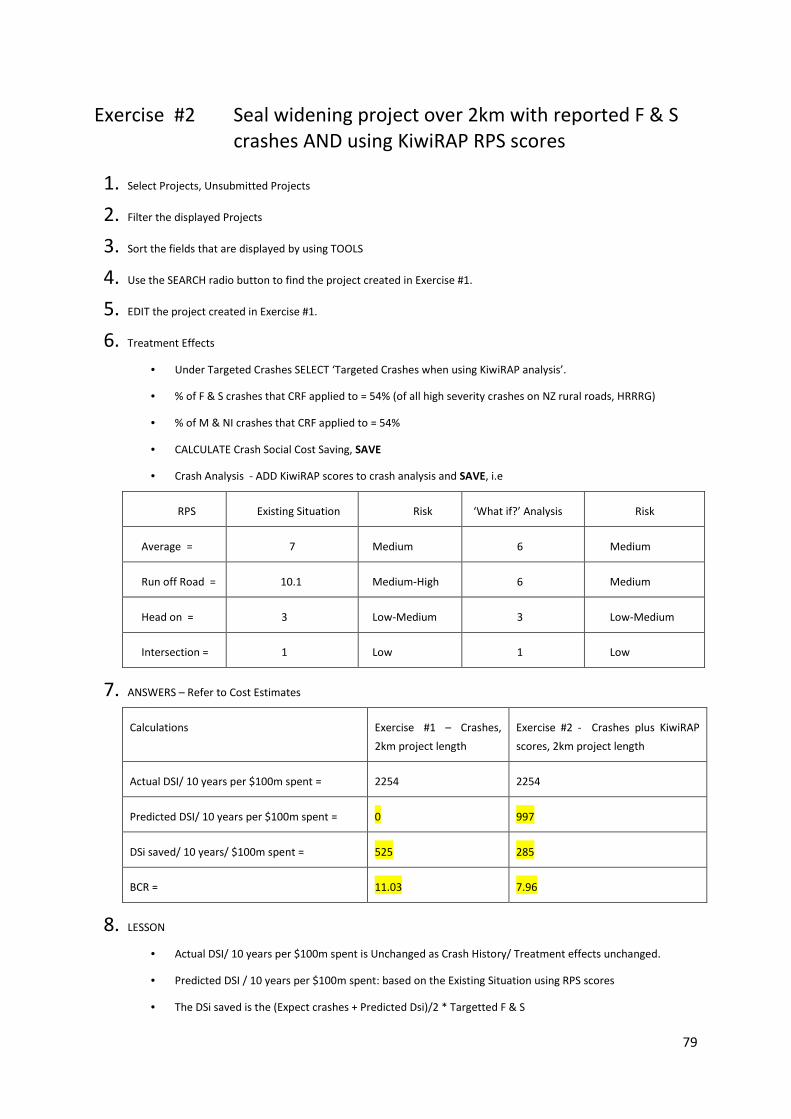
Exercise #2 Seal widening project over 2km with reported F & S
crashes AND using KiwiRAP RPS scores
1. Select Projects, Unsubmitted Projects
2. Filter the displayed Projects
3. Sort the fields that are displayed by using TOOLS
4. Use the SEARCH radio button to find the project created in Exercise #1.
5. EDIT the project created in Exercise #1.
6. Treatment Effects
• Under Targeted Crashes SELECT ‘Targeted Crashes when using KiwiRAP analysis’.
• % of F & S crashes that CRF applied to = 54% (of all high severity crashes on NZ rural roads, HRRRG)
• % of M & NI crashes that CRF applied to = 54%
• CALCULATE Crash Social Cost Saving, SAVE
• Crash Analysis - ADD KiwiRAP scores to crash analysis and SAVE, i.e
RPS Existing Situation Risk ‘What if?’ Analysis Risk
Average = 7 Medium 6 Medium
Run off Road = 10.1 Medium-High 6 Medium
Head on = 3 Low-Medium 3 Low-Medium
Intersection = 1 Low 1 Low
7. ANSWERS – Refer to Cost Estimates
Calculations Exercise #1 – Crashes,
2km project length
Exercise #2 - Crashes plus KiwiRAP
scores, 2km project length
Actual DSI/ 10 years per $100m spent = 2254 2254
Predicted DSI/ 10 years per $100m spent = 0 997
DSi saved/ 10 years/ $100m spent = 525 285
BCR = 11.03 7.96
8. LESSON
• Actual DSI/ 10 years per $100m spent is Unchanged as Crash History/ Treatment effects unchanged.
• Predicted DSI / 10 years per $100m spent: based on the Existing Situation using RPS scores
• The DSi saved is the (Expect crashes + Predicted Dsi)/2 * Targetted F & S
80
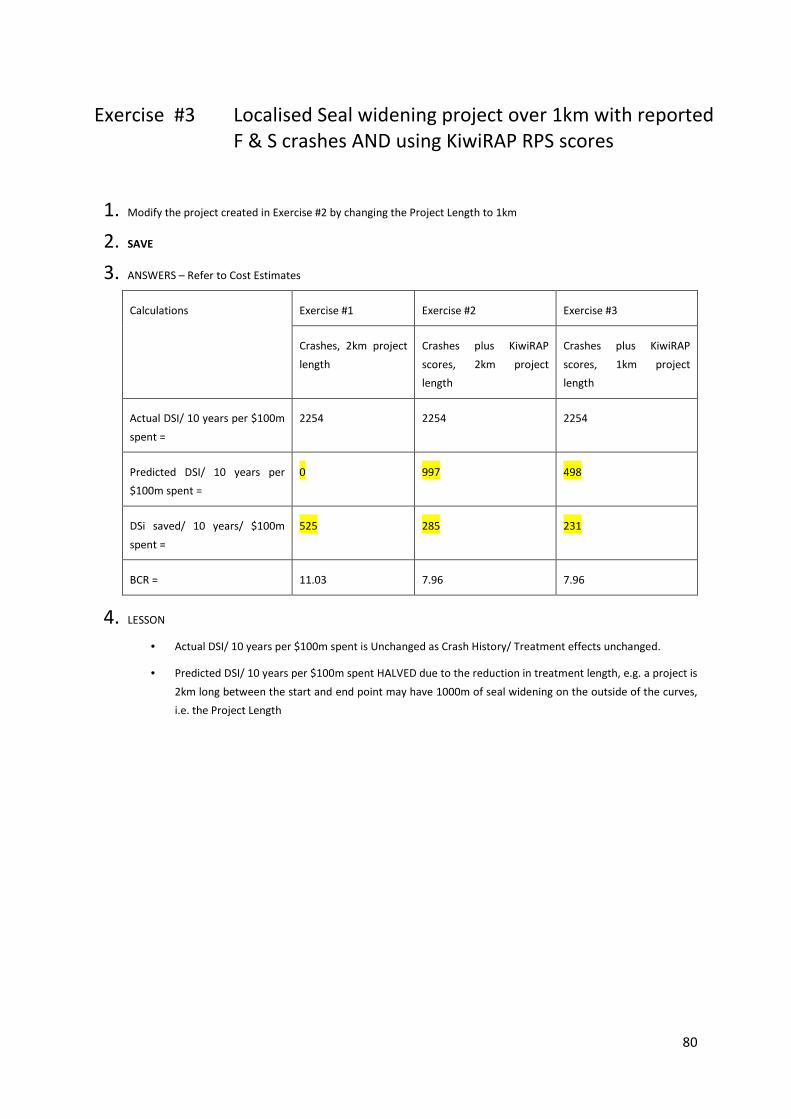
Exercise #3 Localised Seal widening project over 1km with reported
F & S crashes AND using KiwiRAP RPS scores
1. Modify the project created in Exercise #2 by changing the Project Length to 1km
2. SAVE
3. ANSWERS – Refer to Cost Estimates
Calculations Exercise #1 Exercise #2 Exercise #3
Crashes, 2km project
length
Crashes plus KiwiRAP
scores, 2km project
length
Crashes plus KiwiRAP
scores, 1km project
length
Actual DSI/ 10 years per $100m
spent =
2254 2254 2254
Predicted DSI/ 10 years per
$100m spent =
0 997 498
DSi saved/ 10 years/ $100m
spent =
525 285 231
BCR = 11.03 7.96 7.96
4. LESSON
• Actual DSI/ 10 years per $100m spent is Unchanged as Crash History/ Treatment effects unchanged.
• Predicted DSI/ 10 years per $100m spent HALVED due to the reduction in treatment length, e.g. a project is
2km long between the start and end point may have 1000m of seal widening on the outside of the curves,
i.e. the Project Length
81
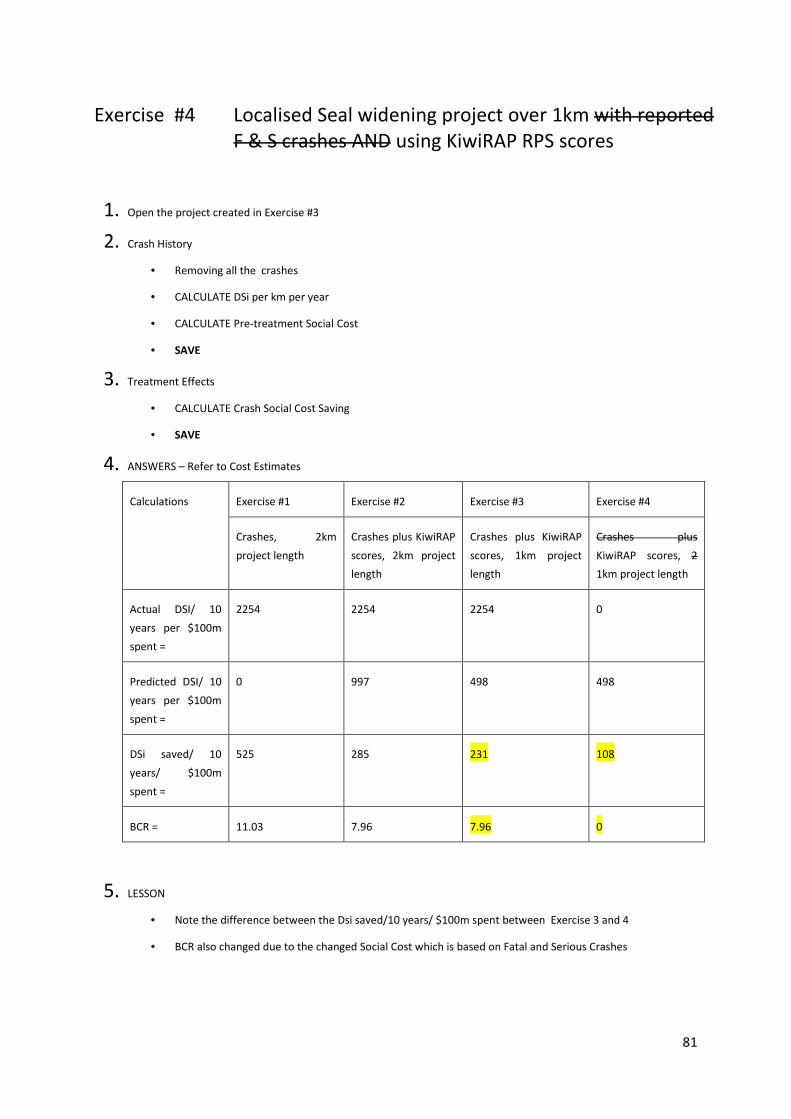
Exercise #4 Localised Seal widening project over 1km with reported
F & S crashes AND using KiwiRAP RPS scores
1. Open the project created in Exercise #3
2. Crash History
• Removing all the crashes
• CALCULATE DSi per km per year
• CALCULATE Pre-treatment Social Cost
• SAVE
3. Treatment Effects
• CALCULATE Crash Social Cost Saving
• SAVE
4. ANSWERS – Refer to Cost Estimates
Calculations Exercise #1 Exercise #2 Exercise #3 Exercise #4
Crashes, 2km
project length
Crashes plus KiwiRAP
scores, 2km project
length
Crashes plus KiwiRAP
scores, 1km project
length
Crashes plus
KiwiRAP scores, 2
1km project length
Actual DSI/ 10
years per $100m
spent =
2254 2254 2254 0
Predicted DSI/ 10
years per $100m
spent =
0 997 498 498
DSi saved/ 10
years/ $100m
spent =
525 285 231 108
BCR = 11.03 7.96 7.96 0
5. LESSON
• Note the difference between the Dsi saved/10 years/ $100m spent between Exercise 3 and 4
• BCR also changed due to the changed Social Cost which is based on Fatal and Serious Crashes

82
Page left intentionally blank
83
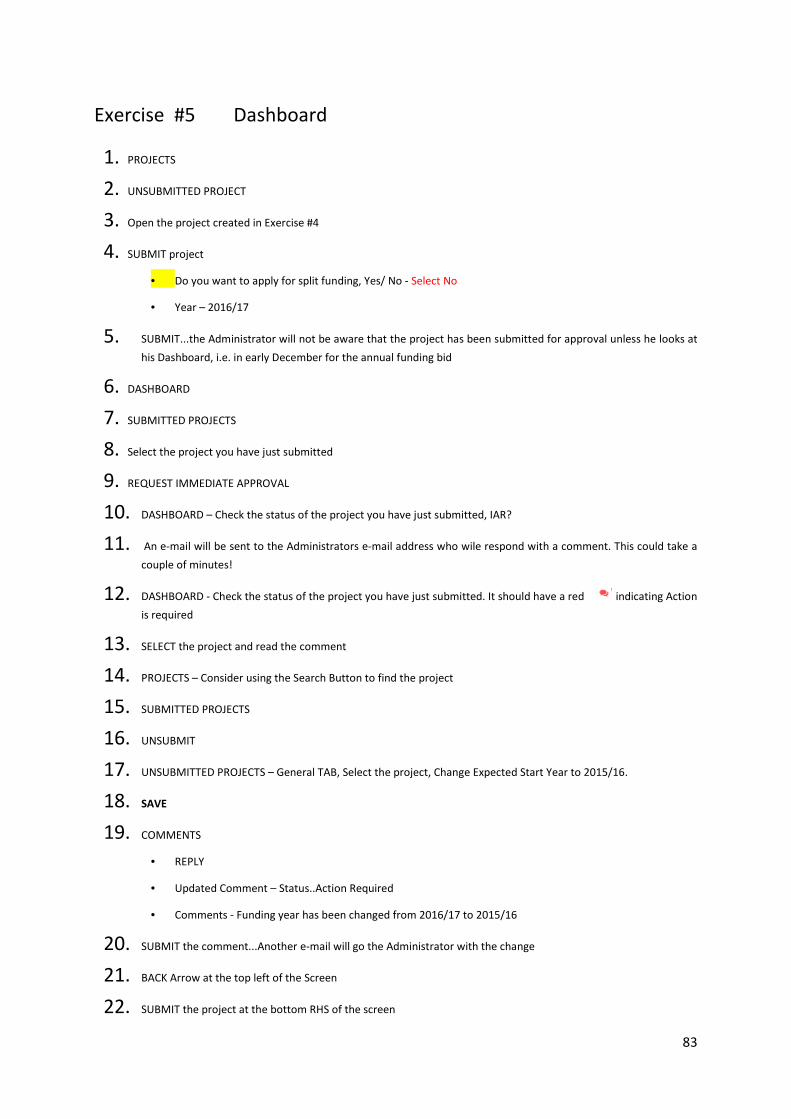
Exercise #5 Dashboard
1. PROJECTS
2. UNSUBMITTED PROJECT
3. Open the project created in Exercise #4
4. SUBMIT project
• Do you want to apply for split funding, Yes/ No - Select No
• Year – 2016/17
5. SUBMIT...the Administrator will not be aware that the project has been submitted for approval unless he looks at
his Dashboard, i.e. in early December for the annual funding bid
6. DASHBOARD
7. SUBMITTED PROJECTS
8. Select the project you have just submitted
9. REQUEST IMMEDIATE APPROVAL
10. DASHBOARD – Check the status of the project you have just submitted, IAR?
11. An e-mail will be sent to the Administrators e-mail address who wile respond with a comment. This could take a
couple of minutes!
12. DASHBOARD - Check the status of the project you have just submitted. It should have a red indicating Action
is required
13. SELECT the project and read the comment
14. PROJECTS – Consider using the Search Button to find the project
15. SUBMITTED PROJECTS
16. UNSUBMIT
17. UNSUBMITTED PROJECTS – General TAB, Select the project, Change Expected Start Year to 2015/16.
18. SAVE
19. COMMENTS
• REPLY
• Updated Comment – Status..Action Required
• Comments - Funding year has been changed from 2016/17 to 2015/16
20. SUBMIT the comment...Another e-mail will go the Administrator with the change
21. BACK Arrow at the top left of the Screen
22. SUBMIT the project at the bottom RHS of the screen
84
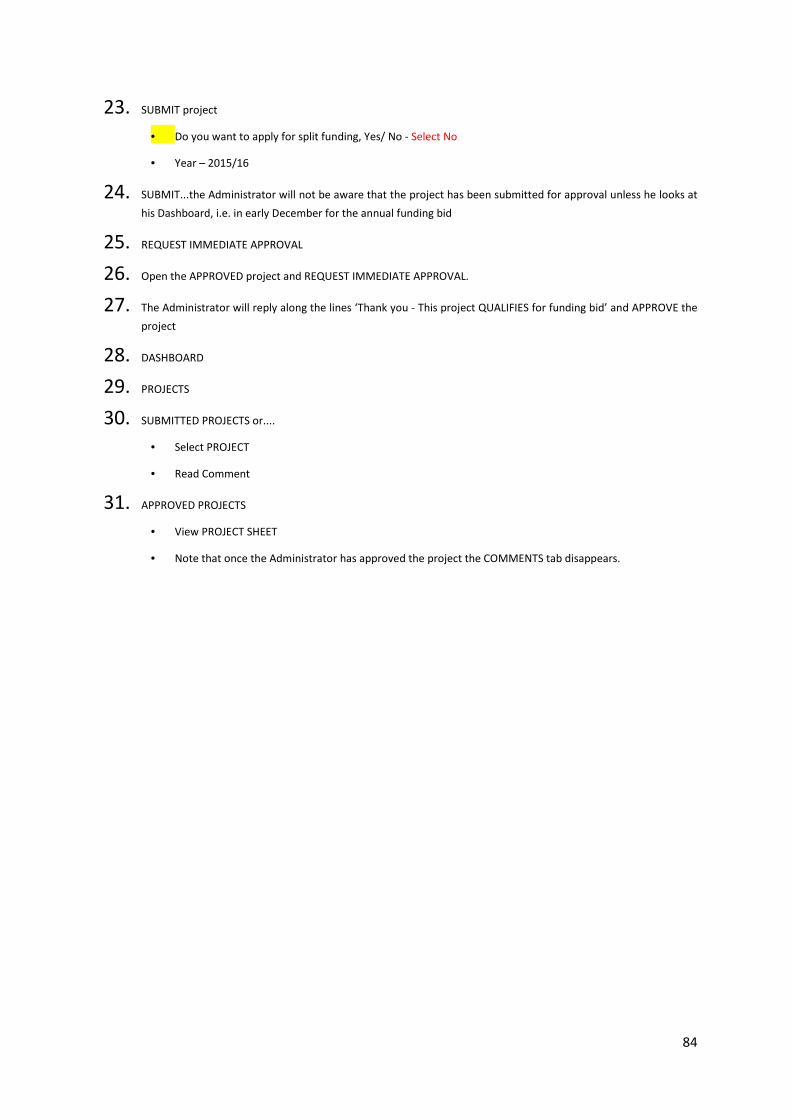
23. SUBMIT project
• Do you want to apply for split funding, Yes/ No - Select No
• Year – 2015/16
24. SUBMIT...the Administrator will not be aware that the project has been submitted for approval unless he looks at
his Dashboard, i.e. in early December for the annual funding bid
25. REQUEST IMMEDIATE APPROVAL
26. Open the APPROVED project and REQUEST IMMEDIATE APPROVAL.
27. The Administrator will reply along the lines ‘Thank you - This project QUALIFIES for funding bid’ and APPROVE the
project
28. DASHBOARD
29. PROJECTS
30. SUBMITTED PROJECTS or....
• Select PROJECT
• Read Comment
31. APPROVED PROJECTS
• View PROJECT SHEET
• Note that once the Administrator has approved the project the COMMENTS tab disappears.
85
Exercise #6 – APPROVED PROJECTS (Optional)
1. PROJECTS/ APPROVED PROJECTS
2. FILTER
3. TOOLS
4. SEARCH using project name
5. Click PROGRESS
6. Click on PROJECT STATUS: Note the changes
7. DESIGN PROGESS: Move bar with mouse – Note the changes to Total Progress
8. MONTHLY COST ESTIMATES
• Change status of each month from F (Forecast) to A (Actual) – Top right of each month
• Enter the monthly cost estimate and click the √
9. VIEW PROJECT SHEET
10. REPORTING TOOL
11. INCLUDE
• Approved Cost/ Actual Cost/ Forecasted Cost
• Projects starting between 2015/16 and 2015/16
• Selected NMA’s – Bay of Plenty West
12. GENERATE REPORT
13. Look at Graph
14. EXPORT as PDF or PNG Image or SVG
15. TABLE
16. Click + button under the ‘Total’ TAB
17. Note the: Nr projects; Nr commenced; Nr completed; Average Progress etc
18. Click + button under the ‘Approved’ TAB
19. Note for each project the: Progress; Approved Cost; Actual Cost to Date; Forecasted Cost etc.
20. Click onto Project – VIEW Project Sheet of the APPROVED project
21. BACK Arrow at the top left of the Screen
22. EXPORT AS XLSX

86
Page left intentionally blank