sustaining lives and the environment through …
TRANSCRIPT

SUSTAINING LIVES AND THE ENVIRONMENT THROUGH LOCAL COLLABORATIVE ENGAGEMENT: CASE OF SELECTED CONSERVATION FARMING VILLAGES IN THE PHILIPPINESLeila D. Landicho and Josefina T. Dizon
University of the Philippines Los Banos
INTRODUCTION
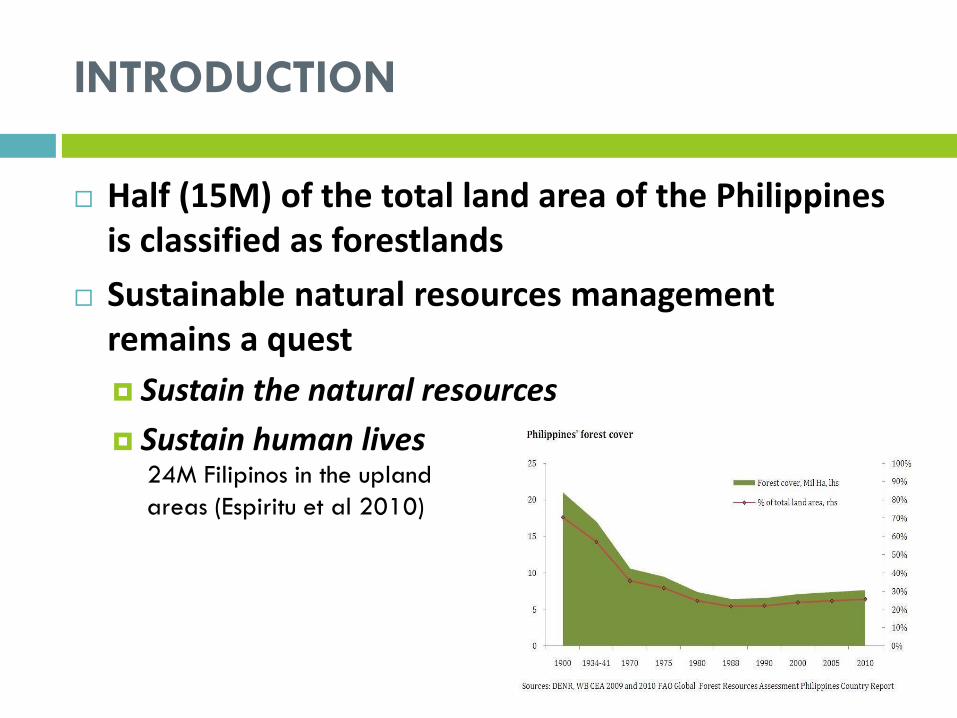
Half (15M) of the total land area of the Philippines is classified as forestlands
Sustainable natural resources management remains a quest
Sustain the natural resources
Sustain human lives24M Filipinos in the upland
areas (Espiritu et al 2010)

THE CFV PROGRAM
LGU SUC
PO
• Capacity-building
programs
• Establishment of
agroforestry model
farms
• Information service and
networking service
organizations
• Marketing arrangements
for livelihood support
mechanisms
• Local multisectoral
partnership
Sustainable
livelihoods and
natural
resources
management
RESEARCH QUESTIONS
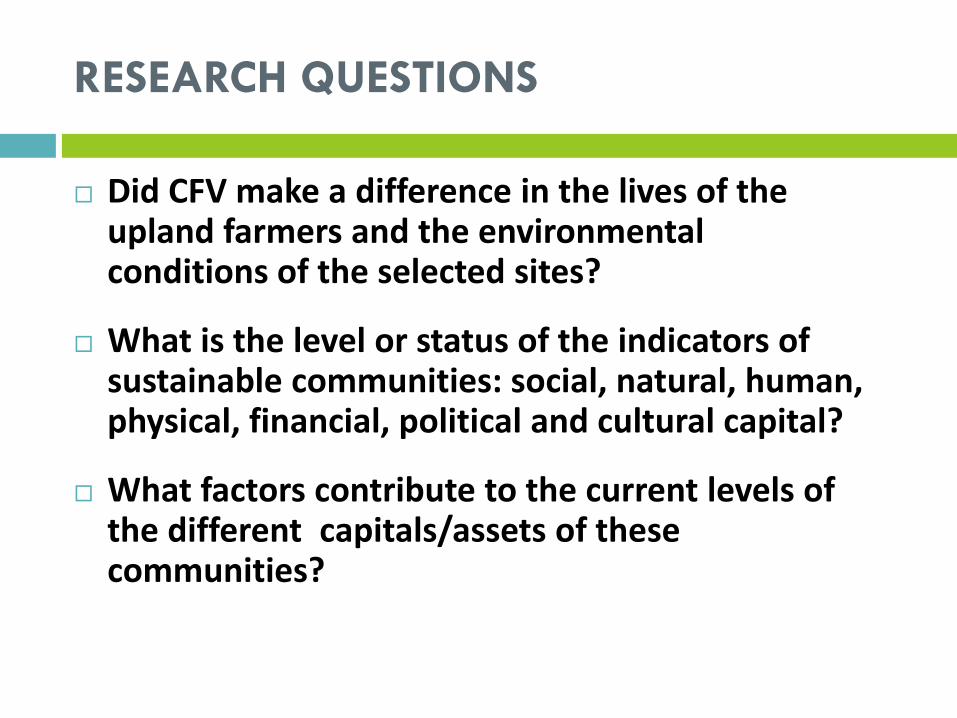
Did CFV make a difference in the lives of the upland farmers and the environmental conditions of the selected sites?
What is the level or status of the indicators of sustainable communities: social, natural, human, physical, financial, political and cultural capital?
What factors contribute to the current levels of the different capitals/assets of these communities?

THEORETICAL FRAMEWORK
COMMUNITY CAPITALS FRAMEWORK
(Cornelia and Flora, 2008)
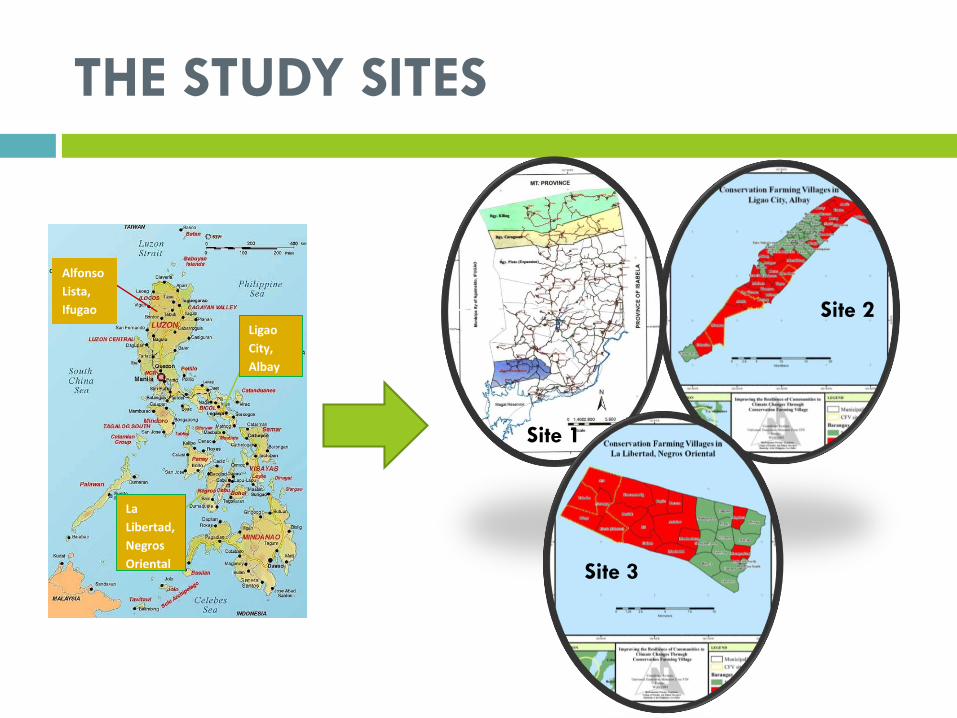
THE STUDY SITES
Alfonso
Lista,
Ifugao
Ligao
City,
Albay
La
Libertad,
Negros
Oriental
Site 1
Site 2
Site 3

METHODOLOGY
Household survey (n=230) , focus group discussion (12 sessions with a total of 147 participants) , key informant interview, direct observation and secondary data gathering
Assessment of the status of the different capitals/assets by farmers
The respondents scored each indicator under each capital 1 for improved; 0 for stable or no change; and -1 for declined.
The level of different capitals was determined using the following scales: -1.00 to -0.50 as very low; -0.51 – 0.00 as low; 0.01-0.50 as moderate; and 0.51 to 1.00 as high level.

RESULTS
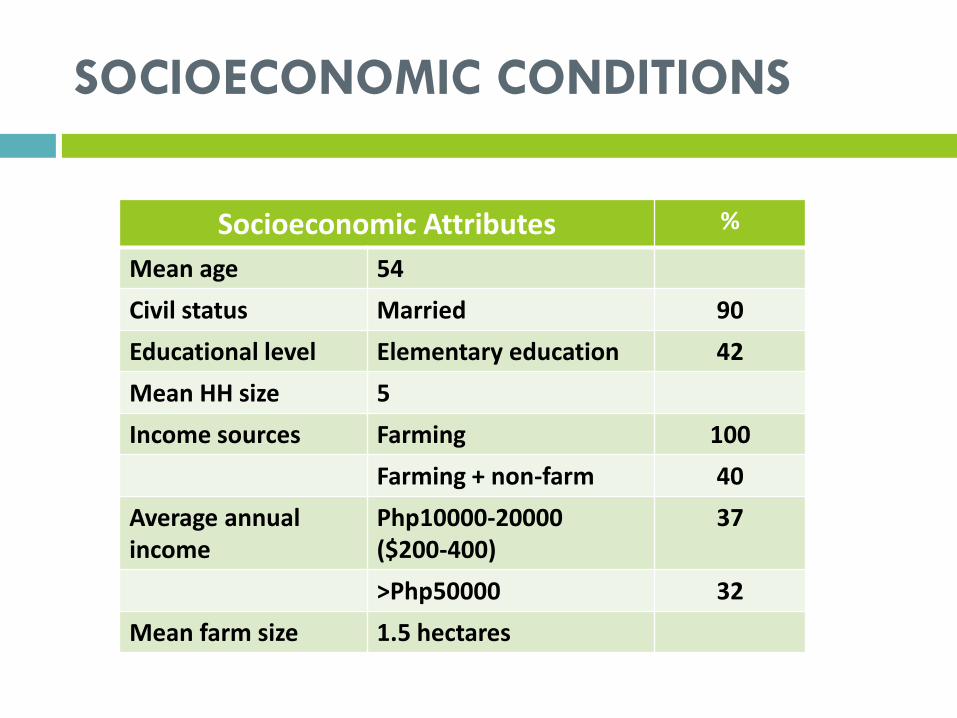
SOCIOECONOMIC CONDITIONS
Socioeconomic Attributes %
Mean age 54
Civil status Married 90
Educational level Elementary education 42
Mean HH size 5
Income sources Farming 100
Farming + non-farm 40
Average annual income
Php10000-20000($200-400)
37
>Php50000 32
Mean farm size 1.5 hectares

BIOPHYSICAL CONDITIONS
Biophysical conditions %
Topography Rolling 36
Steep 32
Flat 32
Source of water Rainfed 100
Creek/Spring 43

Social capital
INDICATORS Site 1 Site 2 Site 3
Communication and
interaction of the
community members
0.83 0.78 1.00
Participation to the
community activities such
as bayanihan
0.68 0.81 1.00
Partnership with external
organizations0.25 0.76 1.00
TOTAL MEAN SCORE 0.59
High
0.78
High
1.00
High
• Strong bonding between the community members
• Most of the members were natives to the community
• Active membership to CFV Farmers’ Association
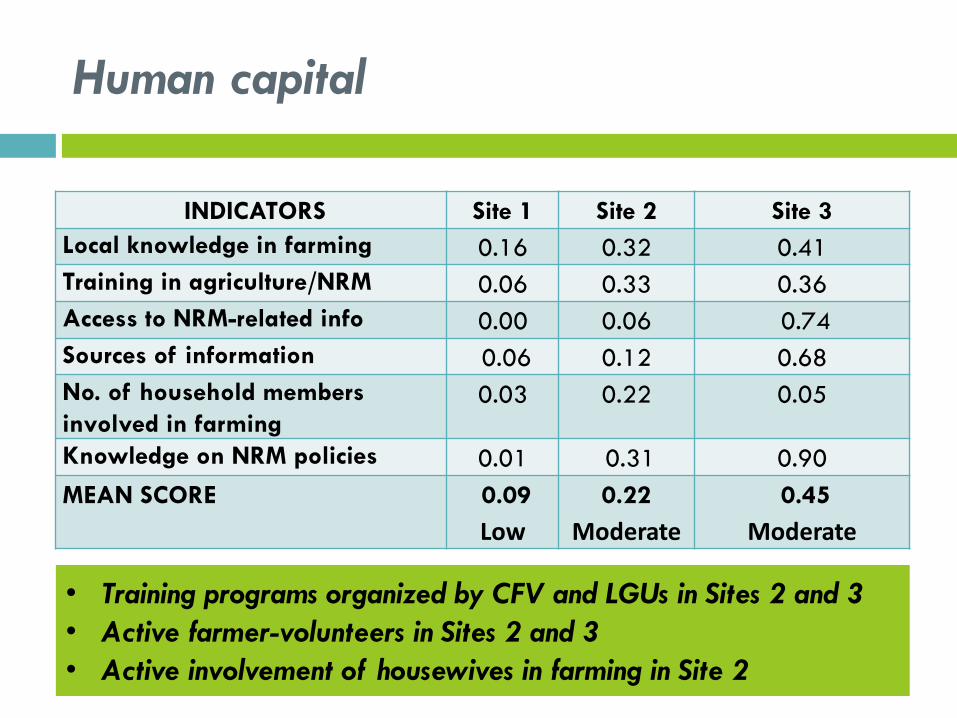
Human capital
INDICATORS Site 1 Site 2 Site 3
Local knowledge in farming 0.16 0.32 0.41
Training in agriculture/NRM 0.06 0.33 0.36
Access to NRM-related info 0.00 0.06 0.74
Sources of information 0.06 0.12 0.68
No. of household members
involved in farming0.03 0.22 0.05
Knowledge on NRM policies 0.01 0.31 0.90
MEAN SCORE 0.09
Low
0.22
Moderate
0.45
Moderate
• Training programs organized by CFV and LGUs in Sites 2 and 3
• Active farmer-volunteers in Sites 2 and 3
• Active involvement of housewives in farming in Site 2

Natural capital
INDICATORS Site 1 Site 2 Site 3
Soil fertility 0.16 0.37 0.13
Farm productivity 0.10 0.46 0.42
Less occurrence of soil
erosion
0.06 0.60 0.27
Access to water resources 0.13 0.05 0.97
MEAN SCORE 0.008
Low0.27
Moderate0.45
Moderate
• Sustained adoption of soil and water conservation measures in Sites 2 and 3
• Contour hedgerows• Crop diversification/agroforestry• No cutting of trees policy in Site 3
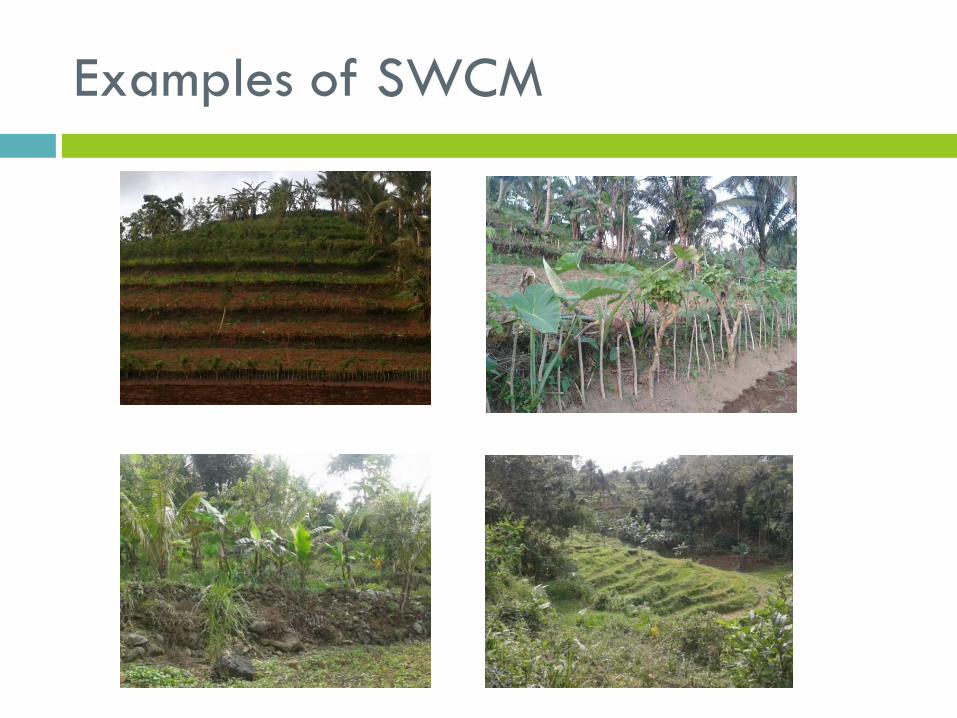
Examples of SWCM

Physical capital
INDICATORS Site 1 Site 2 Site 3
Farm tools/equipment 0.03 0.22 0.15
Post-harvest facilities 0.06 0.03 0.06
Transportation facilities 0.00 0.25 0.75
Farm-to-market road 0.10 0.22 -0.07
Market outlets 0.70 0.01 0.80
Distance of market
outlets0.10 0.19 0.10
MEAN SCORE 0.17
Moderate
0.15
Moderate
0.22
Moderate
• Lack of post-harvest facilities and infrastructure• Providing farmers’ access to market by LGU in Site 3• Conduct of upland farmers’ market day in Site 3• Assured market for corn in Site 1

Farm-to-market roads
Site 3Site 2

Financial capital
INDICATORS Site 1 Site 2 Site 3
Sources of household
income
0.20 0.28 0.54
Income from farming 0.93 0.40 0.40
Income from non-farm 0.13 0.02 0.28
Household savings 0.16 0.00 0.22MEAN SCORE 0.35
Moderate
0.17
Moderate
0.16
Moderate
• High market price and assured market of corn (animal feeds) in Site 1
• Commercial production vs subsistence
• Mean farm size of 2.06 in Site 1; 1.05 in Site 2; 1.5 in Site 3
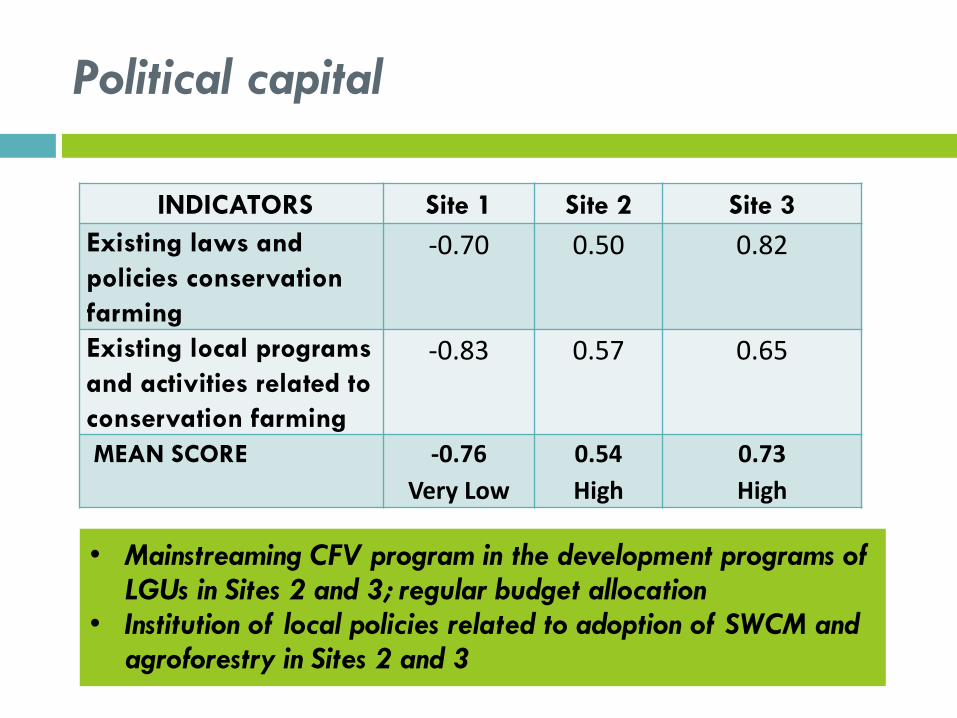
Political capital
INDICATORS Site 1 Site 2 Site 3
Existing laws and
policies conservation
farming
-0.70 0.50 0.82
Existing local programs
and activities related to
conservation farming
-0.83 0.57 0.65
MEAN SCORE -0.76
Very Low
0.54
High
0.73
High
• Mainstreaming CFV program in the development programs of LGUs in Sites 2 and 3; regular budget allocation
• Institution of local policies related to adoption of SWCM and agroforestry in Sites 2 and 3
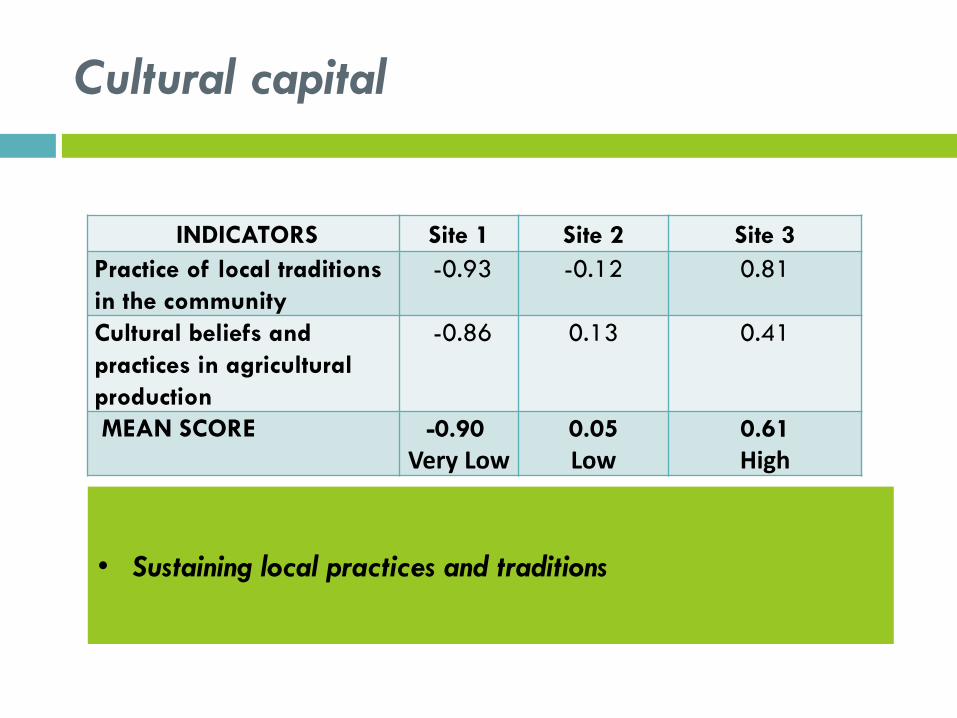
Cultural capital
INDICATORS Site 1 Site 2 Site 3
Practice of local traditions
in the community
-0.93 -0.12 0.81
Cultural beliefs and
practices in agricultural
production
-0.86 0.13 0.41
MEAN SCORE -0.90
Very Low0.05
Low0.61
High
• Sustaining local practices and traditions

Sustainability level
COMMUNITY
CAPITALS
Site 1 Site 2 Site 3
Social 0.59 0.78 1.00
Human 0.04 0.15 0.34
Natural 0.04 0.15 0.44
Financial 0.35 0.17 0.16
Physical 0.16 0.07 0.25
Political -0.76 0.54 0.73
Cultural -0.90 0.05 0.61
MEAN SCORE -0.06 0.27 0.50
ADJECTIVAL
RATING
LOW MODERATE MODERATE

CONCLUSIONS
CFV made a difference in the socioeconomic and ecological dimensions of natural resources management in the three upland farming communities
The three upland farming communities vary in the levels of community assets/capitals; challenge of striking a balance among the seven capitals
Sustainability of upland farming communities does not solely rely on the driver of change
Local collaborative engagement is a key factor towards the sustainability of the upland farming communities
Interplay between the local government units and the community
Interplay between and among community members

IMPLICATIONS AND RECOMMENDATIONS
An interplay of the community resources, particularly the local government units and the existing structures and processes within the community is necessary to establish a balance among the seven community capitals.
The interventions and programs that should be developed and implemented towards promoting sustainable upland farming communities should be holistic such that the seven community assets, namely: human, social, natural, physical, financial, cultural and political assets could be properly invested