sustainable transportation in canada - unb · sustainable transportation in canada yuri v....
TRANSCRIPT
SUSTAINABLE TRANSPORTATION IN CANADA
Yuri V. Yevdokimov, Assistant Professor Departments of Economics and Civil Engineering
University of New Brunswick Fredericton, New Brunswick, Canada E3B 5A3
Ph: (506) 447-3221, Fax: (506) 453-4514, E-mail: [email protected]
Introduction: Historical Background
The concept of sustainable development has been known to economists for many
years. Originally the economic approach to sustainability was based on the Fisher (1906),
Hicks (1939) and Lindahl (1933) concept of income as the maximum that we can
consume without reducing our wealth. This principle was further generalized and
developed in works of Hartwick (1977) and Solow (1986, 1992). In the 1990s, the
concept of sustainable development was formalized as the maximization of net benefits
of economic and social development subject to maintaining the stock of natural resources
over time (Munasinghe, 1993). Although the framework of analysis has changed over the
years, its general structure has been preserved by economists as the one that involved an
economic criterion reflecting net social benefits plus sustainability constraints.
It appears that the development of models of sustainable transportation mostly ignored
this structure. Only recent studies came close to the original interpretation of the
sustainable development as it evolved in economic literature. To understand this
statement, it is necessary to take a brief historical tour into sustainable transportation.
Substantial interest in sustainable transportation can be dated back to the early 1990s.
While recognizing the three dimensions of sustainable development, namely the
economic, social and environmental, the focus of early research was on the economic and
1
environmental dimensions. This was due to the fact that transport activity was seen as a
major concern from the viewpoint of the following three global environmental impacts:
- emissions of greenhouse gases;
- emissions of compounds that thin the stratospheric ozone layer;
- transport-related production of Persistent Organic Pollutants (POP) and their effects on
biological systems.
The initiative of early studies in sustainable transportation came from the Organization
for Economic Cooperation and Development (OECD) who in 1994 set in motion the so-
called Environmentally Sustainable Transport (EST) project. Nine countries contributed
to the project with the case studies based on internationally recognized and accepted six
criteria: (i) noise, (ii) land use, (iii) emissions of carbon dioxide, (iv) emissions of
nitrogen oxides; (v) volatile organic compounds, and (vi) particulate matter. The case
studies were based on a scenario approach with respect to the “business-as-usual”
projections for the year of 2030 in relation to conditions in 1990.
Basic results of the EST project were presented at the International Conference on
Environmentally Sustainable Transport in Vienna (Austria) in October 4-6, 2000.
Essentially, the EST project reflects the mainstream understanding of sustainable
transportation, which is discussed later in this paper.
A turning point in the history of sustainable transportation was the OECD Conference
“Towards Sustainable Transportation” in 1996 in Vancouver (Canada). The so-called
Vancouver Principles for Sustainable Transport were formulated, which included such
criteria as equal access to transportation networks, individual and community
2
responsibility, health and safety, education and public participation, integrated planning,
land and resource use, pollution prevention, and economic well-being.
Based on these principles, strategic directions in transportation with respect to its
sustainability were identified. The final message of the Vancouver Conference was: “…
Every effort should be made to encourage and invite further work on the development
and wider dissemination of this set of principles”. The message was heard in Canada and
that year the Centre for Sustainable Transportation was created by Environment Canada
and Transport Canada. Since 1996, the Centre has sponsored two major projects: (i) the
Sustainable Transportation Performance Indicators (STPI) project, and (ii) the University
Curriculum project. However, the major achievement of the Centre to date is its
internationally recognized definition of a sustainable transportation system because
unlike other definitions it incorporates all three dimensions of the sustainability with
respect to transportation.
Development of international issues of sustainable transportation continued in 1998
with the Workshop on Sustainable Transportation in Ottawa (October 20-21, 1998). In
the Vancouver Conference and Ottawa Workshop, the social dimension began to play a
larger role in the concept of sustainable transportation (Pearl, 1998).
Presently, any national or international conference on transportation includes a section
on sustainability of transportation. The latest example is the International Conference on
Transportation Operations and Planning, held in Chennai (India) on February 18-20,
2004. Five papers were directly associated with sustainability of transportation. The
inclusion of sustainability highlights the significance of this issue in different parts of the
3
world. This, in turn, signifies that we should pay greater attention to the sustainability of
the Canadian transportation.
Economic, environmental and social impacts of transportation in Canada
Apart from its strategic role, the size of the transportation service industry in Canada
is significant. This sector is larger than the agriculture, fishing and trapping, logging and
forestry industries combined. According to the annual report of Transport Canada, in
2002 commercial transportation industries in Canada accounted for $39 billion or 4
percent of the value-added GDP. In turn, transportation expenditures amounted to $161
billion or 14.1 percent of total expenditures in the Canadian economy. Besides,
investment in transportation made up 3.3 percent of the GDP, which shows a 0.2 percent
increase compared to 2001. Over the last five years until 2002, the number of full-time
jobs related to transportation totalled more than 800,000.
However, over time as population has increased, cities have grown, and globalization
and free trade have increased the regional and international movement of people and
goods, our transportation infrastructure and systems have expanded dramatically. The
cars, trucks, buses, subways, trains, airplanes, ships and ferries that we use to move
ourselves and our goods today have significant implications in terms of energy and
material resource use, environmental pollution, noise and land use at local, regional and
global level.
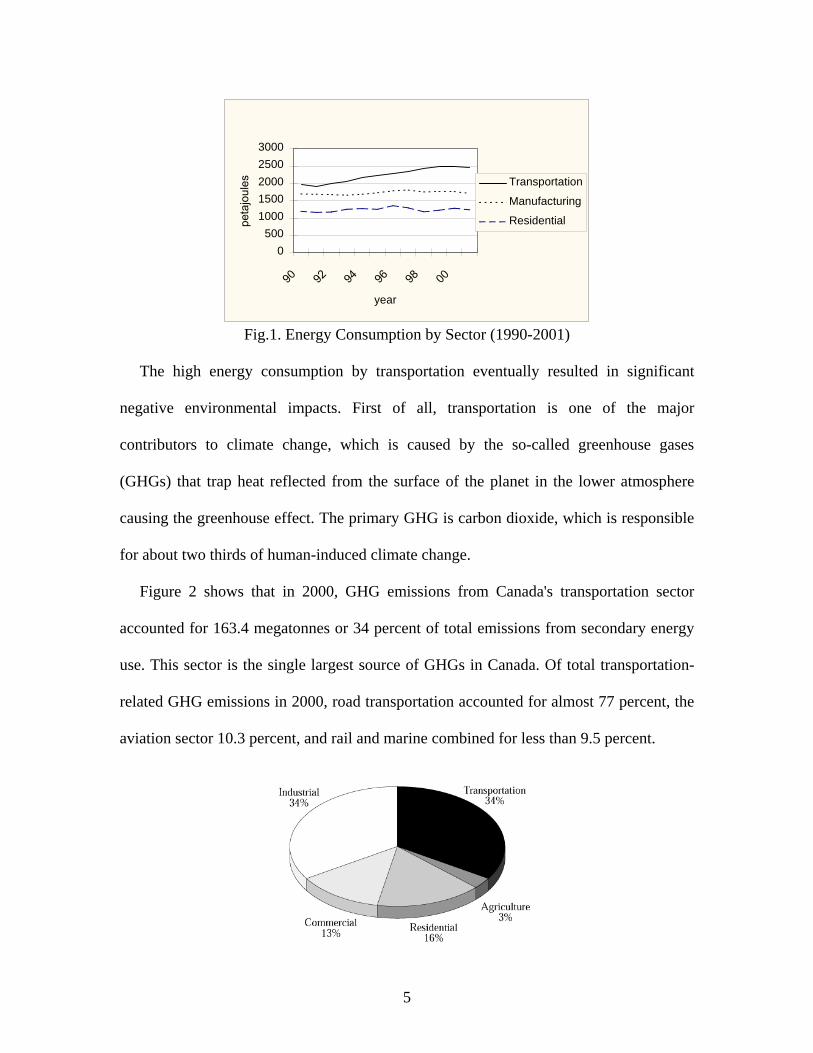
Transportation in Canada has been a chief consumer of energy for years as shown in
figure 1. The figure shows increasing energy consumption by transportation over time.
4
0500
10001500200025003000
90 92 94 96 98 00
year
petajoules Transportation
Manufacturing
Residential
Fig.1. Energy Consumption by Sector (1990-2001)
The high energy consumption by transportation eventually resulted in significant
negative environmental impacts. First of all, transportation is one of the major
contributors to climate change, which is caused by the so-called greenhouse gases
(GHGs) that trap heat reflected from the surface of the planet in the lower atmosphere
causing the greenhouse effect. The primary GHG is carbon dioxide, which is responsible
for about two thirds of human-induced climate change.
Figure 2 shows that in 2000, GHG emissions from Canada's transportation sector
accounted for 163.4 megatonnes or 34 percent of total emissions from secondary energy
use. This sector is the single largest source of GHGs in Canada. Of total transportation-
related GHG emissions in 2000, road transportation accounted for almost 77 percent, the
aviation sector 10.3 percent, and rail and marine combined for less than 9.5 percent.
5
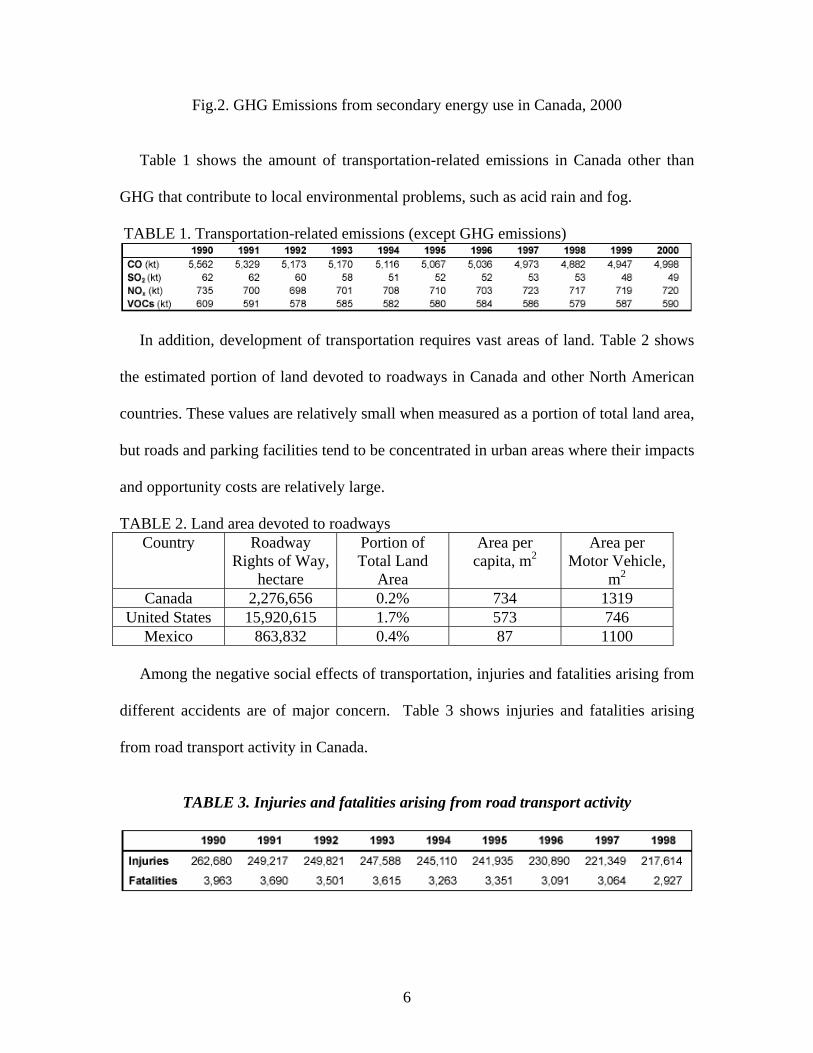
Fig.2. GHG Emissions from secondary energy use in Canada, 2000
Table 1 shows the amount of transportation-related emissions in Canada other than
GHG that contribute to local environmental problems, such as acid rain and fog.
TABLE 1. Transportation-related emissions (except GHG emissions)
In addition, development of transportation requires vast areas of land. Table 2 shows
the estimated portion of land devoted to roadways in Canada and other North American
countries. These values are relatively small when measured as a portion of total land area,
but roads and parking facilities tend to be concentrated in urban areas where their impacts
and opportunity costs are relatively large.
TABLE 2. Land area devoted to roadways Country Roadway
Rights of Way, hectare
Portion of Total Land
Area
Area per capita, m2
Area per Motor Vehicle,
m2
Canada 2,276,656 0.2% 734 1319 United States 15,920,615 1.7% 573 746
Mexico 863,832 0.4% 87 1100 Among the negative social effects of transportation, injuries and fatalities arising from
different accidents are of major concern. Table 3 shows injuries and fatalities arising
from road transport activity in Canada.
TABLE 3. Injuries and fatalities arising from road transport activity
6
These negative environmental and social impacts of transportation lead to the overall
conclusion that the transportation system in Canada may not be following a sustainable
path. Therefore, it was necessary to develop a comprehensive framework of socio-
economic analysis to address these issues as soon as possible.
Methodological flaws of the existing framework in Canada
It is necessary to note that until now the most of the work on sustainable
transportation, especially in Canada, has been done by non-economists, mainly by civil
engineers who pay little attention to economic side of the concept. That is why early
studies treated sustainable transportation as:
- anything that reduces emissions by automobiles; and
- anything that increases transport safety.
As a result, two interpretations of sustainability were introduced by the Canadian
Centre for Sustainable Transportation: (i) comprehensive sustainability, and (ii)
sustainability as a combination of any two out of three dimensions of sustainable
development. Even though comprehensive sustainability, defined by the Centre coincides
with the general economic notion of sustainable development, unfortunately the second
interpretation gained priority in the field of transportation.
As literature review shows, so far the assessment of transportation’s sustainability in
Canada has been subject of a positive analysis, associated with the question of whether or
not our current transportation system is on a sustainable path. At large this approach
conforms to the following three principles:
1. Sustainable Transportation Performance Indicators (STPI)
2. Isolated impacts of transportation on the economy, the environment and society
7
3. Benefit-cost analysis as analytical framework
Currently in Canada, six different sets of indicators measuring sustainability of
transportation are being issued by six different institutions. Environment Canada uses the
set of four indicators: (i) ecological life support systems, (ii) natural resources
sustainability, (iii) human health and well-being, and (iv) pervasive influencing factors.
The National Round Table on the Environment and the Economy developed a set of
sustainability transportation principles that include access, equity, individual and
community responsibility, health and safety, education and public participation,
integrated planning, land and resource use, pollution prevention, and economic well-
being. The Ontario Round Table on Environment and Economy developed a set of 21
indicators that fall under four categories -- environmental, economic, social and systemic.
The Transportation Association of Canada proposed 13 principles associated with
sustainable transportation systems in Canada. The Victoria Transport Policy Institute
produced a set of 19 sustainability indicators focusing on the ability to reach goods,
services and destinations rather than on the transportation system’s ability to move
vehicles. Finally, in December 2002, the Canadian Centre for Sustainable Transportation
produced a set of 14 sustainability indicators.
This approach has some obvious disadvantages. First, selection of a set of “good”
indicators is a difficult task, both in terms of ensuring the number is manageable and that
each indicator conforms to as many of the characteristics as possible. Second, some sets
of indicators may send conflicting messages when different indicators point in different
directions making it difficult to understand and interpret the overall result. Therefore, we
don’t know, in general, whether the development of our transportation system is on a
8
sustainable path or not and at what speed. Third, it is very difficult to use a set of
indicators to model a sustainable transportation system.
Next, a sustainable system implies interaction of three components: the economy, the
environment and society. Applied to transportation, this points at the necessity to
establish interactive links of transportation with the economy, environment and society
over time. However, the benefit-cost analysis, used in the traditional approach to evaluate
sustainability, results in all expected developments in the transportation system being
treated as consequences of isolated and once-and-for-all impacts. This is a one-directional
process that does not take into account feedbacks between transportation and the
economy, environment and society.
And finally, the benefit-cost analysis was designed to evaluate specific projects or it
was designed to assess marginal changes within an existing system over short period of
time. However, the time frame, associated with the sustainable transportation system,
involves more than one generation. Hence, evaluation of sustainability of transportation
must be viewed in terms of structural (system) changes rather than marginal changes
which points at methodological inapplicability of the benefit-cost analysis.
All these shortcomings point to the necessity of approaching the problem of
transportation’s sustainability differently. It does not, however, mean that all the work on
sustainability of transportation in Canada has to be put aside and forgotten. Simply a new
framework of analysis is needed to reflect the accumulated experience in this field.
Alternative approach to sustainability of transportation in Canada
The novelty of the proposed approach is the addition of a normative aspect to the
assessment of transportation’s sustainability. It is designed to develop a methodology that
9
not only evaluates current performance of a transportation system in Canada in terms of
its positive and negative impacts on economy, environment and society, but also allows
us to derive a set of policy recommendations for the design of the sustainable
transportation system (STS).
In this approach, the modeling of the STS is based on the following principles:
1. Aggregate sustainability measure instead of the sustainability indicators
2. Treatment of sustainable transportation as a part of a three-dimensional system
economy-environment-society instead of separate evaluation of transportation
impacts on economy, environment and society
3. System dynamics approach instead of benefit-cost analysis
With respect to the first principle, the use of aggregate measures instead of a set of
indicators simplifies modelling of a sustainable transportation system. There are several
known aggregate sustainability measures in the literature. In this study, the Genuine
Progress Indicator (GPI) was chosen to capture changes in social welfare due to
transportation (see Friends of Earth and Redefining Progress web-sites). The GPI takes
into account more than twenty aspects of our economic lives that GDP ignores. It
includes estimates of the economic contribution of numerous social and environmental
factors, which GDP dismisses with an implicit and arbitrary value of zero. It also
differentiates between economic transactions that add to the well-being and those which
diminish it. The GPI then integrates these factors into a composite measure so that the
benefits of economic activity can be weighed against the costs.
With respect to transportation, GPI includes the value of services provided by the
transportation infrastructure, the cost of commuting, the cost of automobile accidents, the
10
cost of air and noise pollution by transportation, the loss of farmlands and wetlands and
some other items. The ability of this aggregate measure to capture long-run trends along
with the short-run fluctuations makes it very attractive for the use as sustainability
criterion to model a sustainable transportation system.
The second principle is associated with what is called systems approach to sustainable
transportation. Sustainability is not about partial equilibrium analysis but about systems
analysis. Specifically, it is about how environmental, economic, and social systems
interact to their mutual advantage or disadvantage at various space-based scales of
operation. In the approach developed in this study, a system that consists of three
elements (i) economy, (ii) environment and (iii) society is established first. Then the
approach places the transportation network within the economic component of the system
and develops its links with environment and society. Structurally, the transportation
network is incorporated in such a system through vertical and horizontal linkages (see
Yevdokimov, 2003).
Horizontal linkages are links of a transportation network with environment and society
outside the economic component. Examples of these links are (i) environmental links:
emissions, noise pollution, land use, etc., and (ii) social links: safety, mobility,
accessibility, etc.
Vertical linkages are links of a transportation network with other sectors of an
economy within the economic component. These links reflect the idea that transportation
network does not exist on its own. It is an integral part of an economy, and demand for
transportation is demand by other sectors of the economic system. Hence vertical links
11
capture interactions of the transportation network with other sectors of the economy as
well as some social values of transportation not included in GDP.
The third principle is associated with the system dynamics approach. The approach is
based on the statement that a system must evolve according to the state-flow relationships
organized in feedback loops. The system dynamics approach captures interaction
between the system’s components as well as the system’s feedbacks. Instead of the
forced, one-directional design of the benefit-cost analysis, in the system dynamics
approach intrinsic dynamics of the system drive it through time. As a result, the system
under study evolves over time. The approach is perfectly applicable to the modeling of
the STS as part of the economy-environment-society system since all the vertical and
horizontal linkages of the transportation network can be captured through state-flow
relationships over time.
Furthermore, according to the concept of sustainability developed by Vester (1995)
within the system dynamics approach, a system that evolves exponentially is not
sustainable. Hence, if sustainability constraints were added to the system’s dynamics, the
system would produce the required time path for the STS plus a set of necessary
conditions to achieve this path.
Therefore, the following structure to model the STS was proposed:
(i) specification of the initial conditions;
(ii) description of the system dynamics;
(iii) aggregate sustainability constraint.
Initial conditions include initial values of major economic variables as well as
economic fundamentals and policy variables. Economic fundamentals describe the
12
economy’s existing state of technology and current preferences of the society. In turn,
policy variables include the existing institutional foundations that underlie economic
fundamentals.
System dynamics is based on a set of the state-flow relationships of the type:
),(1 PFVVV ttt ∆+=+ (1)
where Vt+1 is the state of the transportation system next period, Vt is the sate of the
transportation system now and ∆Vt is the change in the state of transportation system as a
function of economic fundamentals F and policy variables P. This is a mathematical
model, which captures vertical linkages of a transportation network as defined
previously.
The aggregate sustainability constraint is
tt GPIGPI ∆≥∆ +1 (2)
where ∆GPI is the change in the GPI due to transportation. The constraint requires a non-
decreasing ∆GPI over time which is consistent with the general notion of sustainability.
In the way it is defined, GPI reflects social well-being. According to Arrow (2002),
sustainability is defined as “the maintenance or improvement of well-being over time”. It
implies that the basic principle of sustainable development is a non-decreasing social
utility or social welfare function over time (see, for example, Stavins, Wagner and
Wagner, 2003).
By design, GPI includes economic, social and environmental effects. Therefore, the
aggregate sustainability constraint will capture horizontal linkages of the transportation
network as a part of economic system with environment and society. If the aggregate
13
sustainability constraint is satisfied, the system dynamics will drive the system over time.
If the aggregate constraint is not satisfied, changes to economic fundamentals F and/or
policy variables P must be imposed. In the end, the system dynamics will produce a
sustainable path of the transportation system under study plus a set of the required
changes to economic fundamentals and policy variables over time.
Results of computer simulation
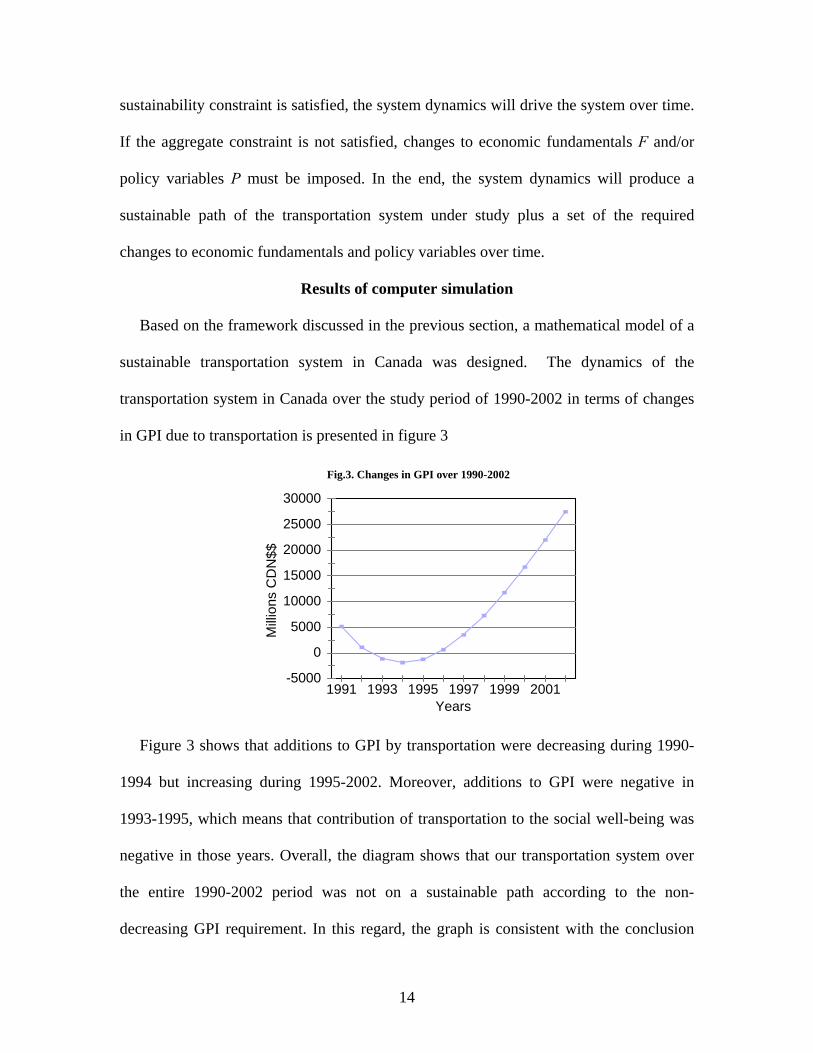
Based on the framework discussed in the previous section, a mathematical model of a
sustainable transportation system in Canada was designed. The dynamics of the
transportation system in Canada over the study period of 1990-2002 in terms of changes
in GPI due to transportation is presented in figure 3
-5000
0
5000
10000
15000
20000
25000
30000
Mill
ions
CD
N$$
1991 1993 1995 1997 1999 2001Years
Fig.3. Changes in GPI over 1990-2002
Figure 3 shows that additions to GPI by transportation were decreasing during 1990-
1994 but increasing during 1995-2002. Moreover, additions to GPI were negative in
1993-1995, which means that contribution of transportation to the social well-being was
negative in those years. Overall, the diagram shows that our transportation system over
the entire 1990-2002 period was not on a sustainable path according to the non-
decreasing GPI requirement. In this regard, the graph is consistent with the conclusion
14
obtained by other researchers in the field and first of all by the Canadian Centre for
Sustainable Transportation.
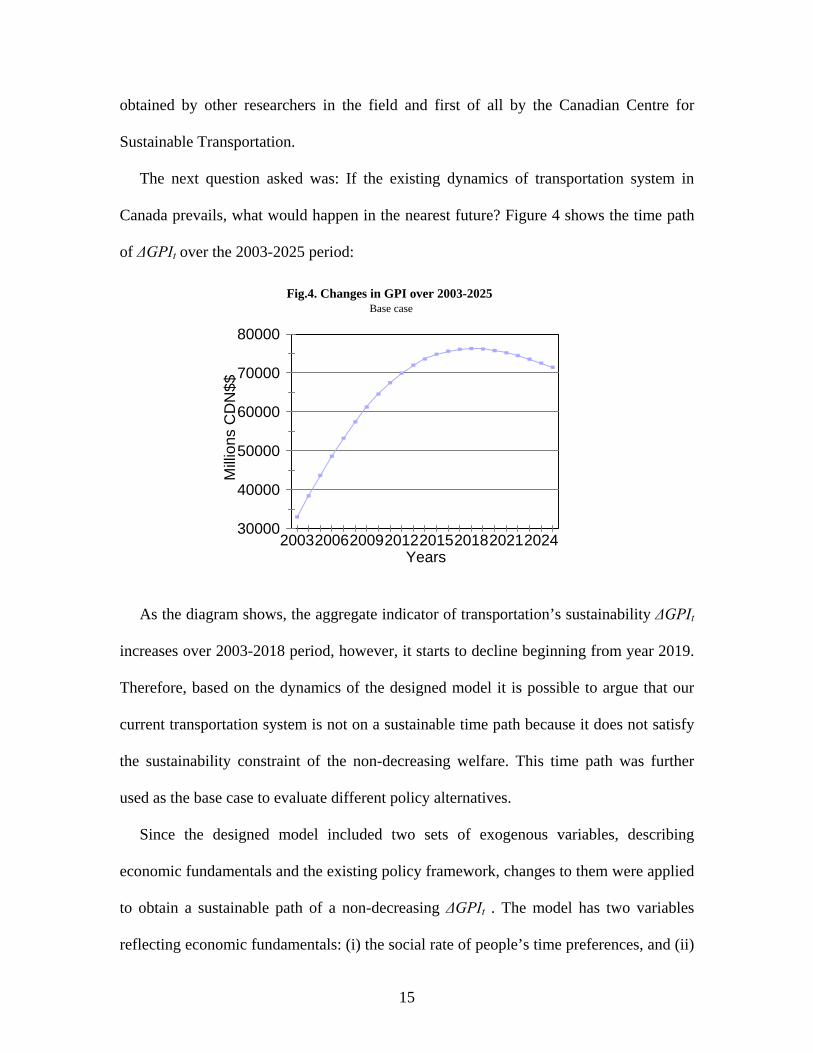
The next question asked was: If the existing dynamics of transportation system in
Canada prevails, what would happen in the nearest future? Figure 4 shows the time path
of ∆GPIt over the 2003-2025 period:
30000
40000
50000
60000
70000
80000
Mill
ions
CD
N$$
20032006200920122015201820212024Years
Fig.4. Changes in GPI over 2003-2025Base case
As the diagram shows, the aggregate indicator of transportation’s sustainability ∆GPIt
increases over 2003-2018 period, however, it starts to decline beginning from year 2019.
Therefore, based on the dynamics of the designed model it is possible to argue that our
current transportation system is not on a sustainable time path because it does not satisfy
the sustainability constraint of the non-decreasing welfare. This time path was further
used as the base case to evaluate different policy alternatives.
Since the designed model included two sets of exogenous variables, describing
economic fundamentals and the existing policy framework, changes to them were applied
to obtain a sustainable path of a non-decreasing ∆GPIt . The model has two variables
reflecting economic fundamentals: (i) the social rate of people’s time preferences, and (ii)
15
the rate of technological progress. The social rate of people’s time preferences, expressed
as growth factor, was initially assigned the value of 0.96. It means that people discount
the future with respect to the present at the rate of 4.16% per year. The value of this
parameter was taken from the literature on real business cycles in which this parameter
was a very important part of the model calibration. The sustainable development concept
assumes the intra- and inter-generational equity expressed in the famous Brundtland
Report (1987) as follows: “Sustainable development is development that meets the needs
of the present generation without compromising the ability of future generations to meet
their own needs… Even the narrow notion of physical sustainability implies a concern for
social equity between generations, a concern that must logically be extended to equity
within each generation” (page 43).
Therefore, if we are to achieve social equity within and between generations, people
must treat the future in the same way they treat present. Quantitatively, it means that
ideally the social rate of time preferences should be zero or no discounting of the future.
Figure 5 compares the time path of ∆GPIt under zero social rate with the base case:
16
30000
40000
50000
60000
70000
80000
90000
Mill
ions
CD
N$$
2003 2007 2011 2015 2019 2023Years
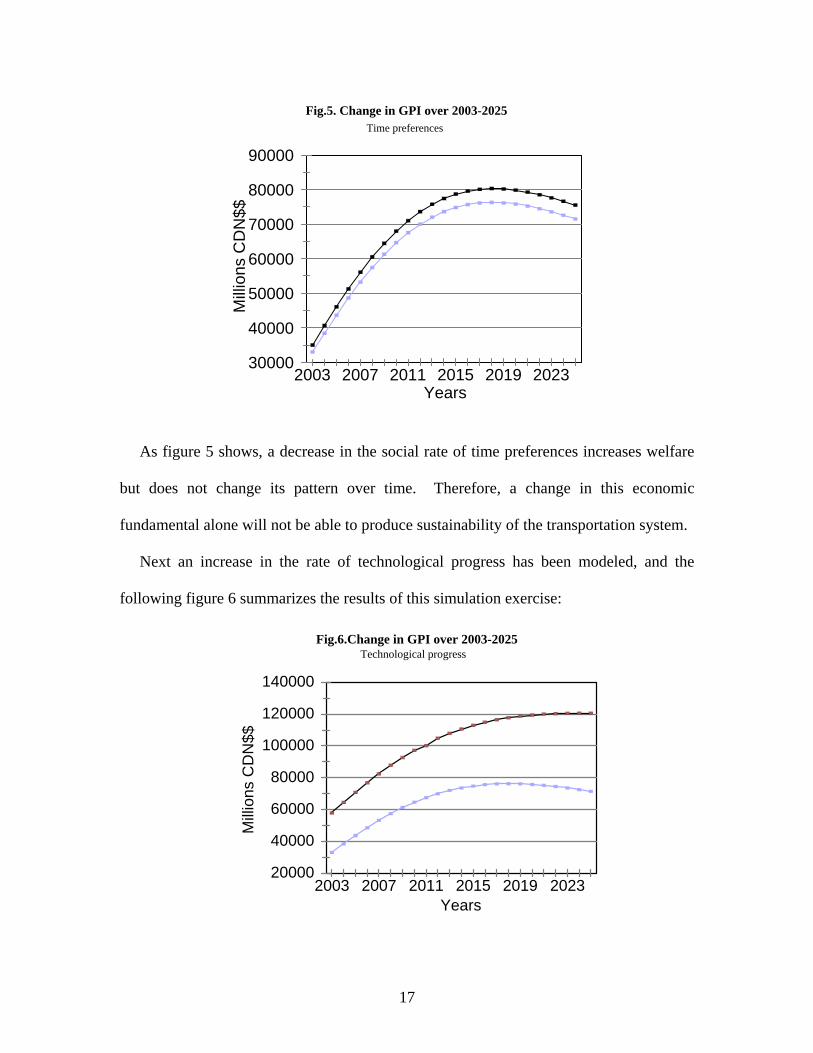
Fig.5. Change in GPI over 2003-2025Time preferences
As figure 5 shows, a decrease in the social rate of time preferences increases welfare
but does not change its pattern over time. Therefore, a change in this economic
fundamental alone will not be able to produce sustainability of the transportation system.
Next an increase in the rate of technological progress has been modeled, and the
following figure 6 summarizes the results of this simulation exercise:
20000
40000
60000
80000
100000
120000
140000
Mill
ions
CD
N$$
2003 2007 2011 2015 2019 2023Years
Fig.6.Change in GPI over 2003-2025Technological progress
17
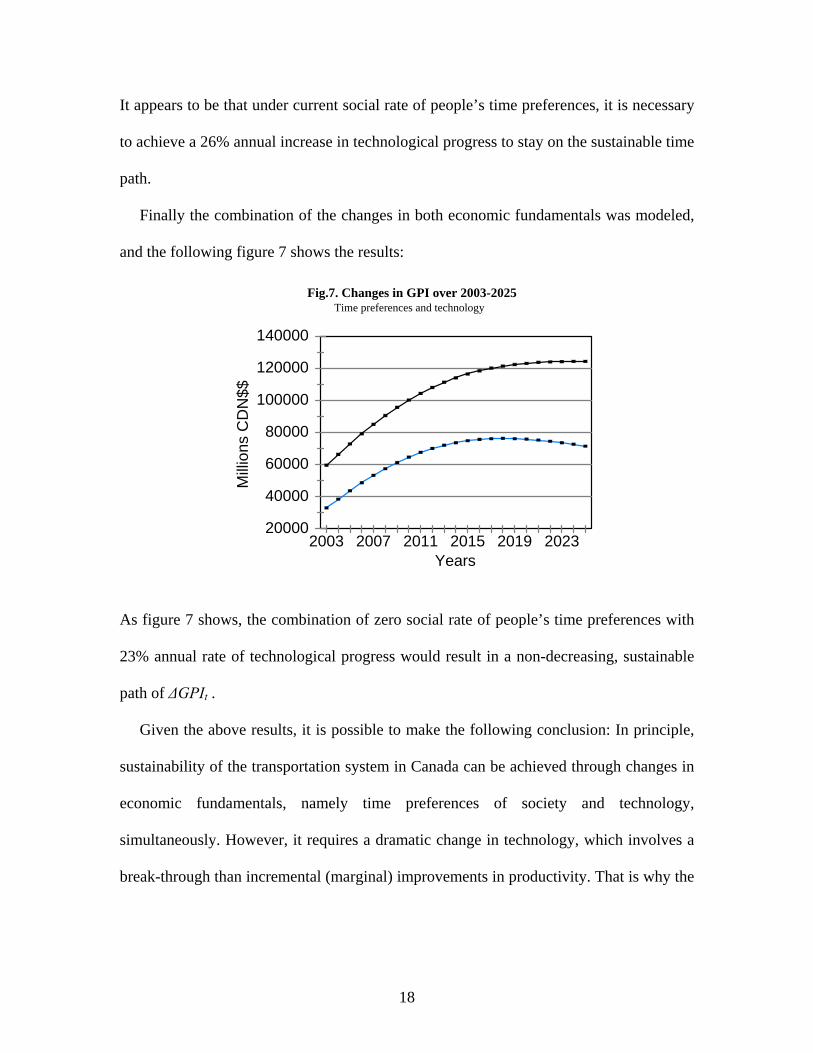
It appears to be that under current social rate of people’s time preferences, it is necessary
to achieve a 26% annual increase in technological progress to stay on the sustainable time
path.
Finally the combination of the changes in both economic fundamentals was modeled,
and the following figure 7 shows the results:
20000
40000
60000
80000
100000
120000
140000
Mill
ions
CD
N$$
2003 2007 2011 2015 2019 2023Years
Fig.7. Changes in GPI over 2003-2025Time preferences and technology
As figure 7 shows, the combination of zero social rate of people’s time preferences with
23% annual rate of technological progress would result in a non-decreasing, sustainable
path of ∆GPIt .
Given the above results, it is possible to make the following conclusion: In principle,
sustainability of the transportation system in Canada can be achieved through changes in
economic fundamentals, namely time preferences of society and technology,
simultaneously. However, it requires a dramatic change in technology, which involves a
break-through than incremental (marginal) improvements in productivity. That is why the
18
next consideration was given to changes in the existing policy framework towards
transportation.
The existing policy framework reflects current government regulations with respect to
transportation. They include environmental standards, taxes on gasoline, vehicle
registration fees, tolls, fines, etc. Society as a whole ended up with current levels of fuel
consumption, environmental pollution, ozone layer depletion or negative externalities,
caused by the transportation system, as consequences of the existing regulations.
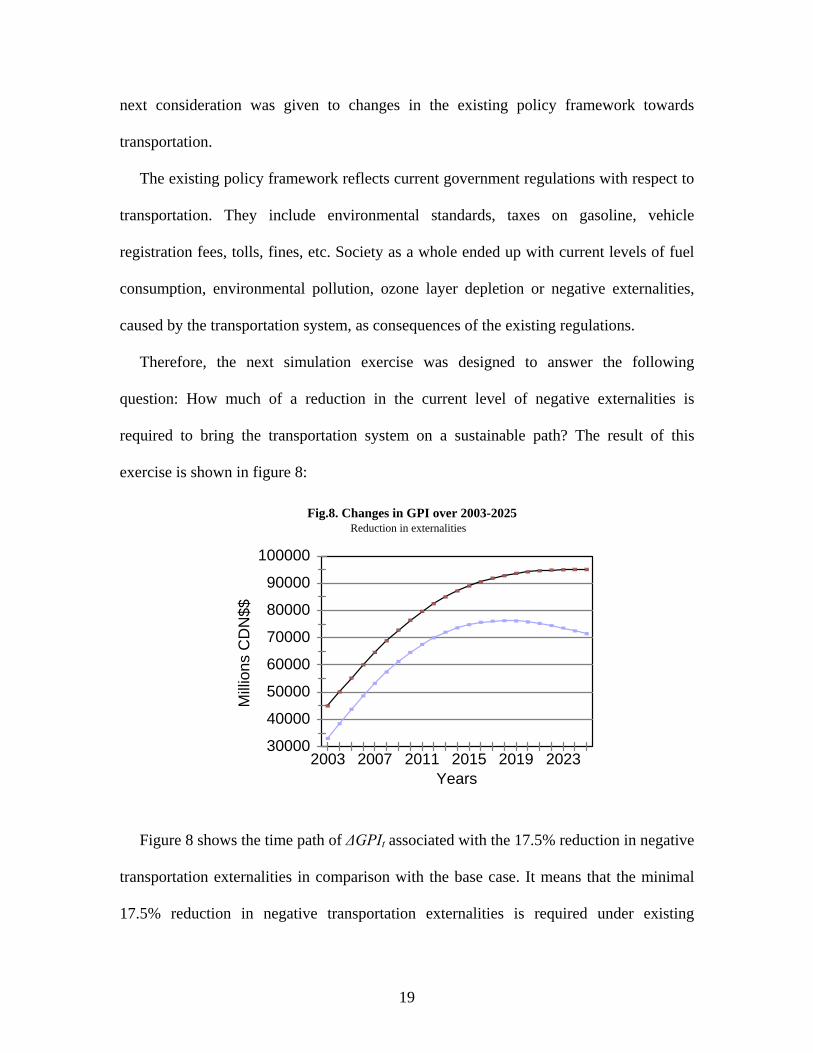
Therefore, the next simulation exercise was designed to answer the following
question: How much of a reduction in the current level of negative externalities is
required to bring the transportation system on a sustainable path? The result of this
exercise is shown in figure 8:
30000
40000
50000
60000
70000
80000
90000
100000
Mill
ions
CD
N$$
2003 2007 2011 2015 2019 2023Years
Fig.8. Changes in GPI over 2003-2025Reduction in externalities
Figure 8 shows the time path of ∆GPIt associated with the 17.5% reduction in negative
transportation externalities in comparison with the base case. It means that the minimal
17.5% reduction in negative transportation externalities is required under existing
19
technology and people’s time preferences to bring the transportation system onto
sustainable time path.
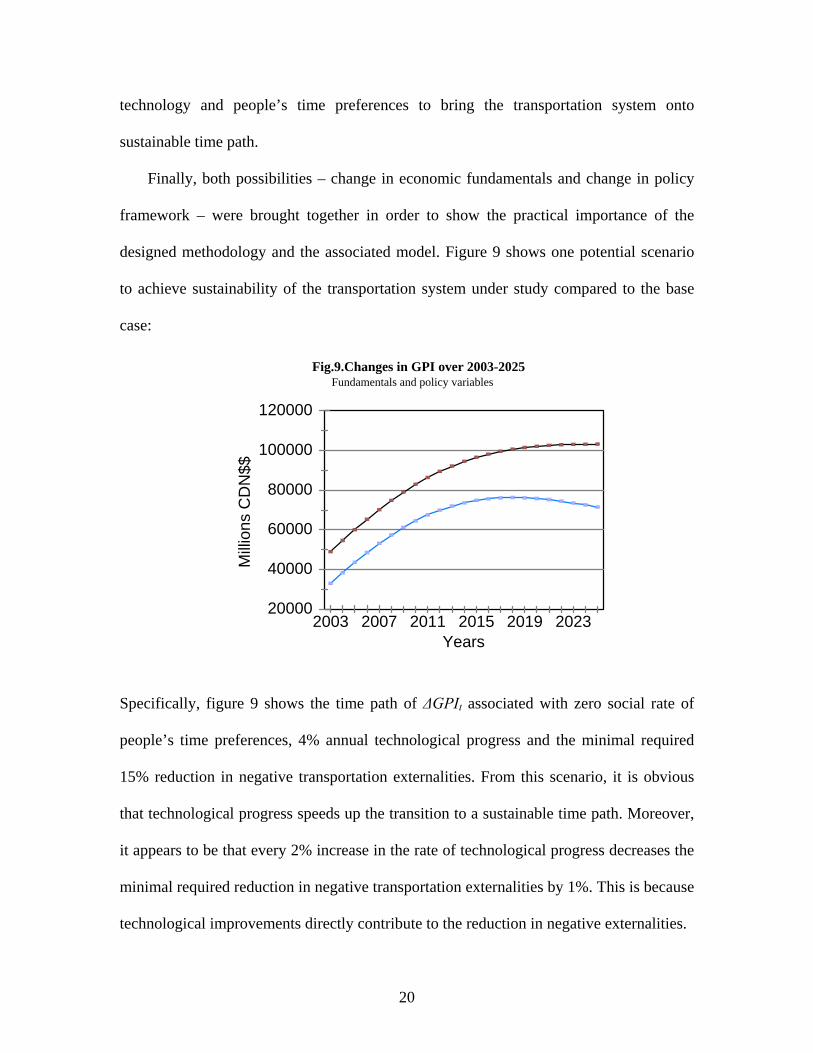
Finally, both possibilities – change in economic fundamentals and change in policy
framework – were brought together in order to show the practical importance of the
designed methodology and the associated model. Figure 9 shows one potential scenario
to achieve sustainability of the transportation system under study compared to the base
case:
20000
40000
60000
80000
100000
120000
Mill
ions
CD
N$$
2003 2007 2011 2015 2019 2023Years
Fig.9.Changes in GPI over 2003-2025Fundamentals and policy variables
Specifically, figure 9 shows the time path of ∆GPIt associated with zero social rate of
people’s time preferences, 4% annual technological progress and the minimal required
15% reduction in negative transportation externalities. From this scenario, it is obvious
that technological progress speeds up the transition to a sustainable time path. Moreover,
it appears to be that every 2% increase in the rate of technological progress decreases the
minimal required reduction in negative transportation externalities by 1%. This is because
technological improvements directly contribute to the reduction in negative externalities.
20
Conclusion
This paper summarizes the existing approach to measuring sustainability of
transportation in Canada as well as describes an alternative approach based on aggregate
sustainability measure. As a result of the approach, a mathematical model of a sustainable
transportation system is discussed. The model then was used to model sustainability of
the Canadian ground transportation system.
Based on computer simulation, it appears to be that the best way to achieve
sustainability of the existing transportation system in Canada is to use a combination of
the two basic instruments available to policy makers - changes in economic fundamentals
and changes in the policy framework. Since it is not possible to change economic
fundamentals in the short-run, a two-stage change is required: (i) in the short-run,
changes to the existing policy framework must be introduced and implemented to
significantly reduce negative transportation externalities. At the same time, incentives for
changes in economic fundamentals must be created; (ii) in the long-run, changes in
economic fundamentals must be realized.
This structure underlies the required public policy strategy towards sustainable
transportation in Canada. For example, in order to reduce the social rate of people’s time
preferences in the long-run, advantages of sustainable development must become obvious
for the general public in the short-run. It can be done through education and media. In
order to achieve a higher level of technological progress in transportation in the long-run,
a system of incentives towards research and development must be developed in the short-
run. Both must be accompanied by continuous changes to the current transportation
practice to reduce negative externalities.
21
References
Arrow, K. et al., “Are We Consuming Too Much?”, Discussion Paper, Beijer International Institute of Ecological Economics, Stockholm, February 2002 Friends of Earth. Measuring Progress. http://www.foe.co.uk/campaigns/sustainable_development/progress/ . Accessed Sept. 29, 2003 Fisher, I., The Nature of Capital and Income, New York: Macmillan, 1906 Hartwick, J.M., Intergenerational Equity and Investing the Rents from Exhaustible Resources, American Economic Review 66, 1977, 9072-9074 Hicks, J.R., Value and Capital, 2nd ed., New York: Oxford University Press, 1939 Lindahl, E., “The Concept of Income”, in G. Bagge, Economic Essays in Honour of Gustav Cassel, Allen and Unwin, 1933 Munasinghe, M., Environmental Economics and Sustainable Development, World Bank Environmental Paper # 3, Washington, D.C.: The World Bank, 1993 OECD. Towards Sustainable Transportation. March 27, 1996. http://www.oecd.org/dataoecd/. Accessed Sept. 29, 2003. Pearl, A., “How to Sustain Environmentally Sustainable Transportation Initiatives? - A Reaction to the Assessment of Social Implications”, Proceedings of the Ottawa Workshop on Sustainable Transportation, October 20-21, 1998, 145-153 Redefining Progress. Sustainability Indicators Program. http://www.rprogress.org/programs/sustainabilityindicators/ . Accessed Sept. 29, 2003 Solow, R. M., On the Intergenerational Allocation of Natural Resources, Scandinavian Journal of Economics, Vol. 88(1), 1986, 141-149 Solow, R.M., An Almost Practical Step Towards Sustainability, Invited lecture, fortieth anniversary of Resources for the Future, Resources and Concervation Center, Washington, DC, 1992 Stavins, R.N., Alexander F. Wagner, and Gernot Wagner, “Interpreting Sustainability in Economic Terms: Dynamic Efficiency Plus Intergenerational Equity”, Economic Letters 79, 2003, 339-343 The Centre for Sustainable Transportation. Definition and Vision of Sustainable Transportation. October 2002, http://www.cstctd.org/. Accessed June 20, 2003.
22
The Centre for Sustainable Transportation. Sustainable Transportation Performance Indicators: Underlying Data and Calculation. March 2003, http://www.cstctd.org/ . Accessed June 30, 2003 The World Commission on Environment and Development, “Our Common Future”, Oxford: University Press, 1987 Transport Canada. Transport Canada Annual Reports 1996-2002. http://www.tc.gc.ca/pol/en/anre/transportation_annual_report.htm . Accessed Sept 29, 2003. Vester, F. Crashtest Mobilitat. Deutscher Taschenbuch Verlag, Munchen, 1995 Yevdokimov, Y.V., “Vertical Linkages of a Sustainable Transportation System”, Proceedings of the 38th Annual Conference of Canadian Transportation Research Forum, May 11-14, 2003, Ottawa, pp. 136-147
23