sustainable transport policy—an evaluation of singapore s
TRANSCRIPT
112
Journal of Infrastructure, Policy and Development (2017) Volume 1 Issue 1, pp.112-128.DOI: 10.24294/jipd.v1i1.23
Case Study
Sustainable transport policy—An evaluation of Singapore’s past, present and futureSreyus Palliyani and Der-Horng Lee*
Department of Civil and Environmental Engineering, National University of Singapore
ABSTRACT
The whole world is in a fuel crisis nearly approaching exhaustion, with climate change knocking at our doorsteps. In the fight against global warming, one of the principle components that demands technocratic attention is Transportation, not just as a significant contributor to atmospheric emissions but from a much broader perspective of environmental sustainability.
From the traditional technocratic aspect of transport planning, our epiphany comes in the form of Land Use integrated sustainable transport policy in which Singapore has been a pioneer, and has led the way for both developed and developing nations in terms of mobility management. We intend to investigate Singapore’s Transport policy timeline delving into the past, present and future, with a case by case analysis for varying dimensions in the present scenario through selective benchmarking against contemporary cities like Hong Kong, London and New York. The discussions will include themes of modal split, land use policy, vehicular ownership, emission policy, parking policy, safety and road traffic management to name a few. A visualization of Singapore’s future in transportation particularly from the perspective of automated vehicles in conjunction with last mile solutions is also detailed.
Keywords: transport; planning; policy; sustainability; mobility; transit-oriented development
1. Introduction
It is a sad truth to digest that, currently, the only three truly sus-tainable transportation systems known to man are walking, cycling and non-motorized water transport. Everything else depends on fuel, which in its true sense is not entirely inexhaustible. This leads us to a conundrum when it comes to designing truly sustainable public transportation systems. Even when it comes to electric cars, the sustainability comes into question when we investigate the method of creation of electricity. Singapore is a good example that generates 95.5% of its electricity through natural gas (Energy Market Authority, 2015), which is a “cleaner” source compared to petroleum yet still results in a net increase in CO2 emissions and therefore can contribute to climate change. Mostly, natural gas is often a “transition” fuel, bridging the transition of the energy supply from polluting sources such as coal and nuclear towards cleaner, renewable technologies. It is never a permanent sustainable solution. Mr. Christophe Inglin, vice-chairman of the Sustainable Energy Association of Singapore, rightly calls this form of technology a low hanging fruit. It is also interesting that, in the past
ARTICLE INFOReceived: January 1, 2017
Accepted: January 15, 2017Available online: March 9, 2017
*CORRESPONDING AUTHORDer-Horng Lee, Department of Civil
and EnvironmentalEngineering, National University of
CITATIONPalliyani S and Lee DH (2017). “Sustainable transport policy—
An evaluation of Singapore’s past, present and future”.
Journal of Infrastructure, Policy and Development; 1(1): 112-128.
http://doi.org/10.24294/jipd.v1i1.23
COPyRIGHTCopyright © 2017 by author(s) and
EnPress Publisher LLC. This work is licensed under the Creative Commons
Attribution-NonCommercial 4.0 International License (CC BY-NC 4.0).
http://creativecommons.org/licenses/by/4.0/

Sreyus Palliyani and Der-Horng Lee
113
decade, the consumption of electricity by transport-related sectors has increased by nearly 99% but the consumption of natural gas by these sectors has decreased by 15% (Energy Market Authority, 2015).
In our study, we shall delineate Singapore’s Transport policy timeline into three: past, present and future, with a case-by-case analysis for varying dimensions in the present scenario. Although the past can go as far back as the 1960s and the present as far as the 1990s, it is more of a relative contemporary chronology that we wish to focus upon.
2. Singapore’s sustainable policy
2.1. The past
Singapore has increasingly gained popularity as South East Asia’s financial hub, particularly due to its strategic location in the straits of Malacca. Wealth started coming in and the residents began to enjoy affluence at a greater rate than precedence. Consequently, the country’s limited land resources posed a great obstacle for everyone from the planners to the road users. The roads faced congestion for the first time in Singapore’s history.
Consequently, the Road Transport Working Group in Singapore’s Public Works Department set up the Area Licensing Scheme (ALS) in 1975. It was complemented by increased downtown parking rates and improved bus services, including the promotion of Park and Ride services. The first of its kind in the world, the ALS was a toll system for road users implying they have to pay to use the road during the peak hours. Opening itself to great success both in terms of congestion and finances, quite a number of points stand out. Firstly, it resulted in a reduction of almost 20% in congestion levels, which was in line with the Government’s targets. Secondly, unlike most Government actions, the ALS was actually profitable. Initially, its revenues were nine times the costs and the rate of return on the investment was about 77% every year. Thirdly and most importantly, the citizens of Singapore accepted and agreed with the Government that the ALS introduction was for the greater good of the nation’s transportation scene (Watson and Holland, 1978).
The Land Transport Authority (LTA) is the statutory board under the Ministry of Transport of Government of Singapore responsible for primary decision-making in the transportation sector. LTA’s first step towards sound transport policy management came with the LTA White Paper 1996. It was the beginning of the juxtaposition of Integrated Land Use and Transport Planning. However, the document tended to focus more on the expansion of road networks as part of the plan to meet rising travel demand. It was laid down that advanced technologies will be put into use through Intelligent Transportation Systems (ITS) for traffic management. Significant measures to address the improvement of public transport were also addressed. The primary strategy for transport solutions was decided to be achieved through demand management. However, Singapore was much behind its Asian competitor Hong Kong, which had published its first white paper in 1979 focusing on road improvement, public transport expansion and the economic use of roads. They followed it up with their second white paper in 1990 focusing on intermodal coordination, building a balanced and efficient transport network with bus/rail as backbone, infrastructure improvements, expanding/upgrading public transport and road usage management. Subsequently, they launched the open tendering for new franchise bus routes in 1991 (Wong, 2015). The Land Transport Master
Sustainable transport policy—An evaluation of Singapore’s past, present and future
114
Plan of 2008 was a major milestone in terms of the Government’s path to a Transport Utopia. It was here that they decided to adopt strategies to convert public transport as a choice mode. Methods to manage road usage were also addressed. The document itself was people-centred and aimed to meet the diverse needs of the commuters through a holistic approach. A Household Interview Travel Survey1 conducted by LTA indicated that, in 2008, an average of 9.9 million trips were generated daily in Singapore—a growth of 32% from 1997. Between 1997 and 2004, the growth rate was 10% (1.3% per annum), but the period 2004 to 2008 saw a jump in growth rate of 20% (4.8% per annum). Singapore has shifted its attention to Transit-Oriented Development through new towns such as Paya Lebar, Jurong Lake District and etc. which are nearer to residential towns (Urban Redevelopment Authority (URA) master plan, 2008). It also includes a concerted effort to improve pedestrian access and cycling provisions for last-mile travels.
The Singapore population white paper 2013 had put forward a few interesting strategies in itself. Unlike its predecessors, it had taken into consideration the need to address congestion issues. It aimed to expand the public transport network aggressively. The need for managing land transport resources creatively and innovatively was also laid down. Singapore accepted the increasing travel demand and the resultant diversity2. Singapore’s total population is expected to grow to 6.5 to 6.9 million by 2030. Consequently, a Land Use plan was published detailing the strategy for the above-mentioned population growth. On housing, the focus was on good affordable homes for Singapore’s residents with a focus on Transit-Oriented Development. The vision of a garden city was kept intact. The TOD measures promise greater mobility with reduced travel distances. A vibrant economy with equable employment opportunities to all, with an initiative to leave room for growth ensuring a good living environment in the future, was also discussed3.
2.2. The present
Singapore has moved forward with better integration of surrounding land uses with transport nodes to promote more walking and cycling, through the creation of Integrated Transport Hubs (ITH) with air-conditioned bus interchanges and MRT/LRT stations co-locating with retail and commercial activities, allowing seamless transfers for commuters. Toa Payoh, Sengkang, Ang Mo Kio, Clementi, Boon Lay, Serangoon, Bedok and Joo Koon (upcoming Bukit Panjang and Yishun) are a few examples. Along with close integration of mixed land use in the surrounding areas with a focus of 400-m radius, walking and cycling has been extensively promoted.
The Transit-Oriented Development initiatives included the scenario of intermodal stations with integrated Urban and transport planning ensuring Financial Sustainability at the same time. The Jurong Lake District (2nd Central Business District) is a brilliant example of the integrated mixed-use urban district with comprehensive pedestrian and cycling network. Jurong gateway is planned to be developed into an attractive commercial hub with an integrated network of pedestrian walkways between buildings, public amenities and public transport nodes. LTA is working alongside Urban Redevelopment Authority to push through a comprehensive pedestrian and cycling network within the district to encourage active mobility.
1.Household Interview Surveys from 1997 to 2008—A decade of changing travel behaviours. http://www.lta.gov.sg/ltaacademy/doc/J10May-p52Choy&Toh_HIS1997-2008.pdf2.Population White Paper (2013). https://www.nptd.gov.sg/Portals/0/HOMEPAGE/HIGHLIGH/population-white-paper.pdf3.Singapore Land Use Plan, 2013. https://www.ura.gov.sg/uol/concept-plan.aspx?p1=View-Concept-Plan&p2=Land-Use-Plan-2013
Sreyus Palliyani and Der-Horng Lee
115
In its efforts to planning highly accessible districts, Marina Bay is another milestone. With the inclusion of state-of-the-art infrastructure services such as a Rapid Transit System (RTS), the Marina Coastal Expressway, a 3.5-km long Waterfront Promenade, and pedestrian and road bridges, it stands high in Singapore’s TOD initiatives. The public transport connectivity is one of the highest with the East-West line, North-South line, Downtown East (DTE) line and the upcoming Thomson (TS) line passing through this district. No area within the district lies outside the 400-m radius of design from a public transport node. The design has paved a pedestrian friendly precinct with at-grade, open, landscaped and covered walkways, along with underground pedestrian links. Further, a network of cycling paths along the Promenade, the Jubilee Bridge, etc., has been developed.
Cycling has been taken very seriously by Singapore’s urban planning division recently, with particular focus on infrastructure improvements such as the Central Area–City route, Queenstown–City route, Bukit Merah–City Route, Bishan–Hougang–City Route, Geylang–City route, and Marina Parade–City route to be completed by 2018 and beyond.
Innovative infrastructure systems technology has been absorbed from its neighbour Tokyo, such as the Common Services Tunnel (CST). It is a bold move towards sustainable solutions through the integration of District Cooling Systems and Pneumatic Refuse Conveyance Systems. Such technologies have again been executed in the Marina Bay region.
The population density gradient in Singapore, like other Asian cities, is distinctive. The Central Business District (CBD) may not have a density as high as that in London or New York, but the non-CBD regions usually have higher densities than other cities (Newman and Kenworthy, 1999). This results in an overall high density throughout an urban area.
In the Singapore budget for 2016, S$1 billion was committed to improve First-and-Last-Mile connectivity and a motion was passed that, by 2018, all MRT and LRT stations will be connected by sheltered walkways to nearby schools, healthcare facilities and public amenities.
2.3. Modal Split and Land Transport infrastructure
Singapore is a unique city state due to its confined land area of 719 sq km and as such it enjoys certain advantages in terms of connectivity, but its efforts still fall short in certain aspects. The modal split of public transport in terms of percentages by journeys is a prime example. Based on a report published by the Singapore Land Transport Authority, we see that in terms of walking and cycling trips, Singapore is far behind the western cities of London and New York. Given that walkability is a little more pleasant in terms of the weather in these places, the community also enforces initiatives to promote such activities. Cycling is embraced as a culture these days in London as part of the then-Mayor Boris Johnson’s vision. Originally, Mayor Livingstone set aside investments of £400m in cycling infrastructure. Subsequently in 2010, the first Cycle Superhighways were constructed. 400 docking stations and 6,000 bicycles-for-hire were constructed as part of the Barclays Cycle Hire scheme. As of 2011, Bike to work commute modal share was 2.5%. £1 billion was committed for cycling infrastructure and air pollution/inner city congestion mitigation in 2013. Further, the city actively holds events to promote cycling, such as the Tweed Run, Critical Mass, London Cycling Awards and World Naked Bike Ride. A 5% Overall Mode share is projected by 2026 (Transport for London, 2010). However, it is important to remember that the size of London city is 1,572 sq km

Sustainable transport policy—An evaluation of Singapore’s past, present and future
116
Figure 1. Modal split in percentages by journeys (Land Transport Authority, 2011)
4
4. Various sources: http://www.gov.hk/en/about/abouthk/factsheets/docs/railway.pdf, https://tfl.gov.uk/corporate/about-tfl/what-we-do/london-underground/facts-and-figures, http://www.nycsubway.org/wiki/Subway_FAQ:_Facts_and_Figures, http://infra.seoul.go.kr/archives/1092,http://www.urbanrail.net/as/jp/tokyo/tokyo.htm, http://www.mnd.gov.sg/landuseplan/e-book/, http://www.pland.gov.hk/pland_en/info_serv/statistic/landu.html, http://www.nyc.gov/html/dcp/pdf/landusefacts/landuse_tables.pdf, https://seoulsolution.kr/content/statistics?language=en, http://www.mewr.gov.sg/ssb/files/ssb2015.pdf
Figure 2. Length of rail per developed land area (km/sq km)4
(Transport for London, 2010), and the outer boroughs themselves might not be as well connected as the CBD.
However, Singapore is still fare behind when it comes to short trips. The use of private motorised transport for such relatively short trips could be discouraged if appropriate planning and design can address the functional issues of mobility, comfort and safety to encourage other more sustainable modes such as walking and cycling for short trips to shops and for leisure purposes. A large part of the problem comes from people still using cars for short medial trips such as grocery shopping and other everyday activities, which can be car-free.
Among the motorized modes, Singapore’s Asian competitor Hong Kong beats it by miles with a whopping 85% public transport usage and it is eons behind Tokyo when it comes to rail connectivity (Figure 1). If we evaluate the length of rail per developed land area of these cities, we can see how far behind Singapore is in this aspect (Figure 2). However, due to Singapore’s land constraint, it probably might never catch up with the other cities; nevertheless, Singapore bus system aptly compliments the rail connectivity.
Sreyus Palliyani and Der-Horng Lee
117
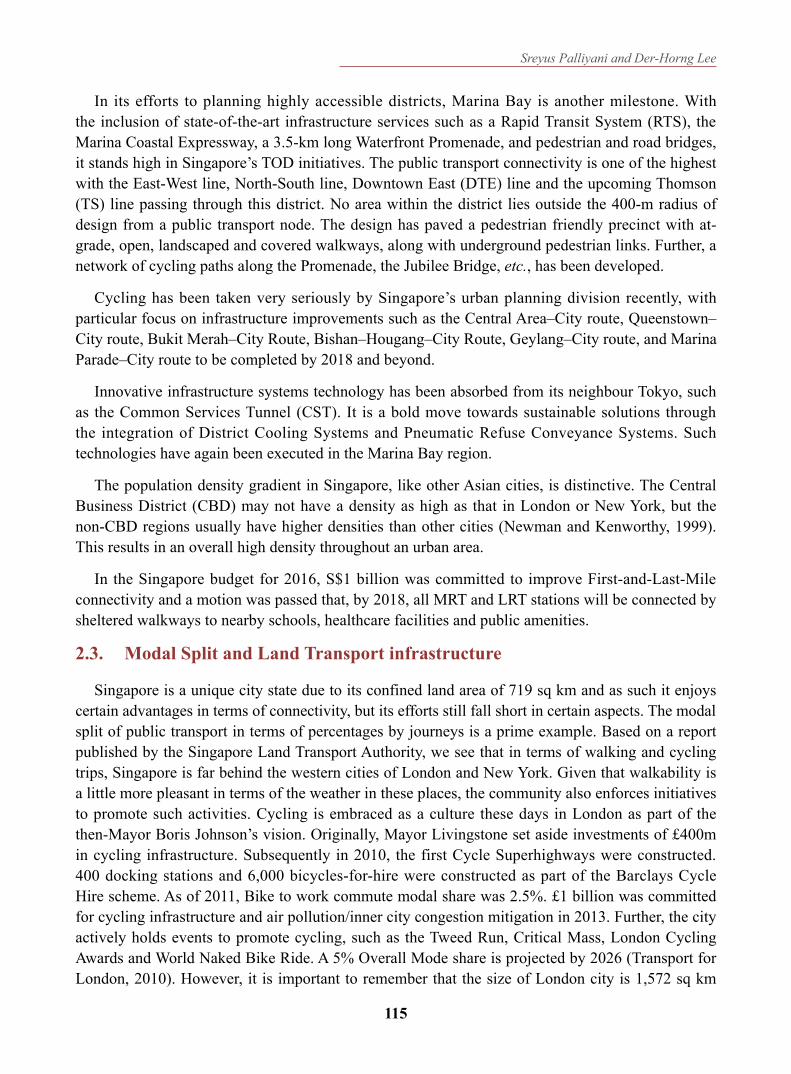
Singapore, although behind Tokyo at present, is expected to overtake the Asian giant by 2030 when it doubles its rail infrastructure by 2030 to 360 km. At the same time, although miniature in quantity, Singapore’s rail network is quite well-spread especially in terms of Central Business District connectivity. It is interesting however that Seoul, although at par with Singapore on Public Transport patronage, fares better with their colour-coded and zone-numbered bus systems allowing easier ridership even for tourists.5 Singapore is looking to expand its bus network in conjunction with the number of bus routes with the Bus Service Enhancement Program, which was launched in 2012. Under these circumstances, it is interesting to look at Hong Kong, which has proceeded with the Bus Rationalization program6, wherein the redundant bus routes are deleted for better service provision from the cramped bus routes (Figure 3).
2.4. Vehicle use and ownership observations
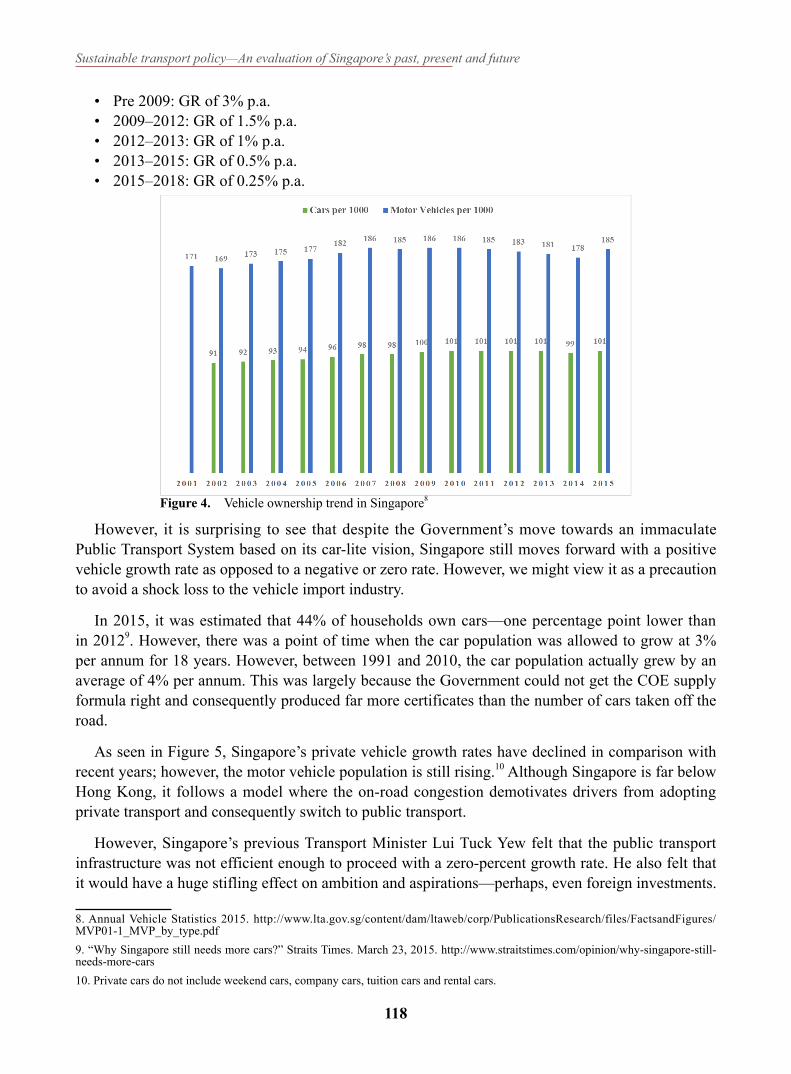
All transport economists would directly interpret vehicle ownership as an indicator of a country’s mobility requirement. Vehicle ownership is defined as number of road vehicles (passenger cars and two-wheelers) per thousand inhabitants. The unit of measurement is expressed in number of vehicles registered per 1,000 population (Figure 4).
In Singapore, the number of Certificate of Entitlements released is controlled by LTA based on many factors, such as vehicle growth rate projected, number of deregistration, etc. As such, the number will always be controlled. The conventional wisdom that we can have more cars as long as they do not contribute to congestion is true only up to a point. As Singapore becomes more urbanised, the social cost of car ownership will also increase. This is because land has to be set aside for parking spaces not only in places where people reside, but where people work, study and play. Using more land for carparks means less land for other developments, such as housing, schools or healthcare facilities. Illegal parking and congestion in local neighbourhoods may also become more prevalent (Land Transport Authority, 2013). Below, we have Singapore’s vehicle growth rate history7:
5. Seoul Public Transportation. http://www.kias.re.kr/sub06/sub06_06.jsp6. Bus Rationalization Program. http://www.td.gov.hk/en/bus_route_rationalisation/index.html7. Singapore VQS system. https://www.lta.gov.sg/content/ltaweb/en/roads-and-motoring/owning-a-vehicle/vehicle-quota-system.html
Figure 3. Public transport mode share across benchmark cities (Land Transport Authority, 2011; Seoul Metropolitan Government, 2015; NYC Department of Transportation, 2016)
Sustainable transport policy—An evaluation of Singapore’s past, present and future
118
However, it is surprising to see that despite the Government’s move towards an immaculate Public Transport System based on its car-lite vision, Singapore still moves forward with a positive vehicle growth rate as opposed to a negative or zero rate. However, we might view it as a precaution to avoid a shock loss to the vehicle import industry.8
In 2015, it was estimated that 44% of households own cars—one percentage point lower than in 20129. However, there was a point of time when the car population was allowed to grow at 3% per annum for 18 years. However, between 1991 and 2010, the car population actually grew by an average of 4% per annum. This was largely because the Government could not get the COE supply formula right and consequently produced far more certificates than the number of cars taken off the road.
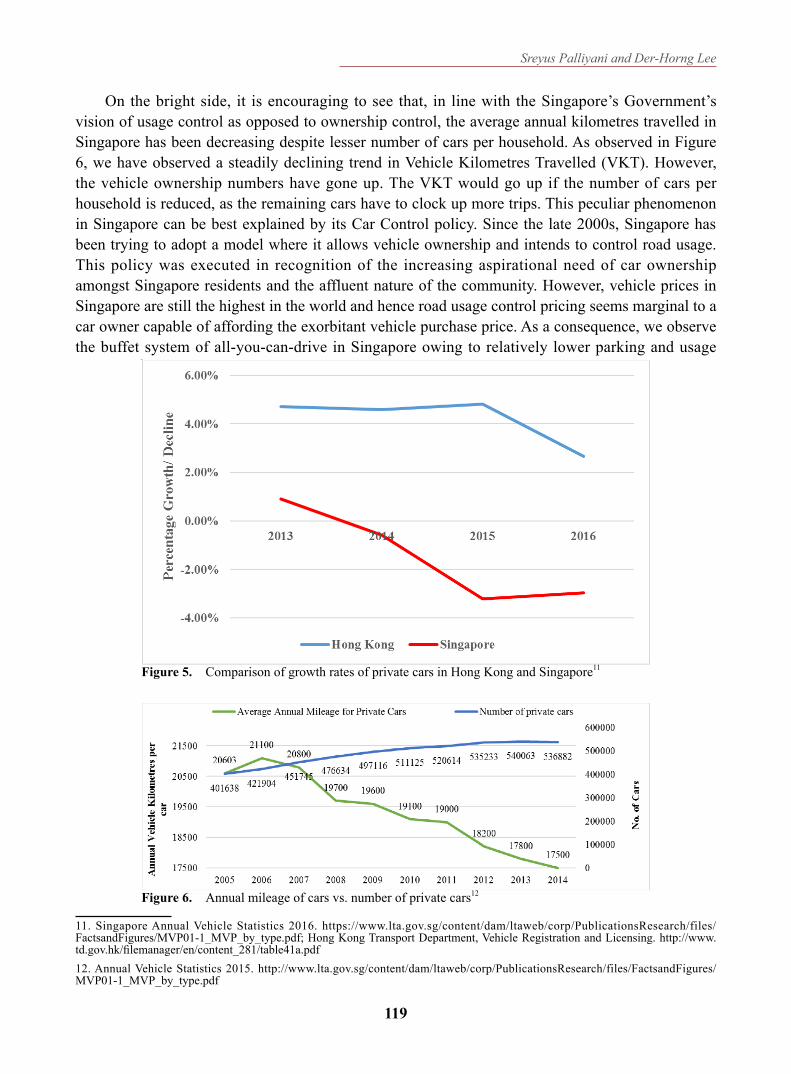
As seen in Figure 5, Singapore’s private vehicle growth rates have declined in comparison with recent years; however, the motor vehicle population is still rising.10 Although Singapore is far below Hong Kong, it follows a model where the on-road congestion demotivates drivers from adopting private transport and consequently switch to public transport.
However, Singapore’s previous Transport Minister Lui Tuck Yew felt that the public transport infrastructure was not efficient enough to proceed with a zero-percent growth rate. He also felt that it would have a huge stifling effect on ambition and aspirations—perhaps, even foreign investments.
8. Annual Vehicle Statistics 2015. http://www.lta.gov.sg/content/dam/ltaweb/corp/PublicationsResearch/files/FactsandFigures/MVP01-1_MVP_by_type.pdf9. “Why Singapore still needs more cars?” Straits Times. March 23, 2015. http://www.straitstimes.com/opinion/why-singapore-still-needs-more-cars10. Private cars do not include weekend cars, company cars, tuition cars and rental cars.
Figure 4. Vehicle ownership trend in Singapore8
• Pre 2009: GR of 3% p.a.• 2009–2012: GR of 1.5% p.a.• 2012–2013: GR of 1% p.a.• 2013–2015: GR of 0.5% p.a.• 2015–2018: GR of 0.25% p.a.
Sreyus Palliyani and Der-Horng Lee
119
1112On the bright side, it is encouraging to see that, in line with the Singapore’s Government’s vision of usage control as opposed to ownership control, the average annual kilometres travelled in Singapore has been decreasing despite lesser number of cars per household. As observed in Figure 6, we have observed a steadily declining trend in Vehicle Kilometres Travelled (VKT). However, the vehicle ownership numbers have gone up. The VKT would go up if the number of cars per household is reduced, as the remaining cars have to clock up more trips. This peculiar phenomenon in Singapore can be best explained by its Car Control policy. Since the late 2000s, Singapore has been trying to adopt a model where it allows vehicle ownership and intends to control road usage. This policy was executed in recognition of the increasing aspirational need of car ownership amongst Singapore residents and the affluent nature of the community. However, vehicle prices in Singapore are still the highest in the world and hence road usage control pricing seems marginal to a car owner capable of affording the exorbitant vehicle purchase price. As a consequence, we observe the buffet system of all-you-can-drive in Singapore owing to relatively lower parking and usage
11. Singapore Annual Vehicle Statistics 2016. https://www.lta.gov.sg/content/dam/ltaweb/corp/PublicationsResearch/files/FactsandFigures/MVP01-1_MVP_by_type.pdf; Hong Kong Transport Department, Vehicle Registration and Licensing. http://www.td.gov.hk/filemanager/en/content_281/table41a.pdf12. Annual Vehicle Statistics 2015. http://www.lta.gov.sg/content/dam/ltaweb/corp/PublicationsResearch/files/FactsandFigures/MVP01-1_MVP_by_type.pdf
Figure 5. Comparison of growth rates of private cars in Hong Kong and Singapore11
Figure 6. Annual mileage of cars vs. number of private cars12
Sustainable transport policy—An evaluation of Singapore’s past, present and future
120
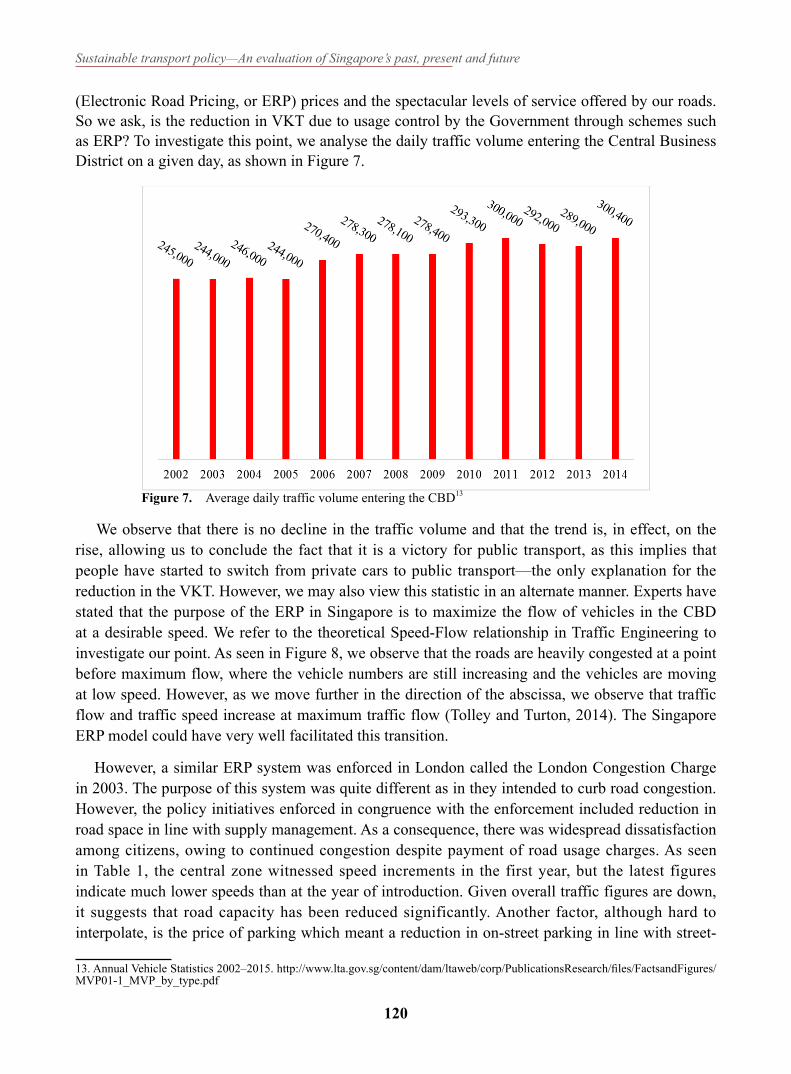
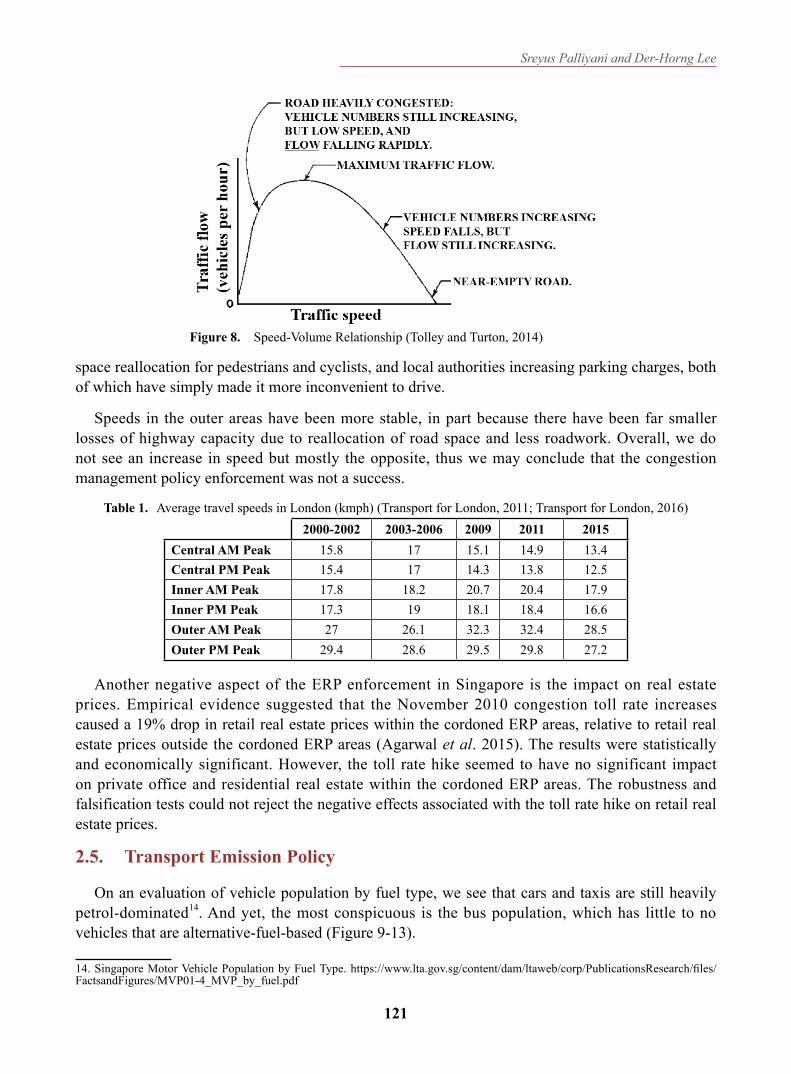
13We observe that there is no decline in the traffic volume and that the trend is, in effect, on the rise, allowing us to conclude the fact that it is a victory for public transport, as this implies that people have started to switch from private cars to public transport—the only explanation for the reduction in the VKT. However, we may also view this statistic in an alternate manner. Experts have stated that the purpose of the ERP in Singapore is to maximize the flow of vehicles in the CBD at a desirable speed. We refer to the theoretical Speed-Flow relationship in Traffic Engineering to investigate our point. As seen in Figure 8, we observe that the roads are heavily congested at a point before maximum flow, where the vehicle numbers are still increasing and the vehicles are moving at low speed. However, as we move further in the direction of the abscissa, we observe that traffic flow and traffic speed increase at maximum traffic flow (Tolley and Turton, 2014). The Singapore ERP model could have very well facilitated this transition.
However, a similar ERP system was enforced in London called the London Congestion Charge in 2003. The purpose of this system was quite different as in they intended to curb road congestion. However, the policy initiatives enforced in congruence with the enforcement included reduction in road space in line with supply management. As a consequence, there was widespread dissatisfaction among citizens, owing to continued congestion despite payment of road usage charges. As seen in Table 1, the central zone witnessed speed increments in the first year, but the latest figures indicate much lower speeds than at the year of introduction. Given overall traffic figures are down, it suggests that road capacity has been reduced significantly. Another factor, although hard to interpolate, is the price of parking which meant a reduction in on-street parking in line with street-
13. Annual Vehicle Statistics 2002–2015. http://www.lta.gov.sg/content/dam/ltaweb/corp/PublicationsResearch/files/FactsandFigures/MVP01-1_MVP_by_type.pdf
Figure 7. Average daily traffic volume entering the CBD13
(Electronic Road Pricing, or ERP) prices and the spectacular levels of service offered by our roads. So we ask, is the reduction in VKT due to usage control by the Government through schemes such as ERP? To investigate this point, we analyse the daily traffic volume entering the Central Business District on a given day, as shown in Figure 7.
Sreyus Palliyani and Der-Horng Lee
121
Figure 8. Speed-Volume Relationship (Tolley and Turton, 2014)
space reallocation for pedestrians and cyclists, and local authorities increasing parking charges, both of which have simply made it more inconvenient to drive.
Speeds in the outer areas have been more stable, in part because there have been far smaller losses of highway capacity due to reallocation of road space and less roadwork. Overall, we do not see an increase in speed but mostly the opposite, thus we may conclude that the congestion management policy enforcement was not a success.
Table 1. Average travel speeds in London (kmph) (Transport for London, 2011; Transport for London, 2016)2000-2002 2003-2006 2009 2011 2015
Central AM Peak 15.8 17 15.1 14.9 13.4Central PM Peak 15.4 17 14.3 13.8 12.5Inner AM Peak 17.8 18.2 20.7 20.4 17.9Inner PM Peak 17.3 19 18.1 18.4 16.6Outer AM Peak 27 26.1 32.3 32.4 28.5Outer PM Peak 29.4 28.6 29.5 29.8 27.2
Another negative aspect of the ERP enforcement in Singapore is the impact on real estate prices. Empirical evidence suggested that the November 2010 congestion toll rate increases caused a 19% drop in retail real estate prices within the cordoned ERP areas, relative to retail real estate prices outside the cordoned ERP areas (Agarwal et al. 2015). The results were statistically and economically significant. However, the toll rate hike seemed to have no significant impact on private office and residential real estate within the cordoned ERP areas. The robustness and falsification tests could not reject the negative effects associated with the toll rate hike on retail real estate prices.
2.5. Transport Emission Policy
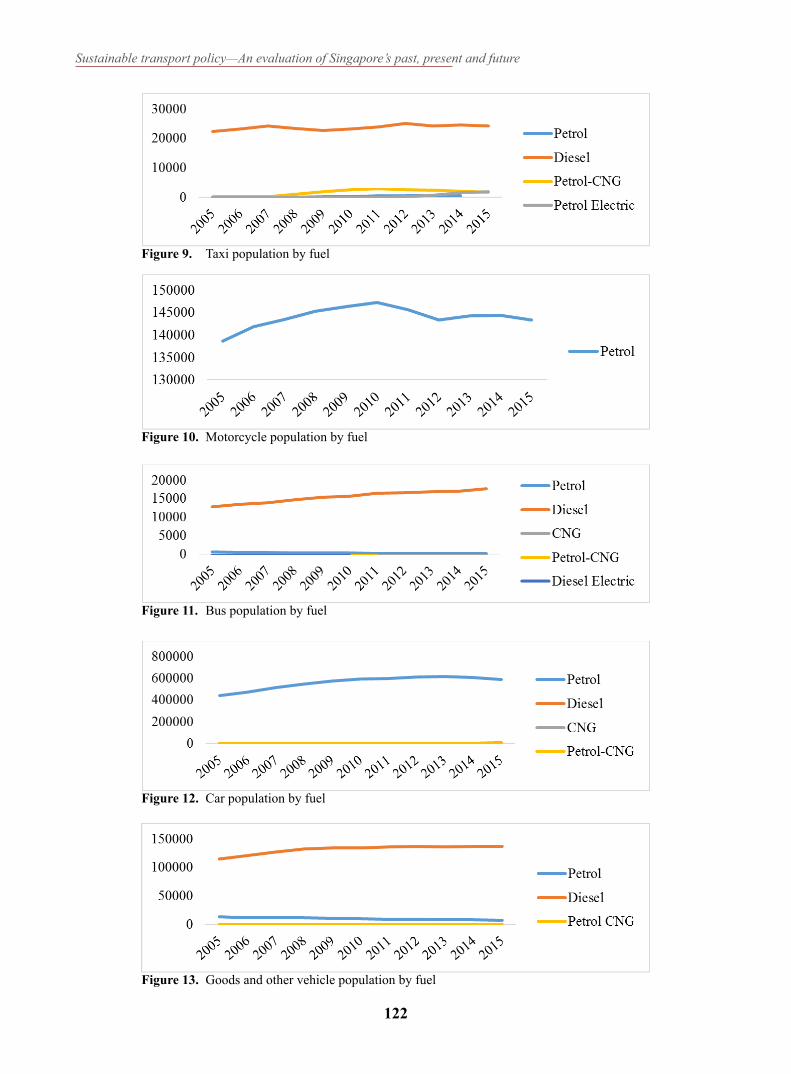
On an evaluation of vehicle population by fuel type, we see that cars and taxis are still heavily petrol-dominated14. And yet, the most conspicuous is the bus population, which has little to no vehicles that are alternative-fuel-based (Figure 9-13).
14. Singapore Motor Vehicle Population by Fuel Type. https://www.lta.gov.sg/content/dam/ltaweb/corp/PublicationsResearch/files/FactsandFigures/MVP01-4_MVP_by_fuel.pdf
Sustainable transport policy—An evaluation of Singapore’s past, present and future
122
Figure 9. Taxi population by fuel
Figure 10. Motorcycle population by fuel
Figure 11. Bus population by fuel
Figure 12. Car population by fuel
Figure 13. Goods and other vehicle population by fuel

Sreyus Palliyani and Der-Horng Lee
123
Singapore enforced Euro V for all diesel vehicles, Euro IV for all petrol vehicles, and Euro III for all motorcycles and scooters since 2014 (Ministry of National Development, 2015). In 2013, LTA and NEA implemented an Early Turnover Scheme (ETS). The scheme encourages owners of older and more polluting pre-Euro and Euro I diesel vehicles with Category C Certificates of Entitlement to upgrade to newer Euro V-compliant vehicles instead. More than 4,000 diesel vehicles have taken up the ETS since its introduction.
The Carbon Emissions-based Vehicle Scheme was also introduced in 2013. Cars with low carbon emissions are given a rebate on vehicle ownership taxes while cars with high emissions incur a surcharge in vehicle registration fees.
2.6. Road traffic management policy
Ridership is a commonly used tool to gauge the passenger traffic demand of a city’s public transport system. In Singapore, the overall ridership for rail and bus has increased steadily since the last few years, with the numbers in favour of bus. Currently 65% of Singapore’s Commuting is met through public transport. The number in itself is not impressive, as Hong Kong boasts of a public transport mode share of 85% in 2011.15
Visible spikes should be seen in the charts in the following years (Figure 14):16
• 2003 (Opening of North East Line)• 2009 (Opening of Circle Line)• 2013 (Opening of Downtown Line)
Figure 14. Average daily MRT ridership in Singapore in ‘00016
However, the spikes are not that evident. This is an interesting policy management scenario. One explanation is that the introduction of the new lines was not as effective as anticipated and may have not tapped into the needy corridors. However, this might not necessarily be a bad thing, as it also might have redistributed the excess passenger loads especially during peak hours, thereby offering better service for the existing public transport commuters. So, in terms of policy, although it might have not prompted the private car users to switch to public transport, the investment did manage to serve a different demographic.
15. LTA Passenger Transport mode share in world cities. http://www.lta.gov.sg/ltaacademy/doc/J11Nov-p60PassengerTransportModeShares.pdf16. Global Mass Transit Statistics. http://www.globalmasstransit.net/archive.php?id=21048

Sustainable transport policy—An evaluation of Singapore’s past, present and future
124
Another issue faced by most transportation planners in cities around the globe today is parking provision. It is a never-ending conundrum in the sense that we can never find a number that is an answer to all. What may be best for a city today might not be the same tomorrow. It is a constantly-adapting dynamic parameter. Singapore has been lagging in this aspect, especially considering the fact that it still enforces minimum parking standards. By minimum parking standards enforcement, it means at least a certain number of spaces have to be provided in relation to the land use, i.e., we will always end up with a conservative estimate.
We can learn from the other cities that have really taken a strive forward in this aspect. First on our list is Manhattan. The Department of Transport first published the Transportation Control Plan (TCP) in 1973 for New York, according to which, a facilitation of reduction of off-street parking spaces from 127,000 public spaces (1978) to 102,000 spaces (2010) in Manhattan was executed. As seen in Figure 15, it was observed that as a consequence of the policy, the residents ended up using more parking spaces in the core, forcing the commuters to switch to public transit increasingly. The policy even helped improve the air quality in the CBD area (NYC Department of City Planning, 2011). There was a visible reduction in the vehicles entering the CBD over the time span of the policy execution from about 160,000 vehicles in 1979 to about 142,000 vehicles in 2009. This is a clear indication of the switch the NYC residents had made from private to public transport for CBD commute, thus improving the overall quality of life in the city, because employment numbers have gone up in the years. In line with Singapore’s car-lite vision, this example is perhaps the most pertinent to its achievement. Specialized public transport services such as the one-many and many-one services of commuter transit are still lacking in Singapore and could be the answer to our CBD dilemma.
Figure 15. CBD-bound vehicles on a fall business day in Manhattan (1978–2009) (NYC Department of City Planning, 2011)
Sreyus Palliyani and Der-Horng Lee
125
Similarly, in Canary Wharf, a business district in East London, 100,000 jobs are supported by only 3,000 parking spaces.17 Boston has not allowed building of carparks since 1975 to maintain its cap of 35,000 parking spaces in the CBD according to the Federal Clean Air Act (Shoup, 2006). Most countries are now switching to a Maximum Parking Standards System as opposed to the traditional system of Minimum Parking Standards. However, the key under such critical on-the-edge planning is to draw the line between cruising for parking and congestion control (Arnott, 2006). In London, it has already been a few years since the Greater London Authority (GLA) has passed the legislation to enforce Maximum Parking Standards. In Singapore, Marina Bay has had constant parking supply in the past few years. In Hong Kong, the practice followed by policymakers is to discourage people from on-street parking by providing numbers that ensure 15% availability rate all the time (Transport Advisory Committee, 2014).
In London and Hong Kong, only the top 10%–20% of household dwellings come with carparks. Without a carpark, residents just simply cannot buy a car. In Singapore, the Government has provided abundant and cheap residential car parking in the HDB estates over the years. In New York and Tokyo, office buildings are deliberately built with few or no carparks. In Singapore, it is observed that even middle managers can drive their cars to work and park their cars in office building carparks for the whole day.18
Singapore still enforces Minimum Parking Standards. In 2009, the ratio of parking spaces to residential HDB units was 0.63. However, it is alarming that in the same period, only 30.4% of the households in HDBs owned cars (Barter, 2011). In 2003, Singapore’s parking requirement was lowered following Hong Kong’s move in 1999. In 2005, LTA together with URA implemented the Range-based Car Parking Standard that gives developers the flexibility to provide up to 20% fewer parking spaces than the prevailing standard. This enables developers to better match parking provisions with their assessment of demand based on operational and business considerations. LTA and URA plan to gradually reduce parking supply in the CBD as older buildings make way for newer buildings. An example is the redevelopment of the Market Street Car Park (MSCP). This carpark was built in the 1960s with 704 parking spaces at a time when there was a shortfall of carpark spaces and when public transport was inadequate in the CBD and Telok Ayer Conservation Area. Given the improvement in public transport and convenient access to MRT stations, along with adequate parking around the MSCP, it was allowed to be closed in 2011 to be redeveloped as a commercial building (Land Transport Authority, 2013). Recently in 2016, there had been a further 20% relaxation. However, it continues to remain that Singapore might have more parking spaces than it actually may require.
2.7. The future
Singapore knows that its inherent flaw in the public transportation sector today is the first/last mile issue. And rightly so, the first point of address in terms of future scenarios is the same. As we discussed in the beginning, walking and cycling are the truest modes of sustainable transport and, as such, Singapore’s future policies are aligned to this goal. As a first step, Singapore has adopted a form of the accessibility-based approach to transport planning (Litman, 2003), as opposed to
17.“Seeing the back of the car.” The Economist. Sept 22, 2012. http://www.economist.com/node/2156328018. “Big Idea No.1: A Car-less Singapore.” Straits Times. Feb 8, 2014. http://www.straitstimes.com/opinion/big-idea-no-1-a-less-car-singapore
Sustainable transport policy—An evaluation of Singapore’s past, present and future
126
the traditional technocratic 4-stage planning process, by combining land-use considerations with mobility and mobility substitutes. In a land-constrained city such as Singapore, public transport is the only answer to the people’s mobility needs. The pedestrian is the foundation of contemporary urban design because walking is the only form of transportation that does not feel like transportation at all (Walker, 2012). In the 2016 Singapore budget, a motion was passed that by 2018, all MRT and LRT stations will be connected by sheltered walkways to nearby schools, healthcare facilities and public amenities.19 Walkability as a concept is widely discussed all over the globe but more on a qualitative level, as quantitatively Singapore’s weather might not allow equal comparison with European cities.
Further, Singapore is looking into autonomous technologies for the last mile solution including the SMRT and Netherlands-based 2getthere partnership (2getthere Asia) to facilitate a vision of Driverless Pods. They shall be known as group rapid transit (GRT) vehicles: air-conditioned, 24-passenger “pods” facilitating short distance commutes in private estates, university campuses and business parks. With a travel speed of 40 kmph, pick-up and drop-off will be performed at designated stops. The pods’ automated vehicle system is able to work well in bad weather—unlike driverless cars that employ laser and camera sensors—because it uses magnets embedded in the road to guide the vehicles. Sensors on the vehicles help to spot obstacles, such as pedestrians, hence preventing accidents.20
London is testing out the new GATEway Project wherein autonomously driven shuttle pods are tested out for transport of civilians in short distances. These adapted vehicles will not run on dedicated tracks and are meant to be road compatible. Their design is based on Heathrow Airport’s pod cars which run on dedicated infrastructure (rails) but the system promises to have greater seating capacity than the Heathrow models.21 It will be greatly encouraging if Singapore’s Driverless Pods will have on-the-road capabilities like that of London’s since the system turns out to be more flexible.
Although ridership numbers have increased in public transport, their rise can primarily be attributed to population increase rather than the effectiveness of public transport. However, we have a lot to look forward to on the prospects of the new lines opening over the next decade, which can sturdily shift the travel times of residents to the lower side. On the lines of road vehicle density, since direct control is imposed by the Government through ownership restrictions, it will never pose a problem—and even if it did, it can be tackled appropriately. Based on travel times, public transport does not really offer the rich incentive for people to give up their cars. New York subway has greater ridership primarily due to population and their 24/7 service. Hong Kong in fact supports the idea of congestion on its roads to an extent as it incentivizes people to use public transport for time savings.
On the lines of safety, Silver Zones were introduced by LTA, wherein longer green times are provided at traffic intersections which can be activated by the Senior Citizen EZ-link card. In addition, LTA proposes Autonomous Vehicle usage to avoid erratic drivers. However, the timeline
19. Singapore Budget 2016. http://www.gov.sg/microsites/cos2016/urbanlandscape/mot20. Driverless pods may run here soon. http://www.straitstimes.com/singapore/transport/driverless-pods-may-run-here-soon21. “GATEway Project in London.” Digital Trends. May 13, 2016. http://www.digitaltrends.com/cool-tech/london-testing-driverless-public-transportation-pods
Sreyus Palliyani and Der-Horng Lee
127
for the same has not been declared and is likely to be far off. Back in 2012, a majority of those who died on the roads were pedestrians. However, most of the increase since 2011 was attributable to automobile driver and passenger deaths. There were 73 of those deaths in 2012, up from 50 the year before.
It has been quoted by the Singapore Traffic Police that, “Motorcyclists, the elderly and reckless drivers are our concern.”22 A new inter-agency committee called the Pedestrian and Cyclist Safety Committee has been set up to further improve the safety of roads. The Committee members, who include LTA, the Traffic Police and the Ministry of Education, as well as the Singapore Road Safety Council, will pay special attention to the needs of school children (Land Transport Authority, 2013).
3. Conclusion
Singapore has been often reputed for being the first for many landmark policy initiatives. In its short development span of 51 years, it has taken marvelously long and brilliant strides into a futuristic city, thus making it not just an interesting case study for policy schools but also a beacon in effective development.
Today, Singapore ranks in the top 10s in many listings across the world including food security, open economies, etc., if not the first. As Singapore gets more and more developed, the challenges of addressing modern issues such as sustainability comes as a further challenge, which the multiple-tier system in Singapore have concurrently addressed every step of the way.
In terms of transport, Singapore has been soaring as far as service offered and expansion scale rate, and although there have been shortcomings on certain issues, as a city-state with clearly defined yet blurry lines between local and national level bureaucracies, it has been coping in the best of ways.
Sustainability has been on Singapore’s transport agenda long before it was a hotly discussed topic in the international scenario. Perhaps unknowingly, or perhaps due to the growing traffic congestion issues in the 1960s due to its land constraint, Singapore has been on the right track for some time.
In terms of green fuel practices, Singapore does have a few issues to address especially when it comes to its heavily diesel-dependent bus fleet or its outdated euro standard enforcement. However, overall, the Singapore sustainability scenario is in the green all the way. No pun intended.
ReferencesAgarwal S, Koo KM and Sing TF (2015). “Impact of electronic road pricing on real estate rices in Singapore”.
Journal of Urban Economics, 90: 50–59. doi: 10.1016/j.jue.2015.09.004.Arnott R (2006). “Spatial competition between parking garages and downtown parking policy”. Transport Policy,
13(6): 458–469. doi: 10.1016/j.tranpol.2006.05.003.Barter P (2011). Parking Policy in Asian Cities, Asian Development Bank.Energy Market Authority (2015). Singapore Energy Statistics 2015. Singapore: Energy Market Authority.Land Transport Authority (2011). Passenger Transport Mode Share in World Cities. Journeys. Singapore: Land
Transport Authority. (2013). Land Transport Authority Master Plan. Singapore: Land Transport Authority.
22. “Key areas of concern.” Straits Times. Feb 16, 2016. http://www.straitstimes.com/singapore/transport/key-areas-of-concern-motorcyclists-reckless-drivers-the-elderly
Sustainable transport policy—An evaluation of Singapore’s past, present and future
128
Litman T (2003). “Measuring transportation: Traffic, mobility and accessibility”. ITE Journal, 73(10): 28–32.Ministry of National Development (2015). Sustainable Singapore blueprint. Singapore: Ministry of National
Development.Newman PD and Kenworthy JR (1999). Sustainability and cities: Overcoming automobile dependence.
Washington, DC: Island Press.NYC Department of City Planning (2011). Manhattan Core: Public Parking Study. New York: NYC Department
of City Planning.NYC Department of Transportation (2016). Strategic Plan. New York: NYC Department of Transportation.Seoul Metropolitan Government (2015). Seoul Public Transportation. Seoul, Korea: Seoul Metropolitan
Government,.Shoup DC (2006). “Cruising for parking”. Transport Policy, 13(6): 479–486. doi: 10.1016/j.tranpol.2006.05.005.Tolley R and Turton BJ (2014). Transport Systems, Policy and Planning: A Geographical Approach. Abingdon:
Routledge.Transport Advisory Committee (2014). Report on Traffic Congestion Study in Hong Kong. Hong Kong: Transport
Advisory Committee Hong Kong.Transport for London (2010). Cycling Revolution for London. London: Transport for London. (2011). Travel in London, report 4. London: Transport for London. (2016). Travel in London, report 8. London: Transport for London.Walker J (2012). Human transit: How clearer thinking about public transit can enrich our communities and our
lives. Washington, DC: Island Press. doi: 10.5822/978-1-61091-174-0.Watson PL and Holland E (1978). Relieving traffic congestion: The Singapore area license scheme. Washington,
DC: World Bank.Wong WL (2015). Comparison and review on bus priority schemes between Hong Kong, Singapore and London.
HKU Theses Online (HKUTO). Pokfulam, Hong Kong: The University of Hong Kong.