sustainable orchard management system
TRANSCRIPT

Sustainable Orchard Management SystemFor Intermountain Orchards
Project 98-058
SUSTAINABLE ORCHARDMANAGEMENTSYSTEM
FORINTERMOUNTAINORCHARDS
SARE PROJECT 98-058
DIANE ALSTON, USU
ROBERT E. CALL, AU
ESMAEIL FALLAHI, UI
AL GAUS, CSU
TONY HATCH, USU
DONALD JENSEN, USU
MICHAEL REDING, USU
SCHUYLER SEELEY, USU
TONY VALDEZ, NMSU
RICK J. ZIMMERMAN, CSU

This SOMS handbook was designed to help theorchardist use IPM and fruit-tree phenology to their
advantage in producing large volumes of high qualityfruit while minimizing inputs. It includes a phenology
of fruit trees and pests in a fruit tree calendar, anintroduction to integrated pest management, insect
and disease fact sheets, and orchardspraying information.
Temperature data generated by orchard weather stations will beused to predict insect and disease occurrence in grower’s orchards.
This information will be disseminated to extension workers andcollaborators in the project so that they can advise individual farm-ers of the best time to scout for insects and diseases. They will also
give guidance on control measures in the individual states.
INTRODUCTIONFruit production in the intermountain west is besieged with
problems. To cope with these problems, fruit growers must
be competent in financing, banking, buying, public
relations, marketing, meteorology, climatology, plant
science, soil science, entomology, pathology, irrigation,
fertilization, chemistry, physics, mechanics, and
management. Limits of time preclude grower expertise in
each of these critical areas. Therefore, farmers, in addition to
their own understanding, must rely on others for many of
the things they do. The United States Department of
Agriculture Agricultural Research Service (USDA-ARS) and
Cooperative Extension Service (CES) have major roles in
obtaining and supplying factual information to farmers. US
farmers make up a small fraction of society but, through
their spectacularly successful efforts, they provide food and
fiber for hundreds of people per farmer. Farming success
bolstered by USDA-ARS and CES made the industrial and
electronic revolutions possible. The burgeoning success of
society rests on the agricultural advances of the last
century. The remarkable success of food producers has
resulted in expectations that food and fiber supplies will
never be problematic again. However, this may yet prove to
be one of society’s greatest future problems.
1
Farming in the twenty-first century is sophisticated
endeavor. Yet, from placement of the seed or plant, to
growth and development, on through to food production,
the basics remain essentially the same. However, production
strategies have evolved to optimize yields while reducing
inputs on scales undreamed of in the last century. Orchard
management production strategy has also evolved. The
introduction of pesticides, herbicides, and hormones during
the middle of the twentieth century increased output
dramatically. More recently, high-density orchard plantings
have resulted in another dramatic yield increase. Integrated
pest management (IPM) plans have reduced inputs and have
increased production relative to resources used. Today’s
high density, expensive orchards must have sophisticated
operating systems to insure maximum sustainable
production over long periods of time. Inputs must be
quantified to meet critical needs, and they must be timed for
maximum effectiveness. The combination of integrated pest
management with phenological timing (phenology is the
relationship between the growth and development of an
orchard tree and the climatic parameters that affect the trees)
should increase orchard production. This combination is
called the Sustainable Orchard Management System
(SOMS).
INTEGRATED PESTMANAGEMENT INORCHARDSDiane Alston and Michael Reding
1. IPM — WHAT IS IT ANDWHY IS IT HELPFUL?Integrated pest management (IPM) is a concept that hasbeen used in U.S. agricultural industry for about 40 years. Itis “a comprehensive approach to pest management thatuses a combination of cultural, biological, and chemicalcontrols to reduce the status of pests to tolerable levelswhile maintaining a quality environment”. IPM attempts tocombine appropriate and effective pest management tacticsto target the problem pests in a crop or other system. IPMcombines knowledge of pest biology, control, ecology,economics, and environmental factors to develop cropproduction and pest management choices for the grower.IPM is an important component of a sustainable farmsystem.
Key factors of the IPM concept:• IPM has broad application
o Can be applied to any ecosystem (orchard, field,livestock, home, etc.)
o Can be applied to any type of pest (insect, disease,weed, vertebrate, etc.)
• IPM emphasizes an understanding of the systemand pestso Knowledge of total system (e.g., profitable orchard
management practices)o Knowledge of pest biology and ecology
• What does IPM integrate?o Multiple pest management tactics (biological,
cultural, chemical, etc.)o Management of multiple types of pests (weed,
disease, insect, nematode, vertebrate, etc.)o Pest management on a larger-scale (multiple
orchard blocks, farm, county, region, etc.)• Focus is on reducing pests to tolerable levels, not
eradication• Incorporates economic sustainability
o Implement a control when it is economicallyfeasible to do so
o Use pest sampling and thresholds to help makedecisions
2
o Can include aesthethic quality of product orsystem
• Incorporates environmental, human safety, and socialconcernso Pest controls that minimize negative
environmental effectso Pest controls that minimize risks to the farm worker
and consumer
Key steps in an IPM program:• Proper identification of the pest or problem —
Before deciding to take any pest control action, be sure youhave correctly identified the pest (insect, mite, disease,weed, vertebrate, etc.) or problem (nutrient deficiency, waterimbalance, etc.). Proper identification is essential fordetermining if control is necessary and for selection of thebest-suited control options.
• Monitor for pests and injury caused by pests orproblem — It is very important to look for pests and injurysymptoms on a regular basis. It is best to use a consistentsample or survey method. Monitoring traps for insects,diseases, or vertebrates can be used when appropriate.Sampling frequency will depend on the pest and situation,but a general guideline for many insects and diseases is tosample every 1-2 weeks during the main growing season.Look in the places where pests commonly occur —undersides of leaves, on or inside fruit, on or under bark, onroots, in soil, etc.
• Control action guidelines — A grower shoulddevelop a set of guidelines for each situation that guideshis/her decision-making on unacceptable levels of pestinjury. A low level of pest injury can perhaps be ignored ifthe loss will not justify the cost of control. The economicand aesthetic values of the situation need to be considered,and will most likely be the primary factors driving pestcontrol decisions. Other considerations may be theenvironmental, social, and worker and public safety costs ofpest control decisions.
• Time pest controls with “windows ofopportunity” — All types of pests have a life cycle or set of
developmental events that occur during their life time. Thetype of life cycle will vary with the pest. However, mostpests have certain weak points or “windows of opportunity”during their life cycle when they are the most vulnerable tocontrol. For insects, these windows are often during theimmature life stages or just as eggs are hatching. Weeds aretypically easiest to control during their seedling stage, earlyin the season when they are just beginning to grow(annuals), or late in the season when they are preparing fordormancy (perennials). Diseases are often easiest to controlby using preventive or early intervention tactics before thedisease pathogen begins developing or becomesestablished. To optimize management of a pest, controltactics should be targeted for these weak points.
• Consider all available pest management optionsand select the “best” ones — The easiest, lowest cost andoften most reliable way to avoid many pest problems is toprovide a healthy environment that discourages pestactivities and/or reduces the host’s (plant, animal, orecosystem) susceptibility to damage. In general, such
3
methods are long-term tactics that may take some time toput into place, but once established help provide morelong-term and stable pest suppression. For pests thatdirectly attack essential or yield producing structures of thehost (e.g., for plants: fruits, seeds, flowers, stems, trunks),short-term tactics such as pesticides are often the quickestand most reliable pest control option. A combination ofboth short-term and long-term tactics is often the bestapproach.
Examples of short-term and long-term tactics:
Short-term: Long-term:Chemicals CulturalMechanical disruption (habitat modifications)
(mowing, traps, physical Biologicalbarriers) (inoculative, self-
perpetuating)Biological Sanitation
(inundative release of abiocontrol agent)
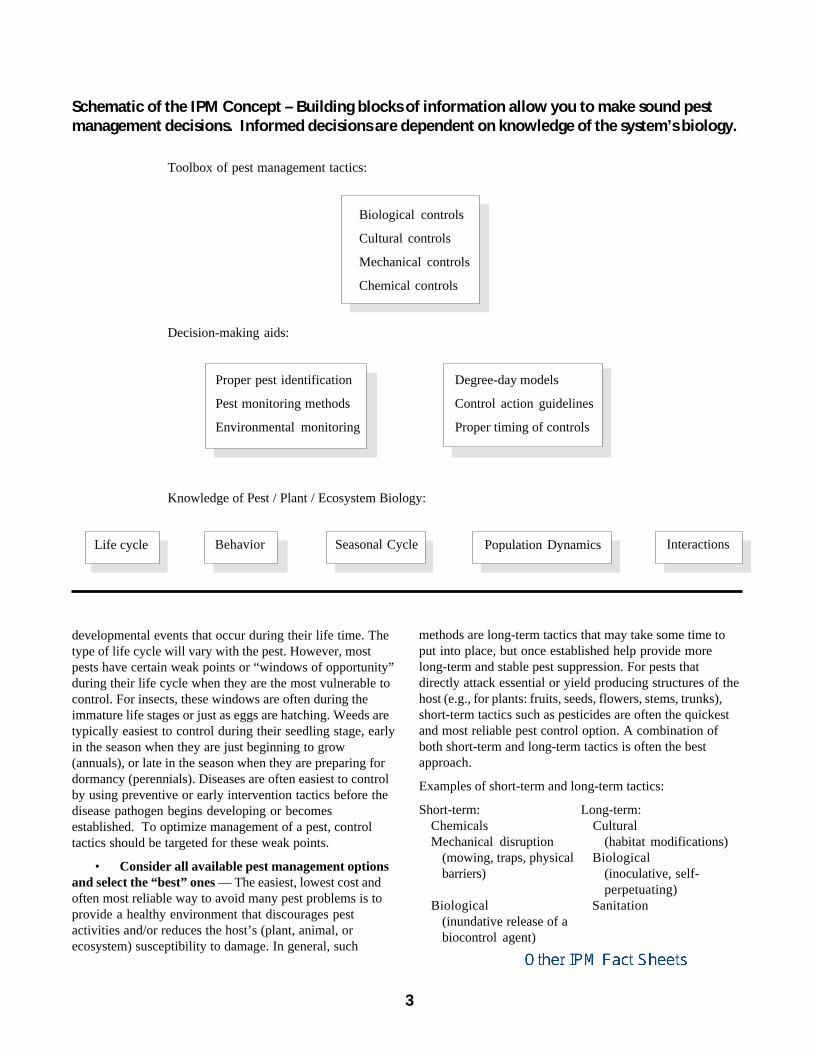
Schematic of the IPM Concept – Building blocks of information allow you to make sound pestmanagement decisions. Informed decisions are dependent on knowledge of the system’s biology.
Toolbox of pest management tactics:
Biological controls
Cultural controls
Mechanical controls
Chemical controls
Decision-making aids:
Proper pest identification Degree-day models
Pest monitoring methods Control action guidelines
Environmental monitoring Proper timing of controls
Knowledge of Pest / Plant / Ecosystem Biology:
Life cycle Behavior Seasonal Cycle Population Dynamics Interactions
4
2. WHY IS WEATHER DATASO IMPORTANT?A pest’s immediate environment often determines howsuccessful it will be in attacking and establishing on a hostplant. Temperature and availability of moisture (relativehumidity and/or rainfall) are the two most importantenvironmental factors for pest development. These factorsare also critical to growth and health of the apple tree.Therefore, monitoring and collection of weather data fromrepresentative apple production areas are critical toprediction of apple tree and pest development over time.Development over time as influenced by climate is termed“phenology”.
Prediction of pest activity is helpful in getting away fromthe calendar-date-based method of applying pesticides orother control measures. Typically, pest managementtimings based on actual presence and activity of the pestwill result in fewer pest control applications and less cost tothe grower. A combination of pest monitoring methods todetermine if, when, and where pests occur and predictivephenology (degree-day) models based on importantclimatic factors (e.g., temperature and moisture) arecommon ways to determine optimal timing of pest controlactions.
Degree-day models for predicting insectdevelopment
Like all living things, insects and mites pass through aseries of developmental stages (e.g., egg, larva, and adult).Insects and mites are cold-blooded, which means their bodytemperature is primarily dependent on the temperature oftheir environment. It also means that the rate at which theypass through their various life stages is dependent ontemperature and when it is too cold, no developmentoccurs. As a result, once we know the range of temperatures(usually expressed as the lower and upper temperaturethresholds) for development of a particular insect or mite,we can use temperature-based models (degree-day models)to predict this development (also known as phenology).Degree-day models can be used to predict when insects ormites will be active, how fast their populations will buildup, or in some cases if they will build to damaging levels.This information can then be used to make decisionsregarding when to apply controls or if they are needed.
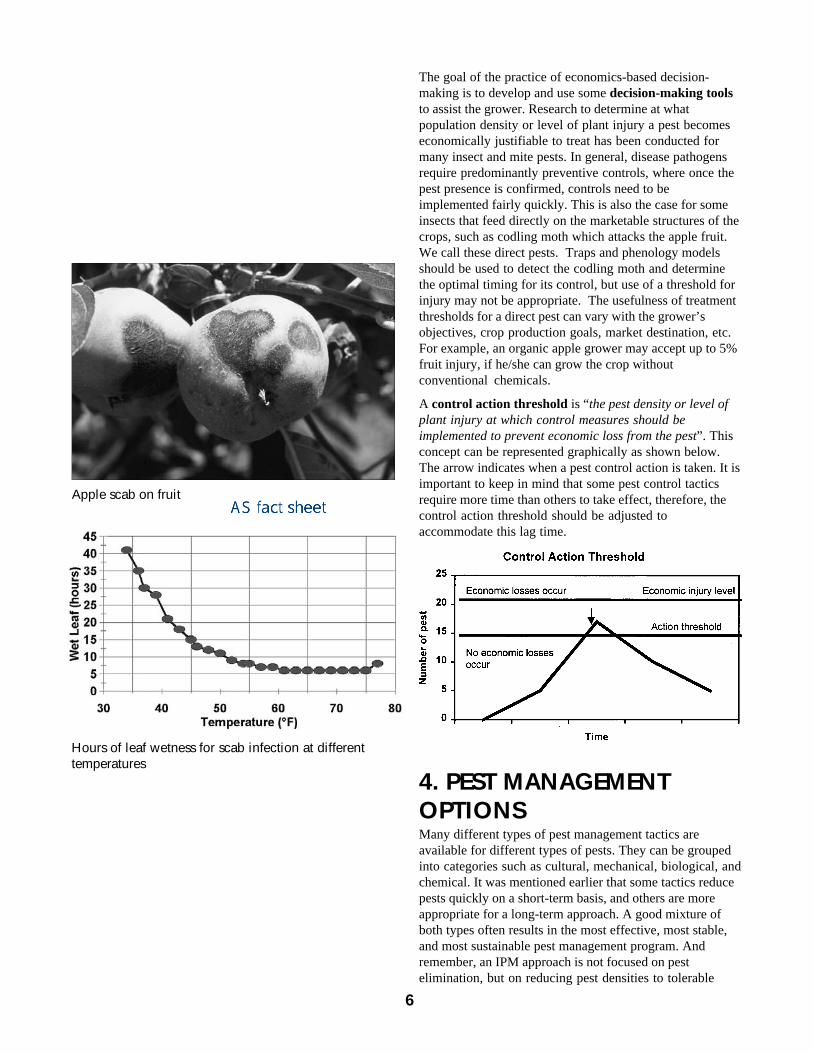
Research has determined upper and lower thresholds fordevelopment of different insect species. Daily maximumand minimum temperatures are collected from thebeginning of the calendar year (January 1) in warmerlocations, or from the beginning of the growing season(approximately March 1) in cooler locations. There are anumber of ways to calculate degree-days. One of the bestand most common methods is to fit a curve to the dailytemperature fluctuation, and then determine the area underthe curve within the boundaries for insect development.
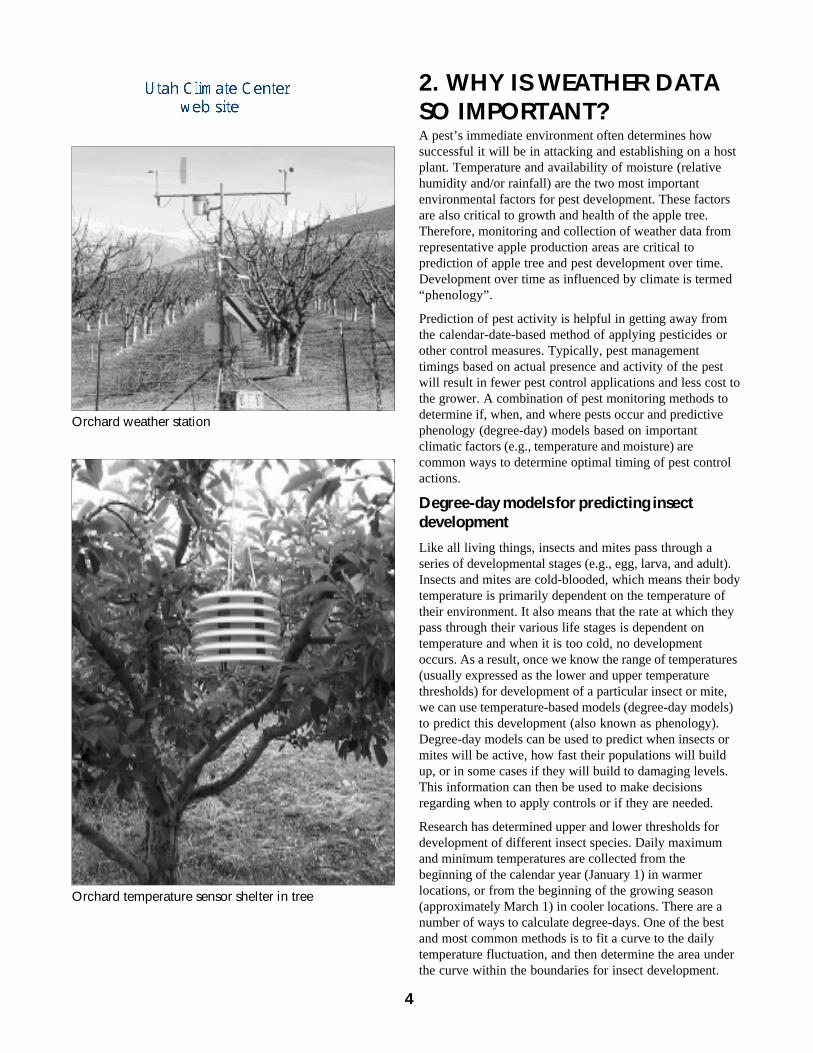
Orchard weather station
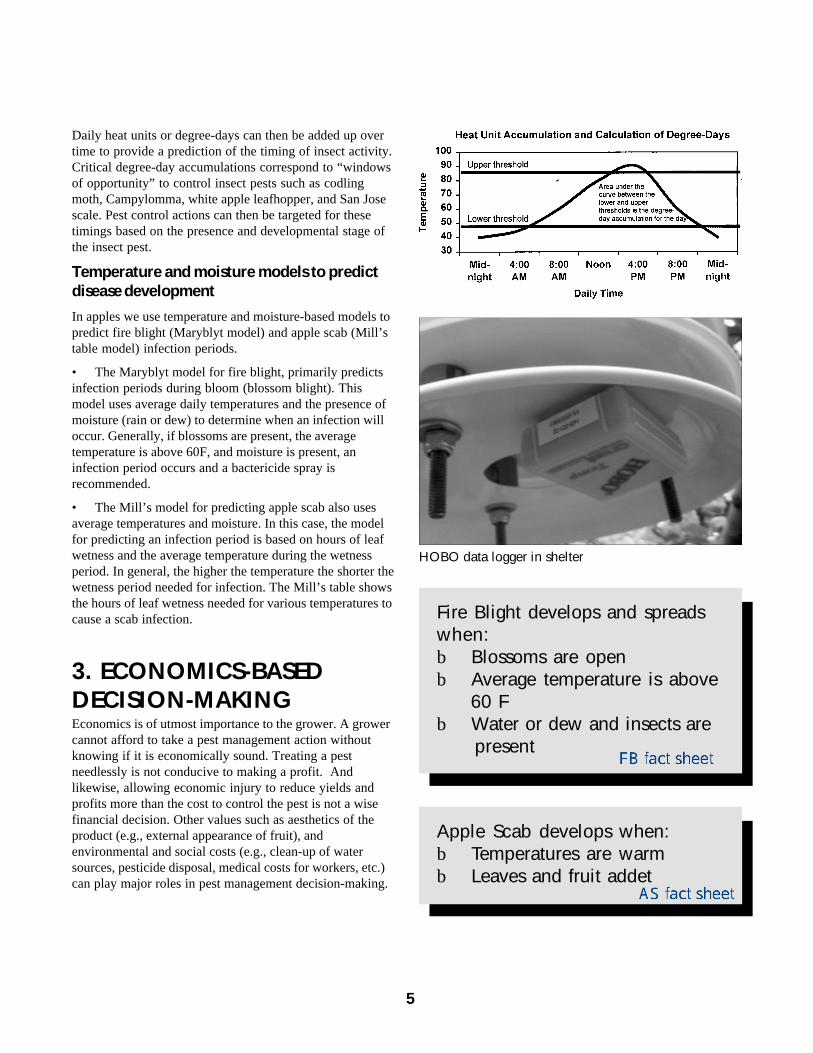
Orchard temperature sensor shelter in tree
Daily heat units or degree-days can then be added up overtime to provide a prediction of the timing of insect activity.Critical degree-day accumulations correspond to “windowsof opportunity” to control insect pests such as codlingmoth, Campylomma, white apple leafhopper, and San Josescale. Pest control actions can then be targeted for thesetimings based on the presence and developmental stage ofthe insect pest.
Temperature and moisture models to predictdisease development
In apples we use temperature and moisture-based models topredict fire blight (Maryblyt model) and apple scab (Mill’stable model) infection periods.
• The Maryblyt model for fire blight, primarily predictsinfection periods during bloom (blossom blight). Thismodel uses average daily temperatures and the presence ofmoisture (rain or dew) to determine when an infection willoccur. Generally, if blossoms are present, the averagetemperature is above 60F, and moisture is present, aninfection period occurs and a bactericide spray isrecommended.
• The Mill’s model for predicting apple scab also usesaverage temperatures and moisture. In this case, the modelfor predicting an infection period is based on hours of leafwetness and the average temperature during the wetnessperiod. In general, the higher the temperature the shorter thewetness period needed for infection. The Mill’s table showsthe hours of leaf wetness needed for various temperatures tocause a scab infection.
3. ECONOMICS-BASEDDECISION-MAKINGEconomics is of utmost importance to the grower. A growercannot afford to take a pest management action withoutknowing if it is economically sound. Treating a pestneedlessly is not conducive to making a profit. Andlikewise, allowing economic injury to reduce yields andprofits more than the cost to control the pest is not a wisefinancial decision. Other values such as aesthetics of theproduct (e.g., external appearance of fruit), andenvironmental and social costs (e.g., clean-up of watersources, pesticide disposal, medical costs for workers, etc.)can play major roles in pest management decision-making.
5
Fire Blight develops and spreadswhen:b Blossoms are openb Average temperature is above
60 Fb Water or dew and insects are
present
Apple Scab develops when:b Temperatures are warmb Leaves and fruit addet
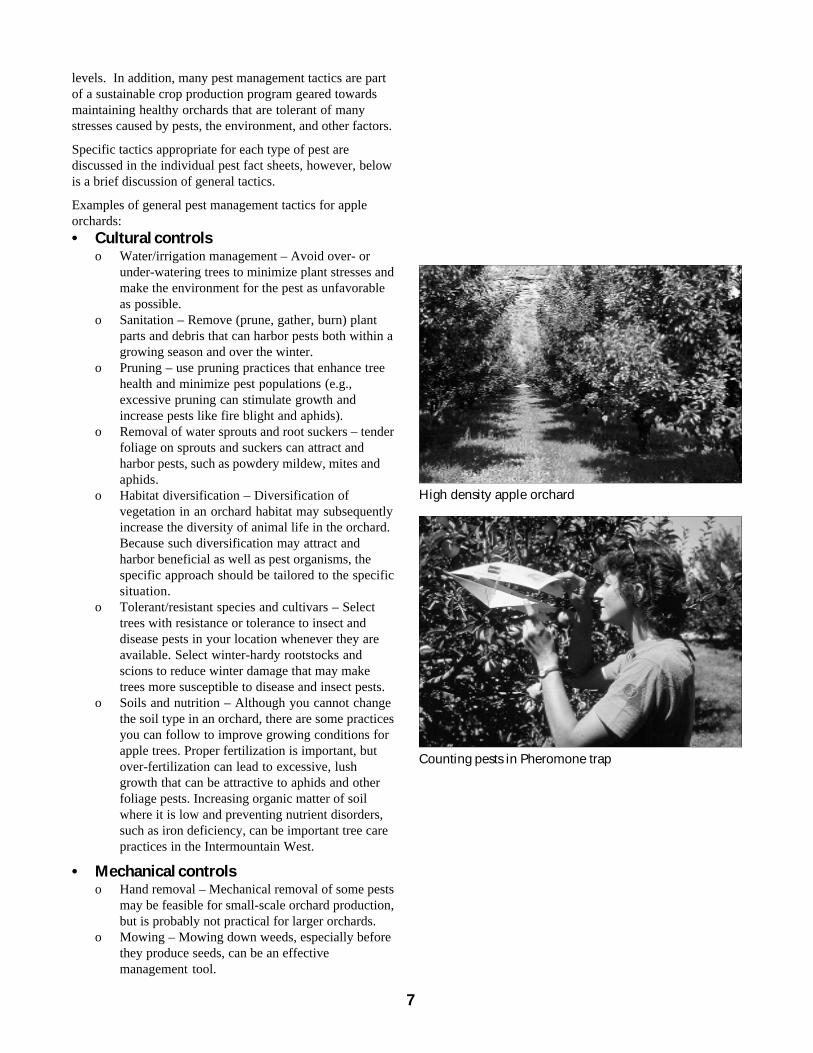
HOBO data logger in shelter
6
The goal of the practice of economics-based decision-making is to develop and use some decision-making toolsto assist the grower. Research to determine at whatpopulation density or level of plant injury a pest becomeseconomically justifiable to treat has been conducted formany insect and mite pests. In general, disease pathogensrequire predominantly preventive controls, where once thepest presence is confirmed, controls need to beimplemented fairly quickly. This is also the case for someinsects that feed directly on the marketable structures of thecrops, such as codling moth which attacks the apple fruit.We call these direct pests. Traps and phenology modelsshould be used to detect the codling moth and determinethe optimal timing for its control, but use of a threshold forinjury may not be appropriate. The usefulness of treatmentthresholds for a direct pest can vary with the grower’sobjectives, crop production goals, market destination, etc.For example, an organic apple grower may accept up to 5%fruit injury, if he/she can grow the crop withoutconventional chemicals.
A control action threshold is “the pest density or level ofplant injury at which control measures should beimplemented to prevent economic loss from the pest”. Thisconcept can be represented graphically as shown below.The arrow indicates when a pest control action is taken. It isimportant to keep in mind that some pest control tacticsrequire more time than others to take effect, therefore, thecontrol action threshold should be adjusted toaccommodate this lag time.
4. PEST MANAGEMENTOPTIONSMany different types of pest management tactics areavailable for different types of pests. They can be groupedinto categories such as cultural, mechanical, biological, andchemical. It was mentioned earlier that some tactics reducepests quickly on a short-term basis, and others are moreappropriate for a long-term approach. A good mixture ofboth types often results in the most effective, most stable,and most sustainable pest management program. Andremember, an IPM approach is not focused on pestelimination, but on reducing pest densities to tolerable
Apple scab on fruit
Hours of leaf wetness for scab infection at differenttemperatures
levels. In addition, many pest management tactics are partof a sustainable crop production program geared towardsmaintaining healthy orchards that are tolerant of manystresses caused by pests, the environment, and other factors.
Specific tactics appropriate for each type of pest arediscussed in the individual pest fact sheets, however, belowis a brief discussion of general tactics.
Examples of general pest management tactics for appleorchards:• Cultural controls
o Water/irrigation management – Avoid over- orunder-watering trees to minimize plant stresses andmake the environment for the pest as unfavorableas possible.
o Sanitation – Remove (prune, gather, burn) plantparts and debris that can harbor pests both within agrowing season and over the winter.
o Pruning – use pruning practices that enhance treehealth and minimize pest populations (e.g.,excessive pruning can stimulate growth andincrease pests like fire blight and aphids).
o Removal of water sprouts and root suckers – tenderfoliage on sprouts and suckers can attract andharbor pests, such as powdery mildew, mites andaphids.
o Habitat diversification – Diversification ofvegetation in an orchard habitat may subsequentlyincrease the diversity of animal life in the orchard.Because such diversification may attract andharbor beneficial as well as pest organisms, thespecific approach should be tailored to the specificsituation.
o Tolerant/resistant species and cultivars – Selecttrees with resistance or tolerance to insect anddisease pests in your location whenever they areavailable. Select winter-hardy rootstocks andscions to reduce winter damage that may maketrees more susceptible to disease and insect pests.
o Soils and nutrition – Although you cannot changethe soil type in an orchard, there are some practicesyou can follow to improve growing conditions forapple trees. Proper fertilization is important, butover-fertilization can lead to excessive, lushgrowth that can be attractive to aphids and otherfoliage pests. Increasing organic matter of soilwhere it is low and preventing nutrient disorders,such as iron deficiency, can be important tree carepractices in the Intermountain West.
• Mechanical controlso Hand removal – Mechanical removal of some pests
may be feasible for small-scale orchard production,but is probably not practical for larger orchards.
o Mowing – Mowing down weeds, especially beforethey produce seeds, can be an effectivemanagement tool.
7
High density apple orchard
Counting pests in Pheromone trap
8
o Traps – Attractive traps can be used to mass trapand remove pests from an orchard or to monitortheir activity so that control actions can beappropriately timed. Traps are primarily used forinsect and vertebrate pests, and for some diseasepests. Attractive traps typically use visual cues(color) and/or odors (pheromones, food baits) toattract pests to them. Passive traps may be placedin areas of common pest activity or use windcurrents to catch pests.
o Trunk bands – trunk bands made from corrugatedcardboard are a special type of trap designed toconcentrate overwintering codling moth larvaewhere they can be destroyed.
o Physical barriers – Barriers can be used to block ordisrupt the movement of pests.
• Biological controlso Predators – an organism that eats or consumes
another (e.g., predatory insects and mites)o Parasites – an organism that lives in or on another
and kills it (parasitoid) while completing its lifecycle (e.g., parasitic insects)
o Pathogens – microbial organisms that attack andinvade other organisms (e.g., bacteria, viruses,nematodes), or out-compete other plant pathogensfor space or resources on the plant surface
o Herbivorous insects of weeds – plant-feedinginsects that attack weeds
The predominant way in which biological control agentshave been used successfully in orchards is byencouragement and enhancement of those that occurnaturally (or were introduced at one time, but now colonizenew environments on their own). Many predators,parasitoids, and pathogens occur naturally and arecontinually working to help keep nature in balance. Theimportance of “natural enemies” is often not appreciateduntil a broad-spectrum pesticide, which kills manybeneficials as well as the targeted pest, is applied and a newpest – suddenly released from biological control – becomesa serious problem. Some good examples of this type of pest,which is termed a secondary pest, are spider mites andaphids. In most cases, the purchase and release of abiological control agent into orchard environments, eitherwith an inundative release (flooding an area with highdensities of the agent to reduce the pest in the short-term) orwith an inoculative release (release agent over a period oftime to help it colonize and spread) have not proveneffective. An exception to this is the inundative applicationof microbial agents that will compete with detrimental plantpathogens on the apple tree surfaces.
The greatest assistance a grower can provide to naturalbiological controls is to avoid activities that areantagonistic to the control agents and to adopt practicesthat encourage the agents. Some examples are: useselective pesticides and target them to pest-problem spots;provide a habitat that is more favorable for natural enemies
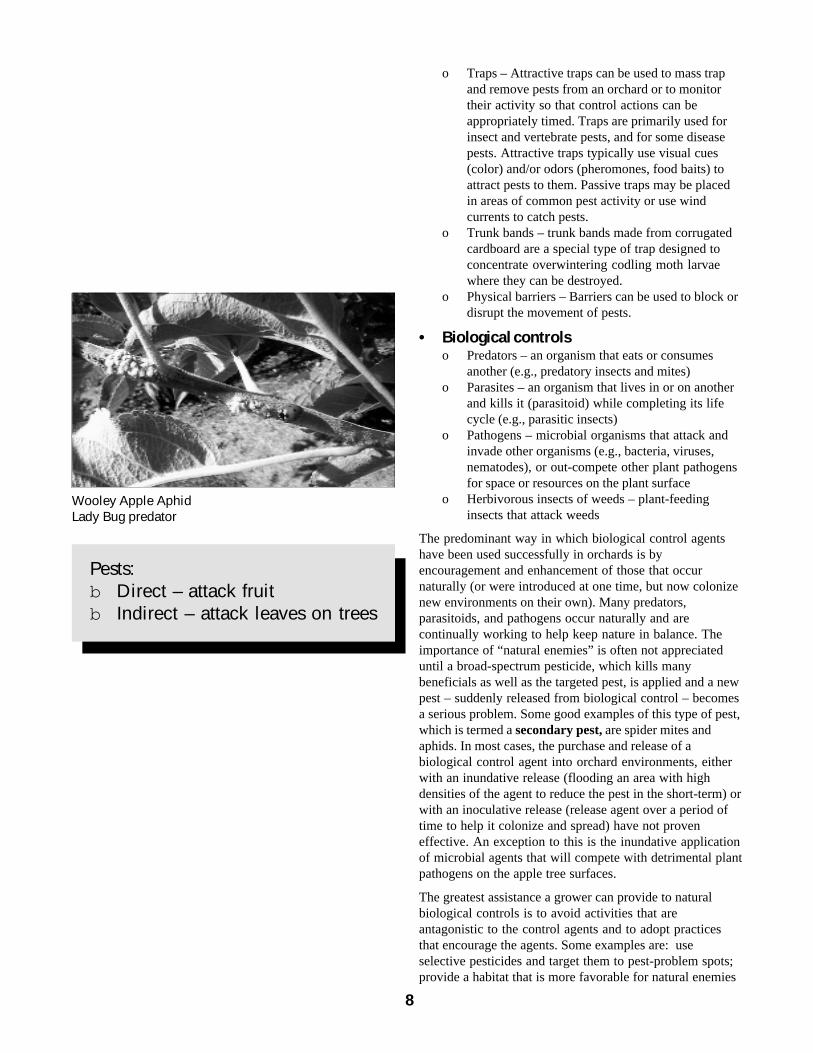
Pests:b Direct – attack fruitb Indirect – attack leaves on trees
Wooley Apple AphidLady Bug predator

by choosing adjacent plants that supply nectar, pollen,alternate hosts, and structural protection; avoid completeremoval of habitat for beneficials (ground covers, bordervegetation); and provide adequate organic matter in soil toensure good habitat for soil microorganisms that control avariety of pests, particularly soil pathogens and root-feeding nematodes.
• Chemical controlsA pesticide is “any substance applied to control insects,fungi, bacteria, weeds, vertebrates, or other pests”. Sincethe advent of “synthetic” pesticides in the 1940’s, growershave become very reliant on their generally simple-to-use,fast-acting, and effective attributes to manage the majorityof pest problems. In recent times, resistance of pests topesticides because of their high use has become a majorproblem. To reduce the reliance on pesticides as a single-pronged approach to pest management, growers shouldbecome more familiar with all types of pest control tactics,so that the “best” ones (most effective, least environmentaland human safety impacts, most cost-effective) can beselected for each situation. Although pesticides haveperhaps been over-used in recent decades, they still remainan important tool in the pest management toolbox.Avoidance of overuse will allow them to remain as viablepest control tools for many more decades to come.
Many types of chemicals used before the development ofsynthetic pesticides are now becoming popular once againas alternative or “organic” pest controls. In addition, manynew chemical products are being developed, such asbiologicals, pheromone-based mating disruption, and insectgrowth regulators. The U.S. Environmental ProtectionService is encouraging the development of more selectiveand “softer” pesticides through its product registration andrenewal programs.
o Synthetic pesticides – human-made in thelaboratory; chemically joined compounds orelements
o Organic pesticides – derived from plant, animal ornaturally occurring rock or petroleum oil sources
o Biological pesticides – a subset of organics thatspecifically refer to products developed fromliving microbial agents, such as bacteria, viruses,fungi and protozoa
o Insect growth regulators (IGRs) – chemicals thatmimic natural growth regulators in insects; theyinterfere with the normal processes of insectgrowth and development
Pheromone-based mating disruptionInsect mating disruption technology has greatly expandedin the last decade. This insect control technique has provenvery successful under certain conditions and is now used onlarge acreages of apples in the Pacific Northwest for controlof codling moth. The large reductions in use of syntheticpesticides in these apple-producing areas has resulted inenhanced biological control and improved management of
9
Chemical storage and safety equipment
Keeping the tree row weed free combined with a grasscover crop will help in controlling some insects
PAK Tank herbicide sprayer
10
many secondary pests, but also in the release of some insectpests from insecticide control, such as leafrollers.
The technology relies on the release of high concentrationsof a synthetic chemical mimic of the insect’s sexpheromone to confuse or disrupt mating behavior of thetargeted insect. It has been found that mating in codlingmoth populations is greatly delayed under matingdisruption programs, and so very few viable eggs areproduced. Improvements in the dispensers and applicationtechnology have moved this insect control program to theforefront for codling moth control in the Pacific Northwest.However, the conditions under which the technologyperforms well do not apply to all fruit growing areas. Thesize of the orchard, proximity to outside sources of matedcodling moth, and dispenser placement and application ratecan all have major influences on the success of this tactic.The typically small size of apple orchards in theIntermountain West and Southwest (2-10 acres) and thehigh codling moth populations reduce the effectiveness ofmating disruption in these areas as compared to other areasin the West. Therefore, those growers who are interested inusing mating disruption should consider the factorsdiscussed above that will increase the likelihood of success,and proceed with caution. A change-over to the use ofmating disruption from a primarily synthetic chemicalprogram requires a transitional period where syntheticinsecticides are slowly phased out.
Delayed dormant oil spraysA key time to control pests (insects and diseases) thatoverwinter on apple trees is during the delayed dormantperiod. Examples of these types of apple pests are powderymildew, apple scab, aphids, European red mite, and SanJose scale. The delayed dormant timing comes just as theapple leaf buds begin to swell and open in the spring. Asuperior-type dormant oil applied at this time incombination with the appropriate chemical for control ofthe targeted pests can provide good early-season pestcontrol and prevent early-season stresses to the apple tree.Some other benefits to delayed dormant applications arethat they have minimal negative effects on natural enemiesif applied correctly, and target the oil to sites where pestsare concentrated. The mode of action of oil is bysuffocation, and so development of pest resistance to thistype of chemical is unlikely.
Pesticide resistanceThe overuse of pesticides has led to the development ofresistance in the target pests. Pesticide resistance hasoccurred in many types of pests, including diseases, weeds,insects and mites. It makes sense that when an organism isrepeatedly exposed to a certain type of chemical, that it candevelop a tolerance to it. Resistance has not only beenshown to occur for a specific chemical, but cross-resistanceto other chemicals with a similar mode of action can alsooccur. Cross-resistance in a pest has even beendemonstrated across classes or types of pesticides.
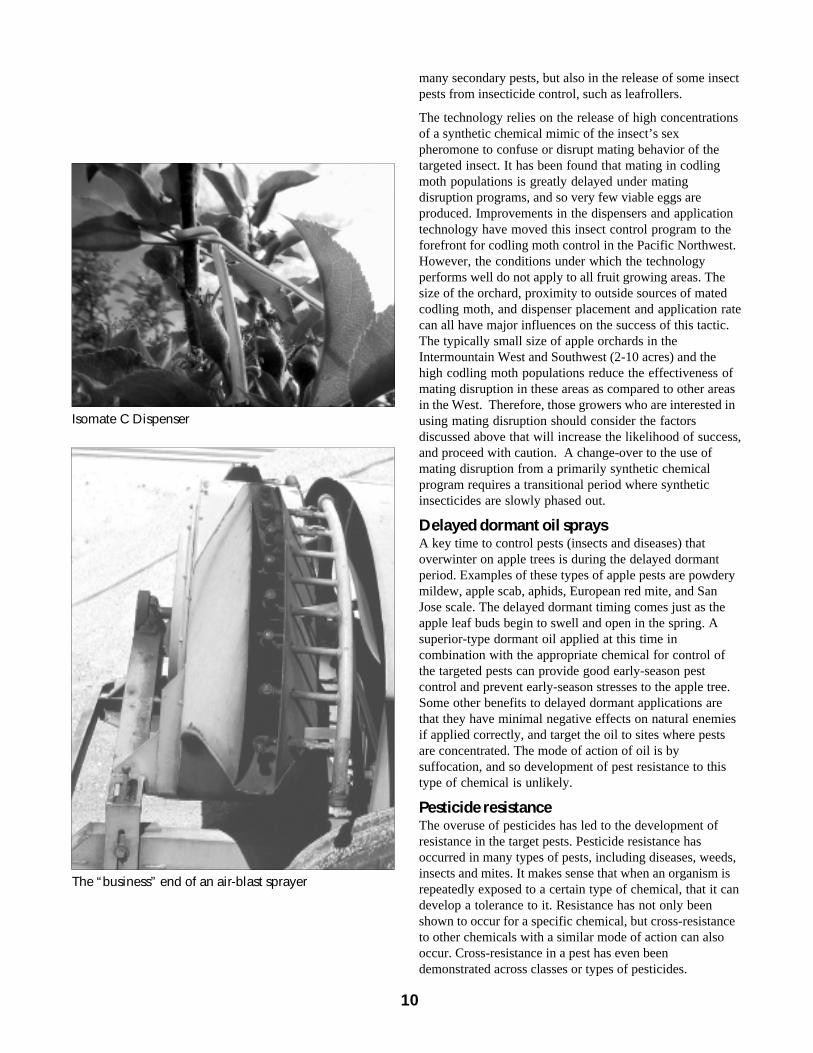
Isomate C Dispenser
The “business” end of an air-blast sprayer

Therefore, wise and judicious use of chemicals is critical topromotion of their long-term effectiveness. Good chemicaluse practices include selecting non-chemical alternativeswhenever feasible, rotating between different types ofchemicals, applying chemicals at the labeled rate so as tonot over-dose or under-dose, and getting good coverage toensure exposure of all pest individuals in the population tothe chemical. Failures in chemicals to control pests canresult from resistance, but failures more commonly resultfrom problems associated with application, such asincorrect rate, inadequate coverage, or improper timing.
5. FITTING IT ALLTOGETHER: PRACTICINGIPM IN THE APPLEORCHARDThe components of an IPM program may seem numerousand complex. However, a strong advantage of using an IPMapproach over a straight conventional chemical approach isthat IPM offers many options and is robust in its ability toaccommodate specific situations. Even though there aremany similarities across apple orchards in the western U.S.,each orchard presents a unique situation with uniqueconsiderations. Therefore, under an IPM program a growerhas many choices to select from to tailor a pest managementprogram that is ideal for his/her situation.
The underlying foundation of a solid IPM program isknowledge of the crop system and pest biology. The secondstep is obtaining quality information about the occurrenceand abundance of pests in the crop system. An IPM programis information-intensive. This intensity of information canbe a deterrent for growers who feel their hands are alreadyfull with managing the apple production, farm-worker, andmarketing aspects of the operation. Time invested ingathering quality information does pay off in the end whenfewer control tactics need to be implemented, the timing ofcontrol practices is improved so that pest control isenhanced, fewer pesticides are applied or at least fewerbroad-spectrum chemicals that have negative effects onnatural enemies, and more time is spent learning about thebiology of the system rather than trying to kill unwantedpests. An IPM program fits into an overall sustainableorchard management program that emphasizes workingwith the system rather than fighting against it.
11
“King Bloom” open-laterals still not opened
Full bloom in apple

1
CODLING MOTH (pest of apples and pears)• Key pest of apple in the western United states.• Damaging stage: worms, larva tunnels, and excrement
in Fruit.• Use pheromone traps to monitor male moths and set
biofix.• Degree-day (DD) model used to time sprays based on
biofix.• Optimum time for first cover spray is 250 DD after
biofix.• Second cover spray is applied based on the residual
period for the chemical.• Time third cover spray at 1260 DD after biofix.• Guthion and Imidan are the most effective insecticides
for controlling codling moth.
See fact sheet in back of manual for more information.
TWO SPOTTED AND McDANIEL SPIDERMITES: (pests of most tree fruits)• Invade tree from the groundcover.• Mites build up on broadleaf weeds in the ground cover,
grass is a good groundcover to help prevent mitebuild-ups.
• Mites feed on leaves causing white speckling,bronzing, and defoliation.
• Tree vigor, fruit color, fruit size, and production can bereduced.
• Mites can be highly destructive during hot summermoths.
• Begin scouting in mid-June• To sample, select 10 trees and collect 10 leaves (inside
to edges of canopy) from each tree.• You do not need to count the mites on each leaf, just
determine if mites are present or not.• If 7 or less leaves out of 10 have mites and at least 5 out
of 10 have predators, re-sample in 2 weeks.• If 8-10 leaves out of 10 have mites and at least 5 out
10 have predators re-sample in I week.• If 10 out of 10 leaves have mites and less than 5 out of
10 have predators, consider applying a miticide.• Agri Mek and Pyramite are miticides that are generally
effective against mites and soft on predators.
See fact sheet in back of manual for more information.
IPM ON APPLE: MOSTIMPORTANT INSECT/MITEPESTS AND SYNOPSES OF
CONTROL MEASURES
Codling moths in sticky trap
Codling moth frass
Two spotted mite adult, juvenile, egg
2

EUROPEAN RED MITE (pest of most tree fruits,especially apples, pears, and cherries)• Remain in tree year round.• Mites feed on leaves causing white speckling,
bronzing, and defoliation.• Tree vigor, fruit numbers, color, fruit size, and
production can be reduced.• Mites can be highly destructive during hot summer
moths.• If the orchard has a history of red mites, apply a
Superior type oil (dormant oil) at half-inch green.• Dilute sprays of 200-400 gal/acre are most effective,
1- 5 gal of oil per 100 gal of water.• Good coverage is critical, the oil must cover the over-
wintering eggs.• Scout for post bloom populations starting in late May• For miticides and treatment thresholds see web
spinning spider mites above
See fact sheet in back of manual for more information.
Red mite eggs on apple bud
1
Two spotted mite webs
Predator mite
Predator mite
3
14
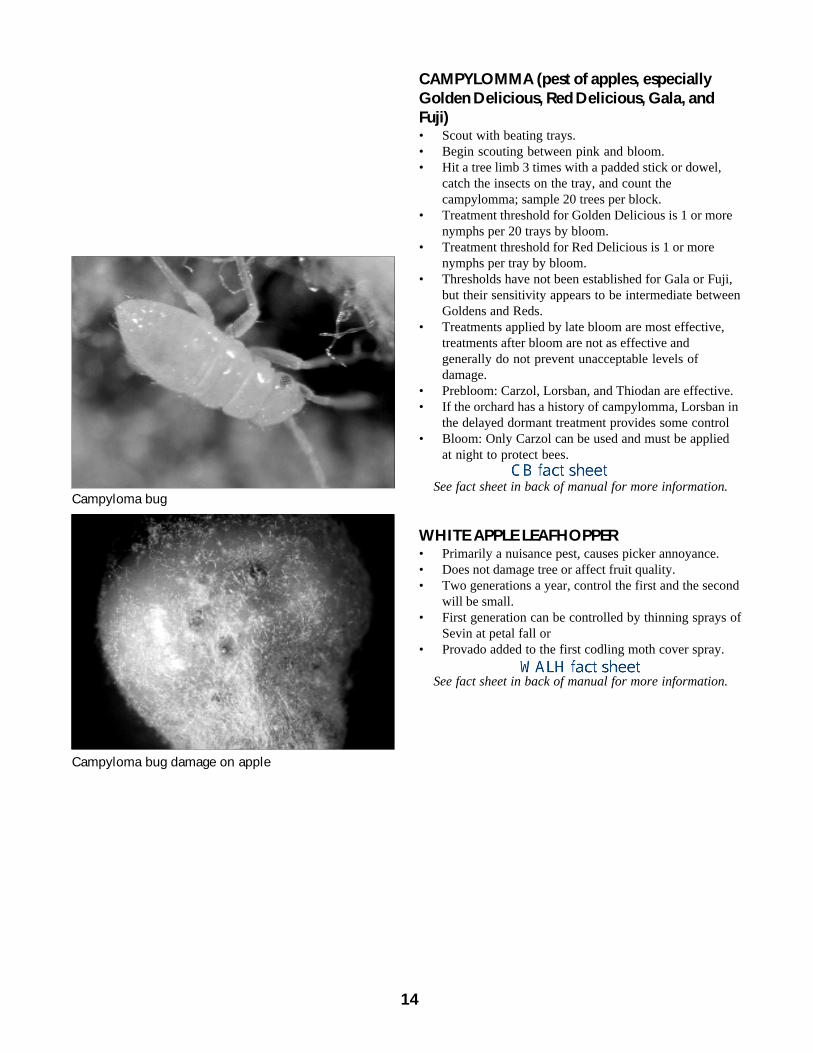
CAMPYLOMMA (pest of apples, especiallyGolden Delicious, Red Delicious, Gala, andFuji)• Scout with beating trays.• Begin scouting between pink and bloom.• Hit a tree limb 3 times with a padded stick or dowel,
catch the insects on the tray, and count thecampylomma; sample 20 trees per block.
• Treatment threshold for Golden Delicious is 1 or morenymphs per 20 trays by bloom.
• Treatment threshold for Red Delicious is 1 or morenymphs per tray by bloom.
• Thresholds have not been established for Gala or Fuji,but their sensitivity appears to be intermediate betweenGoldens and Reds.
• Treatments applied by late bloom are most effective,treatments after bloom are not as effective andgenerally do not prevent unacceptable levels ofdamage.
• Prebloom: Carzol, Lorsban, and Thiodan are effective.• If the orchard has a history of campylomma, Lorsban in
the delayed dormant treatment provides some control• Bloom: Only Carzol can be used and must be applied
at night to protect bees.
See fact sheet in back of manual for more information.
WHITE APPLE LEAFHOPPER• Primarily a nuisance pest, causes picker annoyance.• Does not damage tree or affect fruit quality.• Two generations a year, control the first and the second
will be small.• First generation can be controlled by thinning sprays of
Sevin at petal fall or• Provado added to the first codling moth cover spray.
See fact sheet in back of manual for more information.
Campyloma bug
Campyloma bug damage on apple

APPLE APHIDS (Primarily pests of apple)Green Apple Aphids• Build up slowly in spring, colonies are generally not
noticeable until mid-June or later.• Begin scouting in mid-June and scout for colonies
about every 2 weeks or so.• Feed on flush growth of terminals and produce a sticky
substance called honeydew.• Aphids are only a problem on established trees when
colonies become so large that honeydew drips onto thefruit.
• Aphids have a lot of natural enemies, check coloniesfor lady beetles, lacewings and syrphid larvae. Thesepredators will often reduce aphid numbers to tolerablelevels.
Rosy Apple Aphids• Generally build up from pink to about mid-June, then
they leave orchards for other hosts.
Both aphids overwinter as eggs on the tree. Window ofopportunity for control is at delayed dormant (half-inchgreen). Apply a dormant oil plus an organophosphate suchas Supracide or Lorsban (also controls campylomma).During summer Provado is an effective treatment.
See fact sheet in back of manual for more information.
OTHER PESTS: See fact sheets in back ofmanual.San Jose ScaleWestern Flower ThripsWestern Tentiform Leafminer
1
Leafhopper
Apple aphids
5
16
Economic Threshold (ET)Pest control can be achieved best when the grower knowswhat pests are active in his orchard. This requires lookingfor the pests (scouting) when weather data indicates theymay be present. The value of the phenological approach isin the ability to predict when scouting is needed becausepests may be present. Once the pest has been identified,control measures can begin. It is counterproductive to sprayfor pests when they first are found in the orchard. Theirnumbers may never rise to a level that will cause economicdamage. Natural predators may provide control. Scoutingshould monitor the pest and predators of the pest. ET forspecific pests depends on predator levels. When pestsnumbers are high without correspondingly high numbers ofpredators, control may be needed. However, when pestnumbers are high and predator numbers are also high,predators may provide the control and artificial controlmethods may not be needed. It is important to know theeconomic threshold level, the level at which the damage orcrop loss becomes greater than the cost of control. And it isimportant to remember that threshold levels may changedue to predator populations.
Economic thresholds will usually be lower for pests thatdirectly attack fruit. Pests that attack leaves, bark, or shootscan cause indirect damage when photosynthesis isdecreased due to decreased productive foliage in theorchard canopy. Codling moth is an example of a directpest that attacks the fruit while western tentiform leafminercauses indirect damage. When a codling moth attacks afruit, a cull results, but when a tentiform leafminer reducesthe photosynthetic apparatus by mining a leaf the damageis not as serious.
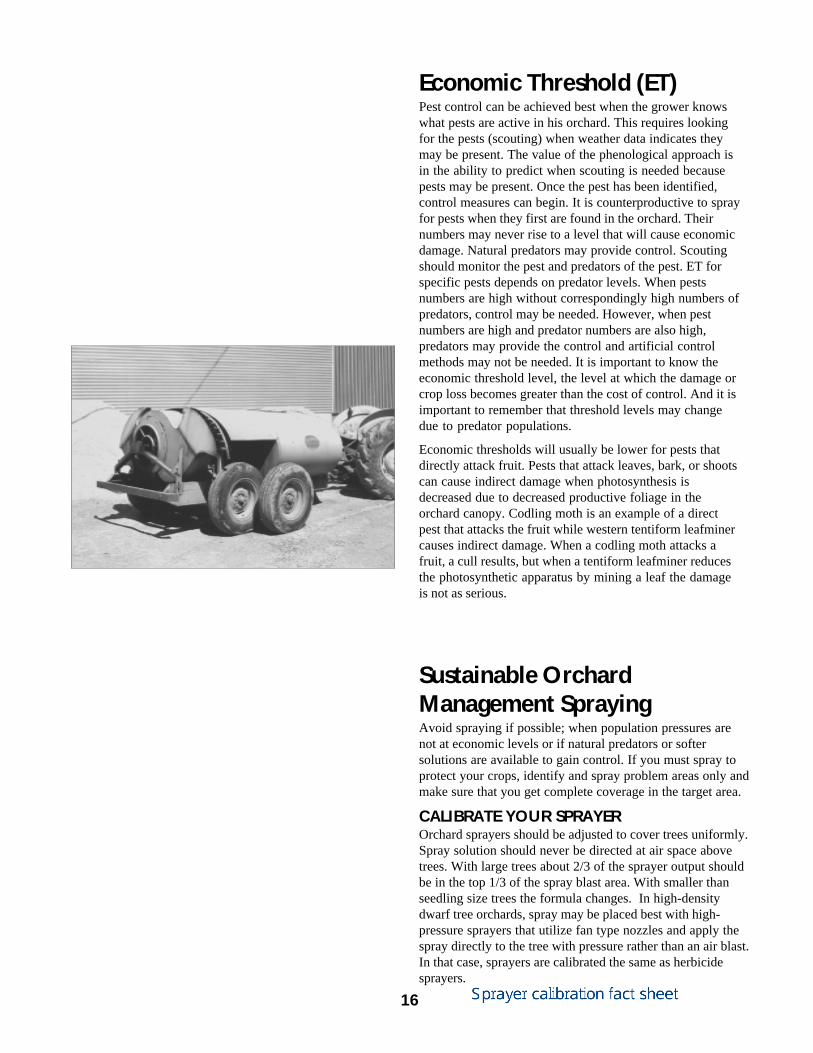
Sustainable OrchardManagement SprayingAvoid spraying if possible; when population pressures arenot at economic levels or if natural predators or softersolutions are available to gain control. If you must spray toprotect your crops, identify and spray problem areas only andmake sure that you get complete coverage in the target area.
CALIBRATE YOUR SPRAYEROrchard sprayers should be adjusted to cover trees uniformly.Spray solution should never be directed at air space abovetrees. With large trees about 2/3 of the sprayer output shouldbe in the top 1/3 of the spray blast area. With smaller thanseedling size trees the formula changes. In high-densitydwarf tree orchards, spray may be placed best with high-pressure sprayers that utilize fan type nozzles and apply thespray directly to the tree with pressure rather than an air blast.In that case, sprayers are calibrated the same as herbicidesprayers.
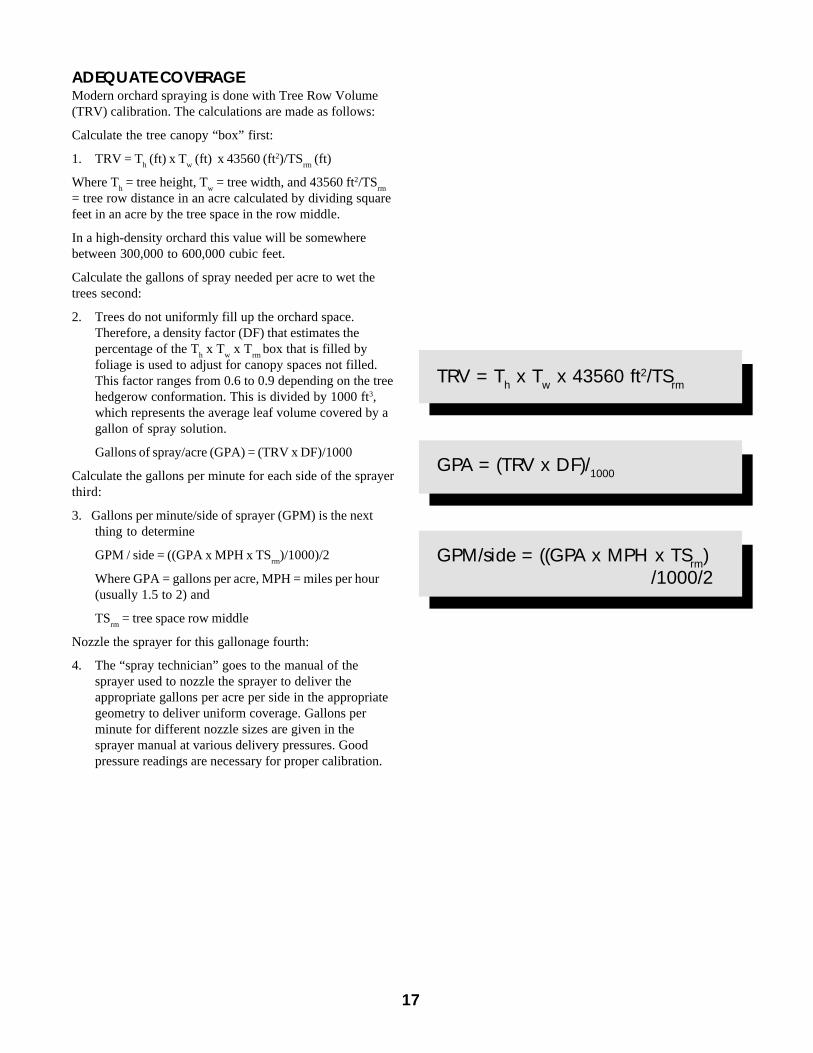
ADEQUATE COVERAGEModern orchard spraying is done with Tree Row Volume(TRV) calibration. The calculations are made as follows:
Calculate the tree canopy “box” first:
1. TRV = Th (ft) x T
w (ft) x 43560 (ft2)/TS
rm (ft)
Where Th = tree height, T
w = tree width, and 43560 ft2/TS
rm
= tree row distance in an acre calculated by dividing squarefeet in an acre by the tree space in the row middle.
In a high-density orchard this value will be somewherebetween 300,000 to 600,000 cubic feet.
Calculate the gallons of spray needed per acre to wet thetrees second:
2. Trees do not uniformly fill up the orchard space.Therefore, a density factor (DF) that estimates thepercentage of the T
h x T
w x T
rm box that is filled by
foliage is used to adjust for canopy spaces not filled.This factor ranges from 0.6 to 0.9 depending on the treehedgerow conformation. This is divided by 1000 ft3,which represents the average leaf volume covered by agallon of spray solution.
Gallons of spray/acre (GPA) = (TRV x DF)/1000
Calculate the gallons per minute for each side of the sprayerthird:
3. Gallons per minute/side of sprayer (GPM) is the nextthing to determine
GPM / side = ((GPA x MPH x TSrm
)/1000)/2
Where GPA = gallons per acre, MPH = miles per hour(usually 1.5 to 2) and
TSrm
= tree space row middle
Nozzle the sprayer for this gallonage fourth:
4. The “spray technician” goes to the manual of thesprayer used to nozzle the sprayer to deliver theappropriate gallons per acre per side in the appropriategeometry to deliver uniform coverage. Gallons perminute for different nozzle sizes are given in thesprayer manual at various delivery pressures. Goodpressure readings are necessary for proper calibration.
1
TRV = Th x Tw x 43560 ft2/TSrm
GPA = (TRV x DF)/1000
GPM/side = ((GPA x MPH x TSrm) /1000/2
7

18
Spray deposition patterns can be evaluated with watersensitive paper targets (Gemplers, www.gemplers.com, watersensitive 2 x 3” yellow cards turn blue when wet) held withclothes pins taped or glued to 1” schedule 40 PVC pipe at 1foot intervals. In a pinch, 3 x 5 inch coated cards will do.This “target pole” is placed in the center of the tree. Thetree is sprayed normally, and the deposition pattern isestimated from the watermarks on the papers. Adjustmentsin nozzle sizes can be made to equalize chemicaldistribution throughout the tree canopy and block off anyjets aimed above or below the trees. With large trees about2/3 of the spray needs to exit the upper 1/3 of the nozzlebank. With small trees it pays handsome dividends to“aim” the spray solution to get uniform tree coverage.
Orchard spraying is best when:
1. Sprayer speed is 2 miles per hour or less.
2. Spray is applied when winds are below 5 mph.
3. Sprayer has been calibrated properly.
4. Nozzle and air blast pressures are low in order to avoidspray particles that will not impact on plant material.
Tractor odometers are usually not accurate. Pace off andmark 30, 45, and 60 three-foot paces.
If your sprayer passes 29 paces per minute your mph »1.0
If your sprayer passes 44 paces per minute your mph »1.5
If your sprayer passes 58 paces per minute your mph »2.0
Adjust your accelerator to move your sprayer 2 mph. Markthis adjustment.
Speeds faster than 2 mph result in decreased spraydeposition on the canopy.
ALTERNATE ROW MIDDLE SPRAYINGIn large orchards good insect control has been obtained
by spraying every other row every other time. Of course,each spray needs to be applied to the outer rows of theorchard due to the higher insect and disease impactsoccurring there. To incorporate this strategy into yourorchard spraying, experiment with it on a small-scale oneyear and if it works for you increase areas sprayed insubsequent years.
DIRECTIONAL VS AIR BLAST SPRAYINGIn high-density hedgerow systems, directional high
pressure spraying, like that used for weed sprays, usingbooms located close to the tree canopy periphery can bevery effective. Calibration, similar to weed spraying with aboom, is really important with directional spraying.
Target pole in tree for spray distribution

THE FRUIT TREE CALENDARTemperate-zone climates have variable seasons from year toyear. Falls and winters may be harsh or mild, springs may bewarm or cold, and summers may be cool or hot, and theannual weather cycle can be various combinations of theabove seasons. The most constant characteristics of theweather in this zone are variability and change. As a result,perennial plants, which have developed mechanisms thatallow them to survive seasonal variability, have developedto respond to environmental cues that regulate their growthand development. Estimating tree status from the standardcalendar in such variable season to season and year to yearweather results in wide variations in time for various treegrowth and developmental stages. This variability isespecially true of tree fruits. However, when tree growthand development are related to their environmental drivingfactors in the mode of a tree/environment calendar, thevariability significantly diminishes.
Tree growth and development simply does not follow thestandard calendar. In some years apricots complete theirdormancy early and start growing in January. Usually,depending on extent of growth, these apricot flower budssuccumb to subsequent freezes. In other years, when theweather is colder, they do not begin to develop until muchlater. Apples, on the other hand, have a long dormancyperiod and usually do not begin to grow until late Februaryor March. The dependency of perennial fruit trees onchanges in the weather from year to year illustrates the factthat a fruit tree calendar should be characterized by plantresponse to influencing weather parameters rather than todays of the standard calendar.
A fruit tree calendar, like the standard calendar, needs tohave a good, dependable starting point. The starting pointcould be first bud swell in late winter, full bloom in thespring, fruit maturity in late summer or early fall, or leaf fallin the fall. Selection of the starting point needs to be doneaccording to the needs of fruit growers to solve problemsassociated with fruit production. Environmental parametersinfluencing trees have been identified and quantified.Mathematical expressions of how these influencing factorsaffect the growth and development of a tree have beendeveloped. The resulting models of growth anddevelopment have been calibrated through several seasons.From these models, a fruit tree calendar starting point hasbeen determined.
The fruit tree calendar, developed at Utah State University,begins on September 1st of the standard calendar. From thatpoint on, tree growth and development are related toweather influences on the tree. In the temperate zone, thereare many reasons to begin the fruit tree calendar inSeptember. The most important one is that trees enterdormancy in late summer and dormancy completion istemperature dependent. Temperatures in late summer andfall in the temperate-zone decrease over time: this decreasehas predictable effects on fruit trees and can be used to time
1
The temperature response curve for Chill Unit Accumu-lation during dormancy
1 Chill Unit Equals 1 Hour at theOptimum Temperature
9
2
the beginning of the fruit tree year. From this beginning time,fruit tree development and growth – dormancy, bloom, fruitgrowth and development and related biological phenomena –can be estimated from models. Over the past few decadesthese models have been calibrated, and can now be used asthe basis for the fruit tree calendar.
Dormancy completion is driven by one environmentalparameter – temperature. In fruit trees dormancy is not greatlyor directly affected by daylength, light or light quality,precipitation, relative humidity, or other climatic parameters.As the result of being dependent on only one driving factor,the dormancy model is simple, and simple models are easy tounderstand and implement. As average temperatures decreasein late summer and fall, dormancy is induced and the fruittree calendar begins. After dormancy is completed, trees gainthe ability to grow in response to temperature. Thephenology of fruit tree flower anthesis, period of opening, hasbeen modeled in detail.
There are three current Utah models of fruit tree growth anddevelopment that depend on environmental phenomena tomeasure the tree’s status during their annual cycle. Theydepend on ambient temperature during the winter and earlyspring and on solar radiation and temperature during springand summer. They are:
1. The Utah Chill Unit Model, the dormancy model, whichnumerically accumulates chill units – the driving force ofdormancy transition,
2. The Utah Anthesis Unit Model, the flowering model, whichnumerically accumulates anthesis units – the unit formeasuring flower bud opening, and
3. The Utah Growth and Development Unit Model, thegrowth model, which numerically measures growth units -foliage development, shoot growth, and photosynthesispotential through late spring and summer.
THE CHILL UNIT MODELThe Utah Chill Unit Model uses chill units to measure fruittree dormancy development during the fall and winter. Achill unit is one hour at the optimum chilling temperature fordormancy development. Orchard trees require time attemperatures between 0 and 15 °C (32 and 60 °F) to completethe dormancy portion of their annual cycle. Temperaturesbelow 0 °C (32) do not contribute to dormancy completion.Temperatures above 15 °C (60) may cause negation ofpreviously acquired chill units. The dormancy temperatureresponse curve is most effective between 4 to 7 °C (40 to 45°F) with other temperatures between 0 and 15 °C (32 and 60)being only partially as effective. Most orchard trees share acommon chilling temperature response curve. The responsecurves through time for some common orchard trees asdetermined in various experiments are shown in the chill unitFigure. At high temperatures, chill units are negative. As theseasons progress from late summer to early fall, temperatures
0

decrease and the average temperature drops into the chillunit curve area. When chill units are accumulated orsummed for each day during the late summer and early fallthey go negative initially until the average temperaturedrops into the chill unit curve region. Then positive chillunits begin to accumulate. The point of maximum negativechill unit accumulation is temperature dependent and canbe identified on a plot of chill units during the summer tofall transition. This maximum negative chill unitaccumulation marks the beginning of dormancydevelopment. Different species and cultivars havecharacteristic chilling requirements. Once the chillingrequirement has been completed, dormancy is over, andtrees have gained the ability to grow in response totemperatures above the growth threshold.
THE ANTHESIS (FLOWERDEVELOPMENT) MODELAfter dormancy completion, trees respond differently totemperature. They grow in response to temperatures above athreshold close to 5 °C (42 °F). The optimum temperaturefor growth, the temperature that provides the fastest growth,is around 25 to 30 °C (77 to 86 °F). Growth rates decreaseabove 30 °C (86 °F) and growth stops somewhere around 35°C (95 °F). The general temperature response curve forflower and leaf bud development of most orchard species isshown here. An anthesis unit is defined as one hour at theoptimum temperature for flower bud growth anddevelopment. Temperatures above the threshold but belowor above the optimum provide fractional anthesis units.The relationship between bud development and floweringand temperature has been developed for fruit trees. Thenumber of anthesis units for each stage of bud developmenthas been determined. Therefore, temperature data can beused to determine the developmental stages of fruit treesfrom the end of dormancy through the various stages of buddevelopment to full bloom. A grower can keep track of thedevelopment and growth of his orchard trees by summingthe chill units day by day until dormancy has beencompleted and then summing the anthesis units day by daythrough various stages of flower bud development to fullbloom.
Predictive capability is possible when growers have longterm weather normals for their area. Long-term weathernormals are the maximum and minimum or hourlytemperature averages over a long time period, usually 30years. The end of dormancy can be predicted by summingthe chill units to the last day of collected current seasondata in the orchard, then long-term normal data can be usedto make an estimate of when the end of dormancy willoccur. Bloom stages can be predicted in the same way. Asthe end of dormancy or bloom approaches, accuracy of theprediction gets better because more current data and lesshistorical normal data are used in the prediction.
1 anthesis unit equals 1 hour at theoptimum temperature.
The temperature response curve for anthesis unitaccumulation
21
22
HOW CAN FRUIT GROWERSINCREASE THEIR INCOME?The goal of a SOMS program is to increase the fruitgrower’s income by increasing production and decreasingper acre production costs with integrated orchardmanagement. Fruit production is a function of plantingdensity and dwarf tree precocity. Its limits are set when thefruit grower selects the orchard site, rootstocks, cultivars,and training and cultural systems. Modern high-densityorchards of 700 to 1,000 size-controlled trees per acre insingle rows provide early cropping and high yields. Yieldsin excess of 2,000 boxes per acre are not uncommon andcan be reached 5 years after planting. Such yields requireonly minimally increased per acre irrigation, fertilization,protection, and spray applications. Concentration ofproduction on fewer acres allows more attention to a smallerbut much more productive area. The result is decreasedproduction costs per box of fruit and more return to thegrower. As growers rotate their orchard tree blocks, theyshould carefully select the best cultivars and have themgrafted onto size controlling rootstocks. These trees shouldbe planted in single-rows at densities of up to 1,000 treesper acre or in three to five row beds where greater densitiesare desired and justified by grower expertise.
The profit equation in fruit production is:
Profit = (Net Yield Per Acre X Price Received) – AllProduction Costs
The following information concerning orchard architectureis given here because of the importance of plantingcompetitive orchards. Fruit production is a long term
Full bloom is an important event in orchard growth anddevelopment. It marks the completion of flowering of flowerbuds that had their beginnings during the previous summer.It is the most hazardous time of the fruit tree year because offreeze susceptibility, weather influences on pollinators, andthe tendency of fruit trees to bear more fruit then they cansupport. Weather around full bloom is important not only forpollinator activity but for leaf development and the resultingphotosynthesis. Energy for bloom and fruit growth anddevelopment before, during and immediately after bloomcomes from reserves stored in the plant during the previousyear. If weather in the previous year was sufficient for growth,development, and photosynthesis, then sufficient quantitiesof photosynthate will be available to support early growth. Ifthe previous growing season was unfavorable, then anthesisand early growth and development will be weak. Trees dobetter after a good growing season and poorly after a poorgrowing season, and the effect of a poor season may be seenfor several subsequent years. Therefore, condition of the treearound full bloom that is highly important for fruit set andearly development is dependent on the tree’s history over thepast few growing seasons.
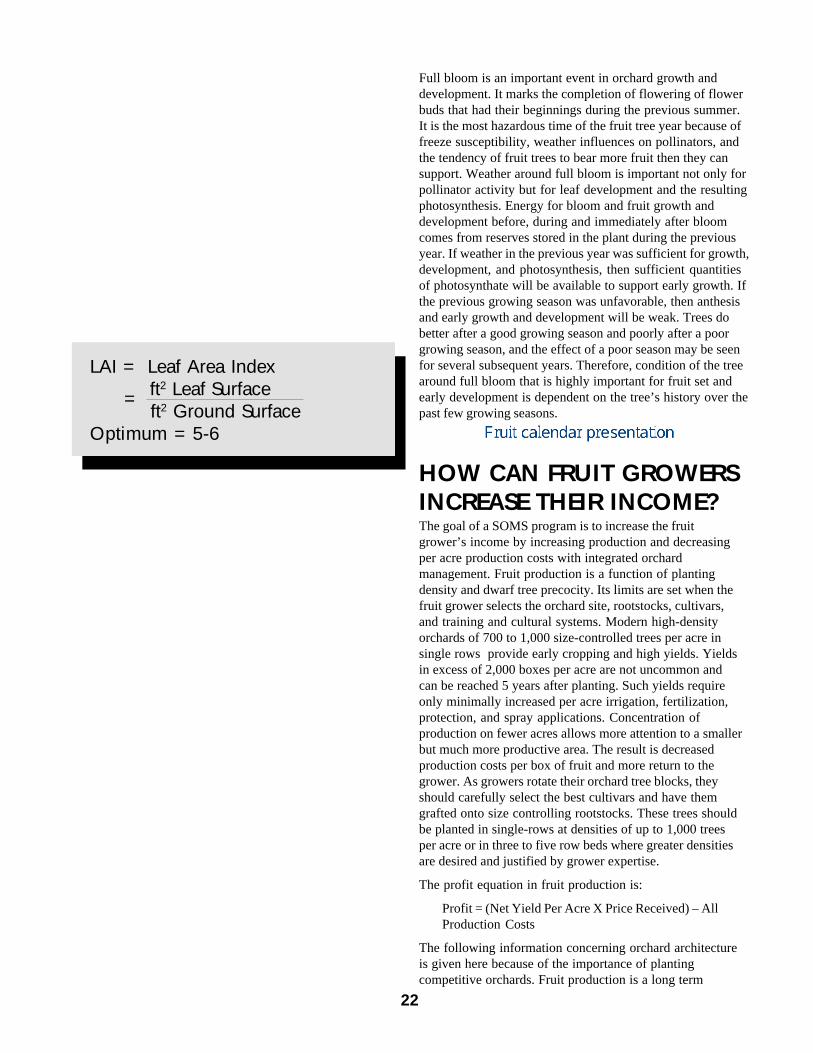
LAI = Leaf Area Index ft2 Leaf Surface ft2 Ground Surface
Optimum = 5-6
=
investment. Modern orchards must be structured so thatthey produce the maximum amount of fruit for a minimumamount of expenses. It is far better to have 10 acres of treesproducing 2,400 boxes per acre that to have 40 acres oftrees producing 600 boxes per acre. Consideration of theprofit equation tells the grower why.
Today’s fruit growers compete on a worldwide market.Wholesale prices are set by supply and demand and theindividual grower can do little to affect them. Retail pricesare also set by supply and demand, but quality fruit sold atthe farm to individual consumers can bring higher prices ifthe grower is willing to establish a clientele. For mostgrowers, however, this outlet is limited. Production costs,like wholesale prices, are determined by the cost of eachindividual commodity required for orchard culturalpractices and are governed by forces beyond the grower’scontrol. Therefore, the grower can increase his profit onlyby increasing Net Yield Per Acre in a manner that lowersproduction costs per bushel produced. Lower productioncost per bushel is the objective of SOMS.
Higher net yields and lower production costs per bushel arecharacteristic of high density dwarfed plantings because ofthe positive characteristics of small trees:
POSITIVE CHARACTERISTICS OF SMALL TREES:
Better light distribution:
Small trees produce their canopies in 3 to 5 years andpresent the canopy to full sunlight. Tree widths arelimited to 6’ and heights to < 12’.
Higher productive leaf area:
One hundred percent of the foliage is exposed tosufficient sunlight in small trees to generate plantfoods. Growth during the season does not shade-outfoliage.
Higher early yields and higher orchard-lifetime yields:
The greatest advantage of small trees is the cropsproduced in the 2nd, 3rd, and 4th years in the orchard. Bythe 5th leaf, the trees are producing full crops. Ifplanting density is correct, yields of 80+ bins per acrecan be realized.
Higher quality fruit:
Fruit quality is excellent on small trees because leavesare nearly 100% efficient, exposure to sunlight isgreater, and logistics of food and nutrient translocationis better.
Less pruning:
Small trees produce fruit, not wood. Less woodproduced means less pruning. However, trainingbecomes very important with the small tree.
2
Lower chemical costs per bushel:
Small trees cover the orchard floor faster with higherleaf surface area that provides greater yields. Sincechemicals are applied on a per acre basis to a greaternumber of bushels of fruit, cost per bushel is lower.
Better spray distribution:
Spray penetration is much better in the smaller canopywhen only a 3’ depth to the center of the tree is in thespray pattern.
Smaller and therefore cheaper equipment:
Small tractors, small sprayers, and other smallerequipment allow narrower alleyways to give higherdensity tree populations. The alleyway only needs tobe the width of a bin. In addition, the smallerequipment causes less soil compaction.
Easier to harvest:
Fruit produced on small trees with only 3’ to the centerof the trees is easier to harvest. The world record forpicking apples, 360 bushels in an 8 hour day, was set ina high density small tree orchard.
Higher water use efficiency:
The energy requirement for moving sap, metabolites,sugar, and secondary plant constituents around in thesmall tree is lower than in a large tree. The shorter thedistance from the root to the shoot or thephotosynthesizing shoot to the fruit-producing spur,the less expense there is involved in transport.
NEGATIVE CHARACTERISTICS OF SMALL TREES:
Higher establishment costs:
Cost of trees for the high-density orchard can beintimidating. A high-density orchard of 1,000 trees peracre would cost $6,000 if the cost per tree is $6. Theadvantage of branched trees from the nursery amountsto a year in the orchard, therefore, the additional costwill return more than expended in just a few years.This is a case of having to spend money to makemoney.
Higher training costs:
Slender spindle, HYTEC, vertical axe, staked ortrellised trees require additional grower care per tree toachieve the goal of early foliation and high yields.Time spent in staking and trellising and training treesto control growth and production is required to makethe small tree, high-density orchard successful.
3

Irrigation systems may be more expensive:
Under-tree irrigation lines with more sprinkler heads foradequate water distribution may be required for thehigh density planting. If overhead sprinkling is used,costs should be about the same.
Higher freeze risk in radiation freezes:
The smaller, shorter tree is at a disadvantage whenradiation freezes occur. Protective measures will berequired more frequently than with largertrees.
Movement in the orchard is restricted:
Hedgerows of slender spindle, vertical axe, or otherhigh-density system orchards do not allow cross-rowtraffic. The orchard row middle should be just wideenough for a bin of fruit. Tractor shields andoccasional pruning for alley-way width may berequired.
More care is required:
Training is required for each tree and each limb of eachtree in the high-density orchard. Limb positioning withspreaders or twine hold-downs takes material and time.Stake and trellising operations and maintenance areoften necessary.
The advantages of high-density well-trained treescannot be overcome with greater acreage of larger trees.If a grower cannot produce significant quantities offruit per acre on efficient, small trees, his income willnot be as great as the income of those who do.
—Schuyler Seeley
Benefits of Ground Covers in Orchards:1. Ground covers replenish organic matter in the soil.This is extremely important since organic matter breaksdown to humus that is primarily responsible for soilparticle aggregation.
2. Ground covers that maintain soil aggregates allow formuch better water penetration into the soil. Cultivationtends to destroy soil aggregates and soil structureresulting in increased soil compaction and poor wateravailability to the trees.
3. Humus from organic matter also serves to form ionexchange sites for fertilizer elements in the soil so thatsoils high in humus can hold fertilizers better and helpavoid deep percolation of fertilizers that will allowthem to enter ground water.
4. Ground covers allow much easier, and usually earlier,movement in the orchard. All tasks that demand travelthrough the tree rows are facilitated by a good groundcover.
2
5. Proper selection of ground covers can result in insectcontrol. For instance, grasses used as ground cover donot serve to harbor some detrimental insects that willoccupy native weed cover crops.
6. Ground covers in orchards on sloping ground will holdthe soil in place and prevent erosion.
7. Ground covers cushion soil and prevent compaction byequipment.
8. A good grass ground cover allows spraying to controlbroad-leaved weeds such as dandelions that may serveas attractive alternate targets for honeybees duringpollination season.
9. Ground covers produce a cooler midsummerenvironment.
10. Ground covers save equipment wear and tear,especially on rocky sites.
11. Ground covers help break down rocks, gravel, and largesand particles via microbial action fostered by humus,and result in faster soil production than clean-cultivated land.
12. Ground covers keep your machinery, tools, and shoesclean.
– Schuyler Seeley
HONEYBEES IN THEORCHARD1. Bees fly into the wind until winds reach » 6 mph.Therefore, place hives on the lee side of the block of trees youwant pollinated. Bees tend to fly into the wind when emptyand like to coast home on the wind when they return withnectar and pollen.
2. Bees fly when temperatures are above 10 C (50 F) but aremuch more active at15 C (60 F) and higher. To help bees fly,do things to heat the hives up. Black energy collectingcoatings or coverings, which do not hold water in, on thehives will help in the spring, but not during the hotter summerdays. Elevate the hives on a couple of bins so that the hive isabove ground level where the temperatures are lower than at 8to 10 feet. Turn the hives to face the morning sun so that thefront of the hive will absorb energy and warm faster. Place 8 to12 hives together so that they can help keep each other warm
3. Bees fly in clear weather. They use the sun to navigate.When the weather is cloudy and there is a threat ofprecipitation, bees, generally, stay in the hive.
4. Bees tend to harvest the sweetest nectar. Often thesweetest nectar is in the flowers on the ground cover in theorchard or on alternate targets outside the orchard. When aworker bee finds a sweet sugar source they harvest a load andreturn to the hive. When in the hive, they do a dance to showother worker bees the direction and distance to the source of
4
the nectar. To avoid having bees harvest from the cover crop,if it contains appreciable numbers of plants like dandelions,spray or disk the alternate nectar source before placing thebees in the orchard.
5. Bees tend to stay with a source of nectar once they starton it. If they start on a row of trees, they return again andagain. They tend to work one hedgerow of trees and do notfly across the row-middle to another row, but fly down therow. Therefore, the source of pollen, the pollinizer tree, needsto be in the hedgerow.
6. Bees should be placed in the orchard when about 30 %of the fruit flowers are open. They should be removed afterbloom before any detrimental sprays are applied.
7. The honey bee is subject to two mites. The Verroa mitethat attaches to the skin of the bee and becomes parasitic, andthe tracheal mite that enters the bee’s trachea and lives there.The tracheal mite may colonize the trachea in numberssufficient to suffocate the bee. Some strains of bees are moreresistant to these mites. In some areas honeybee mortality hasreached 80% due to mites and weather problems. The blueorchard bee is not subject to mite attack.
8. Honeybees are colony insects. This makes it easy tohandle them. Other bees, like the blue orchard bee, aresolitary insects, but they may nest gregariously. They can behandled so that they do a good job in the orchard.
THE BLUE ORCHARD BEEThe blue orchard bee is one of about 3,500 species of nativebees. They do not produce wax or honey. “In 1985, a 3.5acre cherry orchard in North Ogden, Utah that in previousyears had been pollinated with honey bees at a rate of 2.5hives per acre, was pollinated with blue orchard bees for thefirst time. The USDA-ARS Logan Bee Lab staff managedthe release of the blue orchard population (2,600 femalesand 5,200 males) and monitored its emergence and nestingactivity. Harvest and yield quantification were conductedby the orchardist. As many as 14,132 female and 19,391
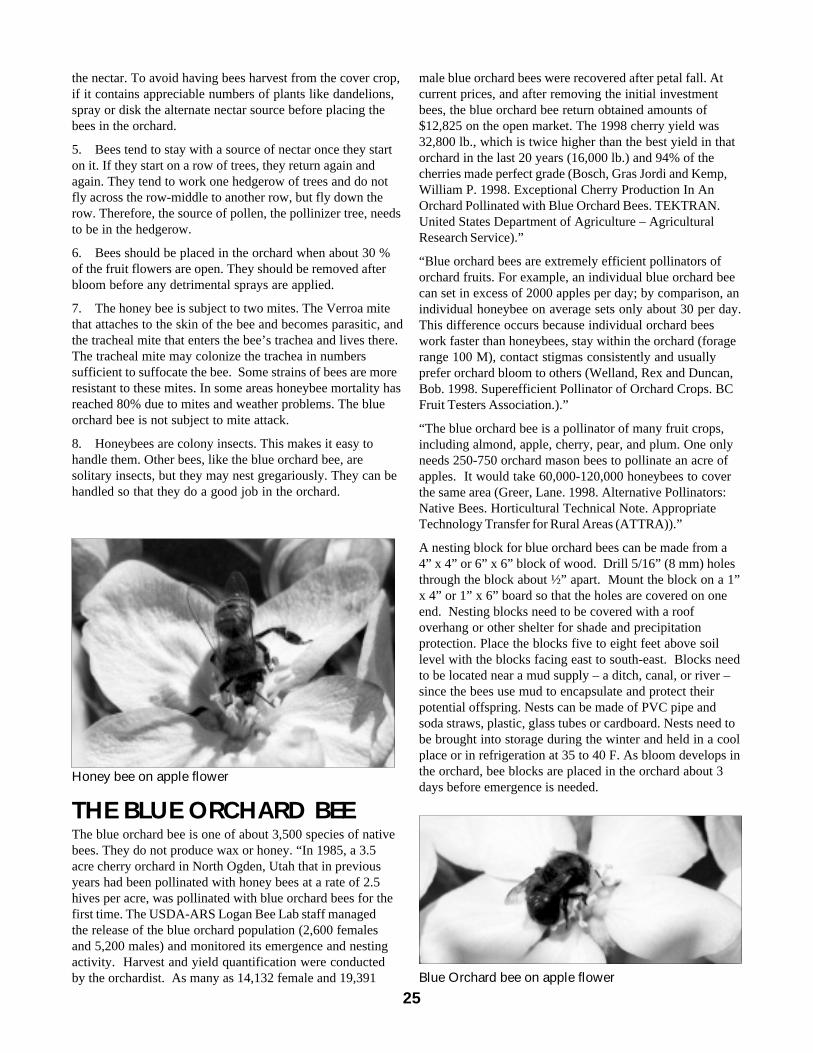
Honey bee on apple flower
2
male blue orchard bees were recovered after petal fall. Atcurrent prices, and after removing the initial investmentbees, the blue orchard bee return obtained amounts of$12,825 on the open market. The 1998 cherry yield was32,800 lb., which is twice higher than the best yield in thatorchard in the last 20 years (16,000 lb.) and 94% of thecherries made perfect grade (Bosch, Gras Jordi and Kemp,William P. 1998. Exceptional Cherry Production In AnOrchard Pollinated with Blue Orchard Bees. TEKTRAN.United States Department of Agriculture – AgriculturalResearch Service).”
“Blue orchard bees are extremely efficient pollinators oforchard fruits. For example, an individual blue orchard beecan set in excess of 2000 apples per day; by comparison, anindividual honeybee on average sets only about 30 per day.This difference occurs because individual orchard beeswork faster than honeybees, stay within the orchard (foragerange 100 M), contact stigmas consistently and usuallyprefer orchard bloom to others (Welland, Rex and Duncan,Bob. 1998. Superefficient Pollinator of Orchard Crops. BCFruit Testers Association.).”
“The blue orchard bee is a pollinator of many fruit crops,including almond, apple, cherry, pear, and plum. One onlyneeds 250-750 orchard mason bees to pollinate an acre ofapples. It would take 60,000-120,000 honeybees to coverthe same area (Greer, Lane. 1998. Alternative Pollinators:Native Bees. Horticultural Technical Note. AppropriateTechnology Transfer for Rural Areas (ATTRA)).”
A nesting block for blue orchard bees can be made from a4” x 4” or 6” x 6” block of wood. Drill 5/16” (8 mm) holesthrough the block about ½” apart. Mount the block on a 1”x 4” or 1” x 6” board so that the holes are covered on oneend. Nesting blocks need to be covered with a roofoverhang or other shelter for shade and precipitationprotection. Place the blocks five to eight feet above soillevel with the blocks facing east to south-east. Blocks needto be located near a mud supply – a ditch, canal, or river –since the bees use mud to encapsulate and protect theirpotential offspring. Nests can be made of PVC pipe andsoda straws, plastic, glass tubes or cardboard. Nests need tobe brought into storage during the winter and held in a coolplace or in refrigeration at 35 to 40 F. As bloom develops inthe orchard, bee blocks are placed in the orchard about 3days before emergence is needed.
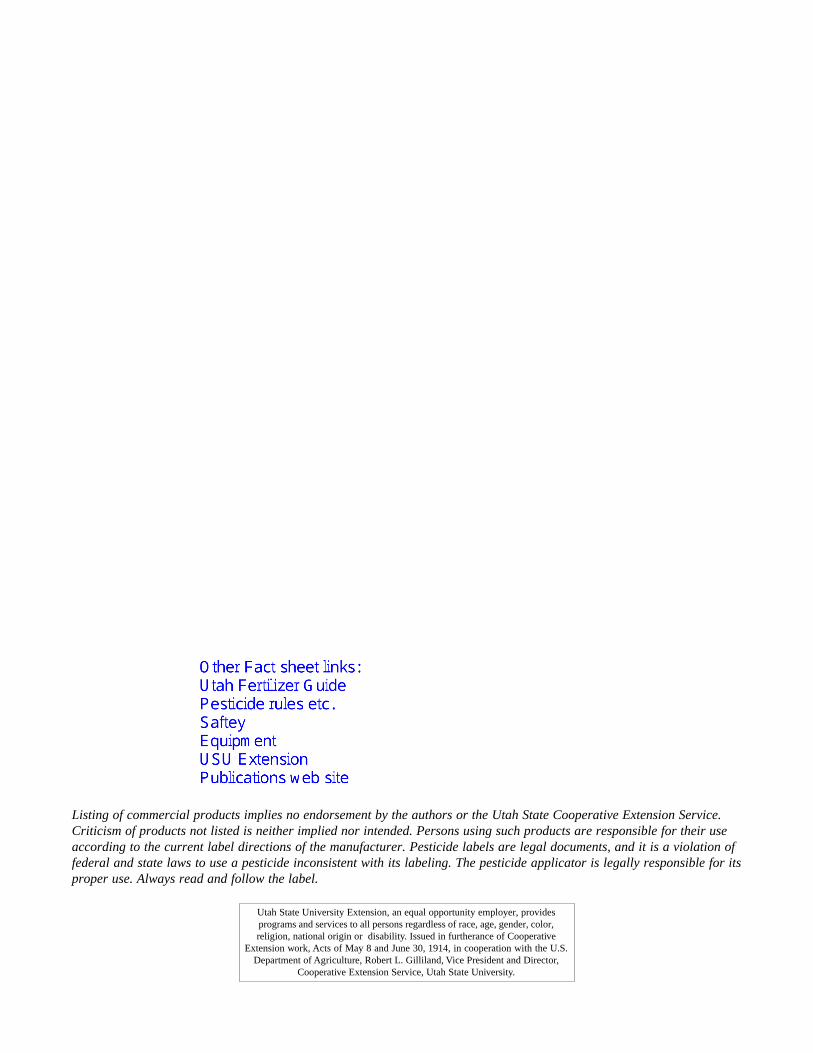
Blue Orchard bee on apple flower
5
Listing of commercial products implies no endorsement by the authors or the Utah State Cooperative Extension Service.Criticism of products not listed is neither implied nor intended. Persons using such products are responsible for their useaccording to the current label directions of the manufacturer. Pesticide labels are legal documents, and it is a violation offederal and state laws to use a pesticide inconsistent with its labeling. The pesticide applicator is legally responsible for itsproper use. Always read and follow the label.
Utah State University Extension, an equal opportunity employer, providesprograms and services to all persons regardless of race, age, gender, color,religion, national origin or disability. Issued in furtherance of Cooperative
Extension work, Acts of May 8 and June 30, 1914, in cooperation with the U.S.Department of Agriculture, Robert L. Gilliland, Vice President and Director,
Cooperative Extension Service, Utah State University.