surface modification of hydroxyapatite deposition … · surface modification of hydroxyapatite...
TRANSCRIPT

SURFACE MODIFICATION OF HYDROXYAPATITE DEPOSITION
ONTO TITANIUM NANOTUBES FOR BIOMEDICAL
APPLICATIONS
by
Tooba Sarkhosh
A thesis submitted to the faculty of The University of Utah
in partial fulfillment of the requirements for the degree of
Master of Science
Department of Metallurgical Engineering
The University of Utah
December 2013

Copyright © Tooba Sarkhosh 2013
All Rights Reserved

T h e U n i v e r s i t y o f U t a h G r a d u a t e S c h o o l
STATEMENT OF THESIS APPROVAL
The thesis of Tooba Sarkhosh
has been approved by the following supervisory committee members:
Manoranjan Misra , Chair 9/26/2013
Date Approved
Raj Rajamani , Member 9/26/2013
Date Approved
Swomitra Mohanty , Member 9/26/2013
Date Approved
and by Manoranjan Misra , Chair/Dean of
the Department/College/School of Metallurgical Engineering
and by David B. Kieda, Dean of The Graduate School.

ABSTRACT
Ti and Ti alloys have been successfully used as orthopedic and dental implants.
Various types of surface modification methods have been investigated to further improve
the bioactivity of titanium. Growth of the hydroxyapatite onto nanotutbular titania was
done by pulsed electrodeposition. The purpose of this study is to improve this surface by
annealing the amorphous nanotubes to the anatase which is more efficient in nucleation
and growth of apatite due to their crystal lattice match. Prior to the electrodeposition, the
anodized nanotubes were heat-treated at 350 oC for 2 hours, and then they were
electrodeposited in simulated body fluid. It is shown that heat treatment of nanotubular
TiO2 could give us the better cohesion and bioactivity.

TABLE OF CONTENTS
ABSTRACT ..………………………………………………………………………...… iii
LIST OF TABLES…………………………….………………………………...…….….vi
LIST OF FIGURES………………………………………………………………...…....vii
ACKNOWLEDGEMENTS………………..………………….………………….......…...x
Chapter
1 INTRODUCTION………………………………………………………………..……1
1.1 Background……………………………………………………………….…...1 1.2 Ti as an orthopedic implant material………………………………………… 2 1.3 Calcium phosphate coatings…………………………………………………. 3 1.4 Use of HA for bone repair…………………………………………………… 3 1.5 Methods for coating Ti with HA………………………………………….…...4 1.6 Methods for titanium nanotube formation…………………...………………..7 1.7 Pulse electrodeposition (PED)………………………………………………...7
1.7.1 Advantages of pulse technique……………………………………...8
2 RESEARCH OBJECTIVES……………………..……………………...…………..…9
3 EXPERIMENTAL PROCEDURE …………………………………………………..10
3.1 Formation of nanoporous TiO2 layer on Ti substrate ……………….………10 3.2 Heat treatment to crystallize titanium nanotubes…………………….………11 3.3 Alkaline treatment of anodized samples……………………………………..11 3.4 Electrodeposition of calcium phosphate coating onto nanoporous titanium………………………………………………………………………......12 3.5 Scanning electron microscopy (SEM), energy dispersive X-ray analysis (EDAX), X-ray diffraction (XRD)………………………………………………12 3.6 Evaluation of interfacial bond strength………………………………………14

4 RESULT AND DISCUSSION ..................................................................................... 15
4.1 Nanoporous TiO2 layer formation on the Ti substrate ................................... 15 4.2 Effect of alkaline treatment. ............................................................................ 16 4.3 Heat treated titanium nanotubes after anodization .......................................... 17 4.4 HA electrodeposition ....................................................................................... 27 4.4.1 Electrodeposition at constant potential ........................................... 28 4.4.2 Pulsed electrodeposition .................................................................. 30 4.4.2.1 Pulsed deposition procedure (without overloading) ............ 31 4.4.2.2 Pulsed deposition procedure (with overloading) ................. 35 4.4.2.3 Pulsed electrodeposition at different temperature ............... 35 4.5 HA bond strength ............................................................................................ 42 4.5.1 Tensile test ....................................................................................... 42 4.5.2 Scotch tape test ................................................................................ 44 4.6 XRD data ......................................................................................................... 44
5 CONCLUSION ............................................................................................................ 47
6 FUTURE WORK ......................................................................................................... 49 REFERENCES .................................................................................................................. 51
v

LIST OF TABLES
1. Methods of HA coating and their characteristic……………………………………….6 2. SEM micrographs for samples during the pulsed deposition of hydroxyapatite at 80 oC with 50k magnification when the reference electrode was inside the solution…... 3. Interfacial bond strength of HA coated sample under different annealing conditions……………………………………………………………………………...…

LIST OF FIGURES
1. Schematic view of making HA coating on titanium nanotubes in two steps, anodization and electrodeposition……………………………………………………...….7 2. Typical pulse-current or potential waveform……………………………………...……8 3. Anodization set-up, a) DC power source, b) titanium, c) platinum electrode, d) electrolyte, e) magnetic stirrer………………….……………………………………...…11 4. Electrodeposition set-up, working electrode (WE), counter electrode (CE) and reference electrode (RE)……………………………………………………………….…13 5. Schematic diagram illustrating the process for applying current versus time during deposition of HA for the first step…………………………………………………….….13 6. Instron machine used for bond strength measurement……………………...…….…..14 7. Current density (A/cm2) during TiO2 nanotube formation as a function of time (s). Stage I: oxide barrier formation; stage II: pore nucleation; stage III: nanotubular oxide growth……………………………………………………………………………………16 8. SEM microstructure of an anodized Ti substrate with 20V potential for 45 minutes; a) side view, nanotube length ~ 400 nm; b) top view, nanotube diameter ~ 100 nm…...…17 9. SEM micrographs of titania nanotubes, 20V, 45 min; a)before NaOH treatment; b) after 0.5 M NaOH treatment for 2 minutes at 50 oC……………………………………..18 10. EDAX analysis of the sodium titanate rings on nanoporous TiO2………………….18 11. Crystal structures of a) anatase, b) rutile phase…..…………………………………19 12. Transition between TiO2 phases at different temperatures…………….………...….20 13. SEM micrographs of nanotubes after annealing at 500 oC for 2 hours; a) before deposition of HA; b) after electrodeposition of HA at constant potential………….……20

viii
14. SEM microstructures of TiO2 nanotubes, a) as anodized, b) after annealing at 350oC……………………………………………………………………………………..21 15. Methodology followed in presented approach………………………………………22
16. SEM images for sample with annealing at 350 oC for 2 hours before hydroxyapatite deposition; top views, a) 20k, b) 30k, c) 50k, d) 80k and side views, e) 45k, f) 15 k…..23 17. Side view images of Ti nanotubes after hydroxyapatite deposition, a) without annealing nanotubes, thickness is about 1 µm; b) annealed at 350 oC for 2 hours, thickness is about 4 µm…………………………………………………………………..24 18. EDAX analysis of the deposited layer after annealing at 350 oC…………...………25 19. Electrodeposition graphs for two samples, a) without annealing nanotubes, b) with annealing at 350 oC………………………………………………………………………26 20. Cyclic voltammograms obtained in the deposition condition. The potential was scanned from 0.5 V to -2 V and back at 10 mV/s……..……………………...………….27 21. Current versus time during the formation of hydroxyapatite by applying different constant potentials………………………………………………………………………..29 22. Morphology of amorphous calcium phosphate coating deposited at different constant potential without annealing, a ) -0.8 V; 1800 sec; b) -1.1 V, 1800 sec; c) -1.2 V, 1800 sec; d) -1.4 V, 1800 sec…………………………………………………………………..29 23. SEM images after deposition of amorphous hydroxyapatite with constant potential (-1.4 V) at room temperature for 1800 sec, a) side view and b) top view of the deposited HA layer………………………………………………………………………………….30 24. Two experimental conditions for electrodeposition of HA, a) reference electrode inside the high temperature solution (without overloading potentiostat), b) Reference electrode remains at room temperature (with overloading potentiostat)……..………….31 25. Methodology of HA deposition in two conditions, reference electrode outside the solution (with overloading) and reference electrode inside the electrolyte (without overloading)…………….……………………………………………………………….. 26. Side view of SEM images of the crystalline HA deposited layer on anodized titanium, thickness is about 1.45 µm………………………………………………….… 27. SEM images with 30k magnification without overloading condition (reference electrode inside the solution) at 80 oC, a) alkaline treated Ti nanotubes, b) after 10 cycles,

ix
c) after 50 cycles, d) after 100 cycles, e) after 100 cycles + 15 minutes constant current, f) after 100 cycles +60 minutes constant current.……………............................………….. 28. SEM images with 20k magnification in the overloading situation (reference electrode keeps at room temperature); a) as anodized Ti; b) after alkaline treatment; c) after 10 cycles; d) after 50 cycles; e) after 100 cycles; f) after 100 cycles + 15 minutes constant current...........................................................................................................................…. 29. SEM images with 50k magnification in overloading situation (reference electrode at room temperature); a) as anodized Ti; b) after alkaline treatment; c) after 10 cycles; d) after 50 cycles; e) after 100 cycles; f) after 100 cycles + 15 minutes constant current…. 30. SEM images for samples with repeating potential deposition at 80oC with overloading (reference electrode outside the solution); a) different layers (Ti substrate, Ti nanotubes, HA deposited layer); b) side view picture of deposited layer, thickness is about 700 nm..……………………...…………...……………………………………….. 31. SEM images of electrodeposited samples at different temperatures, a) 70 oC, b) 80 oC………………………………………………………………………………….. 32. Potential versus time during the HA deposition at room temperature, in two steps. Step 1: Pulsing the current density for 100 cycles. Step 2: Constant current density for 1 hour……………….…………………………………………………………………… 33. Potential versus time during the HA deposition at 40 oC, in two steps. Step 1: Pulsing the current density for 100 cycles, Step 2: Constant current density for 1 hour……...…. 34. Instron data for; a) unannealed sample; b) annealed Ti nanotubes sample…............ 35. SEM images for deposition without overloading at 80ºC, a) before Scotch tape test, b) after Scotch tape test………………………………………………….………………. 36. SEM images for samples with repeating potential deposition at 80 oC without overloading; a) before Scotch tape test; b) after first removal; c) after second removal... 37. XRD image of deposited layer (hydroxyapatite) onto the annealed nanotubes at 350o C………………………………………………………………………………..…..

ACKNOWLEDGEMENTS
I would like to express my sincere gratitude to my advisor, Prof. Manoranjan Misra.
His depth of knowledge and logical way of thinking have been of great value to me and
his guidance has provided a good basis for the present thesis. I wish to thank him for his
expert guidance, generous support and all his patience with me throughout my project.
I am deeply grateful to my committee members, Prof. Raj Rajamani and Dr.
Swomitra. Mohanty, for their very useful comments and suggestions, spending time on
my thesis and helping me to complete my thesis.
I owe my most sincere gratitude to Dr. Biblap Sarma, Dr.Monalisa Panda and York
Smith in the nanomaterials synthesis laboratory. Their advice and extensive discussions
around my work have been very helpful for this study.
My warm thanks are given to Dr. Krista Carlson for helping me in SEM imaging
and the EDAX analysis.
I wish to extend my warmest thanks to all in the Metallurgical and Materials Science
Engineering department who have helped me with my work.
I owe my loving thanks to my husband, parents and my little sister. Without their
encouragement and understanding it would have been impossible for me to finish this
work.

CHAPTER 1
INTRODUCTION
1.1 Background
The vast numbers of people suffering from different bone diseases or natural bone
degeneration for reasons such as trauma, congenital defect or aging need to have a bone
replacement procedure to renew diseased or fractured bone. Consequently, a large
number of bone implant surgeries are performed every year: 2.2 million bone implants
world wide and 450,000 bone replacements in the United State are the current estimates
for this kind of operation [1].
Current bone replacement procedures include autografting, allografting and
synthetic materials. In general, autografts and allografts have good osteoconductivity to
promote bone growth factors. However, that is a limited supply from a patient for
autograft or from a suitable donor for an allograft. Specifically, autografting has surgical
costs such as infection and pain at the harvesting site and allografting may have immune
system problems, the absence of viable cells for osteoblast function or transmission of
diseases [2]. Consequently, use of artificial material is growing as an alternative for bone
replacement. It should withstand stress and strain and have an osteoconductive surface
behavior.
The ideal biomaterial must meet all of the required criteria which are dependent upon
the application. Bone implants need to have strong mechanical properties because most
orthopedic replacements are used in load-bearing situations such as total hip replacement
or dental implants. In addition to providing mechanical strength, the biomaterials must
also be nontoxic and compatible to cells and living tissues. Specifically, orthopedic
2
replacements should be osteoconductive which can help the attachment and growth of
bone cells and newly formed bone [3].
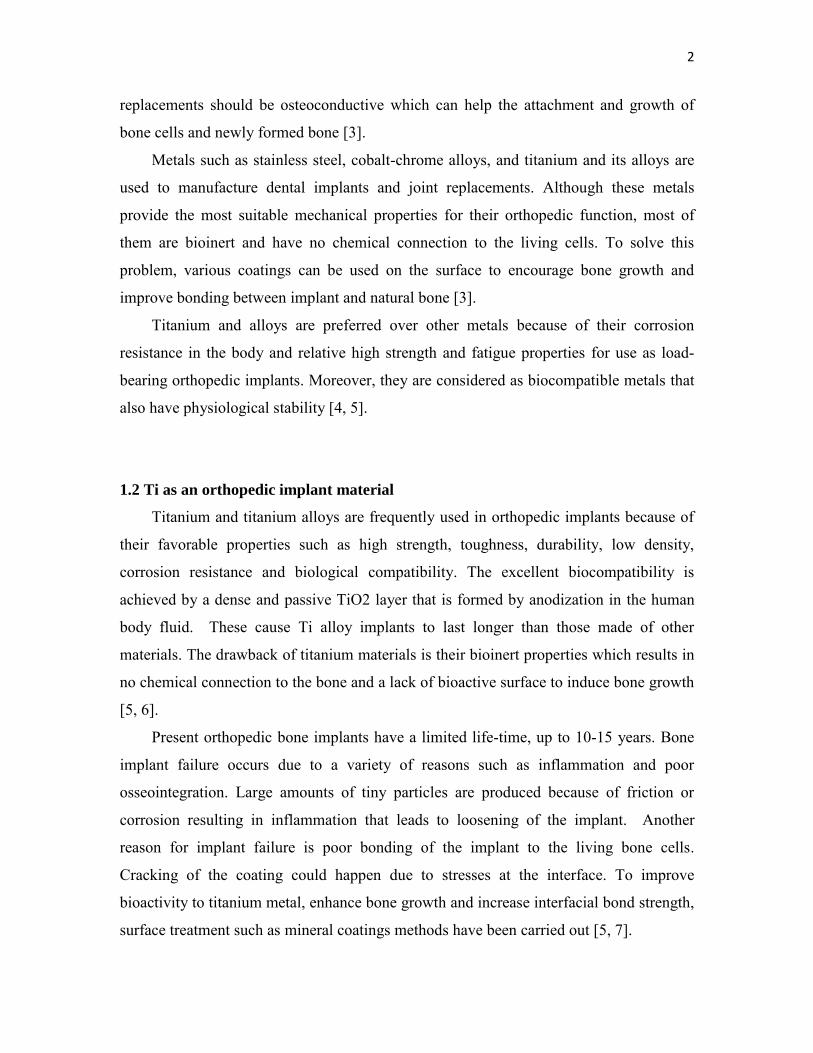
Metals such as stainless steel, cobalt-chrome alloys, and titanium and its alloys are
used to manufacture dental implants and joint replacements. Although these metals
provide the most suitable mechanical properties for their orthopedic function, most of
them are bioinert and have no chemical connection to the living cells. To solve this
problem, various coatings can be used on the surface to encourage bone growth and
improve bonding between implant and natural bone [3].
Titanium and alloys are preferred over other metals because of their corrosion
resistance in the body and relative high strength and fatigue properties for use as load-
bearing orthopedic implants. Moreover, they are considered as biocompatible metals that
also have physiological stability [4, 5].
1.2 Ti as an orthopedic implant material
Titanium and titanium alloys are frequently used in orthopedic implants because of
their favorable properties such as high strength, toughness, durability, low density,
corrosion resistance and biological compatibility. The excellent biocompatibility is
achieved by a dense and passive TiO2 layer that is formed by anodization in the human
body fluid. These cause Ti alloy implants to last longer than those made of other
materials. The drawback of titanium materials is their bioinert properties which results in
no chemical connection to the bone and a lack of bioactive surface to induce bone growth
[5, 6].
Present orthopedic bone implants have a limited life-time, up to 10-15 years. Bone
implant failure occurs due to a variety of reasons such as inflammation and poor
osseointegration. Large amounts of tiny particles are produced because of friction or
corrosion resulting in inflammation that leads to loosening of the implant. Another
reason for implant failure is poor bonding of the implant to the living bone cells.
Cracking of the coating could happen due to stresses at the interface. To improve
bioactivity to titanium metal, enhance bone growth and increase interfacial bond strength,
surface treatment such as mineral coatings methods have been carried out [5, 7].
3
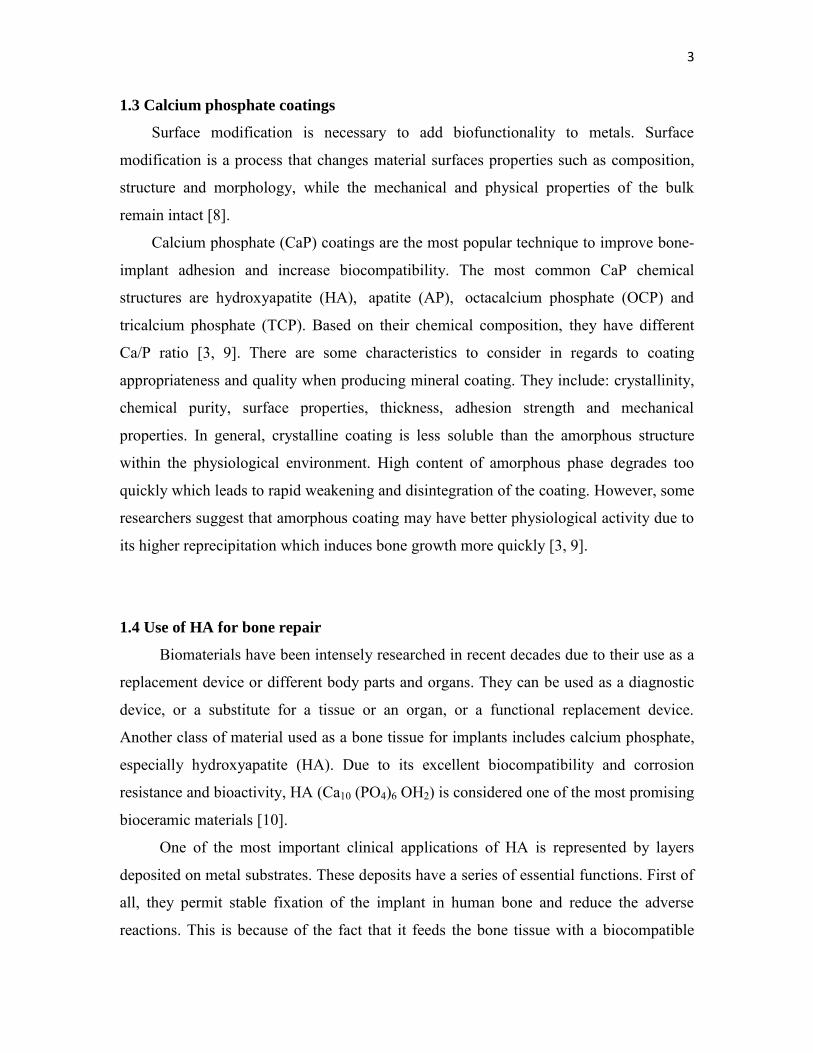
1.3 Calcium phosphate coatings
Surface modification is necessary to add biofunctionality to metals. Surface
modification is a process that changes material surfaces properties such as composition,
structure and morphology, while the mechanical and physical properties of the bulk
remain intact [8].
Calcium phosphate (CaP) coatings are the most popular technique to improve bone-
implant adhesion and increase biocompatibility. The most common CaP chemical
structures are hydroxyapatite (HA), apatite (AP), octacalcium phosphate (OCP) and
tricalcium phosphate (TCP). Based on their chemical composition, they have different
Ca/P ratio [3, 9]. There are some characteristics to consider in regards to coating
appropriateness and quality when producing mineral coating. They include: crystallinity,
chemical purity, surface properties, thickness, adhesion strength and mechanical
properties. In general, crystalline coating is less soluble than the amorphous structure
within the physiological environment. High content of amorphous phase degrades too
quickly which leads to rapid weakening and disintegration of the coating. However, some
researchers suggest that amorphous coating may have better physiological activity due to
its higher reprecipitation which induces bone growth more quickly [3, 9].
1.4 Use of HA for bone repair
Biomaterials have been intensely researched in recent decades due to their use as a
replacement device or different body parts and organs. They can be used as a diagnostic
device, or a substitute for a tissue or an organ, or a functional replacement device.
Another class of material used as a bone tissue for implants includes calcium phosphate,
especially hydroxyapatite (HA). Due to its excellent biocompatibility and corrosion
resistance and bioactivity, HA (Ca10 (PO4)6 OH2) is considered one of the most promising
bioceramic materials [10].
One of the most important clinical applications of HA is represented by layers
deposited on metal substrates. These deposits have a series of essential functions. First of
all, they permit stable fixation of the implant in human bone and reduce the adverse
reactions. This is because of the fact that it feeds the bone tissue with a biocompatible

4
substance. Also, the films of HAP reduce the diffusion of metallic ions from the implant,
towards the biological tissue and protect the metallic surface from the aggressive attack
of the environment [11].
Bone is composed of parallel collagen fibers with deposited calcium phosphate to
provide appropriate hardness. The inorganic component of the bone, which is mainly
calcium phosphate (CaP) has a similar chemical composition to hydroxyapatite (HA).
HA is the most stable phase in a physiological environment and has the slowest
solubility in the human body (pH=7), [12]. The brittle nature of HA makes it unsuitable
for use in load-bearing orthopedic applications. Therefore, by coating metallic implants
with HA, it is possible to combine the mechanical properties of the metal with the
bioactive behavior of the mineral.
Electrodeposition is an attractive method for applying crystalline phosphate coating
on metallic substrate. This technique is used for fabricating pure and fine-grained HA
coating suitable for medical applications.
1.5 Methods for coating Ti with HA
Mineral coating can be deposited onto substrate by different methods. It is possible
to change the processing parameters of each method to achieve the desirable final
coating. Many techniques have been used to deposit HA onto titanium surface such as
plasma spraying, ion beam sputtering, sol-gel deposition, biomimetic deposition, high
velocity oxygen fuel (HVOF) spraying, pulsed laser deposition electrophoretic deposition
and electrochemical deposition. Among these methods, plasma spraying is the most
popular method for coating titanium implant surfaces. However, it has a decomposition
issue with HA due to high temperature and nonuniform HA coating on implants with
complex shapes [13].
Electrochemical deposition of hydroxyapatite (HA) is an attractive process because
of its unique advantages. By this method, coating irregular shapes can be done at a
relatively low temperature. In addition, thickness, chemical composition and morphology
of coating can be controlled by varying the electrodeposition conditions like
electrochemical potential, current density, electrolyte concentration and temperature [14].

5
Compared with plasma spraying, electrochemical deposition is a technique capable
of forming a uniform coating and ease of operation. Moreover, this process can be run at
room temperature and the morphology of the coating can be controlled easily by
changing the electrolyte concentration and electrochemical potential. At very low
concentration of calcium and phosphate ions (simulated body fluid) and at pH values
comparable with the biological pH, nanophase HA can be deposited on the substrate.
This level of supersaturation may be in the rang which exists in vivo at the site of
calcification [15]. This may explain the low rate of crystal growth and formation of nano-
sized crystals under these conditions.
There are several different techniques for producing mineral coating; each of them
has its advantages and disadvantages. Some of the main methods used for coating HA
and their characteristics are provided in Table 1.
HA coating on Ti surface by electrodeposition continues to be a method investigated
and favored by many research groups. Precipitation of calcium phosphate on titanium
substrate occurs through a nucleation and growth mechanism. A simplified schematic
diagram of an approach that was done by A. Kar at the University of Nevada, Reno is
shown in Figure 1.
This presented method produces crystalline HA onto nanoporous titanium is suitable
for bone cell attachment and proliferation. This process is carried out at a low
temperature (80ºC) relative to other methods which rules out the possibility for the
formation of different phases of calcium phosphate. This temperature leads to have
crystalline structure that the heat treatment after deposition can be negligible. In
addition, it is relatively inexpensive compared to other process of HA such as plasma
spray and sputter coating and needs fewer prices for its operation. The other advantage is
the easy operation for this method. The set up for this experience is simple and less
complicated devices.
The purpose of this research is to study the microstructural features and the effect of
vertically aligned TiO2 nanotubes and associated nanostructures on the formation of
hydroxyapatite. This will increase the bond strength and bioactivity of the deposited
calcium phosphate layer by formation of anatase phase TiO2 which enhances the
hydroxyapatite coating.

6
Table 1: Methods of HA coating and their characteristic. [Modified from 3, 16, 17]
Coating method Thickness Key characteristics
Plasma spraying 30-200 µm Amorphous and nonuniform HA phases;
relatively rough surfaces; poor adhesion
Sputter coating ≤ 5 µm
Thin, uniform, dense and amorphous
coating;
restively smooth surface
Biomimetic deposition ≤ 10 µm
Low deposition rate yield thin coating; can
coat complex shapes; forms bone-like
apatite
HVOF
(high velocity
oxygen fuel)
30-200 µm
Dense and amorphous coating with good
mechanical properties; relatively has phase
purity; high deposition rate,
Sol-gel deposition ≤ 1 µm
Dense, uniform and thin coating with
controlled chemistry and microstructure;
strong adhesion
Pulsed laser deposition ≤ 5 µm Thin, uniform, dense and amorphous
coating; non stoichiometric Ca/P ratio;
Electrophoretic
deposition 0.1-2 mm
Uniform coating; fast process, require heat
treatment, crack formation is common
Electrodeposition ≤ 5 µm
Relatively inexpensive; coating can be
controlled by changing parameter, can coat
complex shapes
7
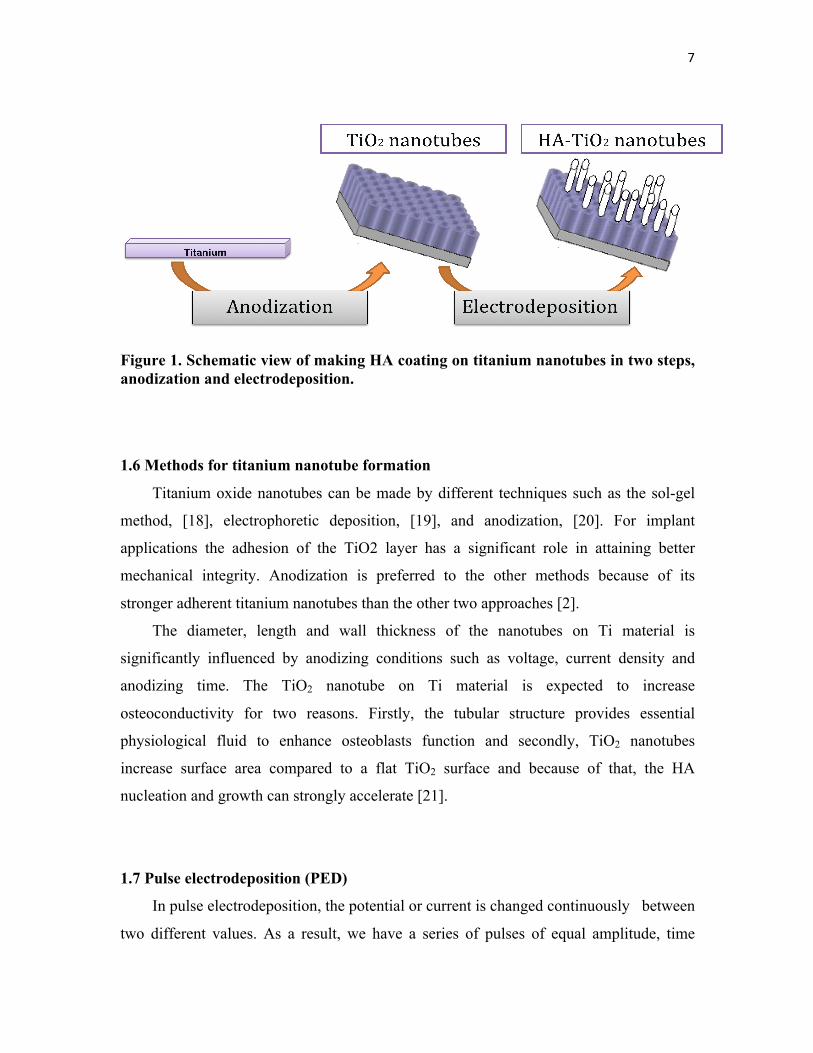
Figure 1. Schematic view of making HA coating on titanium nanotubes in two steps, anodization and electrodeposition.
1.6 Methods for titanium nanotube formation
Titanium oxide nanotubes can be made by different techniques such as the sol-gel
method, [18], electrophoretic deposition, [19], and anodization, [20]. For implant
applications the adhesion of the TiO2 layer has a significant role in attaining better
mechanical integrity. Anodization is preferred to the other methods because of its
stronger adherent titanium nanotubes than the other two approaches [2].
The diameter, length and wall thickness of the nanotubes on Ti material is
significantly influenced by anodizing conditions such as voltage, current density and
anodizing time. The TiO2 nanotube on Ti material is expected to increase
osteoconductivity for two reasons. Firstly, the tubular structure provides essential
physiological fluid to enhance osteoblasts function and secondly, TiO2 nanotubes
increase surface area compared to a flat TiO2 surface and because of that, the HA
nucleation and growth can strongly accelerate [21].
1.7 Pulse electrodeposition (PED)
In pulse electrodeposition, the potential or current is changed continuously between
two different values. As a result, we have a series of pulses of equal amplitude, time

8
period and polarity. Figure 2 shows a typical pulse-current waveform. It is shown that
each pulse contains an ON-time (TON) that is the time for applying positive potential or
current, and an OFF-time (TOFF) that is the time for applying negative potential or
current. By this technique, we can control the deposited film composition and thickness
by managing the pulse amplitude and width. The major advantage of using this method is
the finer grained deposited layer which has better properties than conventional coating
methods [22].
1.7.1 Advantages of pulse technique
Generally, in electroplating techniques, around the cathode we have formation of a
negatively charged layer as the process continues. When we use direct current, this layer
is an obstacle for the ions in reaching the surface. In PED, the output is periodically
turned off to allow ions to pass through and deposit on the surface during discharge OFF-
time.
Secondly, the current density is not distributed evenly in the bath. During OFF-time,
ions migrate to the low current density areas and after applying positive current (during
ON-time) deposit more evenly on the surface.
Thirdly, in PED, by modifying the pulse parameters we can obtain the desired
composition, structure, porosity and hydrogen content of the deposited layer. In addition,
in this method we can enhance the bath stability and efficiency by reducing the additive
requirement [22].
Figure 2. Typical pulse-current or potential waveform.

CHAPTER 2
RESEARCH OBJECTIVES
The objective of this research is to work toward developing a modification for HA
coating on titanium nanotubes by annealing anodized samples in order to make anatase
phase of TiO2. Amorphous coating cannot nucleate apatite easily and requires
crystallization heat treatments for inducing HA formation. It is well established that
anatase phase enhance nucleation and growth of hydroxyapatite (HA) due to crystal
lattice match. The HA coating method should produce crystalline and uniform HA
coating with higher interfacial bond strength and better bioactivity. This modification is
predicted to decrease the failure rate of HA coated onto Ti implants.
The aim of this work is to study the chemical composition and morphology of
Titanium nanotubes, followed by the electrodeposition of calcium and phosphorous
compounds. Chemical and mechanical surface pretreatment were designed to ensure
good adhesion of the coating.
The research aims to:
1. Prepare titanium nanotubes on Ti samples by anodization
2. Do heat treatment of nanoporous TiO2 to change amorphous structure to anatae
crystalline structure at 350ºC under oxidizing conditions in air for 2 hours
3. Do alkaline treatment of nanoporous TiO2 to increase the pH inside the nanotubes and
thus provide a site for nucleation of HA
4. Pulse electrodeposit HA onto titanium nanotubes to ensure that the needle like HA
grows from the bottom of the nanopores

CHAPTER 3
EXPERIMENTAL PROCEDURE
The coating process involves two steps: At first, anodization of Ti to form nanotubes
and second, and deposition of hydroxyapatite.
3.1 Formation of nanoporourous TiO2 layer on Ti substrate
The anodization process was conducted as follows. Commercial pure titanium (ESPI
metals, Ashland, Regan, USA) was used as substrate. The titanium sheet was cut into
samples. The samples were polished with a grit emery paper, washed with distilled water
(DI) and ethanol, and dried. Firstly, titanium substrates were cleaned by DI water and
after that sonicated for about 10 minutes in isopropyl alcohol by ultrasonic device. The
anodization solution was prepared by dissolving various combinations of phosphoric acid
and fluoride dissolved in deionized water. The electrolyte used in this study contained 0.5
M H3PO4 +0.12 M NaF and its pH value was adjusted to 2 at room temperature.
A direct current power source (Model E3641A, Aglient Technologies, Palo Alto,
USA) was set at a constant potential of 20 V for 45 minutes. The Ti substrate was
connected to the positive terminal of the power source, and a 7.5 cm2 platinum foil was
connected to the negative terminal. The distance between anode and cathode was
maintained at about 4 cm (Figure 3). During the treatment, the electrolyte was stirred to
maintain the homogeneity of the temperature and composition. After anodic oxidation,
the sample was rinsed with distilled water and dried by dryer.

11
Figure 3. Anodization set-up, a) DC power source, b) titanium, c) platinum
electrode, d) electrolyte, e) magnetic stirrer.
3.2 Heat treatment to crystallize titanium nanotubes
Annealing heat treatment is believed to change the amorphous structure of anodized
titanium to crystalline structure of TiO2 (anatase and rutile phase). Therefore, as-prepared
TiO2 nanotubes were heat treated under oxidizing condition in order to have an anatase
structure on the surface. The samples were annealed at 350ºC for 2 hours in air with a
ramping speed of 1 ºC/min and cooled back to room temperature within the furnace.
3.3 Alkaline treatment of anodized samples
When the electrodeposition of HA onto the Ti substrate was carried out immediately
after anodization without any postanodization surface treatment, the resulting HA coating
was not uniform and showed low interfacial strength. Surface pretreatment of the
titanium samples in a high pH solution was found to improve HA deposition and bond
strength. The optimized condition for postanodization alkaline treatment is obtained at
50ºC for 2 minutes in 0.5 M NaOH solution [20]. Anodized titanium samples were
treated with de-ionized water and then 0.5 M NaOH solution. After these pretreatments,
the samples were introduced into an electrolyte solution for electrodeposited HA.

12
3.4 Electrodeposition of calcium phosphate coating onto nanoporous
titanium
Anodized Ti samples that were either heat treated or that had not undergone the
pretreatment were introduced into an electrolyte for electrodeposition of calcium
phosphate coating. The electrolyte solution for deposition of HA was that reported by
Ban and Marino and is called simulated body fluid [23]. The electrolyte consisted of 1.67
mM phosphate salt (K2HPO4), 2.5 mM calcium salt (CaCl2). Fifteen percent M NaCl
was also added to improve the ionic strength of the electrolyte. The solution was stirred
with magnetic stirrer at room temperature for 30 minutes. Its pH value was adjusted to
about 7.
The deposition was carried out by applying cathodic current in two steps; first,
pulsing the current density and in the second step, having constant current. Figure 4
shows the diagram for deposition and schematically illustrates the process for monitoring
current versus time.
A typical electrochemical cell was used in this method with three electrodes dipped
in solution: one reference electrode of calomel (Ag/AgCl) saturated with KCl, one
counter electrode (platinum electrode) and one work electrode (anodized Ti sample). The
deposition of HA was carried out at 80ºC to reach a crystallized structure. The device
used for the experiment is potetiostat. The experiment setup is shown in Figure 5.
During the treatment, the electrolyte was stirred to maintain the homogeneity of the
temperature and composition. Then coated titanium was rinsed with distilled water and
dried in the oven.
3.5 Scanning electron microscopy (SEM), energy dispersive X-ray
analysis (EDAX), X-ray diffraction (XRD)
SEM and EDAX analysis were done on samples by using a Hitachi S-4700 SEM.
Imaging was done under high resolution mode and accelerating voltage was kept below 3
kV. The crstallinity of calcium phosphate coating was observed by XRD.

13
Figure 4. Schematic diagram illustrating the process for applying current versus
time during deposition of HA for the first step.
Figure 5. Electrodeposition set-up, working electrode (WE), counter electrode (CE)
and reference electrode (RE).

14
3.6 Evaluation of interfacial bond strength
The bond strength of the HA coating was evaluated by conducting tension testing as
described in ASTM standard F 1147-99. A HA coated sample was glued to two mating
surfaces by using 3M Scotch-weld 2214-NMF structural adhesive and cured at 121 ºC for
2 hours. Tensile tests were done on a computer-controlled universal testing machine
(Instron) at a speed of 0.1 mm/min. (Figure 6)
Another way to evaluate the bond strength is the Scotch tape test, which shows the
adhesion between coating and substrate qualitatively. In this test, Scotch sealing tape is
applied and removed rapidly from surface.
Figure 6. Instron machine used for bond strength measurement.

CHAPTER 4
RESULT AND DISCUSSION
4.1 Nanoporous TiO2 layer formation on the Ti substrate
The fabrication of vertically aligned TiO2 nanotubes on Ti substrate was
demonstrated by the anodization process. In general, the mechanism of TiO2 nanotube
formation in fluorine-ion based electrolytes is a result of two competing electric field-
assisted processes: hydrolysis of Ti metal to form TiO2 and chemical dissolution of oxide
layer at the oxide/electrolyte interface [24]. The mechanism of nanotube formation by
electrochemical anodization has three stages which generally explain the TiO2 tubular
growth (Figure 7) [25]:
1. Initial formation of an oxide barrier layer which results in decreasing the anodic
current until it reaches the steady state (stage I)
2. Formation of uniformly distributed pores by chemical dissolution of the compact
oxide layer by increasing the current (stage II)
3. Separation of interconnected pores into ordered nanotubes as a result of simultaneous
growth of voids (stage III)
Nanotubes improve the bonding to the living bone cells (osetoconductivity and
osteointegration) because these tubular structures can provide necessary fluids in spaces
between tubes in similar ways to human bone growth [14].
Furthermore, the nanotubular layer provides high surface-to-volume ratio which
gives more nucleation sites. This nanostructure also provides preferred sites for
nucleation of HA [14].

16
Figure 7. Current density (A/cm2) during TiO2 nanotube formation as a function of
time (s). Stage I: oxide barrier formation; stage II: pore nucleation; stage III:
nanotubular oxide growth [20].
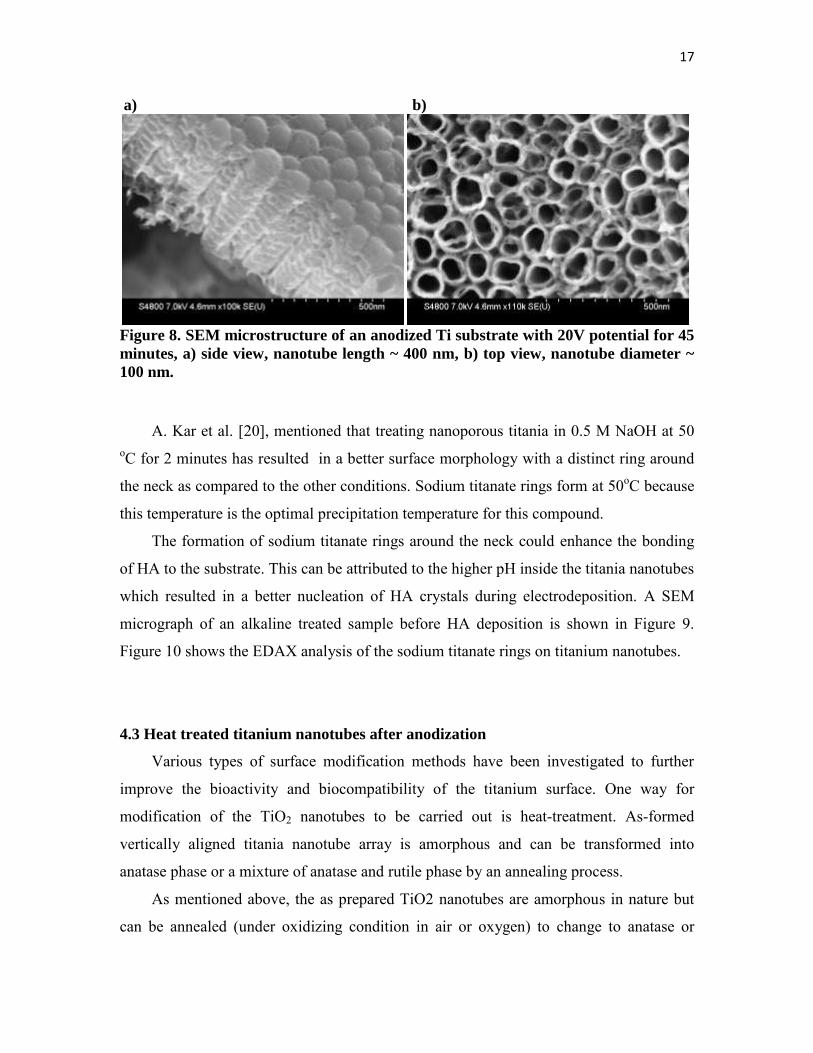
Ti samples were anodized in 0.5 M H3PO4 and 0.12 M NaF at 20 V for 45 minutes.
Figure 8 shows the morphlogy of the nanotubes obtained at pH 2. The length of the
nanotubes is about 400 nm and their dimater is about 100 nm.
4.2 Effect of alkaline treatment
In order to achieve more uniform HA coating with higher bond strength, the alkaline
treatment can be used before deposition. It has been reported that alkaline pretreatment of
titanium nanotubes develops a seconded nanostructure, sodium titanate rings around the
neck of the nanopores [26].
Hydroxyapatite formation can be accelerated by introduction of sodium titanate layer
when the samples are subjected to NaOH solution followed by heat treatment [27].
Various solutions of NaOH as a function of temperature were used to see which
conditions give the best result before deposition.
17
a) b)
Figure 8. SEM microstructure of an anodized Ti substrate with 20V potential for 45
minutes, a) side view, nanotube length ~ 400 nm, b) top view, nanotube diameter ~
100 nm.
A. Kar et al. [20], mentioned that treating nanoporous titania in 0.5 M NaOH at 50 oC for 2 minutes has resulted in a better surface morphology with a distinct ring around
the neck as compared to the other conditions. Sodium titanate rings form at 50oC because
this temperature is the optimal precipitation temperature for this compound.
The formation of sodium titanate rings around the neck could enhance the bonding
of HA to the substrate. This can be attributed to the higher pH inside the titania nanotubes
which resulted in a better nucleation of HA crystals during electrodeposition. A SEM
micrograph of an alkaline treated sample before HA deposition is shown in Figure 9.
Figure 10 shows the EDAX analysis of the sodium titanate rings on titanium nanotubes.
4.3 Heat treated titanium nanotubes after anodization
Various types of surface modification methods have been investigated to further
improve the bioactivity and biocompatibility of the titanium surface. One way for
modification of the TiO2 nanotubes to be carried out is heat-treatment. As-formed
vertically aligned titania nanotube array is amorphous and can be transformed into
anatase phase or a mixture of anatase and rutile phase by an annealing process.
As mentioned above, the as prepared TiO2 nanotubes are amorphous in nature but
can be annealed (under oxidizing condition in air or oxygen) to change to anatase or

a) b)
Figure 9. SEM micrographs of titania nanotubes, 20V, 45 minutes, a) before NaOH
treatment, b) after 0.5 M NaOH treatment for 2 minutes at 50 oC.
Figure 10. EDAX analysis of the sodium titanate rings on nanoporous TiO2.
rutile. The significant conversion of nanotubes layers into anatase begins at around 280o
C. With an increasing annealing temperature, anatase formation is enhanced. Above
about 500 oC, the rutile phase starts to appear, and with further increases in the annealing
temperature the quality of rutile increases [27].
In addition, annealing affects the composition of the surface. As-formed nanotubes
contain a significant amount of fluoride species. These species can be driven out to a
large extent by annealing.
18

19
It is well established that anatase phase is more efficient in nucleation and growth of
apatite than the rutile phase due to crystal lattice match with HA phase [26]. The crystal
lattice information of these phases is provided here (Figure 11).
Hydroxyapatite, 26410 )()( OHPOCa : (Hexagonal) a=9.41 ºA, c= 6.88 ºA, Z=2
Anatase: (Tetrahedral) a=3.7845 ºA, c=9.5143 ºA, Z=4
Rutile: (Tetragonal) a=4.5937 ºA, c=2.9587 ºA, Z=2
The heat treatment at different degrees results in the phase change of tubular oxide.
Figure 12 shows the changes in titania crystal structure by annealing at different
temperatures. In the beginning, after 280 oC, the surface converts to anatase phase and by
heating to higher temperature, rutile phase is formed. The undesired effects that can occur
in annealing are shown in Figure 13. Above 450 oC, some cracks formed at the tube
walls.
a)
b)
Figure 11. Crystal structures of a) anatase, b) rutile phase.

20
Figure 12. Transition between TiO2 phases at different temperatures.
a) b)
Figure 13. SEM micrographs of nanotubes after annealing at 500 ºC for 2 hours, a)
before deposition of HA, b) after electrodeposition of HA at constant potential.
In this work, the coating after anodization was amorphous and by annealing the
sample it was crystallized to induce apatite. Heat treatment of the amorphous nanotubes
by continuous heating to ~350 ºC for 2 hours produced an anatase crystal structure of
TiO2, shown in Figure 14- b, which is not much different from the as-anodized structure
of Figure 14-a. No cracks are obviously observed at this temperature. These heat-treated
coatings were then electrodeposited when the reference electrode was in the solution. The

21
a)
b)
Figure 14. SEM microstructures of TiO2 nanotubes, a) as anodized, b) after
annealing to 350 ºC.
methodology is illustrated in Figure 15, and SEM images of the last results are also
shown. After crystallization, nanocrystalline nanorods of HA were deposited such that
they are vertically aligned to the surface. By comparison of these two results, we can see
that the microstructure is finer on the anatase surface. The nanosized microstructure is a
better match to bones. Therefore, by doing annealing we could achieve better bioactivity
and osteoconductivity in vivo.
Figure 16 shows SEM microstructures of an annealed sample after deposition in
different magnification (top view and side view pictures). In Figure 17, we can compare
annealed and unannealed samples prior to the deposition. The deposited layer of HA is
thicker for the annealed sample (~ 4µm) while the thickness without annealing is just
about 1 µm. The EDAX analysis of the coated layer after annealing at 350 ºC is shown in
Figure 18.

22
Figure 15. Methodology followed in presented approach.

23
a) b)
c) d)
e) f)
Figure 16. SEM images for sample with annealing at 350ºC for 2 hours before
hydroxyapatite deposition; top views, a) 20k, b) 30K, c) 50k, d) 80k and side views,
e) 45k, f) 15 k.

24
a)
b)
Figure 17. Side view images of Ti nanotubes after hydroxyapatite deposition, a)
without annealing nanotubes, thickness is about 1 µm; b) annealed at 350ºC for 2
hours, thickness is about 4 µm.

25
Figure 18. EDAX analysis of the deposited layer after annealing at 350ºC.
Figure 19 shows the electrodeposition graphs (potential versus time) for annealed
and unannealed samples. These are potential responses of the chronopotentiometry
experiment (for the first step) and galvanostat (for the second step). The difference
between these two graphs is related to the first step. The deposition is enhanced by
electric field and electrodynamics flows. Therefore potential is the main electrodeposition
parameter that can have effect on coating properties. The graph for annealed samples
shows that we have more ions flow. This leads to more nucleation of HA and happened
sooner.
According to Figure 19, the heterogeneous nucleation of hydroxyapatite is increased
by annealing with a consequent increase in the number of particles involved in the
process since the growth process is diffusion controlled.
As a result, with comparison SEM images and electrodeposition graphs, it is
concluded that the formation of anatase phase can enhance hydroxyapatite nucleation and
finer nanorods of HA are formed onto TiO2 nanotubes and the nucleation process on real
crystalline substrates enhances the surface properties [28].
Spectrum

26
Figure 19. Electrodeposition graphs for two samples, a) without annealing
nanotubes, b) with annealing at 350 ºC.
-1.8
-1.6
-1.4
-1.2
-1
-0.8
-0.6
-0.4
-0.2
0
0 1000 2000 3000 4000 5000
Po
ten
tial
vs
Vre
f (V
)
Time (sec)
a) unannealed nanotubes
first step
-1.8
-1.6
-1.4
-1.2
-1
-0.8
-0.6
-0.4
-0.2
0
0 1000 2000 3000 4000 5000
Po
ten
tial
vs
Vre
f(V
)
Time (sec)
b) annealed nanotubes at 350º C
first step
second step

27
4.4 HA electrodeposition
Successful application of electrodeposition requires an understanding of the
deposition mechanism. In electrolytic deposition, ions and complexes are hydrolyzed and
by applying the electric fields are deposited on the substrates. This process can be
explained by DLVO theory (Derjaguin-Landau-Verway-Overbeek), theory of colloidal
stability, which considers two main forces, double layer repulsion and Van der Wales’s
attraction. The thickness of the double layer is very sensitive to electrolyte concentration
and there is a critical electrolyte concentration for deposition. Interaction could also be
influenced by ion presence and electrode relations. Parameters such as applied
current/potential, pH, temperature and time of deposition could have an effect on deposit
morphology and crystal structure [29].
Figure 20 shows the cyclic voltammogram (CV) obtained in an electrolyte (1.67
mM K2HPO4+2.5 mM CaCl2+0.15 M NaCl) for electrodeposition of calcium phosphate
coating with a potential scan rate of 10 mV/s. A typical three electrode (working
electrode, counter electrode, reference electrode) was used for the CV experiment to
observe at which potential HA deposition onto TiO2 will happen. NaCl was added to
improve the ionic strength of the electrolyte.
Figure 20. Cyclic voltammograms obtained in the deposition condition. The
potential was scanned from 0.5 V to -2 V and back at 10 mV/s.
-0.035
-0.03
-0.025
-0.02
-0.015
-0.01
-0.005
0
0.005
-2.4 -2.1 -1.8 -1.5 -1.2 -0.9 -0.6 -0.3 0 0.3 0.6 0.9
Cu
rren
t d
ensi
ty, A
/cm
²
Potential, V (Ag/AgCl)

28
During CV studies, the sample was polarized in cathodic direction from 0.5 V
(Ag/AgCl). Significant cathodic current was observed when the potential became more
negative than -1.2 V. The cathodic current could be assigned to two kinds of reduction
reactions in this electrolyte system:
1. Reduction of acid phosphate
2. Reduction of hydrogen ion or water
In experimental conditions (pH~7), reactions 2 and 4 are dominate as a result of the
applied cathodic current. A significant increase in current was observed at -1.2 V.
When sufficient hydroxyl ions are adsorbed on the surface, the deposition of HA
takes place according to this reaction:
Different types of calcium phosphate structure could be deposited on the TiO2
surface by cathodic polarization which depends on the pH condition. For example, in a
relatively low pH condition HPO42- species are more stable in the solution. Consequently,
brushite is expected for deposition according to this reaction:
(6) 42
42 CaHPOHPOCa
4.4.1 Electrodeposition at constant potential
For the electrodeposition, an electrochemical cell with three electrodes dipped in
solution was used. CV studies clearly show a significant increase in current starts at -1.2
V (Figure 21). Therefore, deposition was carried out by applying different potentials (-
0.8, -1.1, -1.2, -1.4 V). The solution was stirred during electrodeposition to have a
uniform electrolyte concentration. Then, coated titanium was rinsed with distilled water
and dried. Figure 21 shows the electrodeposition graphs at these different constant
applied potentials. SEM images of these conditions are also shown in Figure 22.
According to these results, it is clear that -0.8 V is not enough for deposition and a
deposited HA layer was not obtained (Figure 17-a). The morphology of the HA deposited
(4) 222(3) 22
22
2
OHHeOH
HeH
(2) 22
(1) 222
23
42
4
22
442
HPOeHPO
HHPOePOH
(5) )()(2610 264103
42 OHPOCaOHPOCa

29
Figure 21. Current versus time during the formation of hydroxyapatite by applying
different constant potentials.
a) b)
c) d)
Figure 22. Morphology of amorphous calcium phosphate coating deposited at
different constant potential without annealing, a ) -0.8 V, 1800 sec; b) -1.1 V, 1800
sec; c) -1.2 V, 1800 sec; d) -1.4 V, 1800 sec.
-8
-7
-6
-5
-4
-3
-2
-1
0
0 500 1000 1500 2000
Cu
rre
nt
de
nsi
ty (
mA
/cm
2)
Time (sec)
-1.2 V
-1.4 V
-0.8 V
-1.1 V

30
layer is considered amorphous at constant potential condition. In Figure 23, top view and
side view SEM images of the amorphous HA layer are shown and which are related to -
1.4 V as an applied potential, which has relatively the best result in deposition.
Pulsed electrodeposition is a process using pulsed electrical current to reduce cations
of a desired material from a solution and coat that material as a thin film onto a
conductive substrate surface. Figure 5 shows the applied current for this process in our
work. It has two steps, pulsed and constant current.
4.4.2 Pulsed electrodeposition
The deposition was carried out at high temperature to make a crystalline structure of
hydroxyapatite. This relatively high temperature has an influence on the reference
electrode potential. Therefore, we did deposition in two situations, reference electrode
inside the solution where the reference electrode and the electrolyte have the same
temperature, and in the second situation the reference electrode was outside of the
solution to keep the reference electrode at room temperature. In the last situation, the
potensiostat device was in the overloading condition. Figure 24 demonstrates these two
experimental conditions.
Figure 23. SEM images after deposition of amorphous hydroxyapatite with constant
potential (-1.4 V) at room temperature for 1800 sec, a) side view and b) top view of
the deposited HA layer.

31
Figure 24. Two experimental conditions for electrodeposition of HA, a) reference
electrode inside the high temperature solution (without overloading potentiostat), b)
reference electrode remains at room temperature (with overloading potentiostat).
When the reference electrode was inside the solution (without overloading), the
vertically oriented growth of calcium phosphate crystal has finer apatite crystallite size.
It is known that nanosized apatite grains improve bioactivity and improve osteoblast
functions [7], because the nanosize structure of HA is more matched to the bones.
Therefore, without overloading (reference electrode inside the electrolyte) is the preferred
situation (Figure 25).
Although electrodeposition without overloading (reference electrode was inside the
solution) gives us the better result in structure, when the reference electrode was outside
of the solution (with overloading) the potential is more significant due to changes in
reference electrode potential by increasing solution temperature.
4.4.2.1 Pulsed deposition procedure (without overloading)
Table 2 shows the continuous SEM micrographs during the HA coating procedure
that was electrodeposited onto the titanium nanotubes. These SEM images indicate

32
Figure 25. Methodology of HA deposition in two conditions, reference electrode
outside the solution (with overloading) and reference electrode inside the electrolyte
(without overloading).

33
Table 2: SEM micrographs for samples during the pulsed deposition of
hydroxyapatite at 80ºC with 50k magnification when the reference electrode was
inside the solution.
SEM images Comments
Anodization
for 45 minutes
At room
temperature
20 V
Nanoporous TiO2 layer
formation on Ti substrate
0.5 M NaOH
for 20 minutes
at 50ºC
A ring of sodium titanate
is formed around the neck
of the nanotubes
Pulsed
deposition
after 10 cycles
Nucleation of
hydroxyapatie initiates in
some ports of the samples
from inside Ti nanotubes
Pulsed
deposition
after 50 cycles
The nucleation is
completed and entire
surface is covered by
hydroxyapatie nucleate

34
Table 2 continued
SEM images Comments
Pulsed
deposition
after 100
cycles
An intermediate phase of
hydroxyapatite is formed
that is between nucleates
and nanorods
Pulsed
deposition for
100 cycle+
constant
current
15 minutes
Nanorods start growing
Pulsed
deposition for
100 cycle+
constant
current
60 minutes
The growth is completed.
Vertically aligned
nanorods are formed.

35
mechanisms of the HA deposition. Deposition leads to the substrate’s coverage growth
and determines the increase of layer thickness. After alkaline pretreatment, the nanopores
are covered by sodium titanate rings. In case of coating deposition of short durations,
only a nucleation process without crystal growth and an incomplete coverage of the
substrate is observed. In the last picture, the coating contained vertically orientated
nanorods of HA.
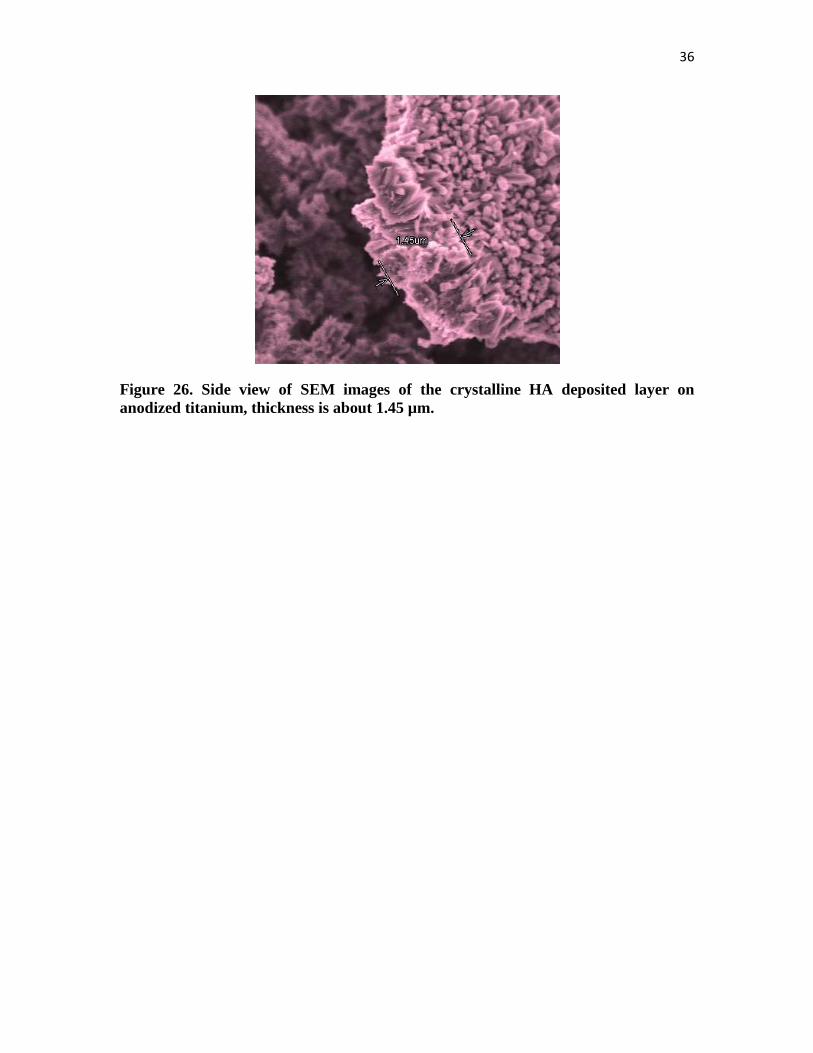
The side view of the deposited layer is shown in Figure 26. The thickness is about
1.45 µm. In Figure 27 we can see the whole procedure in lower magnification (30 k).
4.4.2.2 Pulsed deposition procedure (with overloading)
Figures 28 and 29 show the SEM micrographs in two magnifications, 20k and 50k,
of the HA coating procedure where the reference electrode was outside of the solution. In
this condition, the reference electrode’s temperature stays at room temperature.
In Figure 30, the deposited layer from the overloading condition is shown. Figure
30-a shows three different layers, Ti substrate, titanium nanotubes and HA nanorods. The
thickness of the deposited layer is about 700 nm (Figure 30-b).
4.4.2.3 Pulsed electrodeposition at different temperature
Deposition took place at different temperatures without overloading (reference
electrode was in the solution). At low temperatures diffusion will be limited. Changing
temperature increases diffusion of particles that enhance the nucleation and growth
process.
By deposition at higher temperature, the crystalline structure of hydroxyapatite was
obtained and shown in Figure 31. Figure 32 and 33 show the effect of temperature. By
comparing these two graphs, we can conclude that by increasing the temperature, we
have more ion flow in the solution during deposition.
36
Figure 26. Side view of SEM images of the crystalline HA deposited layer on
anodized titanium, thickness is about 1.45 µm.

37
a) b)
c) d)
e) f)
Figure 27. SEM images with 30k magnification without overloading condition
(reference electrode inside the solution) at 80ºC, a) alkaline treated Ti nanotubes, b)
after 10 cycles, c) after 50 cycles, d) after 100 cycles, e) after 100 cycles + 15 minutes
constant current, f) after 100 cycles +60 minutes constant current.

38
a) b)
c) d)
e) f)
Figure 28. SEM images with 20k magnification in the overloading situation
(reference electrode kept at room temperature), a) as anodized Ti; b) after alkaline
treatmnet; c) after 10 cycles; d) after 50 cycles; e) after 100 cycles; f) after 100 cycles
+ 15 minutes constant current.

39
a) b)
c) d)
e) f)
Figure 29. SEM images with 50k magnification in the overloading situation
(reference electrode kept at room temperature), a) as anodized Ti; b) after alkaline
treatment; c) after 10 cycles; d) after 50 cycles; e) after 100 cycles; f) after 100 cycles
+ 15 minutes constant current.

40
a) b)
Figure 30. SEM images for samples with repeating potential deposition at 80
0C with
overloading (reference electrode outside the solution); a) different layers (Ti
substrate, Ti nanotubes, HA deposited layer); b) side view picture of deposited
layer, thickness is about 700 nm.
a)
b)
Figure 31. SEM images of electrodeposited samples at different temperatures, a) 70
ºC, b) 80 ºC.

41
Figure 32. Potential versus time during the HA deposition at room temperature, in
two steps. Step 1: Pulsing the current density for 100 cycles. Step 2: Constant
current density for 1 hour.
Figure 33. Potential versus time during the HA deposition at 40ºC, in two steps.
Step 1: Pulsing the current density for 100 cycles. Step 2: Constant current density
for 1 hour.
-2.5
-2
-1.5
-1
-0.5
0
0 500 1000 1500 2000 2500 3000
Vo
ltag
e (
V)
Time(s)
first step
Second step
-2.00
-1.50
-1.00
-0.50
0.00
0 500 1000 1500 2000 2500 3000
Vo
ltag
e (
V)
Time (s)
first step
second step

42
4.5 HA bond strength
4.5.1 Tensile test
The bond strength of HA coating on nonporous Ti substrate is very critical for
implant applications as it has to withstand load-bearing situations of the bone. Failure of
the implant occurs when the bonding between the Ti substrate and HA coating breaks.
Therefore in the present work, we focused on improving the bond strength between
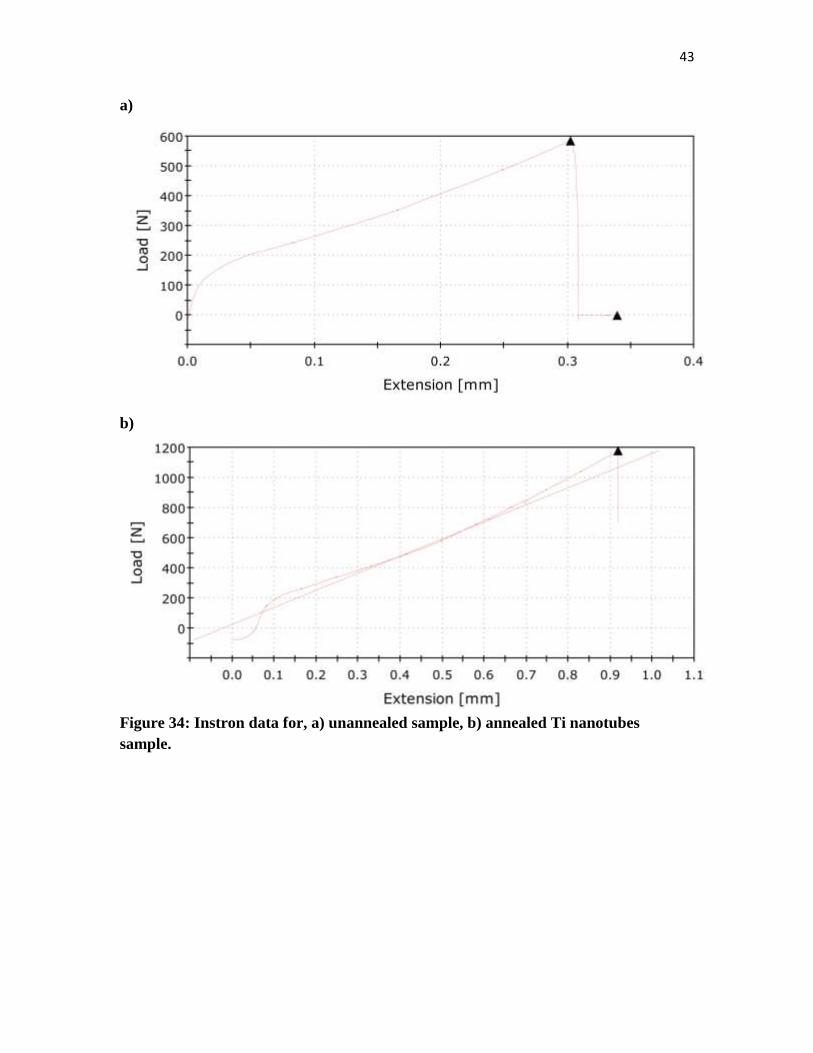
deposited HA and Ti substrate. The strength of human bone is about 18 MPa.
Consequently, the goal is to get higher bond strength than natural human bone. Table 3
shows the bond strength of the HA coating on Ti nanotubes in different annealing
conditions. Annealing of Ti nanotubes at 350ºC in air atmosphere significantly increased
the bond strength. Figure 34 provides the Instron data for annealed and unannealed
samples.
Heat treatment of nanotubular TiO2 could give us better cohesion. This increase in
bonding strength could be attributed to a better nucleation for the hydroxyapatite crystals
during electrodeposition on anatase phase of titania. Because the tensile strength of
human bone is about 18 MPa [20], the fabricated coating of HA on titanium substrate will
have higher bone strength than natural human bone.
Table 3. Interfacial bond strength of HA coated sample under different annealing
conditions.
Sample Interfacial bond strength (MPa)
Human bone 18
Deposited without annealing Ti nanotubes 15, 18
Deposited after annealing Ti nanotubes at 350ºC 27, 29
43
a)
b)
Figure 34: Instron data for, a) unannealed sample, b) annealed Ti nanotubes
sample.

44
4.5.2 Scotch tape test
Adhesion refers to the bond (chemical or physical) between two materials which are
next to each other and the required force to separate them completely [30]. The ASTM
defines adhesion as the "condition in which two surfaces are held together by either
valence forces or by mechanical anchoring or by both together."
Scotch tape test is a simple method for evaluating the adhesion of a coating to a
substrate and was done for the samples without overloading (reference electrode in the
solution). In this test, Scotch sealing tape is applied to and removed rapidly from the
surface. Figures 35 and 36 show the SEM images before and after tape removal. After
tape removal, the HA coating is still attached to the titanium substrate. We can conclude
that the adhesion of the coating is enough to withstand the pressure from tape even after
two removals. After two removals in some areas of the sample, we can see the titanium
nanotubes (Figure 36-c).
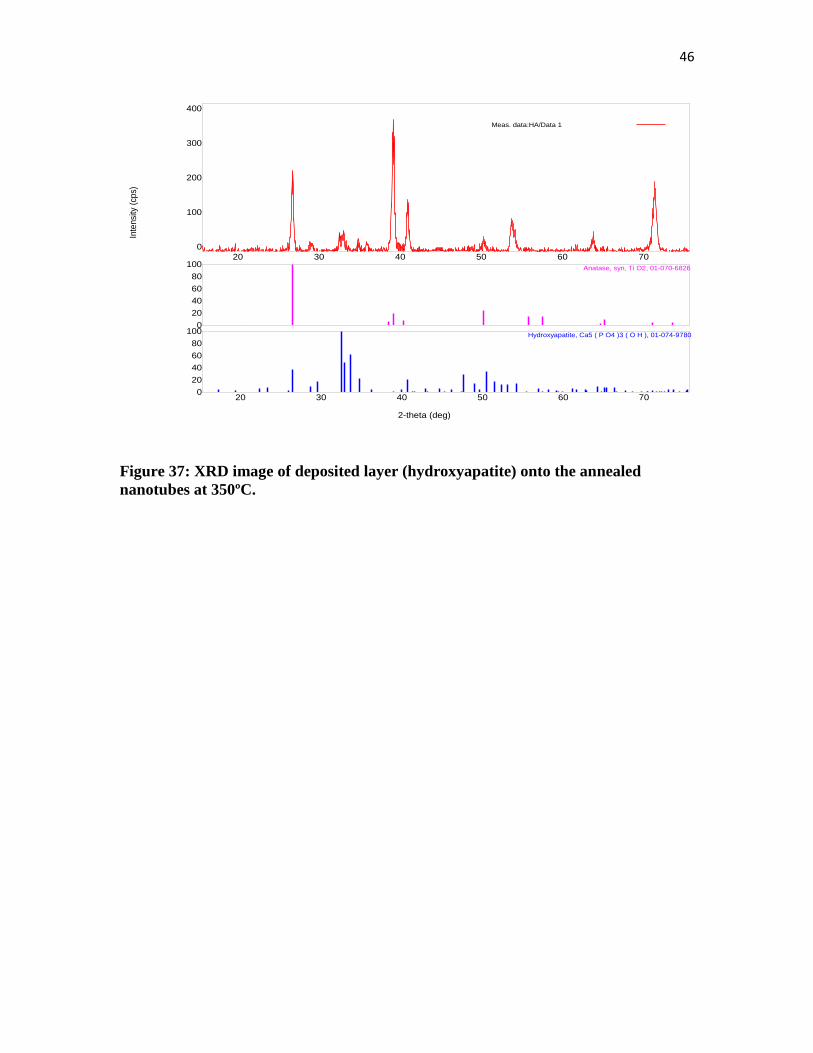
4.6. XRD data
Figure 37 shows the XRD pattern for the deposited layer (hydroxyapatite) after
annealing nanotubes at 350 oC. The XRD analysis indicates a texture morphology of the
HA coating onto the anatase phase of titanium nanotubes because of preferential growth
direction.
a) b)
Figure 35. SEM images for deposition without overloading at 80ºC, a) before Scotch tape test, b) after Scotch tape test.

45
a) b)
c)
Figure 36. SEM images for samples with repeating potential deposition at 80ºC
without overloading, a) before Scotch tape test, b) after first removal, c) after second
removal.
46
Figure 37: XRD image of deposited layer (hydroxyapatite) onto the annealed
nanotubes at 350ºC.
20 30 40 50 60 70
0
100
200
300
400
0
20
40
60
80
100Anatase, syn, Ti O2, 01-070-6826
20 30 40 50 60 70 0
20
40
60
80
100Hydroxyapatite, Ca5 ( P O4 )3 ( O H ), 01-074-9780
2-theta (deg)
Meas. data:HA/Data 1
Inte
nsi
ty (
cps)

CHAPTER 5
CONCLUSION
Surface engineering is one of the most important tools in improving the
biocompatibility and introducing bioactivity of metallic implants. These implants are still
the best option for load-bearing situations due to their excellent mechanical properties.
Bone implant failure happens mostly due to poor osteointegration and inflammation.
Recently, researchers have been focusing on improving the biocompatibility of surfaces
like HA in order to obtain better results in bone implantations.
A simple electrochemical technique was developed to form a nanocrystalline
hydroxyapatite coating on a titanium substrate by A. Kar [20]. This work suggested a
biocompatible, crystalline HA coating on anodized titanium at 20 V for 45 minutes in an
acidified solution. HA coating was deposited on titanium substrate by electrochemical
method. Electrochemical deposition is a potentially attractive process for synthesizing
bioceramic coatings from aqueous solutions on metallic implant surfaces.
In this thesis, a modification was introduced to the approach presented by A. Kar
that will have lower failure rate by improving the interfacial bond strength between HA
coating and the nanoporous titana surface.
In this work, initially, titanium nanotubes were fabricated on a flat titanium substrate
by electrochemical anodization to produce ordered and stable nanoporous TiO2 at 20 V
for 45 minutes. Then heat treatment and alkaline treatment were done, respectively,
before HA pulsed electrodeposition. Pulsed electrodeposition in simulated body fluid
conditions resulted in HA nanocrystalline coating at 80ºC. Deposition at higher
temperature favors the formation of crystalline phase and increases the deposited amount.

48
The modification presented in this thesis is annealing the titanium nanotubes at 350ºC to
have crystalline anatase phase of TiO2 on the surface for enhancing the nucleation and
growth of HA deposition due to the crystal lattice match. Bond strength of HA
deposition, relative to that of bone, significantly improved by annealing titanium
nanotubes. In addition, after annealing, the coating morphology has finer crystalline
structure of HA nanorods which have better bioactivity.
Consequently, in this thesis, we developed a modification method for improving
electrodeposited HA onto nanoporous TiO2 prior to the electrodeposition. The anodized
nanotubes were heat-treated at 350ºC for 2 hours in air atmosphere, and then they were
electrodeposited in simulated body fluid. It is shown that heat treatment of nanotubular
TiO2 could give us better cohesion and bioactivity.

CHAPTER 6
FUTURE WORK
Titanium and its alloys are being used as implant materials in many orthopedic and
dental applications. The drawback of Ti implants is their poor osseointegration and
osteoconductivity. To solve this problem, Ti is coated with hydroxyapatite (HA). This
work suggests a modification for an innovative method for depositing crystalline HA
nanotubular TiO2. HA coating must have acceptable interfacial bond strength (more than
18 MPa, the normal tensile strength of the bone). The presented method for coating
titanium nanotubes was previously modified by annealing nanotubes before HA
deposition in order to have enough bond strength. The next step is evaluation of
bioactivity of this surface.
Success of an implant also depends upon the biocompatibility and appropriate
interaction such that bone cells should be able to proliferate and maintain the appropriate
differentiation on the HA coating. To assess biocompatibility, human embryonic palatal
mesenchyma (HEPM) cells should be applied to HA deposited titanium samples and
placed in culture. HEPM are a well established experimental model for evaluating bone
cell growth and proliferation on HA coating [31, 32].
Bones have four types of cells, osteoblasts, osteoclasts, osteocytes and bone lining
cells. Among these cells, osteoblasts are responsible for bone formation.
In vivo osteoblasts derive from mesenchaymal stem cells. These cells are multi-
potent and can give rise to several other cell types. Osteoblastic differentiation includes
preosteoblast, mature osteoblasts, bone lining cells and osteocytes. Alkaline phosphatase
(ALP) is a membrane bound enzyme that is often used as a marker for osteoblastic

50
differentiation. This method could be used for the evaluation of cell maturation on Ti and
HA coated surfaces. Cell viability and proliferation are other parameters that could be
assessed, typically by using scanning electron microscopy as well as measuring
mitochondrial dehydrogenase activity and total protein content [33].
Consequently, in future work, we should concentrate on growth characteristics and
maturation of HEPM cells on HA coated Ti surfaces.

REFERENCES
[1] Betz, R. R., 2002, Limitation of autograft and allograft: new synthetic solution. Orthopedics 25. [2] Carnegie Melon University, 2001, Tutorial on bone tissue engineering in bone tissue engineering center, Carnegie Mellon Biomedical Engineering. www.btec.cmu.edu 3] Driver, M., 2012, Coating for biomedical applications. Woodhead Publishing. [4] Oh, S.H., Finones, R.R., Daraio, C., Chen, L.H., Jin, S. 2005. Growth of nano-scale hydroxyapatite using chemically treated titanium oxide nanotubes. Biomaterials 26, 4938-4943. [5] Sobieszcyk, S., Klotzke., R., 2011. Nanotubular titanium oxide layers for enhancement of bone-implant bonding and bioactivity. Advances in Materials Science, 11, 27. [6] Guslitzer-Okner, R., Mandler, D., 2001. Electrochemical coating of medical implants: application of electrochemistery and nanotechnology in biology and medicine. Modern Aspects of Electrochemistry 52, 304-305. [7] Narayanan, R., Lee, H.J., Kwon T.Y., Kim, K.H., 2011. Anodic TiO2 nanotubes from stirred bath: Hydroxyapatite growth and osteblast responses. Materials Chemistry and Physics 125, 510-517. [8] Hanawa, T., 2006. Electrochemical techniques to obtain biofunctional materials: application of electrochemistery and nanotechnology in biology and medicine. Modern Aspects of Electrochemistry 52, 343-345. [9] Sobieszczyk, S., Zielinski, A., 2008. Coating in arthroplasty. Advances in Materials Science, 8, 35-54. [10] Stefan, L.G., Abrudeanu, M., Iosub, I., Plaiasu, A.G., Dinu, A., Mihalache, M., 2005. Elecrodeposition of hydroxyapatite coating on stainless steel 316 L. Scientific
Bulletin Automotive Series 19, 54-58. [11] Leitao, E., Barbosa, M. A., Groot, K.D., 1997. Influence of substrate material and surface finishing on the morphology of the calcium- phosphate coating. Journal of Biomedical Materials Research 352, 85–90.

52
[12] Leon, B., Janson, J.A., 2009. Thin calcium phosphate coating for medical implants. Springer Science 18, 25-30. [13] Zhang Y., Tao J., Pang Y., 2006. Electrochemical deposition of hydroxyapatite coating on titanium. Transaction of Nonferrous Metals Society of China 16, 633-637. [14] Wang, Y., Tao, J., Wang, L., 2008. HA coating on titanium with nanotubular anodized TiO2 intermediate layer via electrochemical deposition. Transaction of Nonferrous Metals Society of China 18, 631-635. [15] Shirkhanzade, M., 1998. Direct formation of nanophase hydroxyapatite on catholically polarized electrodes. Journal of Materials Science: Materials in Medicine 9, 67-72. [16] Zang, J.M., Lin, C.J., Feng, Z. D., Tian, Z.W., 1998. Mechanistic studies of electrodeposition for bioceramics of calcium phosphates by an in-situ pH microsensor technique. Journal of Analytical Chemistry 452, 235-240. [17] Zang, Q., Chen, J., Feng, J., Cao, Y., Deng, C., Zang, X., 2003. Dissolution and mineralization behaviours of HA coating. Biomaterials 24, 4741-4748. [18] Lakshmi, B. B., Patrissi, C. J., Martin, C. R., 1997. Sol-gel template synthesis of semiconductor oxide micro- and nanostructures. Chem Mater 9, 2544-2550. [19] Miao, Z., Xu, D., Ouyang, J., Guo, G., Zhao, X., Tang, Y., 2002. Electrochemically induced sol-gel preparation of single crystalline TiO2 nanowire. Nano Lett 2, 717-720. [20] Kar, A., Raja, K. S., Misra, M., 2006. Electrodeposition of hydroxyapatite onto nanotubular TiO2 for implant application. Surface and Coating Technology. 201, 3723-3731. [21] Roy, P., Berger, S., Schmuki, P., 2011. TiO2 nanotubes: synthesis and application. Angewandte Chemie 50, 2904-2939. [22] Chandrasekar, M.S., Pushpavanam, M., 2008. Pulse and pulse reverse plating –conceptual, advantages and application. Electrochimica Acta 53, 3313-3322. [23] Ban, S., Marino, S., 1998. Hydrothermal- electrochemical deposition of hydroxyapatite. Journal of biomed Mater. Res. 42, 387-395. [24] Brammer, K.S., Oh, S., Frandsen, C.J., Jin, S., 2011. Biomaterials and biotechnology schemes utilizing TiO2 nanotube arrays. Biomaterials Science and Engineering. http://www.intechopen.com/books/biomaterials-science-and-engineering/biomaterials-and-biotechnology-schemes-utilizing-tio2-nanotube-arrays

53
[25] Sobieszcyk, S., Klotzke, R., 2011. Nanotubular titanium oxide layers for enhancement of bone-implant bonding and bioactivity. Advances in Materials Science 11, 27-35. [26] Oh S-H., Finones R.R., Daraio C., Chen L-H., Jin S., Growth of nano-scale hydroxyapatite using chemically treated titanium oxide nanotubes. Biomateroals, 26, 2005, 4938-4943. [27] Xiao, X., Tian, T., Liu, R., She, H., 2007. Influence of titania nanotubes arrays on biomimetic deposition apatite on titanium by alkali treatment. Material Chemistry & Physics 106, 27-32. [28] Eliaz, N., Eliyahu, M., 2006. Electrochemical processes of nucleation and growth of hydroxyapatite on titanium supported by real-time electrochemical atomic force microscopy. Wiley Inter Science. [29] Saremi, M., Mottagi Golsahn, B., 2006. Electrodeposition of nano size hydroxyapatite coating on Ti alloys. Iranian Journal of Materials and Engineering 3, 3-9. [30] Davies, D., Whittaker, J. A., 1967. Methods of testing the adhesion of metal coatings. Metallurgical Reviews 112, 12-15. [31] Kuo, M.C., Yen, S.K., 2002. The process of electrochemical deposited hydroxyapatite coating on biomedical titanium at room temperature. Material Science and Engineering 20 ,153-160. [32] Robler, S., Sewing, A., Slolzer, M., Born, R., Schanweber, D., Dard, M., Worch, H., 2002. Electrochemically assisted deposition of thin calcium phosphate coating at near physiological pH and temperature. J Biomed Mater Res 64, 655-663. [33] Webster. T. J., Ergum. C., Doremus. R. H, Siegel. R.W., Bizios, R., 2000. Enhanced functions of osteoblasts on nanophase ceramics. Biomaterials 21, 1803-1810.