supplementary guidelines on performance assessment · pdf filesupplementary guidelines on...
TRANSCRIPT

SUPPLEMENTARY GUIDELINES ON
PERFORMANCE ASSESSMENT OF
PUBLIC WEATHER SERVICES
WMO/TD No. 1103PWS-7
W o r l d M e t e o r o l o g i c a l O r g a n i z a t i o n

SUPPLEMENTARY GUIDELINES ON
PERFORMANCE ASSESSMENT OF
PUBLIC WEATHER SERVICES
WMO/TD No. 1103PWS-7
W o r l d M e t e o r o l o g i c a l O r g a n i z a t i o n
Geneva, Switzerland
2002

The designations employed and the presentation of material in thispublication do not imply the expression of any opinion whatsoever onthe part of any of the participating agencies concerning the legal statusof any country, territory, city or area, or of its authorities, or concern-ing the delimitation of its frontiers or boundaries.
© 2002, World Meteorological Organization
WMO/TD No. 1103
NOTE
Lead author and coordinator of text: Joseph Shaykewich
(Contributions by: C.C.Chan, Robert Landis,
Wolfgang Kusch,Yung-Fong Hwang, Samuel Shongwe)
Edited by: Haleh Kootval
Cover: Josiane Bagès

Page
CHAPTER 1 – INTRODUCTION . . . . . . . . . . . . . . . . . . . . . . . . . . . . . . . . . . . . . . . . . . . . . . . . . . . . . . . . . . . . . . . . . . . . . 1
CHAPTER 2 – PERSPECTIVES ON THE PERFORMANCE ASSESSMENT PROCESS . . . . . . . . . . . . . . . . . . . . . . 2
2.1 As a Component of a Service Improvement Strategy . . . . . . . . . . . . . . . . . . . . . . . . . . . . . . . . . . . . . . . . . . . . . . . . . 22.2 As Part of a Quality Management System . . . . . . . . . . . . . . . . . . . . . . . . . . . . . . . . . . . . . . . . . . . . . . . . . . . . . . . . . . . 2
CHAPTER 3 - CLIENTS OF ASSESSMENT & REPORTING REQUIREMENTS . . . . . . . . . . . . . . . . . . . . . . . . . . . . 43.1 Operations . . . . . . . . . . . . . . . . . . . . . . . . . . . . . . . . . . . . . . . . . . . . . . . . . . . . . . . . . . . . . . . . . . . . . . . . . . . . . . . . . . . . . 43.2 Management . . . . . . . . . . . . . . . . . . . . . . . . . . . . . . . . . . . . . . . . . . . . . . . . . . . . . . . . . . . . . . . . . . . . . . . . . . . . . . . . . . . 43.3 Funding Agency . . . . . . . . . . . . . . . . . . . . . . . . . . . . . . . . . . . . . . . . . . . . . . . . . . . . . . . . . . . . . . . . . . . . . . . . . . . . . . . . . 43.4 Public . . . . . . . . . . . . . . . . . . . . . . . . . . . . . . . . . . . . . . . . . . . . . . . . . . . . . . . . . . . . . . . . . . . . . . . . . . . . . . . . . . . . . . . . . 4
CHAPTER 4 - THE ASSESSMENT PROCESS . . . . . . . . . . . . . . . . . . . . . . . . . . . . . . . . . . . . . . . . . . . . . . . . . . . . . . . . . . . 54.1 Assessment as a Continuous Process . . . . . . . . . . . . . . . . . . . . . . . . . . . . . . . . . . . . . . . . . . . . . . . . . . . . . . . . . . . . . . . 54.2 User-Based Assessment . . . . . . . . . . . . . . . . . . . . . . . . . . . . . . . . . . . . . . . . . . . . . . . . . . . . . . . . . . . . . . . . . . . . . . . . . . 54.3 Scientific Program Assessment . . . . . . . . . . . . . . . . . . . . . . . . . . . . . . . . . . . . . . . . . . . . . . . . . . . . . . . . . . . . . . . . . . . . 64.4 Assessment of End-user Requirements . . . . . . . . . . . . . . . . . . . . . . . . . . . . . . . . . . . . . . . . . . . . . . . . . . . . . . . . . . . . . 64.5 Assessment for the Development or Modification of a Program . . . . . . . . . . . . . . . . . . . . . . . . . . . . . . . . . . . . . . . . 74.6 Assessment of the Value of Weather Forecast Services . . . . . . . . . . . . . . . . . . . . . . . . . . . . . . . . . . . . . . . . . . . . . . . . 74.7 Assessment of the Performance of the Scientific Programs . . . . . . . . . . . . . . . . . . . . . . . . . . . . . . . . . . . . . . . . . . . . 9
4.7.1 For External Reporting . . . . . . . . . . . . . . . . . . . . . . . . . . . . . . . . . . . . . . . . . . . . . . . . . . . . . . . . . . . . . . . . . . . . . 94.7.2 In Support of Operations . . . . . . . . . . . . . . . . . . . . . . . . . . . . . . . . . . . . . . . . . . . . . . . . . . . . . . . . . . . . . . . . . . . 9
4.8 Assessments Associated with High Impact Events . . . . . . . . . . . . . . . . . . . . . . . . . . . . . . . . . . . . . . . . . . . . . . . . . . . . 94.8.1 Assessment of Weather Warning Performance . . . . . . . . . . . . . . . . . . . . . . . . . . . . . . . . . . . . . . . . . . . . . . . . . 104.8.2 Assessment of Disastrous Weather Events . . . . . . . . . . . . . . . . . . . . . . . . . . . . . . . . . . . . . . . . . . . . . . . . . . . . 10
4.9 Assessment of Automated Forecast Processes . . . . . . . . . . . . . . . . . . . . . . . . . . . . . . . . . . . . . . . . . . . . . . . . . . . . . . . 104.10 Approach to Product/Service Development and Assessment by Groupings of Countries . . . . . . . . . . . . . . . . . . 11
CHAPTER 5 - REPORTING ON ASSESSMENTS . . . . . . . . . . . . . . . . . . . . . . . . . . . . . . . . . . . . . . . . . . . . . . . . . . . . . . . . 12
REFERENCES . . . . . . . . . . . . . . . . . . . . . . . . . . . . . . . . . . . . . . . . . . . . . . . . . . . . . . . . . . . . . . . . . . . . . . . . . . . . . . . . . . . . . . . 13
APPENDICESA. Weather Forecast and You — Malaysia Survey . . . . . . . . . . . . . . . . . . . . . . . . . . . . . . . . . . . . . . . . . . . . . . . . . . . . . . . 14B. Hong Kong Observatory Survey . . . . . . . . . . . . . . . . . . . . . . . . . . . . . . . . . . . . . . . . . . . . . . . . . . . . . . . . . . . . . . . . . . . 15C. Environment Canada (MSC) National Meteorological Products and Services Survey - 2002 . . . . . . . . . . . . . . . 17D. References on the Economic Value of Meteorological Services . . . . . . . . . . . . . . . . . . . . . . . . . . . . . . . . . . . . . . . . . 38E. Canadian Automated Warning Performance Measurement System . . . . . . . . . . . . . . . . . . . . . . . . . . . . . . . . . . . . . 39F. Canadian Automated Routine Public Forecast Performance Measurement System . . . . . . . . . . . . . . . . . . . . . . . . 40G. Performance at Varying Levels of Accuracy . . . . . . . . . . . . . . . . . . . . . . . . . . . . . . . . . . . . . . . . . . . . . . . . . . . . . . . . . 41H. Renewal of the North American Wind Chill Program . . . . . . . . . . . . . . . . . . . . . . . . . . . . . . . . . . . . . . . . . . . . . . . . 42I. The Met Office “Added Value Chain” . . . . . . . . . . . . . . . . . . . . . . . . . . . . . . . . . . . . . . . . . . . . . . . . . . . . . . . . . . . . . . . 43J. Automated “Scribe” vs. Forecaster Accuracy . . . . . . . . . . . . . . . . . . . . . . . . . . . . . . . . . . . . . . . . . . . . . . . . . . . . . . . . . 44K. From the Annual Report of the New Zealand MetService . . . . . . . . . . . . . . . . . . . . . . . . . . . . . . . . . . . . . . . . . . . . . 45L. Ft. Smith and Van Buren, Arkansas, Tornado of April 21, 1996 Natural Disaster Survey Report – Executive
Summary and Table of Contents-NWS-NOAA-USA . . . . . . . . . . . . . . . . . . . . . . . . . . . . . . . . . . . . . . . . . . . . . . . . . 46M. Severe Weather Event Data Definition . . . . . . . . . . . . . . . . . . . . . . . . . . . . . . . . . . . . . . . . . . . . . . . . . . . . . . . . . . . . . . 49
CONTENTS

The importance and necessity to carry out ongoingperformance assessment of public weather services to ensurethat they effectively and efficiently meet the needs of thepublic, have been well recognized. As part of the mandate ofthe Public Weather Services (PWS) Programme to assistMembers with the development and improvement of theirnational public weather services programmes, the PWSExpert Team on Product Development and Verification andService Evaluation developed a set of guidelines on technicaland user-oriented verification mechanisms includingmeasures of overall satisfaction with the service. Thoseguidelines which were published in 2000 as a WMO TechnicalDocument (WMO/TD No.1023) brought into focus thesubjective nature of user-based assessments as well as the keypurposes and techniques to carry out such assessments.
The PWS Expert Team on Product Development andService Assessment that was established by the Commissionon Basic Systems (CBS) as the successor to the above expertteam, was given the task to develop further guidance
material, including relevant case studies and quantitativeinformation, to assist NMSs in developing their skills in theplanning and implementation of effective service assessmentprocedures to monitor user satisfaction and act on thefindings.
The purpose of this Technical Document which isintended as a supplement to WMO/TD No. 1023, is toprovide further elaboration of the concepts portrayed inWMO/TD No. 1023 and to re-enforce understandingthrough the provision of practical examples and modelsemployed by various NMSs. Issues pertaining to some of thelimitations of performance assessments are also discussed.Additionally, issues that require further investigation arehighlighted. One broad area where further assessment focusis desirable is that of delivery of services as opposed toproduction of services. It is expected that future supple-ments will become available that will further explore avenuesof assessment, provide best practice examples and elaborateor update those presented here.
Chapter 1
INTRODUCTION

2.1 AS A COMPONENT OF A SERVICEIMPROVEMENT STRATEGY
The public basically has certain requirements concerning theservices that it receives from the NMS. These are efficientdelivery systems, more convenient and seamless access toservices and higher levels of quality and performance inservice delivery.An NMS’s service improvement strategy canbe seen to consist of the adoption of a comprehensive contin-uous improvement planning and implementation approachto service improvement and client satisfaction; the establish-ment of documented baseline measures for client satisfactionfor key services; preparation and implementation of annualservice improvement plans based on client priorities forservice improvement; establishment of a minimumimprovement target over a fixed multiyear period for each keyservice; adoption and publication of core service standardsfor each service channel; incorporation of a results-basedservice improvement accountability for managers as part ofexisting performance management systems; and reportingwithin the existing annual planning and reporting processeson service standards and performance against them and onannual improvements in client satisfaction including progressagainst the multiyear target. Delivery on the elements of theservice improvement strategy would serve to improve theaccountability and transparency of the NMS to the public.
2.2 AS PART OF A QUALITY MANAGEMENTSYSTEM
The ultimate objective of a National Meteorological Service(NMS) is customers’ satisfaction through having their needsmet. First identifying the needs and expectations of thecustomers and converting these into requirements for theNMSs’ products and services achieve that objective. Thecustomer encompasses the range from the individual citizento a nation’s political leadership.These requirements all repre-sent objectives that the NMS intends to achieve whether it iscost, delivery or the specification it will supply. Processmanagement then encourages the NMS to achieve theseoutput objectives by controlling the inputs to its process. Thismeans controlling the material and information it uses, thetraining it gives its employees and the procedures it follows.These process inputs will in turn have their performanceobjectives.
ISO 9000:2000 is driven by measurable objectives andprovides a useful hierarchy: Strategic; Functional;Operational; and Individual.The ‘Strategic’objectives addressissues such as position in the marketplace, organizationalimprovement goals and performance and delivery policies.The ‘Functional’objectives reference the measurable objectives
of each function and consistency with policies. The‘Operational’objectives relate to the requirements and objec-tives of the individual products and services. Finally, the‘Individual’ objectives capture how personnel contribute tothe achievement of objectives. The time bounds of theserange from longer term (years) for strategic to the muchshorter term (days, weeks) for individuals. The timings willvary depending on how tactically or strategically the organi-zation behaves.
ISO 9000:2000 asks the questions: Is there an objective?Is it being measured? And finally and very importantly, isthere action on the shortfall? So, which are the aspects of thequality system that should be measured and for which objec-tives should be set? The determination of the detailedcustomer requirements is paramount. That is, what is itexactly that the customer wants in terms of product, cost,delivery and supporting information. The measurement ofthe achievement of these key customer objectives must bedone always, as they are the key drivers of the organization.
With these customer objectives clearly specified theNMS can then set objectives inside the organization aimed atsupporting the ‘customer satisfaction’objectives. Each step indelivering on the NMS’s promise to the customer needs to beidentified such as through process mapping. From theprocess map is built the quality plan that captures theprimary objectives for each of the business processes (e.g.:forecast quality, delivery effectiveness, etc.). The primaryobjectives include those for outputs, inputs, resources etc. Ofcourse everything cannot be measured on the process map,rather the risks associated with each process need to beassessed and the focus narrowed to those items whereimprovement can be gained from measuring.This risk assess-ment involves the evaluation of the strengths and weaknessesof the various features of each process. Every process isthereby evaluated and by applying the Pareto principle thoseprocesses requiring specific attention can be identified.
Next, for each of this reduced number of processesrequiring more careful attention the need is to measure thoseparameters which are poor and have the greatest impact onthe process; two or three parameters on each weak process,ideally the focus could be on one key parameter. A period ofoperation and observation may be required for this determi-nation. For these selected parameters we need to set goals orobjectives that are specific, challenging, measurable, agreed,realistic and time bound. Any corrective action requires theexpenditure of scarce resources for which there are compet-ing rivalries. The theory of governing dynamics wouldsuggest judicious selection amongst these rivalries affordingmutual gains through the employment of best response func-tions leading to an optimal total organizational benefit.
The above walk through illustrates some of the compo-nents of a process-based quality management system. Such a
Chapter 2
PERSPECTIVES ON THE PERFORMANCE
ASSESSMENT PROCESS

3Supplementary Guidelines on Performance Assessment of Public Weather Services
system requires the exercise of management responsibility forthe establishment of a quality policy and the setting ofmeasurable quality objectives with a strong customer focus.The management of the human and infrastructure resourcesincluding the work environment is a critical aspect of a qual-ity management system. Product design, realization anddocumentation are built around customer communication.
Finally, monitoring, measuring and analyzing customersatisfaction, internal processes and product quality allowsfor the control of non-conformities through corrective andpreventative actions. A process-based quality managementsystem supports the development of clearly defined stan-dards of performance and responsibilities. With the strongclient focus these standards are in a constant state of evolu-tion as requirements evolve. The improved information tomanagement results in higher overall efficiency and
enhanced overall service levels. None of this comes withoutcosts in terms of time and resources, especially up front, butthese would normally be recouped later in the process. Somegood examples of the implementation of the QualityManagement System are emerging amongst NMS’s. Twoexample references of this are found in CAeM-XII/Doc. 7(4)“The Implementation of the Quality Management System by the UK Met Office” and in CAeM-XII/Doc. 7(5)“Implementation of the quality assurance system at Météo-France”.
These documents can be found on: http://www.wmo.ch/web/aom/amprog/documents/Caem-XII-2002/Docplan.htm.
There are many references on ISO 9000:2000 of which agood starting point is http://www.iso.ch/iso/en/iso9000-14000/index.html.
There is a broad dimension of needs that are satisfied throughperformance assessment activity. The managers of opera-tional processes require the assessment information tomanage the operations under their charge. At this level thereis need to provide forecasters with information on where theyadd significant value, in order for them to concentrate theirefforts on these cases or parameters. The managers of broadprogram areas require comparative information about theprocesses over which they have responsibility. Thus anotherobjective is to provide statistical information on the perfor-mance of the public forecast program to regional andnational managers who administrate the program. Fundingagencies want performance information on the programsbeing funded. Finally, the customer, should it be the generalpublic or a specific paying client, requires assurance that theproduct or service provided meets certain quality standards.
3.1 OPERATIONS
The ‘Operational’ objectives of an operational managerwithin an NMS relate to the requirements and objectives ofthe individual products and services: performance assess-ment of how well these are satisfied is necessary. The‘Individual’ objectives of the staff of an NMS capture howpersonnel contribute to the achievement of objectives. Byoperations is meant those activities ranging from all forms ofmeteorological data acquisition to data and forecast produc-tion and to actual service delivery. These all representelements of the process map with each of these processelements having objectives and features to be assessed.Certain key parameters of a process are assessed for theirimpact on that process or for their use as longer-term indi-cators of the quality dimensions of the process. The efficiencyand effectiveness of the individual processes are monitored,and corrective or preventative actions are taken based on theinformation provided. It is at this level that primary customerrequirements are reflected in the product or service.
3.2 MANAGEMENT
The ‘Functional’ objectives of an NMS reference the measur-able objectives of each function and consistency with policies.The management of an NMS requires assessment informa-tion to monitor the health and effectiveness with which thesefunctions are executed and their consistency with the strategicpolicy objectives. It is one thing to provide public weatherservices that meet user needs – and quite another to do it effec-tively and efficiently, from an overall point of view. Thepurpose here is not about what is delivered but rather how.The what is delivered is a policy decision undertaken at seniorgovernment levels although NMS management can recom-mend on this and influence the decision.At the management
level it is the organization, management and planning of theoverall public weather services system that delivers the servicesthat is of concern. A performance assessment program cangather information that can be used to make decisions aboutthe future delivery of services, staffing, training, research anddevelopment, and about the best mix of information fromcomputer models and human value adding.
3.3 FUNDING AGENCY
The ‘Strategic’ objectives of an NMS address issues such asposition in the marketplace for meteorological services, orga-nizational improvement goals and performance and deliverypolicies. These need to fit within the policy mandate given tothe NMS by the political decision-makers. Information onperformance can be incredibly useful for gaining the supportof stakeholders, including government ministers responsiblefor the NMS.The NMS will be in a much stronger position forsustaining and building funding if it can demonstrate suchthings as its level of performance, public satisfaction with itsservices,and the impacts of previous investment and researchand development program.
3.4 PUBLIC
There are a wide variety of end-users of public weatherservices. These include individual members of the generalpublic,emergency management agencies,and perhaps payingcustomers for specialized services.As stated in section 2.1, theneeds and priorities that these end-users have for improvingmeteorological service delivery can be summarized as therequirement for easier,more convenient and seamless access toservices and the requirement for higher levels of quality andperformance in service delivery. The dimensions of publicaccess alone represent a separate huge study area for perfor-mance assessment. The dimensions of quality andperformance encompasse,amongst other things,what weatherelements are most important, when and how forecasts shouldbe delivered, in what format,and with what accuracy.Knowingwhat the needs are the focus can be narrowed to those itemswhere improvement can be gained from measuring.Of course,the NMS’s policy mandate as reflected in the ‘Strategic’ objec-tives (position in the marketplace for meteorological services,organizational improvement goals and performance and deliv-ery policies) needs to be accommodated,as do the measurableobjectives of each function, the ‘Operational’objectives of theindividual products and services and the ‘Individual’ objec-tives of the staff of an NMS.
An assessment program can assist in two ways – by find-ing out what the public perceptions are, and by gathering andpublicizing facts about performance to improve the publicperception and credibility of the services.
Chapter 3
CLIENTS OF ASSESSMENT AND REPORTING REQUIREMENTS
The two major components of an assessment program areproduct verification and user-based assessment. The amountof effort spent on each will depend on the NMS, the natureof the services, and the user community.
The overall purpose of verification of forecasts is to ensurethat products such as warnings and forecasts are accurate,skil-ful and reliable from a technical point of view. As far aspossible, forecast verifications are produced in an objectivefashion, free of human interpretation. The results tend to benumbers and statistics, which can be manipulated and inter-preted using statistical theory. There is no guarantee thatverification results will match people’s perceptions of howgood the forecasts are. On the other hand, user-based assess-ment should give a true reflection of the user perception ofproducts and services provided by the NMS, as well as quali-tative information on desired products and services.This typeof assessment contains almost completely subjective infor-mation, subject to human perception and interpretation.
In carrying out an assessment program combining bothcomponents, there are some commonalities. Although veri-fications may typically provide objective numbers, theyshould still be based around numbers that are relevant tousers. It should be possible to match user-based assessmentresults (e.g., of perceptions of forecast accuracy) with corre-sponding technical verification results, and seek commontrends and patterns. Various types of scores and assessmentmethods have their particular uses.
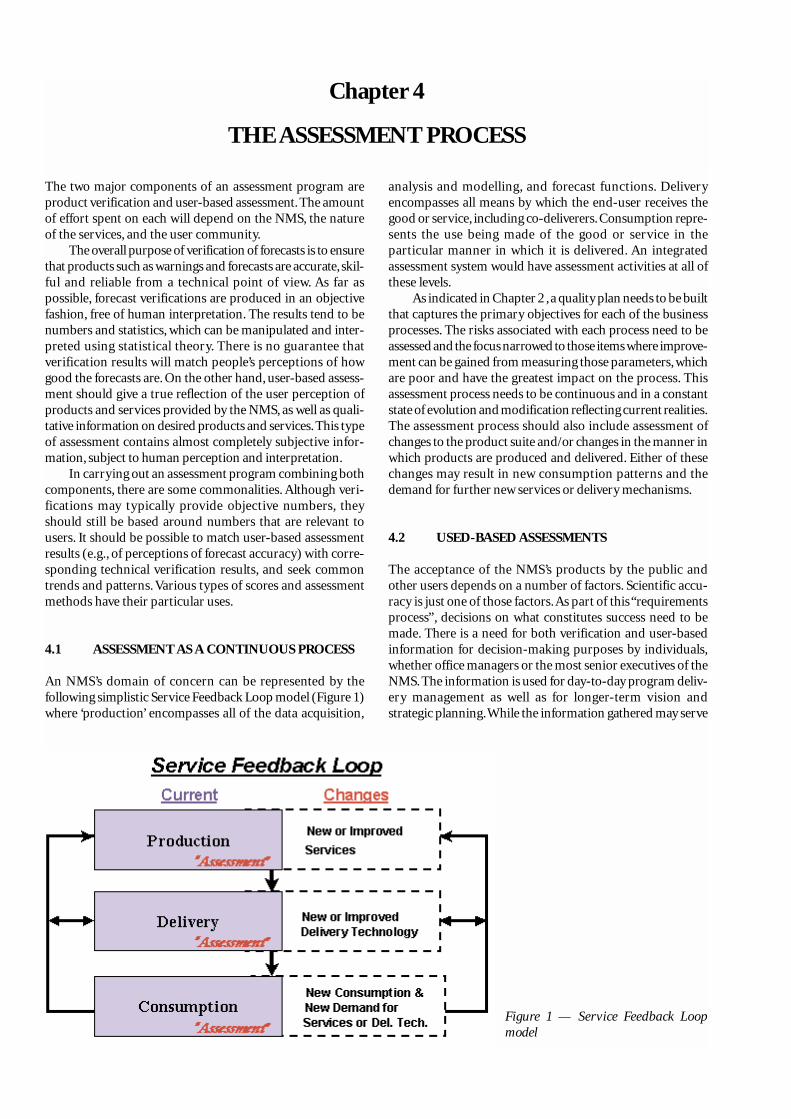
4.1 ASSESSMENT AS A CONTINUOUS PROCESS
An NMS’s domain of concern can be represented by thefollowing simplistic Service Feedback Loop model (Figure 1)where ‘production’ encompasses all of the data acquisition,
analysis and modelling, and forecast functions. Deliveryencompasses all means by which the end-user receives thegood or service, including co-deliverers. Consumption repre-sents the use being made of the good or service in theparticular manner in which it is delivered. An integratedassessment system would have assessment activities at all ofthese levels.
As indicated in Chapter 2 ,a quality plan needs to be builtthat captures the primary objectives for each of the businessprocesses. The risks associated with each process need to beassessed and the focus narrowed to those items where improve-ment can be gained from measuring those parameters, whichare poor and have the greatest impact on the process. Thisassessment process needs to be continuous and in a constantstate of evolution and modification reflecting current realities.The assessment process should also include assessment ofchanges to the product suite and/or changes in the manner inwhich products are produced and delivered. Either of thesechanges may result in new consumption patterns and thedemand for further new services or delivery mechanisms.
4.2 USED-BASED ASSESSMENTS
The acceptance of the NMS’s products by the public andother users depends on a number of factors. Scientific accu-racy is just one of those factors.As part of this “requirementsprocess”, decisions on what constitutes success need to bemade. There is a need for both verification and user-basedinformation for decision-making purposes by individuals,whether office managers or the most senior executives of theNMS. The information is used for day-to-day program deliv-ery management as well as for longer-term vision andstrategic planning.While the information gathered may serve
Chapter 4
THE ASSESSMENT PROCESS
Figure 1 — Service Feedback Loopmodel

the objectives at a variety of levels within an organization,often the methodology chosen must be specific to the objec-tives at the organizational level.
User-based assessment is about measuring perceptionson a matrix of dimensions important to specific usercommunities and amongst a diversity of user communities.These perceptions include those about requirements in termsof accessibility, availability, accuracy, timeliness, utility,comprehension, language, sufficiency, and packaging. Theuser communities range from the individual citizen using theproducts to make personal decisions, to the mediaorganizations essential for the communication of theproduct, to government agencies funding the production anddelivery of those products. The health of the NMS dependson the requirements perceptions from the full spectrum ofthese users. User-based assessments are focused around theability to obtain information on specific characteristics ofinterest through a variety of direct methods such as surveys,focus groups, public opinion monitoring, feedback andresponse mechanisms, consultations such as users meetingsand workshops, and the collection of anecdotal information.On their own, each of these methods may produceinformation which is subjective and of questionablereliability. However, taken as a whole, a consistent pictureoften emerges which is credible. These methods are the onlyeffective means by which information can be gathered onneeds, expectations, satisfaction, etc. More recently, they havealso been demonstrated as effective means for getting at theeconomic value of weather information and forecasts.
In developing the user-based assessment schedule theareas of research are selected on the basis of program need,risk management, and commitments in business plans,management frameworks, and performance frameworks. Insuch a multi-year strategy to user-based assessment it isimportant to cover both product lines and delivery mecha-nisms and to use consistent questions over the years forproper trend-line analysis. Performance measurement, afterall, is about the change over time as opposed to the measure-ment of the state of affairs at a give point in time.AppendicesA and B are examples of annual monitoring surveys admin-istered by the Malaysian Meteorological Service and theHong Kong Observatory respectively from which trends canbe determined.
In most cases survey objectives call for the measurementof many characteristics.A comprehensive survey may includesets of questions on the general use of weather information,weather warnings, regular forecasts, air quality information,weather information delivery,demographics,etc.Within thesesections of a multi-purpose survey further breakdowns canoccur such as under the general topic of weather forecast oron a per season basis, one can investigate perceptions of whatis considered accurate for temperature, wind direction/speed,onset of precipitation, probability of precipitation, sky coverconditions (sunny, cloudy, etc.).
These surveys are usually quite long and demand fairlylarge sample sizes to facilitate geo-politically-based infer-ences. To accommodate the measurement of several itemswithin one survey plan, it is likely necessary to make compro-mises in many areas of the survey design. The survey designmust be made to properly balance statistical efficiency, time,
cost, and other operational constraints. As such, these base-line surveys tend to be rather costly; therefore they are usuallyundertaken once every four or five years. In order to makeproper inferences on trends, consistency in the design andquestions from one baseline survey to the next is necessary.
An example of such a baseline survey, the Canadian 2002Decima Research Inc. Survey, is given in Appendix C. Thissurvey is a follow-up to the 1997 baseline Canadian GoldfarbSurvey (see WMO/TD 1023). In Appendix C the changesmade to the previous survey are identified to illustrate notonly the degree of consistency between the two surveys butalso the natural evolution of the user-based informationrequirements of a healthy public weather services program.
4.3 SCIENTIFIC PROGRAM ASSESSMENT
The overall purpose of verification is to ensure that productssuch as warnings and forecasts are accurate, skilful andreliable from a technical point of view. The accuracy of aforecast is some measure of how close to the actual weatherthe forecast was. The skill of a forecast is taken against somebenchmark forecast, usually by comparing the accuracy ofthe issued forecast with the accuracy of the benchmark.Reliability means the extent to which the forecast can be“trusted”on average. One measure of reliability would be theaverage bias in a maximum temperature forecast – theaverage of the forecast values minus the average of theobserved values. These concepts are treated in depth inWMO/TD 1023. The decisions on what scores are to becalculated and the rigor built into the process of calculation(variety of scores, infrastructure, automation, etc.) are afunction of performance information requirements ofoperations, management, funding agencies and the public.These requirements are elicited through the user-basedassessment process.
4.4 ASSESSMENT OF END-USERREQUIREMENTS
The determination of the detailed customer requirements;what exactly the customer wants in terms of product, cost,delivery and supporting information, and the measurementof the achievement of these key customer objectives mustalways be undertaken as a first step, as they are the key driversof the organization. First identifying the needs and expecta-tions of the customers and then converting these intorequirements for the NMS’s products and services achievethe ultimate objective of customer satisfaction.These require-ments all represent objectives that the NMS intends to achievein terms of costs, delivery and the specification of thesupplied products and services.
In order to make sure that requirements of the widevariety of end-users of public weather services are being met,first of all it is necessary to know what they are and a key todetermine that is by asking the users. The definition of theneeds in the particular case of weather forecasts canencompass what weather elements are most important, whenand how forecasts should be delivered, in what format, and
Chapter 4 — The Assessment Process6

with what accuracy. Knowing what the needs are, it isnecessary to find out whether they are being met, and takeactions to improve where possible. Part of the userrequirement is how the product is delivered, and when. Thismay be as simple as checking and then changing the issuetime of forecasts to make sure that they are available whenthey are most useful. It can also involve keeping score on howmany forecasts are issued late, and changing managementpractices and schedules to ensure that forecasts are issued ontime. Even if public weather services have been designed anddelivered to meet user needs, there may be a perceptionproblem over how good they are. Similar methods need to beused to check with the users on what capabilities they have foraccessing and receiving products, and then to improve thedelivery system to better meet those needs. In part, the surveydocuments included as Appendices A, B and C have as theirpurpose the determination of such requirements. Often,focus groups and other forms of interactions with clientsassist in the process of fine-tuning the requirementsdefinition.
4.5 ASSESSMENT FOR THE DEVELOPMENT ORMODIFICATION OF A PROGRAM
While the public forecast product suite may have the appear-ance of little or no change, the public weather servicesprogram of any NMS is, in fact, in a constant state of evolu-tion. To the traditional elements of temperature, wind, cloudsand weather many NMSs have, fairly recently, added otherparameters such as probability of precipitation and, on aseasonal basis, the UV Index. In many NMSs thermal indicesare currently reviewed and some programs modified as aresult. For example, in Canada and the USA changes to thewind chill programs have been made and the forecasting andwarning program for extreme high temperatures is currentlybeing reviewed. Also, many NMSs are currently examiningthe possible incorporation of health-based air quality indices.Additionally, technological advances have presented newopportunities in the area of delivery of public weatherservices products to the public, thus creating new opportu-nities and challenges with respect to the format andpresentation of such information.
Finally, science, including numerical modelling, hasadvanced permitting efficiencies in the production andautomation of products themselves.As illustrated in Figure 1with any such changes the implementation of an integrateduser-based assessment and verification program is desirablefor their successful implementation and effective on-goingoperation.Appendix H illustrates the detailed process under-taken for the renewal of the Wind Chill Program for NorthAmerica.
4.6 ASSESSMENT OF THE VALUE OF WEATHERFORECAST SERVICES
Information on weather and climate conditions provided byNMSs is of significant social benefit to their respective coun-tries. Although it is widely assumed that the benefits of an
NMS far exceed the costs of the services provided, there isoften little reliable economic data supporting this. Whileproviding their current services and planning new services byimplementing new technologies, NMSs are increasinglyrequired to justify that their expenditures meet fundamentaleconomic requirements using some benefit-cost framework.In order to determine the optimal provision of these services,NMSs require information on not only the value of theircurrent services, but also how the change in the mix ofservices,or in the characteristics of those services,will changethe marginal benefits of services to the marginal costs.However, since the provision of services is most oftenfinanced through general tax revenues with no fees chargedfor access to the forecasts, the value of services is not revealedin the marketplace.
It should be noted that the application of resources toimprove forecasts as determined by some technical measureof forecast accuracy, only represents the potential forincreased value. There is no direct relationship between tech-nical measures of forecast quality and households’ values forforecasts. To elicit reliable and economically valid householdvalues for improved or current weather services, the processesof production (current and new forecast services), delivery(current distribution systems and new innovative deliverytechnologies) and consumption (current consumption andnew consumption patterns demand for new services andproduct delivery technologies) must be considered includingthe feedback loop from “consumption” to “production”. Thevalue of weather information relates to how individuals oreconomic entities can or will react to information or changesin information available when they face risk and uncertaintyof future weather outcomes.
Microeconomic theory indicates that private and publicproducers should produce goods and services that will satisfya demand. Meeting the level of demand requires producers touse available input resources to produce the particular goodof greatest value relative to their other uses. Inputs are scarceand have opportunity costs such that any resources used toproduce a particular good, limit the next best use of thoseresources for producing other goods or services. In deter-mining the optimal expenditure of input resources on aparticular good or service it is useful first to determinewhether the good is either a private good or public good.
A private good is one that has characteristics of beingrival in consumption and excludable.Rivalry in consumptionmeans that if a person consumes a unit of the good, theneither the quantity or quality of the remaining good hasdiminished for anyone else to consume. Excludability inconsumption means that if a person consumes a unit of thegood, or has rights to consume it, then they can exclude otherpeople from consuming it. The value of private good isrevealed explicitly by the market price for it.
Public goods have the characteristics of being non-rivalin consumption and non-excludable meaning that as some-one consumes a public good, the quantity or quality of thegood is unaffected, and the same quantity and quality remainfor other consumers. An example of a public good is a radiobroadcast. Any one person listening to the broadcast cannotdiminish the quality of the signal for other people (non-rivalin consumption) nor can the consumer exclude others from
7Supplementary Guidelines on Performance Assessment of Public Weather Services

listening to it elsewhere (non-excludable). The characteristicsof non-rivalry and non-excludability on consumption meanthat private markets will not form since they will be unable tocapture profits from the benefits they produce. The economicvaluation problem associated with a public good is that itsconsumers do not have the incentive to reveal their true pref-erences meaning that one must find another way of valuingit in order to determine its level of provision.
Most goods embody both characteristics of rivalry andexcludability and thus are private as well as public. Suchmixed goods, commanding mixed markets, may be non-rival, but exclusive, or non-exclusive, but rival. The publicand private good characteristics cannot be separated withoutan increased cost, or decreased benefit to society. If providedby a private market, there will need to be subsidies and/orregulations to ensure that the optimal level of supply isprovided. On the other hand, a public provider should chargeuser fees for the private benefits from the service in order tocover the costs of these additional services, and thereforeprovide the optimal level of the mixed good. Thedetermination of the appropriate user fees requires thevaluation the private benefits, or at least the ratio of privateversus public benefits. Like pure public goods, mixed goodsrequire non-market valuation techniques to value them.
Weather information services differ from many types ofother public goods because different users benefit differentlyfrom specific dissemination packages employed. The natureof weather information itself is a public good that has bothnon-rival and non-excludable characteristics. However,depending upon the type of dissemination mediumemployed, the information can have both public and privatecharacteristics in combination. Public good is exemplified bythe provision of public safety information over the airwavesto mitigate the costs of natural disasters. Specific componentsof data, systematically and carefully organized, packaged andsold to private firms for distribution, via the market, toagricultural and other industries that operate in privatemarkets are examples of private goods.To justify, in economicterms, the provision of the meteorological services, it iscrucial to determine the aggregate benefits of these servicesas reflected in the true preferences by the users. Non-marketvaluation techniques are required to determine the benefitsthese services provide to society. It is difficult to determine theeconomic value of changes in the services provided as a resultof an NMS’s programs to improve weather forecasting and yetthis is exactly what is required in a benefit-cost analysis.
It is possible to view non-market valuation of weatherinformation services in a variety of perspectives. Two basicapproaches that economists use are revealed preferencemethods and stated preference methods. Revealed preferencemethods use actual behaviour and market transactions toreveal implicitly values of a non-market good. Statedpreference methods use surveys to sample the statedpreference that can be directly or indirectly used to determinethe willingness-to-pay for a good or service. An alternativecategorization of these methodologies of valuation isProduction-based and Demand-based. Production-basedapproaches indirectly impute a value as an input to aproductive process based on what end-users of the finalproduct are willing to pay for it. Production-based methods
rely on the modelling of the processes in which theinformation is used as an input to the production of aconsumer product. The final product is ultimately valued inthe marketplace and the value of the weather information, asan input, is extrapolated from the final value. Thus thebenefits of the information input as the contribution to themarket value of the final product is indirectly inferred.Aggregation of such values covering all possible applicationsto achieve a net value for the information service is notpossible as it is not feasible to model all those possibleapplications.
On the other hand, a Demand-based approach infers thevalue of the productive input directly according to thedemand for that input as expressed as the primary users’willingness to pay for it. Demand methods model therelationship between willingness to pay for a service and thebenefits generated by that service in aggregate over the rangeof all users. That is, users are provided with a means ofrevealing how much they would be willing to pay for theservice if they had to do so. Revealed preference methodsdirectly measure individual willingness to pay, and can easilydifferentiate between significant differences in willingness topay among user groups, provided the sample of each is largeenough.The individual willingness to pay for each user groupcan then be aggregated over the populations of users in eachgroup that further can be summed to get the total value of theproposed change in the provision of the specific type ofweather-information dissemination service throughoutsociety.
Two main stated preference or demand based methodsthat are most often employed are Contingent Valuation andConjoint Analysis. These methods use a hypothetical contextin a survey format, but questions are designed as choicesbetween, or rankings of preferences for, alternatives thatinclude differences in goods and services as well as costs. Thepreferred alternatives reveal information on the perceivedvalue for the goods or services. Such direct approaches usesurveys to elicit individuals’ willingness-to-pay for a non-market good or service, or willingness-to-acceptcompensation for losing the good or service. The contingentvaluation method relies on survey techniques andhypothetical situations to directly elicit peoples’ willingnessto pay, or willingness to accept compensation, forhypothetical changes in the quality and/or quantity of a non-market good, contingent on the nature of the hypotheticalmarket. Conjoint Analysis, specifically attribute-based choiceanalysis, elicits value estimates of each attribute of a good orservice by asking respondents to choose a preferredalternative from a set of experimentally designed alternatives.While contingent valuation approaches tend to overlook theinfluence of substitutes on respondents’ decisions, a choice-based approach provides these substitutes as alternativeswhere discrete choices must be made. The empiricalapplication of conjoint analysis to public weather forecastsallows the researcher to derive the value that consumersderive from the various attributes of weather forecasts.
Appendix D provides a partial list of references oneconomic valuation of weather services that elaborate on thetheoretical basis and actual application of non-market valu-ation techniques.
Chapter 4 — The Assessment Process8

4.7 ASSESSMENT OF THE PERFORMANCE OFTHE SCIENTIFIC PROGRAMS
Performance assessments of the routine public forecastelements are the main focus of this section. Theseassessments are treated from both the qualitative andquantitative perspectives. Qualitative assessments here areinterpreted as user-based assessments that include the use ofsurveys, focus groups, and consultations, among others.Quantitative assessments mean scientific verification such asaccuracy measures, lead-time measures, etc. Frequently,significant program components are the subject ofassessments that have both qualitative and quantitativedimensions.
Many NMSs provide statistics on the performance oftheir numerical weather prediction models and routinelythese statistics are assembled for international comparisonpurposes. Frequently these statistics are communicated tofunding agencies to demonstrate positive results for thetaxpayer’s investment. This activity is necessary to ensure notonly healthy competition amongst NMSs, but also moreimportantly to monitor progress in the science of numericalweather prediction.Relative comparison of NWP advances inaccuracy to the accuracy of end-user products is importantfrom the perspective of identifying where the emphasis innumerical weather prediction research should be placedrelative to the accuracy needs of the end-user. Forecasts ofprecipitation timing and of amounts is a particular area thathas been identified in several countries as a deficiency.
Many of the techniques described here can also beapplied to seasonal and inter-annual forecasts. Longer-termforecasts such as decadal climate projections are made moredifficult by the need for a valid scientific dataset forverification and adequate understanding for any qualitativeassessment.
4.7.1 For External Reporting
For external reporting purposes sometimes the fundingagency may insist on an assessment process that isindependent of forecast operations.At times, formal audits ofthe assessment function are required or at least desirable.User-based assessments that involve surveys or focus groupsare usually carried out by private sector firms contracted forsuch purposes. Usually, in government sectors, publicopinion research results, while paid for by the individualNMSs, are in the public domain, that is, they are easilyaccessible by the public and interest groups. The need tomaintain a reputation of integrity on the part of the privatesector firms involved in this business is a force driving thecredibility of the results of their endeavours. Scientificverification presents a challenge in transparency in thisregard. One way of attempting to achieve a reputation ofcredibility is through the separation of the verificationfunction from the forecast operations function. There can beranges of variation in the degree of such separation.
Figure E1 ‘A System Independent from ForecastOperations’ in Appendix E ‘Canadian Automated WarningPerformance Measurement System’is an example of a KPMG
audited system that is completely independent from forecastoperations. But even in such cases the drive for efficiencies inan increasingly scarce resource situation may mean sharingof centralized databases, decoding software, etc. withoperational activities that may threaten the credibility thatseparation brings. Done right, and perhaps with audits ofshared aspects, the credibility can be maintained.
4.7.2 In Support of Operations
The undertaking of performance assessments in support ofoperations is important for a number of reasons.As indicatedin Chapter 5, the information is used internally formanagement, staff and program development purposes.User-based assessments provide valuable input on levels ofsatisfaction and utility of the variety of services an NMSprovides and, importantly, provide information on whereefforts to improve should be focused.
A performance assessment program can gather infor-mation that can be used to make strategic decisions aboutthe future delivery of services, staffing, training, researchand development, and about the best mix of informationfrom computer models and human value adding. ManyNMSs maintain verification regimes for their NWP activi-ties and some of this information is exchangedinternationally. Such information also provides guidanceon where research and development efforts are to befocused. The most important verification effort, neverthe-less, needs to be focused on the public forecast productsthat actually go out to clients who use them. Certainly, thedelivery system involved has a significant impact on theeffectiveness of the service provided and as such should bepart of the assessment process. The actual public forecastproduction factors in critically here. For this a verificationsystem that supports forecast production operations isneeded. Figure F1 ‘A System Integrated with ForecastOperations’ in Appendix F ‘Canadian Automated RoutinePublic Forecast Performance Measurement System’ is anexample of a system designed for near real-time feedbackto forecast operations.
4.8 ASSESSMENTS ASSOCIATED WITH HIGHIMPACT EVENTS
The NMS’s weather warning program is designed to alert thepublic of weather events with potential high impact in termsof safety of life and security of property. Performanceassessment of this program is critical to the credibility of anNMS. The assessment of a warning program has manydimensions. Firstly the assessment of the communicationaspects of the warning program is critical. In addition, theeffectiveness of the delivery system needs to be assessedthrough user-based assessment techniques and the operationof the systems requires monitoring and analysis. Equallyimportant to the scientific assessment, is the message that isbeing communicated.Here, the appropriateness of the formatand terminology used can be addressed through user-basedtechniques.
9Supplementary Guidelines on Performance Assessment of Public Weather Services

4.8.1 Assessment of Weather Warning Performance
In the case of severe weather warnings, scientific verifica-tion includes, amongst other parameters, lead-time,severity, aerial coverage, occurrence of severe weatherelements and even the correct phase of precipitation. Forprecipitation events such as heavy snowfall agreeing on thedefinition of the time of start of an event that may startwith light flurries adds to the complexity. The accuracy ofthe aerial coverage of a warning adds further significantcomplexity. An NMS’s hourly observation network iswoefully inadequate for assessing the accuracy of warningsof convective developments and localized events such asoff-lake events. Radar systems can provide some surrogateinformation but these systems are expensive so networksare rarely adequate and the results subject to interpreta-tion. Often, for verification purposes one must rely onsubjective information from the public located at or nearthe event. In less densely populated areas often there is noone there to provide even such evidence but that does notmean that the event did not happen. Nevertheless, thecollection of such data provided by the public is importantfor verification purposes and requires some rigor built intothe process to enable coding for data analysis. Appendix M‘Severe Weather Event Data Definition’ represents anattempt at such rigor.
4.8.2 Assessment of Disastrous Weather Events
In many countries major disastrous weather events are thesubject of special studies. Frequently, independent expertsare engaged for this purpose and sometimes, a nationalcommission is employed for a full impact and public safetysystems assessment. Post-event reviews or case studies helpby bringing problems to the forefront and tend to be ratherpersuasive by providing extra motivation to make positivechanges. Careful treatment of the case is essential to avoidbiasing the interpretations. Most NMSs will undertake oper-ational performance reviews following major meteorologicalevents to assess the effectiveness of their systems. One suchreview was undertaken following the costly “Ice Storm” ofJanuary 1998 in Eastern Canada.
Reviews can result in complete end-to-end operationalsystem audits of what worked effectively and what did not. Itis common to analyze the accuracy and appropriateness ofthe meteorological products. The effectiveness of the infor-mation delivery system is a critical component to beanalyzed, as is the effectiveness of the NMS’s relationshipwith other agencies involved in disaster management.Surveysof the public and even the local media provide useful infor-mation.An assessment of the public “issue management”canlead to improved strategies for future similar situations.Documenting and learning from these situations are keysteps towards improvements. A good example of a rigorousprocess is provided as Appendix L ‘Ft. Smith and Van Buren,Arkansas, Tornado of April 21, 1996 Natural Disaster SurveyReport –Executive Summary and Table of Contents-NWS-NOAA-USA’. Only the Executive Summary and the Table ofContents are provided but this is adequate to illustrate the
rigorous method followed in such a programmed approachto assessment of major meteorological events.
The US National Weather Service (NWS) conductsservice assessments to evaluate performance for catastrophicweather events. Service Assessments are performed eitherwhen there is a major economic impact on a large area orpopulation; or when multiple fatalities or numerous seriousinjuries occur; or when an unusually high level of public ormedia interest is generated. In these cases reports areproduced that explain what happened; what actions havebeen taken by the NWS before, during, and after the event;and that make recommendations for changes in NWS policy,procedures, products, and/or services to improve perfor-mance and emulate best practice. More information onService Assessments in the USA is found in http://www.nws.noaa.gov/om/assessments/index.shtml.
4.9 ASSESSMENT OF AUTOMATED FORECASTPROCESSES
There is a trend in many NMSs to introduce increasingamounts of automation into the product generation activity.Indeed, some products such as the extended period outlookforecasts, are delivered to the end-user untouched by humanforecasters. For such cases it is important to measure thescientific quality of those products and the degree to whichthey satisfy user needs. Where there is some humanintervention in the production of the end-user product, suchas at the weather element prediction level, it is important tomonitor the value the human weather forecaster brings tothe process. This is important not only from the perspectiveof location or period averages but also from the perspectiveof high impact weather events.
The UK Met Office “Added Value Chain”, as contained inAppendix I, illustrates one example of how this can be under-taken. Here, the concept of “fix once, use many times” isemployed, illustrating that human forecaster interventionearly in the forecast “chain”, is an efficient manner in whichto employ scarce meteorologist resources.
Another example is the forecasts produced using the“Scribe” system in Canada. Appendix J ‘Automated “Scribe”vs. Forecaster Accuracy’ shows the comparative results ofhuman forecasters versus automated forecast production.Thetop graphic illustrates the pure NWP output result. Thebottom graphic illustrates the performance results of thehuman forecaster, which in more recent years, for about onehalf of the country’s public forecast offices, includes the useof model scribe results as a starting point in the developmentof the public forecasts. It would appear that beyond the firstday, on average, the forecaster does not add value. It would beeasy to conclude that the forecaster should focus on the firstday of the forecast where it would appear he has the greatestimpact. The first caution is that these results are for forecastsof temperature only. It is not valid to extend these results toother forecast elements. Also, is the human forecaster betterable to pick out those significant events of higher impact tothe client, thereby contributing significant added value and isit justifiable to allow continued human intervention? Toanswer these questions, rigorous analysis is needed. This
Chapter 4 — The Assessment Process10

highlights the need to interpret correctly the often limitedverification results of certain forecasts.
4.10 APPROACH TO PRODUCT/SERVICEDEVELOPMENT AND ASSESSMENT BYGROUPINGS OF COUNTRIES
Some developing countries do not possess sufficient capaci-ties in terms of technical, infrastructural, financial and relatedresources to develop and provide effective public weatherproducts and services on their own. This situation thereforetends to render them largely low actors or none at all in prod-uct assessment activities and practices with the consequencethat they hardly can achieve the added value that such anactivity can bring to the overall operations of an NMS.
These challenges have developing NMSs to seriouslyseek alternatives that will enable them to emerge as mean-ingful players in fulfilling their mandates as providers ofpublic weather services and all that it entails, includingproduct assessment. A notable approach to doing this hasbeen a move by NMSs of neighbouring countries to formregional groupings where more or less similar features(economic, geographic and climatic) exist. They do this tofoster joint cooperation amongst Members in developingand issuing forecasts and other products from a regionalsetting, which eases the constraints imposed by the otherwise
insufficient resources and abilities of individual Members.The participating Members then take ownership of thefinished products as well as the responsibility of theirdissemination to the local user communities as appropri-ate (with or without further enhancement). Scientificassessment can occur at either the level of the issuingcountry or at the level of the benefiting country or, perhapsmore properly, at both levels. User-based assessment,nevertheless needs to be undertaken at a national versusregional level to ensure against biasing influence fromneighbouring countries.
An example of a regional grouping of countries can befound in the Southern African Develop Community (SADC)region where some fourteen countries (Angola, Botswana,The DRC, Lesotho, Malawi, Mauritius, Mozambique,Namibia, The Seychelles, South Africa, Swaziland, Tanzania,Zambia and Zimbabwe) of the region grouped together inwhat is called a Southern African Climate Outlook Forum(SARCOF). The forum was composed against the backdropof the region’s heavy reliance on agricultural production andhence the common requirement of an effective planning toolbased on seasonal forecasts for purposes of decision makingin the allocation of resources and scheduling of activities andpractices within the supporting sectors.An assessment of thesuccesses and needs for improvement of SARCOF can befound at the following Website: www.ogp.noaa.gov/enso/retro/sarcofchrt58.htm.
11Supplementary Guidelines on Performance Assessment of Public Weather Services

Both scientific verification and user-based assessment activ-ities have a fairly broad spectrum of audiences. User-basedassessment information is used at all levels of operations andmanagement including central funding agencies. This infor-mation is used internally for management, staff and programdevelopment purposes and externally for communication onthe NMS’s activities. The scientific verification information isused to satisfy similar needs. In both cases care must be takenin communicating this information both internally and exter-nally. Scientific verification presents a particular challengewhen communicating outside the traditional scientificcommunity.
The information on overall performance of the publicweather services must be communicated to the public via themedia when opportunities present themselves or routinelythrough the NMS’s Web site to build public support and cred-ibility. Managers need information to guide them indecision-making. Forecasters need information by way offeedback on their performance, particularly in relation tosystematic errors that may need to be corrected. Researchersneed information on performance of the system,and on likelynew products so they can plan and prioritize research anddevelopment. All staff need information on the technicalaccuracy of the services delivered, and on public expecta-tions, perceptions and needs. Information on performancemust be communicated to the government on behalf of thetaxpayers, the principal source of funds for the NMS, todemonstrate performance and the beneficial impacts ofprevious investment in the NMS, and to support future plansfor the development of the NMS.
Since user-based assessment is quite costly, it is impor-tant to maintain both the reports and raw data in hard andelectronic media , with backup copies, for future use andpossible reanalysis. The material can be supplied to a varietyof users for purposes ranging from management for decisionmaking purposes, staff for internal awareness, fundingauthorities for resource justification, the public or stakehold-ers for end-user awareness and education, regulatory bodiesfor the attainment of approvals, and central agencies to satisfyreporting requirements. It is important that the data is prop-erly indexed and easily retrievable.
The communication of the results to staff and manage-ment will assist in the evolution to a more client-centredorganization that can lead to improved products, productionefficiency and delivery or even end-user awareness andeducation thrusts. Communication upwards through higherlevels of management will assist in the longer term strategicplanning and management for the NMS.
Communication to central agencies may be a definedrequirement but can also be used as a justification forresources (current and additional). Communication of theresults externally may have the effect of modifying certainpractices, such as those related to safety, or may encourage oraccelerate the development of new services or productswithin the private sector. Communication to the generalpublic can have the effect of increasing awareness and credi-bility of the NMS and its offerings. An example ofperformance reported via the Internet can be seen athttp://www.crh.noaa.gov/arx/svr_verify.html.
The information needs to be presented in a brief andeasily understood fashion. The example shown in AppendixG ‘Performance at Varying Levels of Accuracy’ taken frompage 5 of the Deutscher Wetterdienst Verifikationsberichtreport of February 2001 illustrates one way of presentingverification of deterministic forecasts of values of continuousvariables. Through knowing his individual accuracy require-ments for a specific forecast element, the end-user can obtaininformation on the frequency within which that accuracy isachieved. This type of accuracy presentation can be used foraerial or fixed-point forecasts over given periods or even forperiods when specific meteorological criteria are met.Additionally, through the use of multiple curves the variationin performance can be demonstrated by location, season andyears.
Performance reports often make their way into theannual reports of individual NMSs. Some of these reports, inwhole or part, appear on the Web sites of NMSs.An exampleof this, from the Annual Report of the New ZealandMeteorological Service, is shown as Appendix K.
It is common to try to represent performanceinformation as a trend over time.Over meaningful time scalesthis is usually valid, especially for certain meteorologicalelements. It needs to be recognized that user-basedassessment information is second order information whoseshortcomings need to be understood for its appropriateapplication. Chapter 5 of WMO/TD No. 1023 should beconsulted for further details. The trend lines shown inAppendix J illustrate the improvement of temperatureforecasts over time from automated processes as well as by thehuman forecaster.
Finally, scientific verification information must be shownas interpreted in an appropriate context. For example, lowseasonal scores for the prediction of severe weather eventsmay be more a function of the abnormality or complexity ofthe meteorological conditions of the season than theprofessional skills of the operational staff.
Chapter 5
REPORTING ON ASSESSMENTS

Gordon, N.D., and Shaykewich, J.E. 2000 Guidelines onPerformance Assessment of Public Weather Services.WMO/TD 1023.
Murphy,A.H., 1997. Forecast verification. In Economic Valueof Weather and Forecasts, ed. R.W. Katz and A.H.Murphy,19-74.Cambridge: Cambridge University Press.
UK Met Office. 2002. CAeM-XII/Doc. 7(4) “TheImplementation of the Quality Management System bythe UK Met Office”
Météo-France. 2002. CAeM-XII/Doc. 7(5) “Implementationof the quality assurance system at Météo-France”.
NWS-NOAA, 1996. Natural Disaster Survey Report “Ft.Smith and Van Buren,Arkasas, Tornado of April 21, 1996”
Deutscher Wetterdienst. 2001. “Verifikationsbericht zur gütelokaler Wettervorhersagen Nr. 23. Februar 2001”
Treasury Board Secretariat, Government of Canada. 2000. “APolicy Framenwork for Service Improvement”
REFERENCES

GENERAL PARTICULARS OF RESPONDENT
AGE:� 20 years & below � 21 – 35 years � 36 – 55 years � Above 56 years
OCCUPATION: . . . . . . . . . . . . . . . . . . . . . . . . . . . . . . . . . . . . . . RESIDENTIAL AREA: . . . . . . . . . . . . . . . . . . . . . . . . . . . . . . .
NEWSPAPER READ:� New Straits Times � The Star � Nanyang Siang Pau � Berita Harian
� Utusan Malaysia � Sin Chew Jit Poh � Others (Please Specify) . . . . . . . . . . . . . . . . . . . . . . . . . . . . . . . . . . . .
LISTEN/READ/WATCH DAILY WEATHER FORECAST:� Yes � No
If YES, from which source:� TV � Radio � Newspaper
� Others (Please Specify): . . . . . . . . . . . . . . . . . . . . . . . . . . .
A. Please use the following scale to answer the following questions.
1. What is your opinion on the accuracy of the forecast? �
2. What do you think of the presentation format? �
3. Timeliness of the forecast? �
B. Please answer the following questions:4. Is the weather forecast useful for the planning of your activities?� Yes � No
5. How much do you think the weather forecast is worth?� 0 cents � < RM1/= � RM 1/= - RM3/= � RM3/= - RM5/= � > RM5/=
6. Have you ever called the number 1052 or any of the Forecast Offices to enquire about the weather forecast?� Yes � No
If Yes, how many times? . . . . . . . . . . . . . . . . . . . . . . . . . . . . . . . . . . . . . . . . . . . . . . . . . . . . .
If No, why? . . . . . . . . . . . . . . . . . . . . . . . . . . . . . . . . . . . . . . . . . . . . . . . . . . . . . . . . . . . . . . . . . . . . . . . . . . . . . . . . . . . . . . . . . . . . . . . . . . . . . . . . . .
7. Comments: . . . . . . . . . . . . . . . . . . . . . . . . . . . . . . . . . . . . . . . . . . . . . . . . . . . . . . . . . . . . . . . . . . . . . . . . . . . . . . . . . . . . . . . . . . . . . . . . . . . . . . . . . . . . . . . . . . . . . . . . . . . . . . . . . . . . . . . . . . . . . . . . . . . . . . . . . . . . . . . . . . . . . . . . . . . . . . . . . . . . . . . . . . . . . . . . . . . . . . . . . . . . . . . . . . . . . . . . . . . . . . . . . . . . . . . . . . . . . . . . . . . . . . . . . . . . . . . . . . . . . . . . .
APPENDIX A
WEATHER FORECAST AND YOU — MALAYSIA SURVEY
1Very unsatisfactory
2Not Satisfactory
3Average
4Good
5Very good

MAIN QUESTIONNAIRE
Q1 Do you usually read, watch or listen to weather reports?1. Yes Go to Q22. No End of questionnaire
Q2 From where do you usually obtain weather information of Hong Kong? Do you obtain from radio, television, newspaper,weather hotline, internet, pagers / mobile phones, or other sources? Any other? (up to 3 sources)
(For “weather hotline”, probe : Is it Hong Kong Observatory’s Dial-a-Weather hotlines 1878-200, 1878-202 and 1878-066,or Hong Kong Observatory’s Information Enquiry System 2926-1133 or Hong Kong Telecom’s 18-501 and 18-503,18-508?)
(For “internet”, probe : Is it Hong Kong Observatory’s Homepage or other homepages?)
1. Radio2. Television3. Newspaper4. Hong Kong Observatory’s Dial-a-Weather hotlines (1878-200 / 202 / 066)5. Information Enquiry System (2926-1133)6. Hong Kong Telecom’s 18 501 / 3 / 87. Observatory’s Home Page8. Other weather homepages9. Pagers / Mobile Phones10. Other sources (please specify)
Q3a Do you consider the weather forecasts of the Hong Kong Observatory over the past several months accurate or inaccu-rate? (Probe the degree)1. Very accurate2. Somewhat accurate3. Average4. Somewhat inaccurate5. Very inaccurate6. Don’t know / no comment
Q3b What percentage of weather forecasts of the Hong Kong Observatory over the past several months do you consider accurate ?1. ___________ per cent2. Don’t know / no comment
APPENDIX B
HONG KONG OBSERVATORY SURVEYadministered during the months of April and October every year

Q4 Do you consider the following aspects of weather forecasts of the Hong Kong Observatory over the past several monthsaccurate or inaccurate?
Q5 How do you compare weather forecasts nowadays with those from the past 3 to 4 years ago? Is it more accurate, less accu-rate or about the same?1. More accurate2. About the same3. Less accurate4. Don’t know / no comment
Q6 How satisfied are you with the services provided by the Hong Kong Observatory? If you rate on a scale of 0 to 10, with “5”being the passing mark and “10” being “excellent service”, how many marks will you give?
End of Questionnaire
16 Appendix B
Inaccurate Accurate Don’t know/No comment
Temperature
Fine / Cloudy
Rain storm forecasts / warning
Typhoon prediction / warning

INTRODUCTION
Good afternoon/evening. My name is _______________ and I am calling from Decima Research, a public opinion researchcompany. Today we are conducting a survey on weather services currently provided to Canadians. Please be assured that weare not selling anything. We are simply interested in your attitudes and opinions.
We choose telephone numbers at random and then select one person from each household at random to be interviewed.To do this, we would like to speak to the person in your household, 18 years or older, who has had the most recent birthday.
[IF ASKED: The survey will take about 20 minutes to complete][IF ASKED: I can tell you at the end who sponsored this survey]
IF PERSON SELECTED IS NOT AVAILABLE, ARRANGE FOR CALL-BACK
1. To begin, I would like to ask you about the types of news that you hear or look at. During a typical day, how likely areyou to look at or hear news on each of the following topics? Are you very likely, somewhat likely, not very likely, or notat all likely to get news on [READ AND ROTATE]
Very Somewhat Not Very Not At All Depends Don’t know/Likely Likely Likely Likely no answer
Local events and politics � � � � � �Entertainment � � � � � �Weather � � � � � �Traffic � � � � � �Sports � � � � � �
2. We’d like to focus more on weather information for the remainder of the interview. How important is it for you to haveinformation about weather? Is it:
� Critically important� Definitely important� Somewhat important� Not very important� Not at all important� Don’t know/No answer
3. I would like you to think about the four seasons, in terms of the importance that weather information holds for you.Would you say that weather information during … is critically important, definitely important, somewhat important,not very important, or not at all important? [READ SEASONS IN SEQUENCE, WITH RANDOM START]
Critically Definitely Somewhat Not very Not at all Don’t know/important important important important important no answer
a. Spring � � � � � �b. Summer � � � � � �c. Fall � � � � � �d. Winter � � � � � �
SECTION ONE: USE OF WEATHER INFORMATION
APPENDIX C
ENVIRONMENT CANADA (MSC) NATIONAL
METEOROLOGICAL PRODUCTS AND SERVICES SURVEY - 2002(Decima Research Inc., March 14, 2002)

4. What specific types of weather information do you generally need, that is information you would use in any season tomake decisions or plans? [MODIFIED] [DO NOT READ - CODE FIRST AND OTHER MENTIONS SEPARATELY –CODE UP TO SIX] PROBE: Anything else?
� Temperature - General (PROBE FOR SPECIFICS) � Visibility/Reduced visibility� Temperature - Accurate forecast/information � Amount of sun� Temperature - Maximum high/low � UV index� Wind chill � Air quality� Humidity/humidex � Accuracy� Road/Highway conditions � More frequent reports/faster updates� Precipitation - General (PROBE FOR SPECIFICS) � More precise/local weather information� Precipitation – (Type: rain/snow) � Long term forecasts� Precipitation – (Type: freezing rain, ice pellets, sleet) � More detailed information� Precipitation - Amount (heavy/light) � Weather conditions in other regions� Precipitation - When it will start/end � Historical information (record high/low � Precipitation - probability of occurrence temperatures/snowfall)� Expected weather changes � Tide/marine information� Storm warning/probability/expectations � Other (SPECIFY ____________)� Wind direction � None� Wind speed (gusty) � Don’t know /No answer
5. Compared with two years ago, would you say that today you are using weather forecasts more often, about the same, orless often than you were two years ago?
� More often � Less often� About the same � Don’t Know/No answer
6. On a typical day, how many times would you say that you specifically make a point of looking at or listening to weatherforecasts? Would it be: [READ]
� More than four times a day � Less than once a day� Three times a day � Depends� Two times a day � Don’t know/No answer� Once a day
7. And on a typical day, when do you make a point of trying to look at listen to weather forecasts? [DO NOT READ - CODEFIRST AND OTHER MENTIONS SEPARATELY - CODE UP TO SIX]
� Morning � Other (SPECIFY ____________)� Afternoon � Don’t know/No answer� Evening
8. Which one of the following forecasts is most important to you? Is it: [MODIFIED] [READ - CODE ONE ONLY]
� The forecast for that particular day � Depends on the weather� The forecast two days in advance � Depends on the season� The forecast for three or more days in advance � Other (SPECIFY ____________)� All equally important � Don’t know/No answer
9. I am also interested in where you get your weather information from. From which source are you most likely to get yourdaily weather information? Are there any other sources do you rely on for weather information? [DO NOT READ -CODE FIRST AND OTHER MENTIONS SEPARATELY - CODE UP TO SIX]
� Television - general mention (PROBE FOR SPECIFICS)� Television - Weather network/Weather channel/Météomédia� Television – Local TV station forecasts
18 Appendix C

� Television – bar running across bottom of screen/crawler� Television – Local Environment Canada cable channel� Radio – Local stations� Newspaper� Internet/web sites – non-specific� Environment Canada web site/The Green Lane/Weather Office� Weather Network web site� Personal digital assistant (Palmpilot/Blackberry)� E-mail� WeatherRadio Canada� WeatherCopy Canada� Environment Canada (PROBE FOR SPECIFICS)� Telephone - general mention (PROBE FOR SPECIFICS)� Telephone - 1-800 number� Telephone - 1-900 number� Environment Canada - recorded tape� Family member/friend/Word of mouth� None� Other (SPECIFY ____________)� Don’t know/No answer
10. How often does the weather information you get on a typical day provide you with enough information to make what-ever decisions or plans you need to make? Is it: [READ]
� Always SKIP TO Q.12 � Rarely� Usually SKIP TO Q.12 � Never� Sometimes � Don’t know/No answer SKIP TO Q.12
11. (IF SOMETIMES/RARELY/NEVER) What other weather information would you need? That is, information you arenot currently getting most or all of the time? [MODIFIED] [DO NOT READ – CODE FIRST AND OTHERMENTIONS SEPARATELY – CODE UP TO SIX]
� Temperature – non-specific � More precise local weather conditions� Temperature – high/low � More detailed information� Amount of snow/rain � Long term forecasts� Probability of precipitation � Amount of sun� Wind speed � Visibility/reduced visibility� Type of precipitation � Significance of wind chill� When precipitation will start � Direction of wind� Whether precipitation will be light/heavy � Humidity/Humidex level� Storm expectation � Marine/tidal information� Expected weather changes � Other (SPECIFY ____________)� Road/highway conditions � None� Accuracy � Don’t know/No answer� More frequent reports/faster updates
12. Overall, how satisfied are you with your current ability to get weather forecast information when you need it? Are you:
� Very satisfied (5)� Satisfied� Neutral� Dissatisfied� Very dissatisfied (1)� Don’t know/No answer
19Supplementary Guidelines on Performance Assessment of Public Weather Services

12.1 Most people get their weather information from TV and radio. Who, specifically, do you think is the provider of thisweather information to these media outlets? [DO NOT READ - CODE FIRST AND OTHER MENTIONS SEPA-RATELY - CODE UP TO SIX]
� Environment Canada � Private meteorology/weather companies� Meteorological Service of Canada � Accuweather� Canadian Weather Service � Meteorologists/forecasters� Department of the Environment � Airports� Federal Government/Canadian government � Other (SPECIFY ____________)� The Weather Network � Don’t know/No answer� The media (TV, Radio, Newspapers)
Now changing topics a bit . . .
13. Which of the following best describes your current employment status? [MODIFIED] [READ IF NECESSARY - CODEONE ONLY]
� Employed - full time � Retired SKIP TO Q.18� Employed - part time � Student SKIP TO Q.18� Self-employed � Other (SPECIFY ____________) SKIP TO Q.18� Currently looking for work SKIP TO Q.18 � No answer/Refuse SKIP TO Q.18� Homemaker SKIP TO Q.18
14. (IF EMPLOYED/SELF EMPLOYED) Which of the following best describes where you work? Do you: [NEW] [READ- CODE ONE ONLY]
� Work mostly indoors � Other (SPECIFY ____________)� Work mostly outdoors, or � Don’t know/No answer� Work both indoors and outdoors
15. How often does your work or job require you to make decisions based on the weather? Is it:
� Always � Never SKIP TO Q.18� Usually � Depends� Sometimes � Don’t know/No answer SKIP TO Q.18� Rarely
16. And what type of weather forecast information do you need to make work-related decisions? [DO NOT READ - CODEFIRST AND OTHER MENTIONS SEPARATELY – CODE UP TO SIX] PROBE: Anything else?
� Temperature - General (PROBE FOR SPECIFICS) � Visibility/Reduced visibility� Temperature - Accurate forecast/information � Amount of sun� Temperature - Maximum high/low � UV index� Wind chill � Air quality� Humidity � Accuracy� Road/Highway conditions � More frequent reports/faster updates� Precipitation - General (PROBE FOR SPECIFICS) � More precise/local weather information� Precipitation – Type: rain/snow) � Long term forecasts� Precipitation – (Type: freezing rain, ice pellets, sleet) � More detailed information� Precipitation - Amount (heavy/light) � Weather conditions in other regions� Precipitation - When it will start/end � Historical information (record high/low � Precipitation - probability of occurrence temperatures/snowfall)� Expected weather changes � Marine/tidal information� Storm warning/probability/expectations � Other (SPECIFY ____________)� Wind direction � None� Wind speed (gusty) � Don’t know /No answer
20 Appendix C

17. What is your main source of weather information for work-related decisions? And what other sources do you rely onfor such decisions? [DO NOT READ - CODE FIRST AND OTHER MENTIONS SEPARATELY - CODE UP TO SIX]
� Television - general mention (PROBE FOR SPECIFICS)� Television - Weather network/Weather channel/Météomédia� Television – Local TV station forecasts� Television – bar running across bottom of screen/crawler� Television – Local Environment Canada cable channel� Radio – Local stations� Newspaper� Internet/web sites – non-specific� Environment Canada web site/The Green Lane/Weather Office� Weather Network web site� Personal digital assistant (Palmpilot/Blackberry)� E-mail� WeatherRadio Canada� WeatherCopy Canada� Environment Canada (PROBE FOR SPECIFICS)� Telephone - general mention (PROBE FOR SPECIFICS)� Telephone - 1-800 number� Telephone - 1-900 number� Environment Canada - recorded tape� Family member/friend/Word of mouth� None� Other (SPECIFY ____________)� Don’t know/No answer
Now moving to the topic of accuracy in weather forecasts . . .
18. Overall, how satisfied are you with the accuracy of the weather information and forecasts you currently receive? (IFASKED: Accuracy means that the weather which was predicted actually happens) Would you say you are:
� Very satisfied (5) � Dissatisfied� Satisfied � Very dissatisfied (1)� Neutral � Don’t know/No answer
19. Compared with two years ago, would you say the accuracy of weather forecasts today is: [NEW] [READ]
� Much better � Somewhat worse� Somewhat better � Much worse� About the same � Don’t know/No answer
20. REMOVED
FOR Q.21 -33) - SPLIT RANDOMLY INTO THREE GROUPS: SUMMER—FALL/SPRING—WINTER
SECTION TWO: WEATHER FORECASTING ACCURACY/INFORMATION
21Supplementary Guidelines on Performance Assessment of Public Weather Services

I would now like to know your opinions about the accuracy of various types of weather forecasts. Consider a summer forecastthat you might hear in July for your area.
S21a. Let’s say that this forecast states the anticipated high for the day would be 20 degrees Celsius. Suppose the actual high isnot 20, but some temperature cooler than 20 degrees.At what temperature below 20 would you consider the forecast tobe inaccurate? (ENSURE RESPONDENT GIVES ANSWER AS A TEMPERATURE, NOT AS A RANGE)
______ temperature (in degrees Celsius) � Don’t know/No answer
S21b. Now suppose the actual high is not 20,but is some temperature warmer than 20.At what temperature above 20 would youconsider the forecast inaccurate? (ENSURE RESPONDENT GIVES ANSWER AS A TEMPERATURE,NOT AS A RANGE)
______ temperature (in degrees Celsius) � Don’t know/No answer
S22. How much importance do you place on the accuracy of summer temperature forecasts? Would you say it is: [NEW]
� Very important (5) � Unimportant� Important � Very unimportant (1)� Neutral � Don’t know/No answer
S23. And how satisfied are you overall with the accuracy of summer temperature forecasts provided? Are you: [NEW]
� Very satisfied (5) � Dissatisfied� Satisfied � Very dissatisfied (1)� Neutral � Don’t know/No answer
S24. Turning now to the accuracy of precipitation forecasts, say that “heavy rain” over the next 24 hours is forecast. Wouldyou consider this forecast to be accurate or inaccurate if actually: [MODIFIED] READ AND ROTATE
Accurate Not Don’t know/Accurate no answer
a. The ground was slightly wet � � �b. There are some puddles � � �c. A lot of water has accumulated � � �d. Basements have been flooded � � �
S25. How much importance do you place on the accuracy of summer precipitation forecasts? Would you say it is: [NEW]
� Very important (5) � Unimportant� Important � Very unimportant (1)� Neutral � Don’t know/No answer
S26. Which of the following parts of a summer precipitation forecast is most important to you? Is it: [MODIFIED] READAND ROTATE - CODE ONE ONLY
� The type of precipitation � All equally important� When it happen � None of the above� How much precipitation will fall � Other (SPECIFY ____________)� The probability or chance that it will occur � Don’t know/No answer
SECTION TWO A: SUMMER
22 Appendix C

S27. And how satisfied are you overall with the accuracy of summer precipitation forecasts provided? Are you:
� Very satisfied (5) � Dissatisfied� Satisfied � Very dissatisfied (1)� Neutral � Don’t know/No answer
S28. Thinking now about wind during summer, which of the following is most important to you in terms of a[summer/fall/winter] forecast? READ AND ROTATE - CODE ONE ONLY
� Wind speed � All equally important SKIP TO Q.30� Wind direction � None of the above SKIP TO Q.30� Wind chill [WINTER AND FALL/SPRING ONLY] � Other (SPECIFY ____________) SKIP TO Q.30
� Don’t know/No answer SKIP TO Q.30
S29. You said that [Q.42 RESPONSE] is the most important aspect of wind for you. How satisfied are you with the accuracyof the weather information provided on [Q.42 RESPONSE]? Are you:
� Very satisfied (5) � Dissatisfied� Satisfied � Very dissatisfied (1)� Neutral � Don’t know/No answer
S30. Thinking now about sun and cloud during the summer, how satisfied are you with the accuracy of the weather fore-casts provided for sun and cloud conditions? Are you:
� Very satisfied (5) � Dissatisfied� Satisfied � Very dissatisfied (1)� Neutral � Don’t know/No answer
S31. Now thinking about reduced visibility due to fog or heavy rain, how satisfied are you with the accuracy of the weatherinformation provided on visibility conditions? Are you:
� Very satisfied (5) � Dissatisfied� Satisfied � Very dissatisfied (1)� Neutral � Don’t know/No answer
And now turning to another type of weather information . . .
S32a. Are you familiar with the " UV index"? [NEW]
� Yes� No SKIP TO Q.34� Don’t know/No answer SKIP TO Q.34
S32b. How useful do you find the UV index as part of summer weather forecasts? Is it: [NEW]
� Very useful SKIP TO Q.33 � Not at all useful� Somewhat useful SKIP TO Q.33 � Don’t know/No answer SKIP TO Q.33� Not very useful
23Supplementary Guidelines on Performance Assessment of Public Weather Services

S32c. (IF NOT VERY/NOT AT ALL USEFUL) In what way is the UV index not that useful? [NEW] DO NOT READ - CODEALL THAT APPLY
� No need for it � Stay well covered when outdoors� Not necessary/climate doesn’t require it � Have to be outdoors anyway (exposure is unavoidable)� Not very useful (PROBE FOR SPECIFICS) � Other (SPECIFY ____________)� Do not understand it � Don’t know/No answer� Do not spend time outdoors
S33. And how easy do you feel it is to understand the UV index, that is what it means and how to make use of it? Is it . . .tounderstand? [NEW]
� Very easy � Not at all easy� Somewhat easy � Don’t know/No answer� Not very easy
SKIP TO SECTION THREE
I would now like to know your opinions about the accuracy of various types of weather forecasts. Consider a fall or spring fore-cast that you might hear in October or March for your area.
F21a. Let’s say that this forecast states the anticipated high for the day would be plus 1 degree Celsius. Suppose the actual highis not plus 1, but some temperature cooler than plus 1. At what temperature below plus 1 would you consider the fore-cast to be inaccurate? (ENSURE RESPONDENT GIVES ANSWER AS A TEMPERATURE, NOT AS A RANGE)
______ temperature (in degrees Celsius) � Don’t know/No answer
F21b. Now suppose the actual high is not plus 1, but is some temperature warmer than plus 1.At what temperature above plus1 would you consider the forecast inaccurate? (ENSURE RESPONDENT GIVES ANSWER AS A TEMPERATURE,NOT AS A RANGE)
______ temperature (in degrees Celsius) � Don’t know/No answer
F22. How much importance do you place on the accuracy of fall or spring temperature forecasts? Would you say it is: [NEW]
� Very important (5) � Unimportant� Important � Very unimportant (1)� Neutral � Don’t know/No answer
F23. And how satisfied are you overall with the accuracy of fall or spring temperature forecasts provided? Are you: [NEW]
� Very satisfied (5) � Dissatisfied� Satisfied � Very dissatisfied (1)� Neutral � Don’t know/No answer
SECTION TWO B: FALL/SPRING
24 Appendix C

F24. Turning now to the accuracy of precipitation forecasts, say that “freezing rain”is forecast.Would you consider this fore-cast to be accurate or inaccurate if the precipitation was actually: READ AND ROTATE
Accurate Not Don’t know/Accurate no answer
a. Just rain � � �b. Just snow � � �c. A mix of snow and rain � � �d. Freezing drizzle � � �
F25. How much importance do you place on the accuracy of fall or spring precipitation forecasts? Would you say it is:[NEW]
� Very important (5) � Unimportant� Important � Very unimportant (1)� Neutral � Don’t know/No answer
F26. Which of the following parts of a fall or spring precipitation forecast is most important to you? Is it: [MODIFIED] READAND ROTATE - CODE ONE ONLY
� The type of precipitation � All equally important� When it happen � None of the above� How much precipitation will fall � Other (SPECIFY ____________)� The probability or chance that it will occur � Don’t know/No answer
F27. And how satisfied are you overall with the accuracy of fall or spring precipitation forecasts provided? Are you:
� Very satisfied (5) � Dissatisfied� Satisfied � Very dissatisfied (1)� Neutral � Don’t know/No answer
F28. Thinking now about wind during fall or spring, which of the following is most important to you in terms of a wind fore-cast? READ AND ROTATE - CODE ONE ONLY
� Wind speed � All equally important SKIP TO Q.30� Wind direction � None of the above SKIP TO Q.30� Wind chill � Other (SPECIFY ____________) SKIP TO Q.30
� Don’t know/No answer SKIP TO Q.30
F29. You said that [Q.28 RESPONSE] is the most important aspect of wind for you. How satisfied are you with the accuracyof the weather information provided on [Q.28 RESPONSE]? Are you:
� Very satisfied (5) � Dissatisfied� Satisfied � Very dissatisfied (1)� Neutral � Don’t know/No answer
F30. Thinking now about sun and cloud during fall or spring, how satisfied are you with the accuracy of the weather fore-casts provided for sun and cloud conditions? Are you:
� Very satisfied (5) � Dissatisfied� Satisfied � Very dissatisfied (1)� Neutral � Don’t know/No answer
25Supplementary Guidelines on Performance Assessment of Public Weather Services

F31. Now thinking about reduced visibility due to fog or heavy rain, how satisfied are you with the accuracy of the weatherinformation provided on visibility conditions? Are you:
� Very satisfied (5) � Dissatisfied� Satisfied � Very dissatisfied (1)� Neutral � Don’t know/No answer
SKIP TO SECTION THREE
I would now like to know your opinions about the accuracy of various types of weather forecasts. Consider a winter forecastthat you might hear in your area, say for January for your area.
W21a.Let’s say that this forecast states the anticipated high for the day would be minus 5 degrees Celsius. Suppose the actualhigh is not minus 5, but some temperature cooler than minus 5.At what temperature below minus 5 would you considerthe forecast to be inaccurate? (ENSURE RESPONDENT GIVES ANSWER AS A TEMPERATURE, NOT AS A RANGE)
______ temperature (in degrees Celsius) � Don’t know/No answer
W21b.Now suppose the actual high is not minus 5, but is some temperature warmer than minus 5 At what temperature aboveminus 5 would you consider the forecast inaccurate? (ENSURE RESPONDENT GIVES ANSWER AS A TEMPERA-TURE, NOT AS A RANGE)
______ temperature (in degrees Celsius) � Don’t know/No answer
W22. How much importance do you place on the accuracy of winter temperature forecasts? Would you say it is: [NEW]
� Very important (5) � Unimportant� Important � Very unimportant (1)� Neutral � Don’t know/No answer
F23. And how satisfied are you overall with the accuracy of winter temperature forecasts provided? Are you: [NEW]
� Very satisfied (5) � Dissatisfied� Satisfied � Very dissatisfied (1)� Neutral � Don’t know/No answer
W24. Turning now the accuracy of precipitation forecasts, say that “heavy snow” is forecast.Would you consider this forecastto be accurate or inaccurate if actually: READ IN SEQUENCE
Accurate Not Don’tAccurate Know
a. The ground was slightly covered � � �b. There is some snow on the ground � � �c. There is snow on the streets that needs to be cleaned � � �d. Snow has piled up significantly � � �e. People are stranded because of the extreme amount of snow � � �
SECTION TWO C: WINTER
26 Appendix C

W25. How much importance do you place on the accuracy of winter precipitation forecasts? Would you say it is: [NEW]
� Very important (5) � Unimportant� Important � Very unimportant (1)� Neutral � Don’t know/No answer
W26. Which of the following parts of a winter precipitation forecast is most important to you? Is it: [MODIFIED] READ ANDROTATE - CODE ONE ONLY
� The type of precipitation � All equally important� When it happen � None of the above� How much precipitation will fall � Other (SPECIFY ____________)� The probability or chance that it will occur � Don’t know/No answer
W27. And how satisfied are you overall with the accuracy of winter precipitation forecasts provided? Are you:
� Very satisfied (5) � Dissatisfied� Satisfied � Very dissatisfied (1)� Neutral � Don’t know/No answer
W28. Thinking now about wind during summer, which of the following is most important to you in terms of a[summer/fall/winter] forecast? READ AND ROTATE - CODE ONE ONLY
� Wind speed � None of the above� Wind direction � Other (SPECIFY ____________) SKIP TO Q.30� Wind chill [WINTER ONLY] � Don’t know/No answer SKIP TO Q.30� All equally important
W29. You said that [Q.42 RESPONSE] is the most important aspect of wind for you. How satisfied are you with the accuracyof the weather information provided on [Q.42 RESPONSE]? Are you:
� Very satisfied (5) � Dissatisfied� Satisfied � Very dissatisfied (1)� Neutral � Don’t know/No answer
W30. Thinking now about sun and cloud during the winter, how satisfied are you with the accuracy of the weather forecastsprovided for sun and cloud conditions? Are you:
� Very satisfied (5) � Dissatisfied� Satisfied � Very dissatisfied (1)� Neutral � Don’t know/No answer
W31. Now thinking about reduced visibility due to fog or blowing snow, how satisfied are you with the accuracy of the weatherinformation provided on visibility conditions? Are you:
� Very satisfied (5) � Dissatisfied� Satisfied � Very dissatisfied (1)� Neutral � Don’t know/No answer
Now I’d like to ask you a few questions about wind chill. . . .
27Supplementary Guidelines on Performance Assessment of Public Weather Services

W32a.How useful do you find wind chill information as part of winter weather forecasts? Is it: [NEW]
� Very useful SKIP TO Q.32 � Not at all useful� Somewhat useful SKIP TO Q.32 � Don’t know/No answer SKIP TO Q.32� Not very useful
W32b.(IF NOT VERY/NOT AT ALL USEFUL) In what way is wind chill information not that useful? [NEW] DO NOT READ- CODE ALL THAT APPLY
� Not necessary/climate doesn’t require it � Temperature is more useful� Not very useful (PROBE FOR SPECIFICS) � Other (SPECIFY ____________)� Too complicated � Don’t know/No answer� Do not understand it
W33. And how easy do you feel it is to understand the wind chill index, that is what it means and how to make use of it? Is it. . .to understand? [NEW]
� Very easy � Not at all easy� Somewhat easy � Don’t know/No answer� Not very easy
SKIP TO SECTION THREE
I would now like to ask you specifically about weather warnings . . .
34. First of all, what do you think when you see or hear the words "Weather Warning" as part of a weather report? What doesthe term "Weather Warning" mean to you? DO NOT READ - CODE FIRST AND OTHER MENTIONS SEPARATELY- CODE UP TO SIX
� Extreme/severe conditions approaching/something unusual� Pay attention/listen carefully/stay alert/keep updated on weather conditions� Be prepared of oncoming bad weather/take precautions/action� Very windy/high winds� Disaster/danger/life threatening� Information about driving conditions/dangerous driving conditions� Important situation� Very cold weather approaching� May not be safe to travel/need to reschedule� Don’t go outdoors/stay inside� Icing conditions� Amount of precipitation� Am not alarmed/not important� Other (SPECIFY ____________)� Don’t know/No answer
35. How important is Weather Warning information to you? Is it: [NEW]
� Very important (5) � Unimportant� Important � Very unimportant (1)� Neutral � Don’t know/No answer
SECTION THREE: WEATHER WARNINGS
28 Appendix C

36. From what source are you most likely to receive or hear about a Weather Warning? And are there any other sources areyou likely to get such information? DO NOT READ - CODE FIRST AND OTHER MENTIONS SEPARATELY - CODEUP TO SIX
� Television - general mention (PROBE FOR SPECIFICS)� Television - Weather network/Weather channel/Météomédia� Television – Local TV station forecasts� Television – bar running across bottom of screen/crawler� Television – Local Environment Canada cable channel� Radio – Local stations� Newspaper� Internet/web sites – non-specific� Environment Canada web site/The Green Lane/Weather Office� Weather Network web site� Personal digital assistant (Palmpilot/Blackberry)� E-mail� WeatherRadio Canada� WeatherCopy Canada� Environment Canada (PROBE FOR SPECIFICS)� Telephone - general mention (PROBE FOR SPECIFICS)� Telephone - 1-800 number� Telephone - 1-900 number� Environment Canada - recorded tape� Family member/friend/Word of mouth� None� Other (SPECIFY ____________)� Don’t know/No answer
RANDOMLY DIVIDE SAMPLE INTO SUMMER AND WINTER SECTIONS
Summer Warning
I would now like to you think about a summer weather situation, such as an approaching severe thunderstorm with possiblehail or even tornadoes, in which you hear that a Weather Warning is in effect.
S37. Of all of the times that you have heard a summer severe weather warning in your area, how often does a storm actuallyoccur in your area? Would you say that it occurs:
� Always � Rarely� Most of the time � Never� About half of the time � Never heard storm warnings SKIP TO Q.44� Less than half the time � Don’t know/No answer SKIP TO Q.44
S38. And how often would you say that you receive enough notice in order to properly react to a warning about an approach-ing thunderstorm heading toward your area? Would you say it is:
� Always � Rarely� Most of the time � Never� About half of the time � Don’t know/No answer� Less than half the time
S39. When you hear a summer warning for something like a severe thunderstorm or tornado, how much advance notice doyou need? DO NOT READ - RECORD IN MINUTES
___ Minutes � Other (SPECIFY ____________)� Don’t know/No answer
29Supplementary Guidelines on Performance Assessment of Public Weather Services

S40. Overall, how satisfied are you with the summer warning information you receive for your area? Are you: [NEW]
� Very satisfied SKIP TO Q.42 � Dissatisfied� Satisfied SKIP TO Q.42 � Very dissatisfied� Neutral SKIP TO Q.42 � Don’t know/No answer SKIP TO Q.42
S41. (IF DISSATISFIED) In what way are you dissatisfied with the Weather Warning information you receive? DO NOT READ– CODE ALL THAT APPLY
� Not enough information/detailed information (PROBE FOR SPECIFICS)� Not enough information on type of damage likely� Not enough information on start/end time� Not enough advance notice� Not accurate (forecast doesn’t predict what actually happens)� Too much detail/information� Other (SPECIFY ____________)� Don’t know/No answer
S42. I would like to know about the type of information provided in summer Weather Warnings. I will read to you severalaspects of a severe thunderstorm warning and in each case please tell me whether you think this type of information isgenerally presented very clearly, somewhat clearly, not very clearly, or not at all clearly? Starting with . . . READ ANDROTATE ASPECTS
Very Somewhat Not very Not at all Information not Don’t know/clearly clearly clearly clearly available/provided no answer
a. The area likely to be affected by the storm � � � � � �
b. The severity of the storm � � � � � �c. When the storm will arrive
in your area � � � � � �d. How long the storm is
expected to last � � � � � �e. The type of damage that could
result from the storm � � � � � �
S43. REMOVED
SKIP TO SECTION FOUR
Winter WarningI would now like to you think about a winter storm weather situation, such as an approaching blizzard, in which you hear thata Weather Warning is in effect.
W37. Of all of the times that you have heard a winter storm warning in your area, how often does a storm actually occur inyour area? Would you say that it occurs:
� Always � Rarely� Most of the time � Never� About half of the time � Never heard storm warnings SKIP TO Q.44� Less than half the time � Don’t know/No answer SKIP TO Q.44
W38. And how often would you say that you receive enough notice in order to properly react to a warning about an approach-ing winter storm heading toward your area? Would you say it is:
� Always � Rarely� Most of the time � Never� About half of the time � Don’t know/No answer� Less than half the time
30 Appendix C

W39. When you hear a winter storm warning,how much advance notice do you need? DO NOT READ - RECORD IN HOURS
___ Hours � Other (SPECIFY ____________)� Don’t know/No answer
W40. Overall, how satisfied are you with the winter storm warning information you receive for your area? Are you: [NEW]
� Very satisfied SKIP TO Q.42 � Dissatisfied� Satisfied SKIP TO Q.42 � Very dissatisfied� Neutral SKIP TO Q.42 � Don’t know/No answer SKIP TO Q.42
W41. (IF DISSATISFIED) In what way are you dissatisfied with the Weather Warning information you receive? DO NOTREAD – CODE ALL THAT APPLY
� Not enough information/detailed information (PROBE FOR SPECIFICS)� Not enough information on type of damage likely� Not enough information on start/end time� Not enough advance notice� Not accurate (forecast doesn’t predict what actually happens)� Too much detail/information� Other (SPECIFY ____________)� Don’t know/No answer
W42. I would like to know about the type of information provided in winter storm Weather Warnings. I will read to you severalaspects of a storm warning and in each case please tell me whether you think this type of information is generally presentedvery clearly, somewhat clearly, not very clearly, or not at all clearly? Starting with . . . READ AND ROTATE ASPECTS
Very Somewhat Not very Not at all Don’t know/clearly clearly clearly clearly no answer
a. The area likely to be affected by the storm � � � � �b. The severity of the storm � � � � �c. When the storm will arrive in your area � � � � �d. How long the storm is expected to last � � � � �e. The type of damage that could result from the storm � � � � �
W43. REMOVED
I would now like to ask you about who provides weather-related services and information. . .
45. As you may or may not know, Environment Canada, a department of the federal government, is the principal providerof weather information in Canada.Can you tell me they types of weather-related services Environment Canada provides?DO NOT READ – CODE FIRST AND OTHER MENTIONS SEPARATELY – CODE UP TO SIX; PROBE: Any others?
� Weather forecasts � Airport forecasts/flying conditions� Provide weather information to media � Farm/rural forecasts� Radio/TV broadcasts � Monitor weather/research� Issue storm warnings � Long range forecasts/3-5 day forecasts� Road/highway conditions � Ski conditions� Temperature readings/forecasts � Telephone recorded messages� Amount of precipitation (snow/rain) � Weather web site� Air quality information � WeatherRadio
SECTION FOUR: ENVIRONMENT CANADA SERVICES
31Supplementary Guidelines on Performance Assessment of Public Weather Services

� Humidity levels/humidex � WeatherCopy Radio� Environment related issues/pollution/recycling � Local weather offices/stations� Marine forecasts � Historical weather information/statistics� Snow/rain conditions � Satellite information� Wind information (speed, direction) � Climate information/data� Wind chill index � Other (SPECIFY ____________)� UV ratings � Don’t know/No answer� Weather changes/updates
I’d like to ask you about various weather services that are available from Environment Canada, either by phone or electronically . . .
Free Recorded Local Weather Messages/ATADS
46. In most major urban centres, Environment Canada provides a free 24 hour recorded local weather forecast, accessibleonly over the telephone. Callers in the local dialling area do not pay any charges. However, those calling from outsidethe local area must pay long distance charges to hear about weather that affects their area. Are you aware of thisEnvironment Canada recorded weather forecast message accessible over the phone?
� Yes� No SKIP TO Q.53� Don’t know/No answer SKIP TO Q.53
47. (IF YES) Have you ever used this service?
� Yes� No SKIP TO Q.53� Don’t know/No answer SKIP TO Q.53
48. (IF YES) How often do you use this service? Would it be: READ
� More than once a day � Once a month� Once a day � Less than once a month� Two or more times per week � Have never used SKIP TO Q.53� Once a week � Don’t know/No answer� Two or more times per month
49. And how often, if at all, do you try to call this weather line and receive a busy signal? Is it:
� Always � Less than half of the time� Most of the time � Rarely or never� About half the time � Don’t know/No answer
50. How important is this service to you as a source of weather forecast information? Is it: [NEW]
� Very important (5) � Unimportant� Important � Very unimportant (1)� Neutral � Don’t know/No answer
51. How satisfied are you with the recorded weather messages provided by Environment Canada? Are you:
� Very satisfied (5) � Dissatisfied� Satisfied � Very dissatisfied (1)� Neutral � Don’t know/No answer
32 Appendix C

52. For budgetary reasons, Environment Canada cannot provide this service free of long distance charges. Do you thinkEnvironment Canada should: READ IN SEQUENCE - CODE ONE ONLY
� Keep the service as it currently is, with local calls being free, but others paying long distance where applicable, or� Require everyone to pay, even for local calls� Other (SPECIFY ____________)� Don’t know/No answer
1-900 User-Pay Telephone Services
53. Environment Canada also has a national 1-900 user-pay telephone service called “Weather One on One”, which allowsthe caller to speak directly with an Environment Canada meteorologist.Are you aware of this 1-900 user-pay telephoneservice?
� Yes� No SKIP TO Q.59� Don’t know/No answer SKIP TO Q.59
54. Have you ever used this service?
� Yes� No SKIP TO Q.59� Don’t know/No answer SKIP TO Q.59
55. (IF YES) How often do you use this service? Would it be: READ
� More than once a day � Once a month� Once a day � Less than once a month� Two or more times per week � Only once or twice� Once a week � Don’t know/No answer� Two or more times per month
56. How important is this service to you as a source of weather forecast information? Is it: [NEW]
� Very important (5) � Unimportant� Important � Very unimportant (1)� Neutral � Don’t know/No answer
57. How satisfied are you with the 1-900 telephone service provided by Environment Canada? Are you:
� Very satisfied (5) � Dissatisfied� Satisfied � Very dissatisfied (1)� Neutral � Don’t know/No answer
58. The cost of this service is $2.99 per minute. For the type of information provided, do you think the price offers excel-lent, good, only fair or poor value for money? [MODIFIED]
� Excellent value � Poor value� Good value � Depends� Only fair value � Don’t know/No answer
33Supplementary Guidelines on Performance Assessment of Public Weather Services

WEATHERADIO
59. WEATHERADIO is another Environment Canada service that broadcasts weather information 24 hours a day in manyareas across Canada. A special radio receiver must be purchased to receive these weather broadcasts.
Are you aware of this WEATHERADIO service?
� Yes� No SKIP TO Q.64� Don’t know/No answer SKIP TO Q.64
60. Have you ever used this service?
� Yes� No SKIP TO Q.64� Don’t know/No answer SKIP TO Q.64
61. (IF YES) How often do you use this service? Would it be: READ
� More than once a day � Once a month� Once a day � Less than once a month� Two or more times per week � Only once or twice� Once a week � Have never used� Two or more times per month � Don’t know/No answer
62. How important is this WEATHERADIO service to you as a source of weather forecast information? Is it: [NEW]
� Very important (5) � Unimportant� Important � Very unimportant (1)� Neutral � Don’t know/No answer
63. How satisfied are you with the WEATHERADIO service weather messages provided by Environment Canada? Are you:
� Very satisfied (5) � Dissatisfied� Satisfied � Very dissatisfied (1)� Neutral � Don’t know/No answer
Internet Web Pages
64. Environment Canada maintains an Internet web site that provides many types of weather and environmental informa-tion. Are you aware of Environment Canada’s weather web site?
� Yes� No SKIP TO Q.70� Don’t know/No answer SKIP TO Q.70
65. (IF YES) How often do you use this service? Would it be: READ
� More than once a day � Once a month� Once a day � Less than once a month� Two or more times per week � Only once or twice� Once a week � Have never used� Two or more times per month � Don’t know/No answer
34 Appendix C

66. How important is this Environment Canada web site to you as a source of weather forecast information? Is it: [NEW]
� Very important (5) � Unimportant� Important � Very unimportant (1)� Neutral � Don’t know/No answer
67. How satisfied are you with this web site as a source of weather forecast information? Are you:
� Very satisfied (5) � Dissatisfied� Satisfied � Very dissatisfied (1)� Neutral � Don’t know/No answer
68. Do you use any other web sites for weather information? [NEW]
� Yes� No SKIP TO Q.70� Don’t know/No answer SKIP TO Q.70
69. (IF YES) Which other web sites do you use for weather information? [NEW] DO NOT READ - CODE ALL THAT APPLY
� Environment Canada – general/non-specific � CBC� WeatherNetwork Météomédia � Other (SPECIFY ____________)� Yahoo � Don’t know/No answer� Sympatico
70. REMOVED
And on another aspect . . .
71. Who do you feel should be responsible for providing weather services and forecasting information to Canadians? Doyou think it should be provided: [NEW] READ IN SEQUENCE - CODE ONE ONLY
� Primarily by the government � Other (SPECIFY ____________)� Primarily by private companies � Neither� By a mix of government and private companies � Don’t know/No answer� Both equally
72. In the past two years, have you contacted Environment Canada to make comments or to get specific information otherthan regular weather information? [NEW]
� Yes� No SKIP TO Q.75� Don’t know/No answer SKIP TO Q.75
73. (IF YES) How did you contact Environment Canada? [NEW] READ CATEGORIES IF NECESSARY - CODE ALLTHAT APPLY
� By telephone (PROBE FOR SPECIFICS) � Environment Canada web site� By telephone – 1-900 number � 1-800 O Canada web site/federal gov’t web site� By telephone – 1-800 number � Environment Canada Enquiries Centre� By telephone – Called weather office � Other (SPECIFY ____________)� By telephone – other (SPECIFY ____________) � Don’t know/No answer SKIP TO Q.75� By e-mail
35Supplementary Guidelines on Performance Assessment of Public Weather Services

74. How satisfied were you with your most recent contact with Environment Canada? [NEW]
� Very satisfied (5) � Not very satisfied� Mostly satisfied � Not at all satisfied (1)� Somewhat satisfied � Don’t know/No answer
75. How interested would you be in getting information on the accuracy record of Environment Canada weather forecastsfor your area? Would you be: [NEW]
� Very interested � Not at all interested� Somewhat interested � Depends� Not very interested � Don’t know/No answer
To finish up, I’d like to ask you a few questions about you and your household for statistical purposes only. Please be assuredthat your answers will remain completely confidential.
76. In which of the following age categories can I place you? READ
� 18 to 24 � 55 to 64� 25 to 34 � 65 and over� 35 to 44 � No Response/Refused� 45 to 54
77. What is your mother tongue, that is, the language you first learned at home? [NEW] DO NOT READ - CODE ONEONLY
� English � Other (SPECIFY ____________)� French � No response/Refused
78. What is the highest level of education you have completed? READ IF NECESSARY - CODE ONE ONLY
� Elementary school � Some university� Some high school � Completed university (undergraduate)� Completed high school � Post-graduate degree� Some community college/technical college/CEGEP � No schooling� Completed community college/technical � No response/Refuse
college/CEGEP
79. Do you currently have access to the Internet, either at home or at work? [NEW] CODE ALL THAT APPLY
� Access at home � Access somewhere else (library)� Access at work � Don’t know/No answer� Access at both home and work
80. And for statistical purposes only, we need information about your household income. Please tell me which of the follow-ing categories applies to your total household income for the year 2001? READ - CODE ONE ONLY
� Less than $25,000 � $60,000 to $80,000� $25,000 to $40,000 � More than $80,000 � $40,000 to $60,000 � Don’t know/Refused
SECTION FIVE: RESPONDENT CHARACTERISTICS/DEMOGRAPHICS
36 Appendix C

81. And finally, may I have the first three digits of your postal code? [NEW] (NEW BRUNSWICK ONLY:) And finally, mayI have the six digits of your postal code?RECORD____ _____ _____
This completes the survey. In case my supervisor would like to verify that I conducted this interview, may I have your first name?
First Name: ______________________________
On behalf of Environment Canada, thank you very much for your cooperation.
RECORD:
82. Province
� Alberta � Nova Scotia� British Columbia � Ontario� Manitoba � Prince Edward Island� New Brunswick � Quebec� Newfoundland � Saskatchewan
83. Gender
� Male � Female
84. Language of interview
� English � French
37Supplementary Guidelines on Performance Assessment of Public Weather Services

Adamowicz, W., J. Louviere, and M. Willians. 1994 Combining Revealed and Stated Preference Methods For ValuingEnvironmental Amenities. Journal of Environmental Economics and Management.
Adamowicz,W.L., J. Swait, P. Boxall, J. Louviere, and M.Willians. 1997. Perceptions versus Objective Measures of EnvironmentalQuality in Combined Revealed and Stated Preference Models of Environmental Valuation. Journal of EnvironmentalEconomics and Management.
Anaman, K.A., D.J. Thampapillai, A. Henderson-Sellers, P.F. Noar, and P.J. Sullivan. 1995. Methods for Assessing the Benefitsof Meteorological Services in Australia. Meteorological Applications.
Anaman, K.A., S.C. Lellyett, L. Drake, R.J. Leigh, A. Henderson-Sellers, P.F. Noar, P.J. Sullivan and D.J. Thampapillai. 1998.Benefits of Meteorological Services: Evidence from Recent Research in Australia. Meteorological Applications.
Brown, Jeremy. 2002. The Value of Weather Forecast Services. Masters Thesis submitted to University of Guelph, Guelph,ON.Carson, R.T., N.E. Flores, K.M. Martin, J.L. Wright. 1996. Contingent Valuation and Revealed Preference Methodologies:
Comparing the Estimates for Quasi-Public Goods. Land Economics.Cummings, R.G., D.S. Brookshire, and W. Schulze, 1986. Valuing Environmental Goods: An Assessment of the Contingent
Valuation Method. Rowan and Allanheld, Totowa, NJ.Freebairn, John W., John W. Zillman. 2002. Economic Benefits of Meteorological Services. Meteorological Applications.Freeman, A.M. 1993. The Measurement of Environmental and Resource Values: Theory and Methods. Resources for the Future,
Washington, DC.Hilton, R.W. 1981. The Determinants of Information Value: Synthesizing Some General Results. Management Science.Hooke, W.H. and R.A. Pielke, Jr. 2000. Short Term Weather Prediction: An Orchestra in Need of a Conductor. In Prediction:
Decision-Making and the Future of Nature, D. Sarewitz, R.A. Pielke, Jr., and R. Byerly, Jr. (eds.). Island Press, Washington,DC.
Johnson, S.R. and M.T. Holt. 1997. “The Value of Weather Information. Chapter 3 in Economic Value of Weather and ClimateForecasts, R.W. Katz and A.H. Murphy (eds). Cambridge University Press, Cambridge. U.K.
Katz, R.W. and A.H. Murphy (eds). 1997. Economic Value of Weather and Climate Forecasts. Cambridge University Press,Cambridge. U.K.
Lazo, Jeffrey K., June 2000. Economic Value of Improved weather Forecasts: A Pilot Study of Denver Households. Stratus ConsultingInc. Boulder CO.
Mitchell, R.C., R.T. Carson. 1989. Using Surveys to Value Public Goods: The Contingent Valuation Method. Resources for theFuture, Washington, DC.
Mjelde, J.W., S.T. Sonka, and D.S. Peel. 1989. The Socioeconomic Value of Climate and Weather Forecasting: A Review. Researchreport 89-01. Midwestern Climate center, Illinois State Water Survey, Champaign
Murphy, A.H. 1994. Socio-Economic Value of Climate Forecasts. Report to Economics Group, Office of the Chief Scientist,National Oceanic and Atmospheric Administration.
Purves, Glenn T., 1997: Economic Aspects of AES Marine Weather Services in Marine Applications, A Case Study of AtlanticCanada. Dalhousie University.
Rollins, Kimberly, J. Shaykewich, 1997: Cross-Sector Economic Valuation of Weather Information Dissemination Services: TwoApplications Using the Contingent Valuation Method. University of Guelph.
Stewart, T.R. 1997. Forecast Value: Descriptive Decision Studies. Chapter 5 in Economic Value of Weather and Climate Forecasts,R.W. Katz and A.H. Murphy (eds). Cambridge University Press, Cambridge. U.K.
Turner, Jason R., 1996:Value of Weather Forecast Information for Dry Hay and Winter Wheat Production in Ontario. Universityof Guelph.
APPENDIX D
REFERENCES ON THE ECONOMIC VALUE OF
METEOROLOGICAL SERVICES

Figure E1 A System Independent from Forecast Operations
PM DATA FLOW … METEOROLOGICAL SERVICE OFCANADA … AVIATION TAF & PUBLIC WEATHER WARNINGPERFORMANCE MEASUREMENT
A) Raw data arrives via the Anikom telecommunicationsystem through two independent feeds.This data is inputfor the Splitter software, which performs two functions:i) Output (the raw data) is stored (real time) in the
anikom_ALL_save database.After twelve days thesefiles are compressed and moved to thesplitter_extension database.
ii) Output is real time METARs, TAFs and PublicWeather Warnings, which are stored in theMsg_Input database.
B) This data is read (at a data dependent interval) by theCircuit Watcher software. Each data type is placed into acorresponding type database (Hourly, Forecast, andPublic_Warnings).This data is then quality controlled byits corresponding QA software.
C) The QA ‘d data is read by the Parser software. The outputproduced is client dependent data (meta data) that willbe used for statistical calculations. This is stored in theVerification_In database.
D) This meta data is read by the Calculate software. TheCalculate software compares each TAF/METAR combi-nation on a particular day, for a particular station, andfor a particular client for the 1st 6 hours of every TAF.The output is stored in the Verification_Out database.
E) This data is read by the Write software, which producessummaries of this data. The summaries are with refer-ence to a particular period (30 and 90 days), statisticcategory (i.e. ALT_FAR), station, and client. Thissummary data is also stored in the Verification_Outdatabase.
F) The summary data is read by the Collect software, whichsums the summary data for a particular period, statisticcategory, station, and client to produce a report. Thesereports are located in the Stats_Collection database.
G) The reports are read by the Diagnostic Check software,which compares the values contained in the reports toestablished normals. If a value lies outside of its “normalvalue” range, the PMO team is notified via e-mail.
H) The reports are then disseminated to various clients viae-mail and made available to operational staff via aninternal web site.
APPENDIX E
CANADIAN AUTOMATED WARNING PERFORMANCE
MEASUREMENT SYSTEM

PUBLIC WEATHER FORECAST PERFORMANCEMEASUREMENT PROJECT (PWFPM)
An automatic national public weather forecast performancemeasurement system with three main objectives:• To provide national ongoing reports to the public of our
forecast performance.
• To provide forecasters with information on where theyadd significant value, in order for them to concentratetheir efforts on these cases or parameters.
• To provide statistical information on the performance of the Canadian public forecast program to regional and national managers who administrate the program.
APPENDIX F
CANADIAN AUTOMATED ROUTINE PUBLIC FORECAST
PERFORMANCE MEASUREMENT SYSTEM
Figure F1 A System Integrated with Forecast Operations

APPENDIX G
PERFORMANCE AT VARYING LEVELS OF ACCURACY

The renewal of the Wind Chill Program in North Americatook a fairly lengthy and rigorous process route. The twomain objectives of the program were that of bringing into theprogram the latest available science while at the same timecreating a forecast product that was easily understood andeffective in providing citizens with useable information. Theprocess started with some negative feedback, some via thepublic media, on the accuracy and the usability of theprogram. This was responded to by some public opinionresearch (surveys and focus groups) in Canada. It was discov-ered that while there was a widely held view that wind chillwas a very important forecast element for the cold seasonthere was a feeling that the severity was overstated in forecastsand warnings and the program, in Canada at least, waspresented in a confusing manner thereby limiting its usefulness.
A literature review was undertaken and published. AnInternet Workshop on Wind Chill followed this with exten-sive international participation and papers frominternational experts solicited. With this level of interestraised the International Society of Biometeorology estab-lished Commission 6 on a Universal Thermal Climate Index.Shortly thereafter the US Office of the Federal Coordinatorof Meteorology established a Joint Action Group on ThermalIndices (JAG/TI) with representation from the US FederalGovernment, the Canadian Federal Government and knownexperts in the universities and other communities. The firstgoal of the JAG/TI was to upgrade and standardize the indexused for determining wind chill impact. This stimulatedcollaboration on additional research including trials onhuman subjects that were undertaken at the Defense R&DCanada climate chamber facilities. This research produced anew equation for Wind Chill using a temperature scale.
With a new equation in hand a forecasting program hadto be rebuilt in Canada and the United States along with apublic education program. The public education programwas helped by a high degree of media attention. Once thenew equation was made available both the new forecastingprogram and standards and the educational program were
developed and implemented in a time interval of threemonths.The rapidity with which it was possible to implementa renewed program benefited greatly from the rigorousprocess that preceded it. This was, indeed, a good examplewhere positive international collaboration assisted in thedevelopment and implementation of a common program.
Large variations in the climate of the different regions ofCanada made setting warning levels problematic, especiallyafter observing much variability in individual response towind chill during the human trials. Accommodation wasmade, with regard to human adaptation, - behavioural andphysiological - to local climate regimes. The media and thegeneral public required an enhanced understanding of theimpact of wind chill so another problem addressed was theuse of “minutes to freeze” included in warning messages.Since individual variability was shown to be quite high, thedecision was made to focus on the more vulnerable propor-tions of the population. This most vulnerable portion isbased on the most susceptible 5% from the human trials.Accordingly, new procedures for forecast and reporting oper-ations were implemented and a public education programtailored to address these aspects.
It is important to note that the approach currentlyadopted in the North American context is one of continuousimprovement in that further research on ‘minutes to freeze’and radiation effects will result in further future modifica-tions to the program.A review of the first winter of operationof the renewed wind chill program undertaken in the springof 2002 along with further human trials will allow for furtherrefinement of the minutes to freeze and its customization forthe different climatic regimes of Canada.If information of theeffect of wind chill on infants, children and the elderlybecomes available, it too will be incorporated into the windchill program.
More information on the wind chill program in Canadacan be found at the following web site: http://www.msc.ec.gc.ca/windchill/index_e.cfm. Also at this sitecharts, on-line calculators and downloadable calculators areavailable.
APPENDIX H
RENEWAL OF THE NORTH AMERICAN
WIND CHILL PROGRAM

Moving through the value chain from raw NWP and pre-processing to post processing and eventually the customerthrough one data base that may also include raw products forthose that want them such as upper winds for Aviation.Meteorological observations, if included, would be a boxbefore NWP.
Post processing is the most interesting area that shouldhelp overcome known model deficiencies such as boundarylayer problems. Doctoring high enough up in the stream can
save duplication downstream at the local production end.The whole diagram fits the Met Office operations and FSSSIis the Met Office site-specific forecasting system using a one-dimensional add-on model. Field modification is the attemptto correct data streams high up in the chain.
This value added chain is important and quantifying howmuch value is added at the various points in the chain will beimportant in management decision making, or where toprioritize resources and role of forecaster in the future, etc.
APPENDIX I
THE MET OFFICE “ADDED VALUE CHAIN”

APPENDIX J
AUTOMATED “SCRIBE”VS. FORECASTER ACCURACY

APPENDIX K
FROM THE ANNUAL REPORT OF THE
NEW ZEALAND METSERVICE

APPENDIX L
FT. SMITH AND VAN BUREN, ARKANSAS, TORNADO OF APRIL
21, 1996 NATURAL DISASTER SURVEY REPORT – EXECUTIVE
SUMMARY AND TABLE OF CONTENTS-NWS-NOAA-USA

47Supplementary Guidelines on Performance Assessment of Public Weather Services

48 Appendix L

A report of severe weather is comprised of event data. Inthe table on the following page the event data is brokenup into field names and corresponding values (columns2 & 3). An example of each field value is included(column 4). The remaining columns (4-7) provide the
specifications for the field values. The intent here is tocapture the essence of the severe weather report and atthe same time organize the information in such away asto facilitate the verification of the severe weather warn-ing programme.
APPENDIX M
SEVERE WEATHER EVENT DATA DEFINITION

50 Appendix MC
ateg
ory
Fiel
d N
ame
Fiel
d V
alue
(s)
Fiel
d V
alue
Exa
mp
les
Form
atU
nits
Com
men
t
Whe
nev
entd
ata_
date
Any
val
id d
ate
2001
-07-
22Y
YY
Y-M
M-D
DR
equi
red
even
tdat
a_st
art_
time
Any
val
id ti
me
17:3
0hh
:mm
hour
:min
ute
Req
uire
d24
hou
r cl
ock
even
tdat
a_du
ratio
nTi
me
perio
d00
:30
hh:m
mho
ur:m
inut
eR
equi
red
even
tdat
a_tim
e_zo
neU
TCU
TCal
pha
strin
g R
equi
red
Whe
rem
sc_r
egio
n_ab
brev
PY
RO
Ral
pha
strin
gR
equi
red
PN
R
OR
QR
AR
publ
ic_f
cst_
rgn_
nam
eA
ny v
alid
pub
lic fo
reca
st re
gion
nam
eLO
ND
ON
-MID
DLE
SE
X-al
phan
umer
ic
OXF
OR
Dst
ring
publ
ic_m
eso_
scal
e_bl
ank
OXF
OR
D C
OU
NTY
alph
anum
eric
ar
ea_n
ame
Any
val
id m
eso-
scal
e ar
ea n
ame
strin
g
even
tdat
a_la
titud
eA
ny v
alid
latit
ude
43:0
1 N
dd:m
m N
degr
ee:m
inut
e N
Req
uire
d
even
tdat
a_lo
ngitu
deA
ny v
alid
long
itude
81:0
9 W
dd:m
m W
degr
ee:m
inut
e W
Req
uire
d
even
tdat
a_lo
catio
nbl
ank
10 K
M N
W L
ON
DO
Nal
phan
umer
ic
Any
val
id lo
catio
nst
ring
publ
ic_f
cst_
rgn_
split
_nam
ebl
ank
NO
RTH
ER
N L
ON
DO
N-
alph
anum
eric
R
equi
red
ifA
ny v
alid
pub
lic fo
reca
st re
gion
M
IDD
LES
EX-
OXF
OR
Dst
ring
split
(s) e
xist
split
nam
e(s)
publ
ic_m
eso_
scal
e_ar
ea_
blan
kS
OU
RTH
ER
N H
ALF
al
phan
umer
ic
Req
uire
d if
split
_nam
eA
ny v
alid
mes
o-sc
ale
area
spl
it na
me(
s)C
OU
NTY
OXF
OR
Dst
ring
split
(s) e
xist
s
Wha
tev
entd
ata_
type
Sev
ere
Thun
ders
torm
Sev
ere
Thun
ders
torm
alph
a st
ring
Req
uire
dS
tron
g W
inds
Hea
vy R
ainf
all
Hea
vy S
now
fall
Bliz
zard
Free
zing
Rai
nFr
eezi
ng D
rizzl
eB
low
ing
Sno
wS
now
squa
llW
ind
Chi
llLe
s S
uete
s W
inds
Fros
t

51Supplementary Guidelines on Performance Assessment of Public Weather ServicesC
ateg
ory
Fiel
d N
ame
Fiel
d V
alue
(s)
Fiel
d V
alue
Exa
mp
les
Form
atU
nits
Com
men
t
even
tdat
a_to
rnad
obl
ank
Torn
ado
alph
a st
ing
Torn
ado
even
tdat
a_fu
jita_
scal
ebl
ank
F1F{
num
eric
}F0 F1 F2 F3 F4 F5
even
tdat
a_ts
tm_w
ind
blan
k11
0 km
/hal
phan
umer
ic
km/h
num
ber
km/h
[E]
strin
g
even
tdat
a_ha
il_si
zebl
ank
20 m
m h
ail E
alph
anum
eric
m
illim
etre
snu
mbe
r m
m h
ail [
E]
strin
g
even
tdat
a_ha
il_de
pth
blan
k35
mm
hai
l dep
th E
alph
anum
eric
m
illim
etre
snu
mbe
r m
m h
ail d
epth
[E]
strin
g
even
tdat
a_ra
inra
tebl
ank
50 m
m o
f rai
n in
2 h
rsal
phan
umer
ic
milli
met
res
& h
our
Sho
rt te
rmnu
mbe
r m
m o
f rai
n in
num
ber
hrs
[E]
strin
g
even
tdat
a_ra
in_t
otal
blan
k15
0 m
m o
f rai
n in
24
hrs
alph
anum
eric
m
illim
etre
sLo
ng te
rmnu
mbe
r m
m o
f rai
n in
num
ber
hrs
[E]
strin
g
even
tdat
a_sn
ow_t
otal
blan
k18
cm
of s
now
in 2
4 hr
s E
alph
anum
eric
ce
ntim
eter
s &
hou
rsLo
ng te
rmnu
mbe
r cm
of s
now
in n
umbe
r hr
s [E
]st
ring
even
tdat
a_w
ind_
stea
dybl
ank
65 k
m/h
for
mor
e al
phan
umer
ic
kilo
met
ers/
hour
num
ber
km/h
[for
mor
e th
at n
umbe
r th
an 2
hrs
strin
g&
[hou
rs]
hrs]
[E]
even
tdat
a_w
ind_
gust
blan
k95
km
/h E
alph
anum
eric
kilo
met
ers/
hour
num
ber
km/h
[for
mor
e th
an n
umbe
r hr
s] [E
]st
ring
& [h
ours
]
even
tdat
a_vi
sibi
lity
blan
k0.
5 km
in b
s fo
r m
ore
alph
anum
eric
kilo
met
ers
&sn
…sn
ownu
mbe
r km
in s
n/sg
/bs/
f/bd
[for
mor
e th
an 6
hrs
Est
ring
[hou
rs]
sg…
snow
gra
inth
an n
umbe
r hr
s] [E
]bs
…bl
owin
g sn
owf…
fog
bd…
blow
ing
dust
even
tdat
a_w
indc
hill
blan
k-4
5 C
for
mor
e th
an
alph
anum
eric
C &
[hou
rs]
num
ber
C [f
or m
ore
than
num
ber
hrs]
[E]
10 h
rs E
strin
g
even
tdat
a_fre
ezin
g_pr
ecip
blan
kzr
for
mor
e th
an 3
hrs
Eal
phan
umer
icho
urs
zr…
freez
ing
rain
zr/z
l for
mor
e th
an n
umbe
r hr
s [E
]st
ring
zl…fre
ezin
gdr
izzle
even
tdat
a_fre
ezin
g_pr
ecip
_bl
ank
8 m
m ic
e ac
cret
ion
Eal
phan
umer
icm
illim
etre
sac
cum
num
ber
mm
ice
accr
etio
n [E
]st
ring

52 Appendix MC
ateg
ory
Fiel
d N
ame
Fiel
d V
alue
(s)
Fiel
d V
alue
Exa
mp
les
Form
atU
nits
Com
men
t
even
tdat
a_ge
n_co
mm
ents
blan
kal
phan
umer
icte
xtB
arn
dam
age
tree
s do
wn
strin
g
even
tdat
a_da
mag
eW
ind
Win
dal
pha
strin
gH
ail
Floo
ding
Ligh
tnin
gFr
eezi
ng P
reci
pita
tion
Rep
ort
even
tdat
a_co
ntac
t_so
urce
EC
em
ploy
eeC
AN
WA
RN
alph
a st
ring
New
spap
erP
olic
eP
ublic
Med
iaC
AN
WA
RN
Wea
ther
Wat
cher
Clim
ate
Obs
erva
tion
Oth
er
even
tdat
a_co
ntac
t_na
me
blan
kJo
e S
oake
ral
pha
strin
gna
me
even
tdat
a_co
ntac
t_bl
ank
emai
l:joe
.soa
ker@
alph
anum
eric
com
mun
icat
eem
ail:
addr
ess
sym
patic
o.ca
strin
gvo
ice:
#vo
ice:
444-
333-
5555
fax:
#fa
x:44
4-22
2-11
11
even
tdat
a_re
port
_file
d_da
tebl
ank
2001
-07-
25Y
YY
Y-M
M-D
DA
ny v
alid
dat
e
even
tdat
a_re
port
_file
d_tim
ebl
ank
13:3
0hh
:mm
hour
:min
ute
Any
val
id ti
me
24 h
our
cloc
k
even
tdat
a_qc
blan
kve
tted
alph
abl
ank
mea
nsve
tted
strin
gre
port
is n
otve
tted
even
tdat
a_re
cord
ed_b
ybl
ank
Ted
Thun
derh
ead
alph
a st
ring
nam
e
Not
e:
1) “
bla
nk”
optio
n m
eans
the
fiel
d v
alue
can
be
emp
ty
2) […
] ind
icat
es t
his
par
t of
the
fiel
d v
alue
is o
ptio
nal
3) [E
] mea
ns e
stim
ated
and
op
tiona
l