sunline transit agency advanced technology fuel cell bus
TRANSCRIPT
NREL is a national laboratory of the U.S. Department of Energy, Office of Energy Efficiency & Renewable Energy, operated by the Alliance for Sustainable Energy, LLC.
Contract No. DE-AC36-08GO28308
SunLine Transit Agency Advanced Technology Fuel Cell Bus Evaluation: Third Results Report Leslie Eudy National Renewable Energy Laboratory
Kevin Chandler Battelle
Technical Report NREL/TP-5600-54427 May 2012
NREL is a national laboratory of the U.S. Department of Energy, Office of Energy Efficiency & Renewable Energy, operated by the Alliance for Sustainable Energy, LLC.
National Renewable Energy Laboratory 15013 Denver West Parkway Golden, Colorado 80401 303-275-3000 • www.nrel.gov
Contract No. DE-AC36-08GO28308
SunLine Transit Agency Advanced Technology Fuel Cell Bus Evaluation: Third Results Report Leslie Eudy National Renewable Energy Laboratory
Kevin Chandler Battelle
Prepared under Task No. H270.8150
Technical Report NREL/TP-5600-54427 May 2012
NOTICE
This report was prepared as an account of work sponsored by an agency of the United States government. Neither the United States government nor any agency thereof, nor any of their employees, makes any warranty, express or implied, or assumes any legal liability or responsibility for the accuracy, completeness, or usefulness of any information, apparatus, product, or process disclosed, or represents that its use would not infringe privately owned rights. Reference herein to any specific commercial product, process, or service by trade name, trademark, manufacturer, or otherwise does not necessarily constitute or imply its endorsement, recommendation, or favoring by the United States government or any agency thereof. The views and opinions of authors expressed herein do not necessarily state or reflect those of the United States government or any agency thereof.
Available electronically at http://www.osti.gov/bridge
Available for a processing fee to U.S. Department of Energy and its contractors, in paper, from:
U.S. Department of Energy Office of Scientific and Technical Information P.O. Box 62 Oak Ridge, TN 37831-0062 phone: 865.576.8401 fax: 865.576.5728 email: mailto:[email protected]
Available for sale to the public, in paper, from:
U.S. Department of Commerce National Technical Information Service 5285 Port Royal Road Springfield, VA 22161 phone: 800.553.6847 fax: 703.605.6900 email: [email protected] online ordering: http://www.ntis.gov/help/ordermethods.aspx
Cover Photos: (left to right) PIX 16416, PIX 17423, PIX 16560, PIX 17613, PIX 17436, PIX 17721. Bus photo by Leslie Eudy, NREL.
Printed on paper containing at least 50% wastepaper, including 10% post consumer waste.
iii
Acknowledgements
This evaluation at SunLine Transit Agency would not have been possible without the support and cooperation of many people. The authors thank the following:
U.S. Department of Energy Jason Marcinkoski John Garbak U.S. Federal Transit Administration Walter Kulyk Christina Gikakis National Renewable Energy Laboratory Keith Wipke George Sverdrup SunLine Transit Agency C. Mikel Oglesby Tommy Edwards Polo Del Toro Mike Hayes Mike Morrow Ballard Power Systems Jeff Grant Daljit Bawa Byron Somerville Bluways Rob Del Core Harry Meyer Photo credit for all pictures in the report: L. Eudy, NREL
iv
Acronyms and Abbreviations
AQMD Air Quality Management District AT advanced technology CARB California Air Resources Board CNG compressed natural gas DGE diesel gallon equivalent DOE U.S. Department of Energy FCB fuel cell bus ft feet FTA Federal Transit Administration GGE gasoline gallon equivalent HHICE hydrogen hybrid internal combustion engine hp horsepower HVAC heating, ventilation, and air conditioning in. inches kg kilograms kW kilowatts lb pounds MBRC miles between roadcalls mpDGE miles per diesel gallon equivalent mph miles per hour NFCBP National Fuel Cell Bus Program NREL National Renewable Energy Laboratory PMI preventive maintenance inspection psi pounds per square inch RC roadcall
v
Executive Summary
SunLine Transit Agency provides public transit services to the Coachella Valley area of California. SunLine has demonstrated hydrogen and fuel cell bus technologies for more than 10 years. This report describes operations at SunLine for a prototype fuel cell bus and five compressed natural gas (CNG) buses.
In May 2010, SunLine began demonstrating the Advanced Technology (AT) bus—a new-generation fuel cell bus developed by Bluways, Ballard Power Systems, and New Flyer. The AT fuel cell bus has a hybrid electric propulsion system based on the Siemens ELFA system, integrated by Bluways with Ballard’s newest version fuel cell power system, and lithium-based hybrid batteries. The design incorporates the latest improvements to reduce weight and increase reliability and performance. Since it first went into service in May 2010, the fuel cell bus has operated nearly 32,000 miles and has accumulated more than 2,500 fuel cell system hours (for an average operating speed of 12.3 mph). The operation of this new fuel cell bus at SunLine has been limited by air conditioning issues during the hot desert summer, some fuel cell power system issues, and some bus body work.
The U.S. Department of Energy’s (DOE) National Renewable Energy Laboratory (NREL) is working with SunLine to evaluate the bus in real-world service to document the results and help determine the progress toward technology readiness. NREL uses a standard data-collection and analysis protocol originally developed for DOE heavy-duty vehicle evaluations. NREL has previously published two reports documenting the operation of the fuel cell bus in service. This report provides a summary of the results with a focus on the bus operation from July 2011 through January 2012.
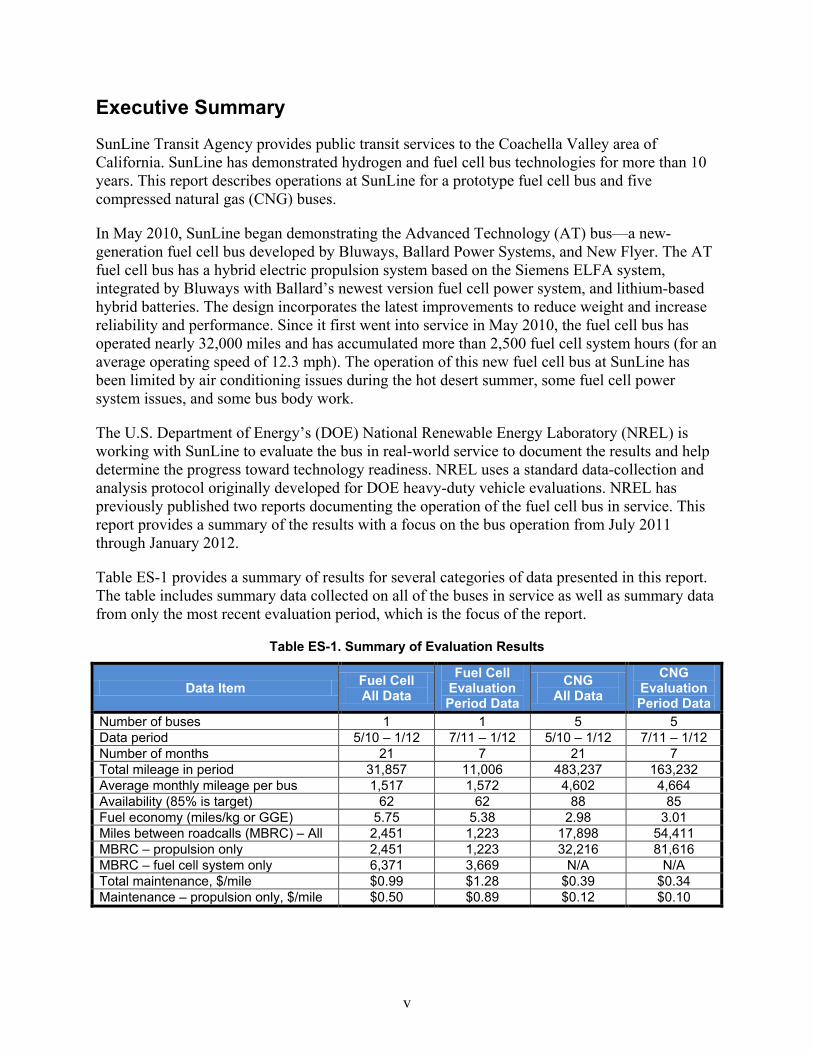
Table ES-1 provides a summary of results for several categories of data presented in this report. The table includes summary data collected on all of the buses in service as well as summary data from only the most recent evaluation period, which is the focus of the report.
Table ES-1. Summary of Evaluation Results
Data Item Fuel Cell All Data
Fuel Cell Evaluation Period Data
CNG All Data
CNG Evaluation Period Data
Number of buses 1 1 5 5 Data period 5/10 – 1/12 7/11 – 1/12 5/10 – 1/12 7/11 – 1/12 Number of months 21 7 21 7 Total mileage in period 31,857 11,006 483,237 163,232 Average monthly mileage per bus 1,517 1,572 4,602 4,664 Availability (85% is target) 62 62 88 85 Fuel economy (miles/kg or GGE) 5.75 5.38 2.98 3.01 Miles between roadcalls (MBRC) – All 2,451 1,223 17,898 54,411 MBRC – propulsion only 2,451 1,223 32,216 81,616 MBRC – fuel cell system only 6,371 3,669 N/A N/A Total maintenance, $/mile $0.99 $1.28 $0.39 $0.34 Maintenance – propulsion only, $/mile $0.50 $0.89 $0.12 $0.10
vi
Table of Contents
Introduction ..................................................................................................................................... 1
NREL Evaluations....................................................................................................................... 1 Host Site Profile: SunLine........................................................................................................... 1 Fuel Cell Bus Evaluation at SunLine .......................................................................................... 1
Hydrogen and CNG Fueling ........................................................................................................... 1 Evaluation Results .......................................................................................................................... 7
Route Assignments ...................................................................................................................... 7 Bus Use and Availability ............................................................................................................. 7 Fuel Economy and Cost .............................................................................................................. 9 Maintenance Analysis ............................................................................................................... 10 Roadcall Analysis ...................................................................................................................... 14
What’s Next for SunLine ................................................................................................................ 7 Contacts......................................................................................................................................... 17 References and Related Reports ................................................................................................... 18
SunLine ..................................................................................................................................... 18 General ...................................................................................................................................... 19 AC Transit ................................................................................................................................. 19 BurbankBus ............................................................................................................................... 20 Connecticut Transit ................................................................................................................... 20 Santa Clara Valley Transportation Authority ............................................................................ 20
1
Introduction
SunLine Transit Agency has operated its advanced technology (AT) fuel cell bus since May 2010. The AT fuel cell bus, built by New Flyer, features a Bluways hybrid drive powered by a Ballard fuel cell power system. SunLine is collaborating with the U.S. Department of Energy’s (DOE) National Renewable Energy Laboratory (NREL) to evaluate the bus in revenue service. NREL has published two reports documenting SunLine’s experience and the performance of the bus including data collected from May 2010 through June 2011.1,2 This report provides an update to the previous reports and covers data collected through January 2012 as well as a summary of the hydrogen station operation. This station also provides fuel to an additional fuel cell bus.
NREL Evaluations NREL has been evaluating alternative fuel and advanced propulsion transit buses for DOE and the U.S. Department of Transportation’s Federal Transit Administration (FTA) since the early 1990s. NREL first evaluated hydrogen fuel cell transit buses in 2000 and continued with a series of evaluations at five transit agencies documenting results from a total of 26 buses. These evaluations focus on determining the status of hydrogen and fuel cell systems and the corresponding infrastructure in transit applications to help DOE and FTA assess the progress toward technology readiness. NREL uses a standard data-collection and analysis protocol originally developed for DOE heavy-duty vehicle evaluations. This protocol was documented in a joint evaluation plan for transit bus evaluations.3
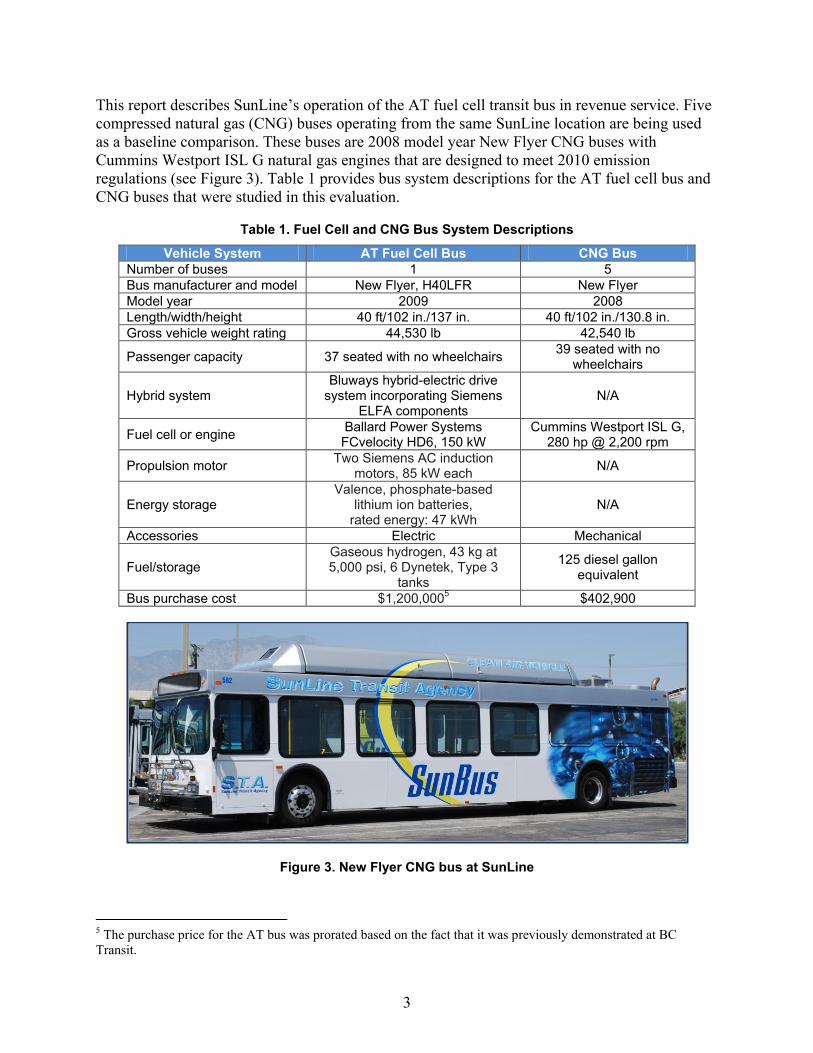
Host Site Profile: SunLine SunLine Transit Agency provides public transit services to Southern California’s Coachella Valley. Headquartered in Thousand Palms, California, SunLine’s service area covers more than 1,100 square miles including nine member cities and a portion of Riverside County. SunLine has proactively adopted clean fuel technologies in its fleet, beginning with complete fleet implementation of compressed natural gas (CNG) buses in 1994. Since then, the agency has tested many advanced technologies, including buses that run on a blend of hydrogen and CNG, battery electric power, and fuel cells.
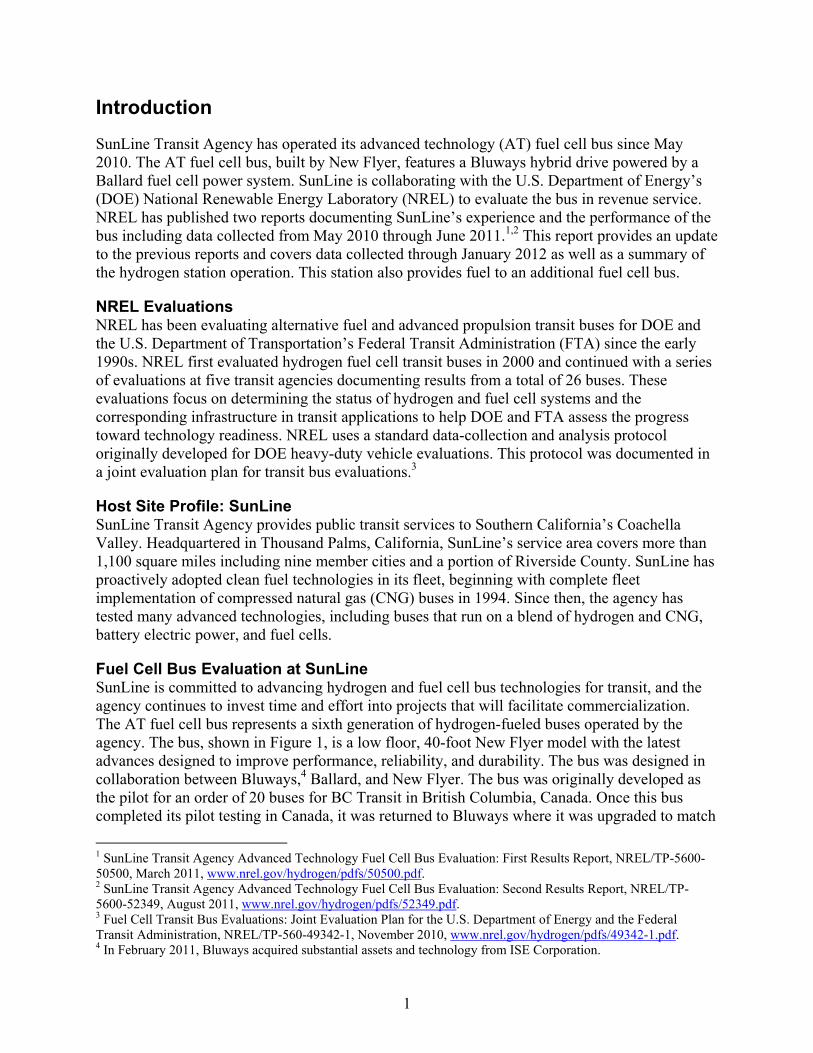
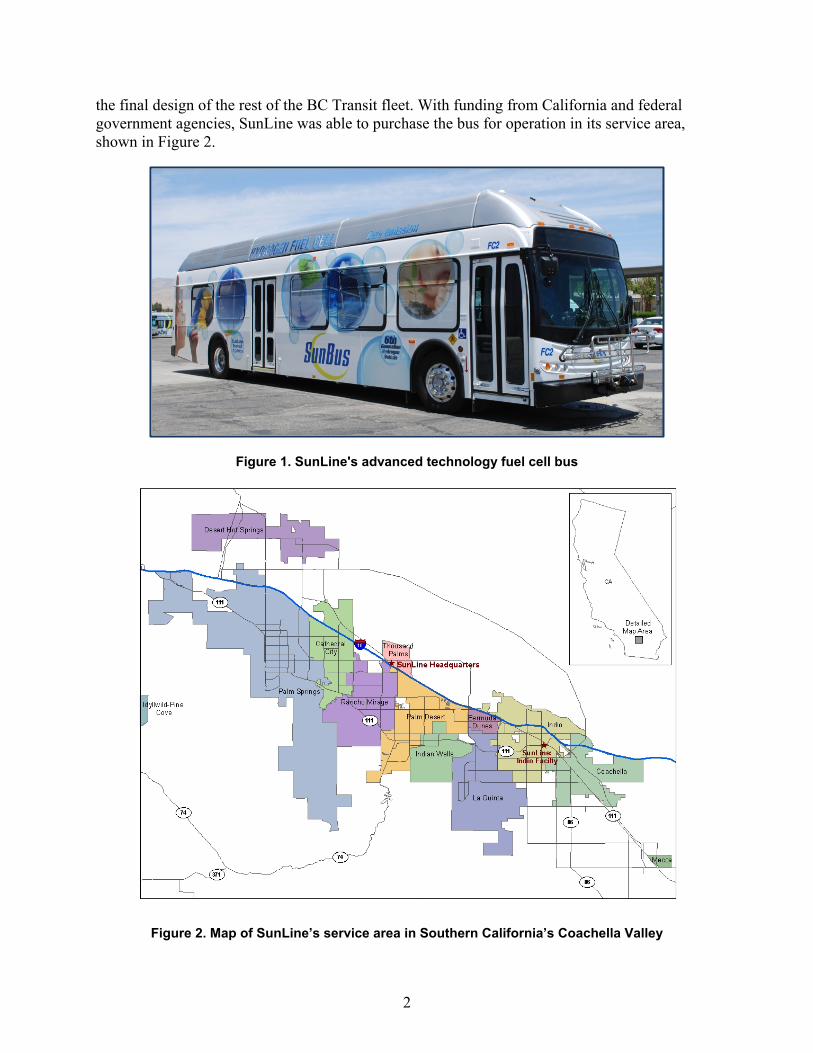
Fuel Cell Bus Evaluation at SunLine SunLine is committed to advancing hydrogen and fuel cell bus technologies for transit, and the agency continues to invest time and effort into projects that will facilitate commercialization. The AT fuel cell bus represents a sixth generation of hydrogen-fueled buses operated by the agency. The bus, shown in Figure 1, is a low floor, 40-foot New Flyer model with the latest advances designed to improve performance, reliability, and durability. The bus was designed in collaboration between Bluways,4 Ballard, and New Flyer. The bus was originally developed as the pilot for an order of 20 buses for BC Transit in British Columbia, Canada. Once this bus completed its pilot testing in Canada, it was returned to Bluways where it was upgraded to match 1 SunLine Transit Agency Advanced Technology Fuel Cell Bus Evaluation: First Results Report, NREL/TP-5600-50500, March 2011, www.nrel.gov/hydrogen/pdfs/50500.pdf. 2 SunLine Transit Agency Advanced Technology Fuel Cell Bus Evaluation: Second Results Report, NREL/TP-5600-52349, August 2011, www.nrel.gov/hydrogen/pdfs/52349.pdf. 3 Fuel Cell Transit Bus Evaluations: Joint Evaluation Plan for the U.S. Department of Energy and the Federal Transit Administration, NREL/TP-560-49342-1, November 2010, www.nrel.gov/hydrogen/pdfs/49342-1.pdf. 4 In February 2011, Bluways acquired substantial assets and technology from ISE Corporation.
2
the final design of the rest of the BC Transit fleet. With funding from California and federal government agencies, SunLine was able to purchase the bus for operation in its service area, shown in Figure 2.
Figure 1. SunLine's advanced technology fuel cell bus
Figure 2. Map of SunLine’s service area in Southern California’s Coachella Valley
3
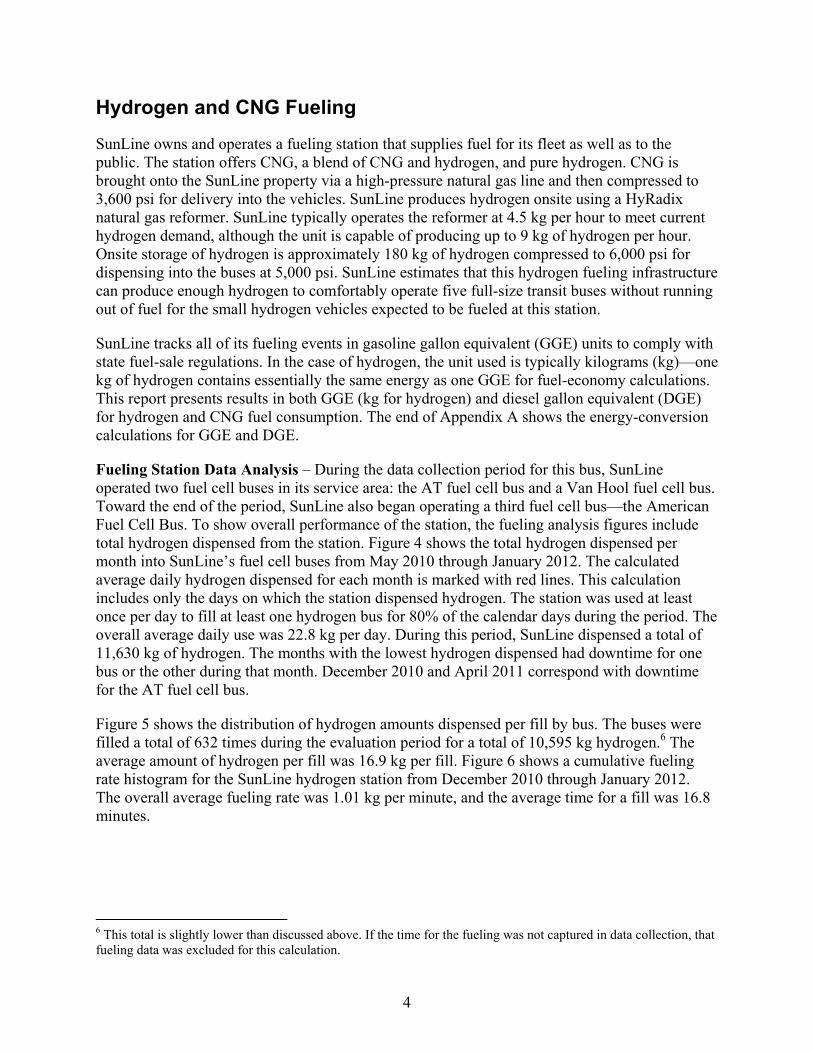
This report describes SunLine’s operation of the AT fuel cell transit bus in revenue service. Five compressed natural gas (CNG) buses operating from the same SunLine location are being used as a baseline comparison. These buses are 2008 model year New Flyer CNG buses with Cummins Westport ISL G natural gas engines that are designed to meet 2010 emission regulations (see Figure 3). Table 1 provides bus system descriptions for the AT fuel cell bus and CNG buses that were studied in this evaluation.
Table 1. Fuel Cell and CNG Bus System Descriptions
Vehicle System AT Fuel Cell Bus CNG Bus Number of buses 1 5 Bus manufacturer and model New Flyer, H40LFR New Flyer Model year 2009 2008 Length/width/height 40 ft/102 in./137 in. 40 ft/102 in./130.8 in. Gross vehicle weight rating 44,530 lb 42,540 lb
Passenger capacity 37 seated with no wheelchairs 39 seated with no wheelchairs
Hybrid system Bluways hybrid-electric drive
system incorporating Siemens ELFA components
N/A
Fuel cell or engine Ballard Power Systems FCvelocity HD6, 150 kW
Cummins Westport ISL G, 280 hp @ 2,200 rpm
Propulsion motor Two Siemens AC induction motors, 85 kW each N/A
Energy storage Valence, phosphate-based
lithium ion batteries, rated energy: 47 kWh
N/A
Accessories Electric Mechanical
Fuel/storage Gaseous hydrogen, 43 kg at 5,000 psi, 6 Dynetek, Type 3
tanks
125 diesel gallon equivalent
Bus purchase cost $1,200,0005 $402,900
Figure 3. New Flyer CNG bus at SunLine
5 The purchase price for the AT bus was prorated based on the fact that it was previously demonstrated at BC Transit.
4
Hydrogen and CNG Fueling
SunLine owns and operates a fueling station that supplies fuel for its fleet as well as to the public. The station offers CNG, a blend of CNG and hydrogen, and pure hydrogen. CNG is brought onto the SunLine property via a high-pressure natural gas line and then compressed to 3,600 psi for delivery into the vehicles. SunLine produces hydrogen onsite using a HyRadix natural gas reformer. SunLine typically operates the reformer at 4.5 kg per hour to meet current hydrogen demand, although the unit is capable of producing up to 9 kg of hydrogen per hour. Onsite storage of hydrogen is approximately 180 kg of hydrogen compressed to 6,000 psi for dispensing into the buses at 5,000 psi. SunLine estimates that this hydrogen fueling infrastructure can produce enough hydrogen to comfortably operate five full-size transit buses without running out of fuel for the small hydrogen vehicles expected to be fueled at this station.
SunLine tracks all of its fueling events in gasoline gallon equivalent (GGE) units to comply with state fuel-sale regulations. In the case of hydrogen, the unit used is typically kilograms (kg)—one kg of hydrogen contains essentially the same energy as one GGE for fuel-economy calculations. This report presents results in both GGE (kg for hydrogen) and diesel gallon equivalent (DGE) for hydrogen and CNG fuel consumption. The end of Appendix A shows the energy-conversion calculations for GGE and DGE.
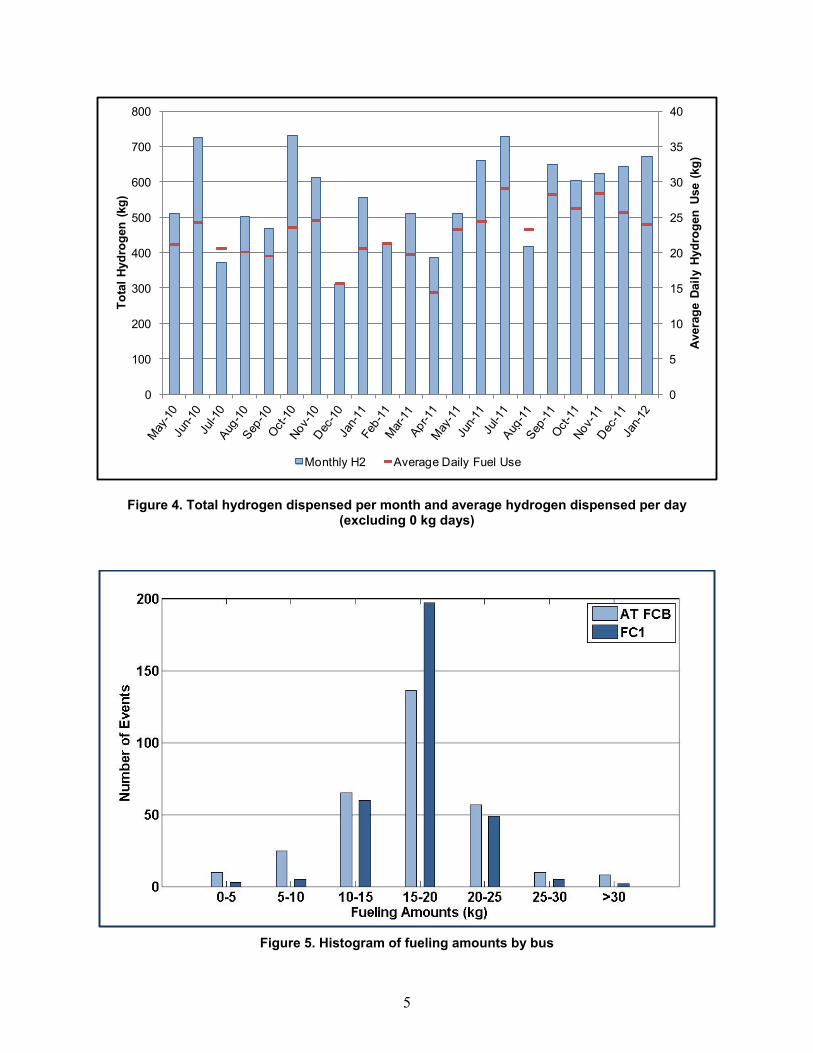
Fueling Station Data Analysis – During the data collection period for this bus, SunLine operated two fuel cell buses in its service area: the AT fuel cell bus and a Van Hool fuel cell bus. Toward the end of the period, SunLine also began operating a third fuel cell bus—the American Fuel Cell Bus. To show overall performance of the station, the fueling analysis figures include total hydrogen dispensed from the station. Figure 4 shows the total hydrogen dispensed per month into SunLine’s fuel cell buses from May 2010 through January 2012. The calculated average daily hydrogen dispensed for each month is marked with red lines. This calculation includes only the days on which the station dispensed hydrogen. The station was used at least once per day to fill at least one hydrogen bus for 80% of the calendar days during the period. The overall average daily use was 22.8 kg per day. During this period, SunLine dispensed a total of 11,630 kg of hydrogen. The months with the lowest hydrogen dispensed had downtime for one bus or the other during that month. December 2010 and April 2011 correspond with downtime for the AT fuel cell bus.
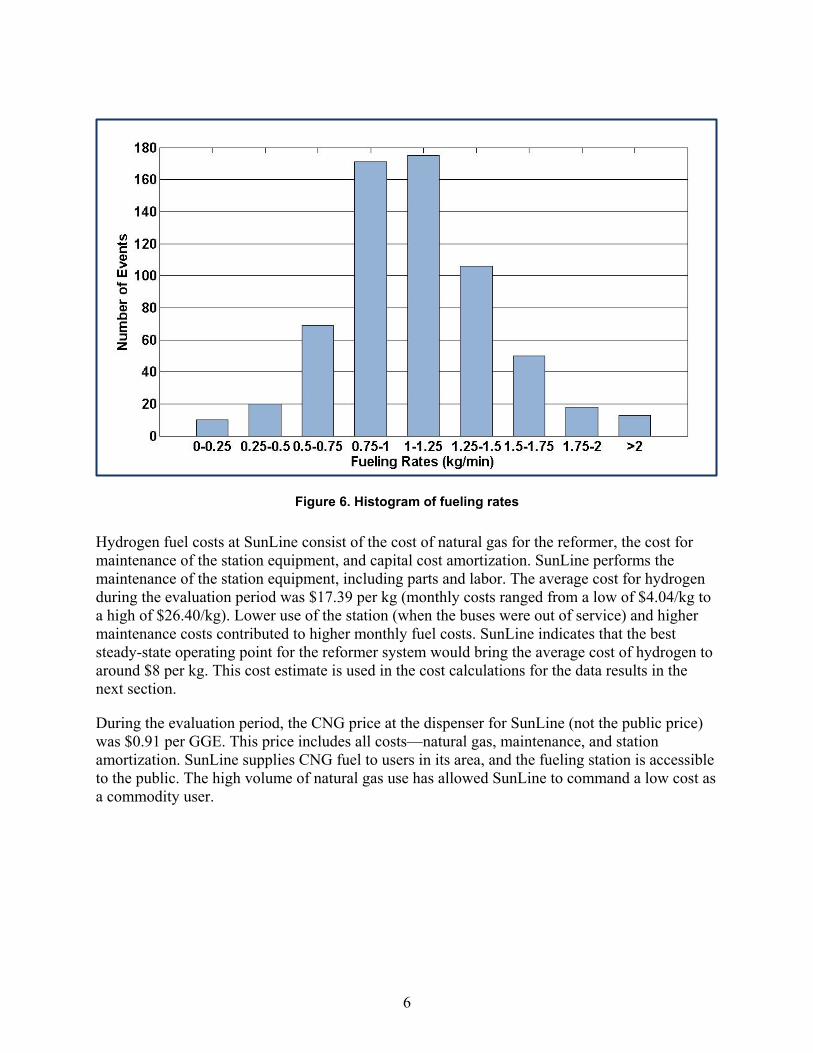
Figure 5 shows the distribution of hydrogen amounts dispensed per fill by bus. The buses were filled a total of 632 times during the evaluation period for a total of 10,595 kg hydrogen.6 The average amount of hydrogen per fill was 16.9 kg per fill. Figure 6 shows a cumulative fueling rate histogram for the SunLine hydrogen station from December 2010 through January 2012. The overall average fueling rate was 1.01 kg per minute, and the average time for a fill was 16.8 minutes.
6 This total is slightly lower than discussed above. If the time for the fueling was not captured in data collection, that fueling data was excluded for this calculation.
5
Figure 4. Total hydrogen dispensed per month and average hydrogen dispensed per day (excluding 0 kg days)
Figure 5. Histogram of fueling amounts by bus
0
5
10
15
20
25
30
35
40
0
100
200
300
400
500
600
700
800
Aver
age
Daily
Hyd
roge
n Us
e (k
g)
Tota
l Hyd
roge
n (k
g)
Monthly H2 Average Daily Fuel Use
6
Figure 6. Histogram of fueling rates
Hydrogen fuel costs at SunLine consist of the cost of natural gas for the reformer, the cost for maintenance of the station equipment, and capital cost amortization. SunLine performs the maintenance of the station equipment, including parts and labor. The average cost for hydrogen during the evaluation period was $17.39 per kg (monthly costs ranged from a low of $4.04/kg to a high of $26.40/kg). Lower use of the station (when the buses were out of service) and higher maintenance costs contributed to higher monthly fuel costs. SunLine indicates that the best steady-state operating point for the reformer system would bring the average cost of hydrogen to around $8 per kg. This cost estimate is used in the cost calculations for the data results in the next section.
During the evaluation period, the CNG price at the dispenser for SunLine (not the public price) was $0.91 per GGE. This price includes all costs—natural gas, maintenance, and station amortization. SunLine supplies CNG fuel to users in its area, and the fueling station is accessible to the public. The high volume of natural gas use has allowed SunLine to command a low cost as a commodity user.
7
Evaluation Results
SunLine has operated the AT fuel cell bus in service since May 27, 2010. The focus of this report is the most recent operating data collected on the fuel cell and CNG buses from July 2011 through January 2012. Appendix A provides a summary of all data. Appendix B provides a data summary in SI (metric) units.
Route Assignments In general, SunLine’s buses are randomly dispatched on its routes. The overall system average speed is 13.9 mph. The AT fuel cell bus was used exclusively on Line 53 (average speed of 12.8 mph). The five CNG buses were randomly dispatched with the majority of time (82%) split between Line 111 (38% of time; 13.9 mph average speed), Line 14 (20% of time; 14.6 mph average speed), and Line 30 (25% of time; 10.8 mph average speed). Based on the dispatching information, the CNG buses operated at a slightly lower average speed than the fuel cell bus did during the evaluation period.
Bus Use and Availability Bus use and availability indicates reliability. Lower bus use may indicate downtime for maintenance or purposeful reduction of planned work for the buses. This section provides a summary of bus use and availability for the fuel cell and CNG buses.
The AT fuel cell bus has planned service of up to seven days per week. For this bus, total mileage accumulation for the evaluation period was 11,006 miles, and the fuel cell system accumulated more than 800 hours. For in-service days during the evaluation period, the AT fuel cell bus averaged 7.4 hours per day with a maximum of 12.9 hours in one day.
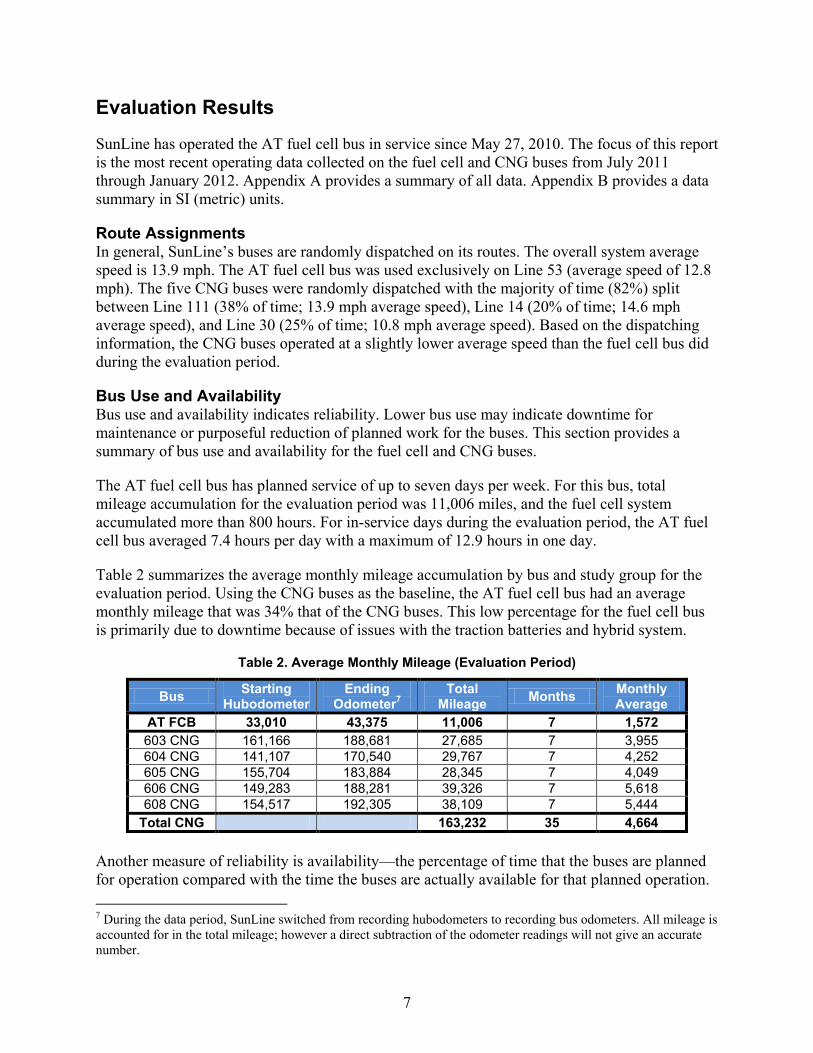
Table 2 summarizes the average monthly mileage accumulation by bus and study group for the evaluation period. Using the CNG buses as the baseline, the AT fuel cell bus had an average monthly mileage that was 34% that of the CNG buses. This low percentage for the fuel cell bus is primarily due to downtime because of issues with the traction batteries and hybrid system.
Table 2. Average Monthly Mileage (Evaluation Period)
Bus Starting Hubodometer
Ending Odometer7
Total Mileage Months Monthly
Average AT FCB 33,010 43,375 11,006 7 1,572 603 CNG 161,166 188,681 27,685 7 3,955 604 CNG 141,107 170,540 29,767 7 4,252 605 CNG 155,704 183,884 28,345 7 4,049 606 CNG 149,283 188,281 39,326 7 5,618 608 CNG 154,517 192,305 38,109 7 5,444
Total CNG 163,232 35 4,664 Another measure of reliability is availability—the percentage of time that the buses are planned for operation compared with the time the buses are actually available for that planned operation. 7 During the data period, SunLine switched from recording hubodometers to recording bus odometers. All mileage is accounted for in the total mileage; however a direct subtraction of the odometer readings will not give an accurate number.
8
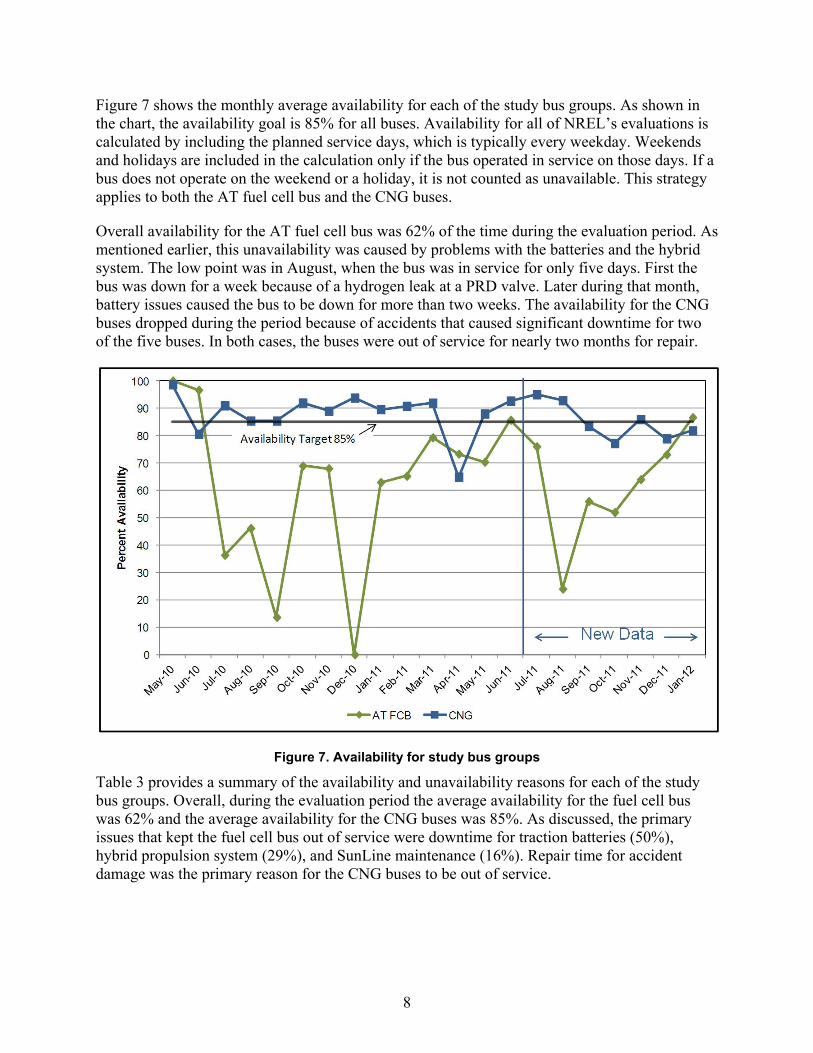
Figure 7 shows the monthly average availability for each of the study bus groups. As shown in the chart, the availability goal is 85% for all buses. Availability for all of NREL’s evaluations is calculated by including the planned service days, which is typically every weekday. Weekends and holidays are included in the calculation only if the bus operated in service on those days. If a bus does not operate on the weekend or a holiday, it is not counted as unavailable. This strategy applies to both the AT fuel cell bus and the CNG buses.
Overall availability for the AT fuel cell bus was 62% of the time during the evaluation period. As mentioned earlier, this unavailability was caused by problems with the batteries and the hybrid system. The low point was in August, when the bus was in service for only five days. First the bus was down for a week because of a hydrogen leak at a PRD valve. Later during that month, battery issues caused the bus to be down for more than two weeks. The availability for the CNG buses dropped during the period because of accidents that caused significant downtime for two of the five buses. In both cases, the buses were out of service for nearly two months for repair.
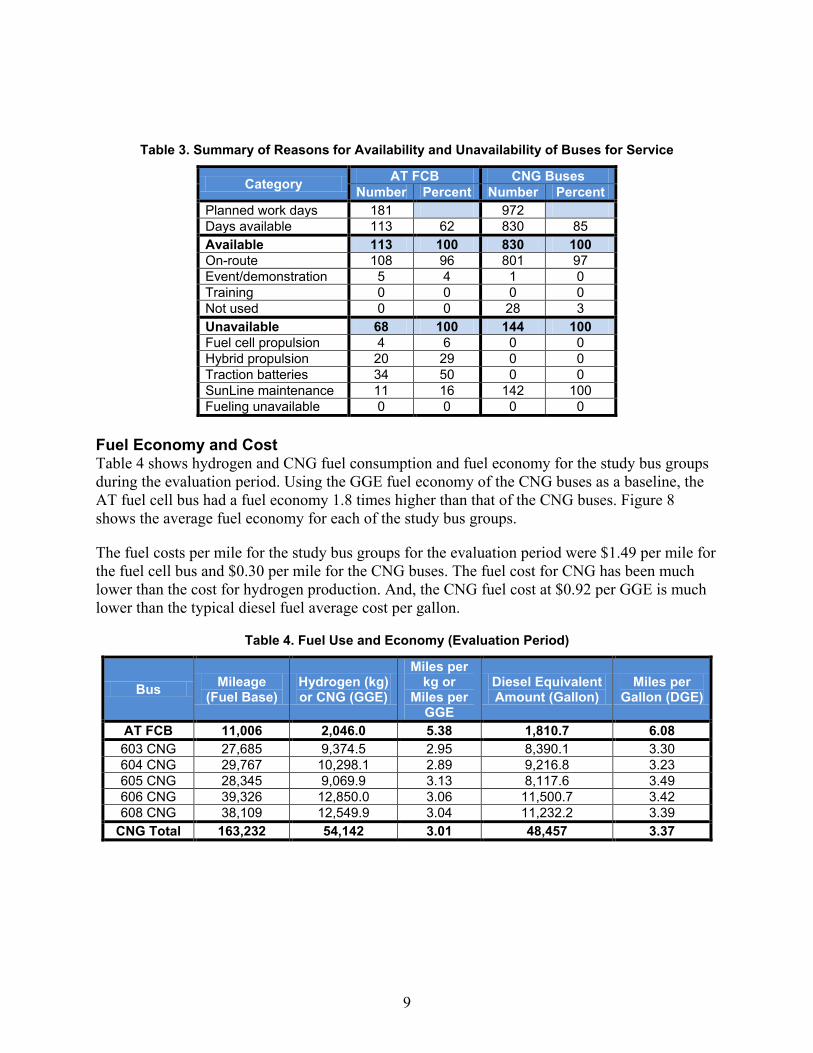
Figure 7. Availability for study bus groups Table 3 provides a summary of the availability and unavailability reasons for each of the study bus groups. Overall, during the evaluation period the average availability for the fuel cell bus was 62% and the average availability for the CNG buses was 85%. As discussed, the primary issues that kept the fuel cell bus out of service were downtime for traction batteries (50%), hybrid propulsion system (29%), and SunLine maintenance (16%). Repair time for accident damage was the primary reason for the CNG buses to be out of service.
9
Table 3. Summary of Reasons for Availability and Unavailability of Buses for Service
Category AT FCB CNG Buses Number Percent Number Percent
Planned work days 181 972 Days available 113 62 830 85 Available 113 100 830 100 On-route 108 96 801 97 Event/demonstration 5 4 1 0 Training 0 0 0 0 Not used 0 0 28 3 Unavailable 68 100 144 100 Fuel cell propulsion 4 6 0 0 Hybrid propulsion 20 29 0 0 Traction batteries 34 50 0 0 SunLine maintenance 11 16 142 100 Fueling unavailable 0 0 0 0
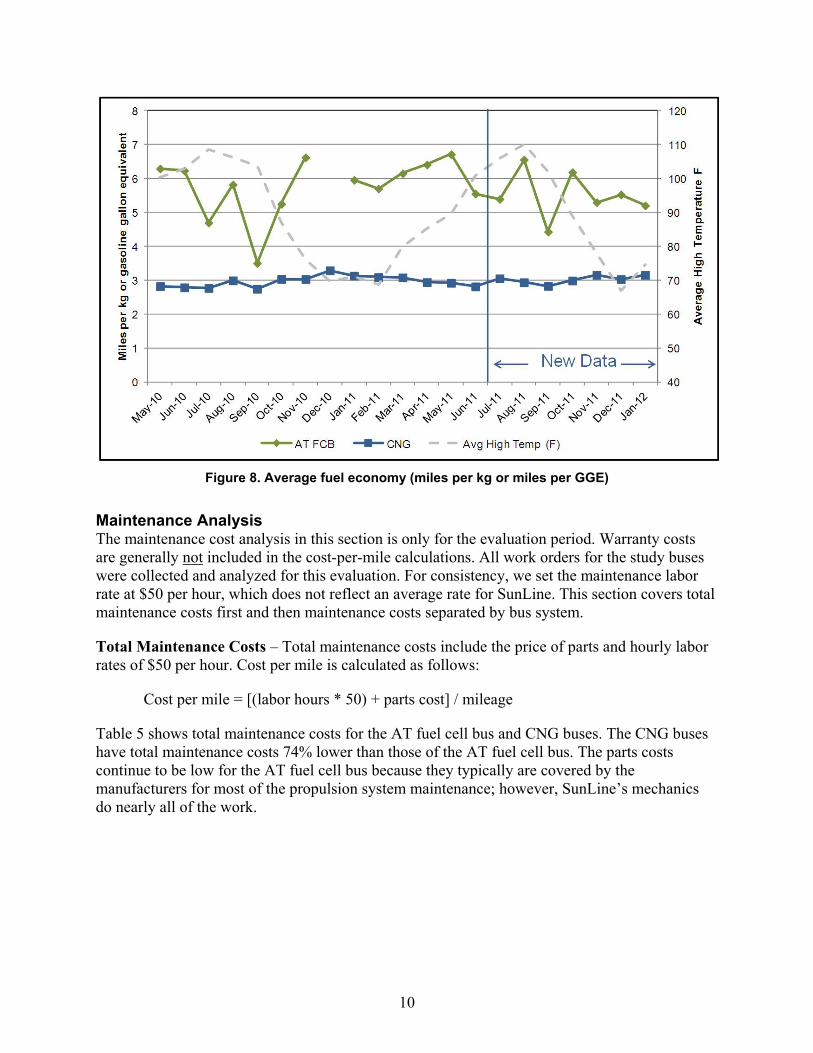
Fuel Economy and Cost Table 4 shows hydrogen and CNG fuel consumption and fuel economy for the study bus groups during the evaluation period. Using the GGE fuel economy of the CNG buses as a baseline, the AT fuel cell bus had a fuel economy 1.8 times higher than that of the CNG buses. Figure 8 shows the average fuel economy for each of the study bus groups.
The fuel costs per mile for the study bus groups for the evaluation period were $1.49 per mile for the fuel cell bus and $0.30 per mile for the CNG buses. The fuel cost for CNG has been much lower than the cost for hydrogen production. And, the CNG fuel cost at $0.92 per GGE is much lower than the typical diesel fuel average cost per gallon.
Table 4. Fuel Use and Economy (Evaluation Period)
Bus Mileage (Fuel Base)
Hydrogen (kg) or CNG (GGE)
Miles per kg or
Miles per GGE
Diesel Equivalent Amount (Gallon)
Miles per Gallon (DGE)
AT FCB 11,006 2,046.0 5.38 1,810.7 6.08 603 CNG 27,685 9,374.5 2.95 8,390.1 3.30 604 CNG 29,767 10,298.1 2.89 9,216.8 3.23 605 CNG 28,345 9,069.9 3.13 8,117.6 3.49 606 CNG 39,326 12,850.0 3.06 11,500.7 3.42 608 CNG 38,109 12,549.9 3.04 11,232.2 3.39
CNG Total 163,232 54,142 3.01 48,457 3.37
10
Figure 8. Average fuel economy (miles per kg or miles per GGE)
Maintenance Analysis The maintenance cost analysis in this section is only for the evaluation period. Warranty costs are generally not included in the cost-per-mile calculations. All work orders for the study buses were collected and analyzed for this evaluation. For consistency, we set the maintenance labor rate at $50 per hour, which does not reflect an average rate for SunLine. This section covers total maintenance costs first and then maintenance costs separated by bus system.
Total Maintenance Costs – Total maintenance costs include the price of parts and hourly labor rates of $50 per hour. Cost per mile is calculated as follows:
Cost per mile = [(labor hours * 50) + parts cost] / mileage
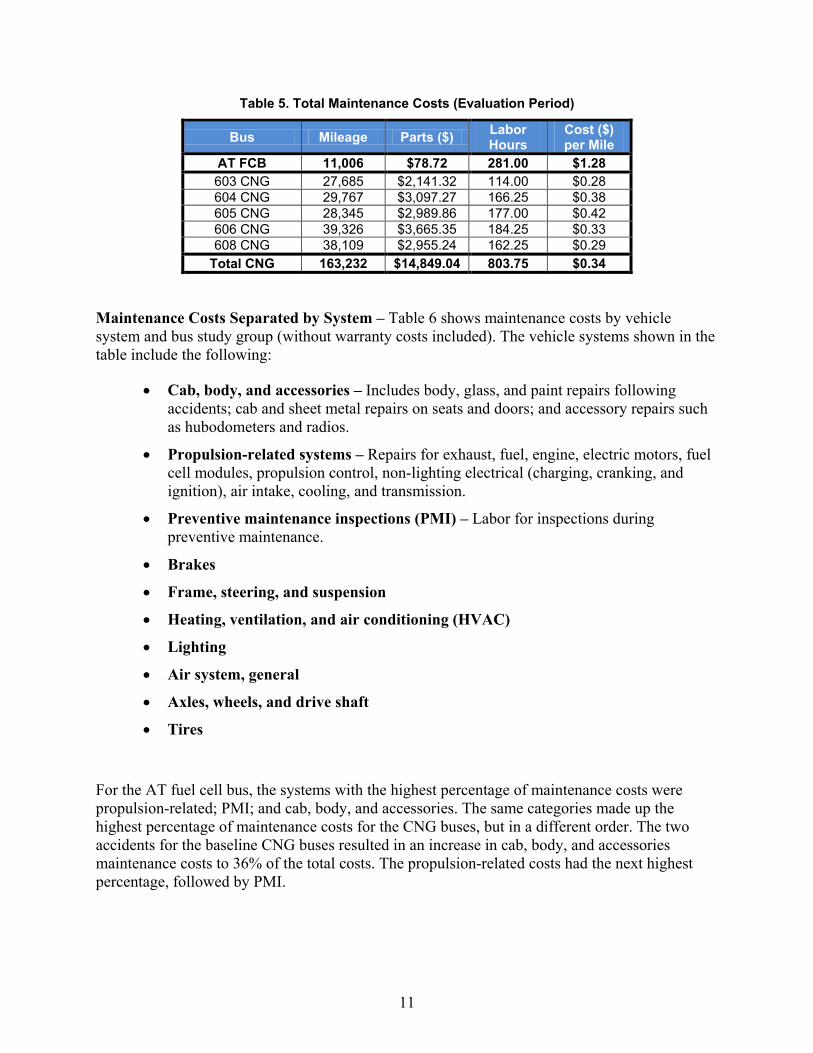
Table 5 shows total maintenance costs for the AT fuel cell bus and CNG buses. The CNG buses have total maintenance costs 74% lower than those of the AT fuel cell bus. The parts costs continue to be low for the AT fuel cell bus because they typically are covered by the manufacturers for most of the propulsion system maintenance; however, SunLine’s mechanics do nearly all of the work.
11
Table 5. Total Maintenance Costs (Evaluation Period)
Bus Mileage Parts ($) Labor Hours
Cost ($) per Mile
AT FCB 11,006 $78.72 281.00 $1.28 603 CNG 27,685 $2,141.32 114.00 $0.28 604 CNG 29,767 $3,097.27 166.25 $0.38 605 CNG 28,345 $2,989.86 177.00 $0.42 606 CNG 39,326 $3,665.35 184.25 $0.33 608 CNG 38,109 $2,955.24 162.25 $0.29
Total CNG 163,232 $14,849.04 803.75 $0.34
Maintenance Costs Separated by System – Table 6 shows maintenance costs by vehicle system and bus study group (without warranty costs included). The vehicle systems shown in the table include the following:
• Cab, body, and accessories – Includes body, glass, and paint repairs following accidents; cab and sheet metal repairs on seats and doors; and accessory repairs such as hubodometers and radios.
• Propulsion-related systems – Repairs for exhaust, fuel, engine, electric motors, fuel cell modules, propulsion control, non-lighting electrical (charging, cranking, and ignition), air intake, cooling, and transmission.
• Preventive maintenance inspections (PMI) – Labor for inspections during preventive maintenance.
• Brakes
• Frame, steering, and suspension
• Heating, ventilation, and air conditioning (HVAC)
• Lighting
• Air system, general
• Axles, wheels, and drive shaft
• Tires
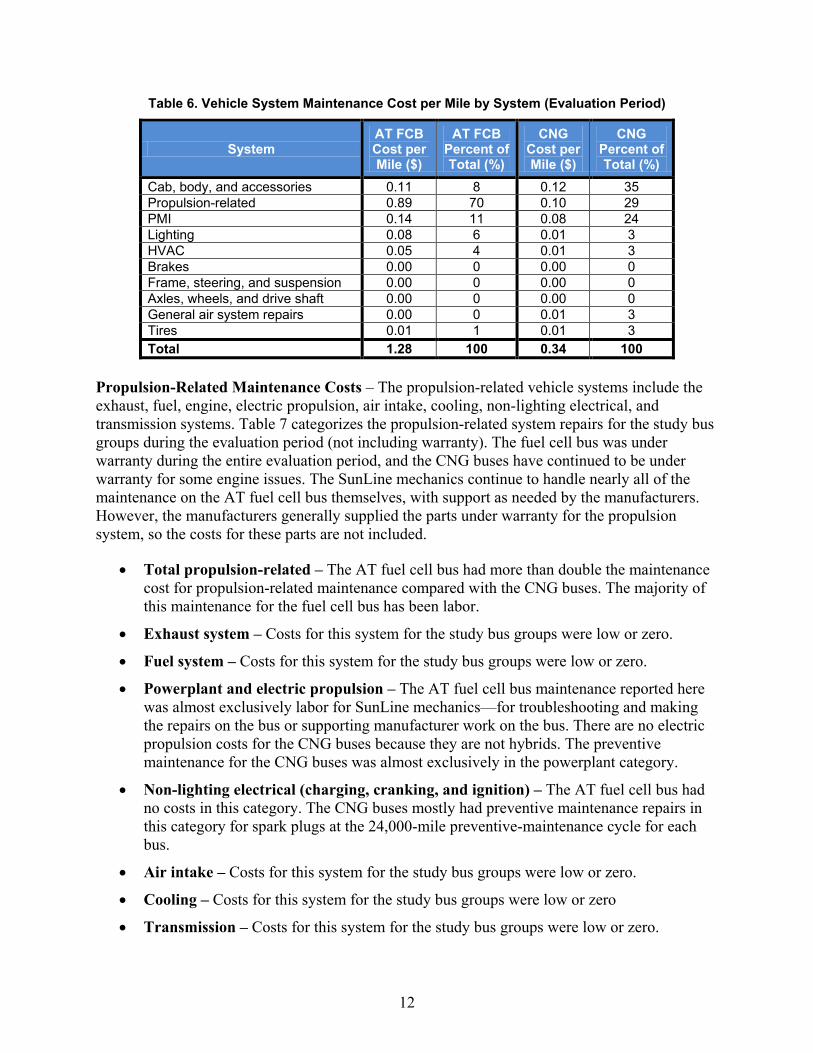
For the AT fuel cell bus, the systems with the highest percentage of maintenance costs were propulsion-related; PMI; and cab, body, and accessories. The same categories made up the highest percentage of maintenance costs for the CNG buses, but in a different order. The two accidents for the baseline CNG buses resulted in an increase in cab, body, and accessories maintenance costs to 36% of the total costs. The propulsion-related costs had the next highest percentage, followed by PMI.
12
Table 6. Vehicle System Maintenance Cost per Mile by System (Evaluation Period)
System AT FCB Cost per Mile ($)
AT FCB Percent of Total (%)
CNG Cost per Mile ($)
CNG Percent of Total (%)
Cab, body, and accessories 0.11 8 0.12 35 Propulsion-related 0.89 70 0.10 29 PMI 0.14 11 0.08 24 Lighting 0.08 6 0.01 3 HVAC 0.05 4 0.01 3 Brakes 0.00 0 0.00 0 Frame, steering, and suspension 0.00 0 0.00 0 Axles, wheels, and drive shaft 0.00 0 0.00 0 General air system repairs 0.00 0 0.01 3 Tires 0.01 1 0.01 3 Total 1.28 100 0.34 100
Propulsion-Related Maintenance Costs – The propulsion-related vehicle systems include the exhaust, fuel, engine, electric propulsion, air intake, cooling, non-lighting electrical, and transmission systems. Table 7 categorizes the propulsion-related system repairs for the study bus groups during the evaluation period (not including warranty). The fuel cell bus was under warranty during the entire evaluation period, and the CNG buses have continued to be under warranty for some engine issues. The SunLine mechanics continue to handle nearly all of the maintenance on the AT fuel cell bus themselves, with support as needed by the manufacturers. However, the manufacturers generally supplied the parts under warranty for the propulsion system, so the costs for these parts are not included.
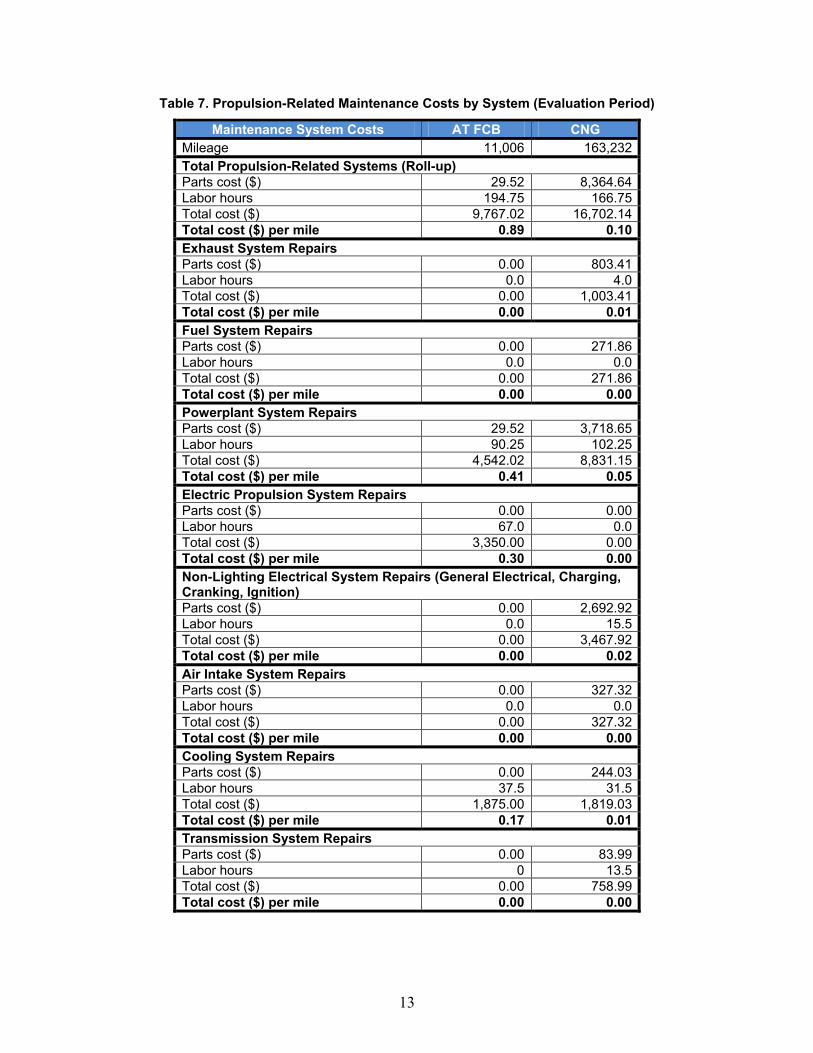
• Total propulsion-related – The AT fuel cell bus had more than double the maintenance cost for propulsion-related maintenance compared with the CNG buses. The majority of this maintenance for the fuel cell bus has been labor.
• Exhaust system – Costs for this system for the study bus groups were low or zero.
• Fuel system – Costs for this system for the study bus groups were low or zero.
• Powerplant and electric propulsion – The AT fuel cell bus maintenance reported here was almost exclusively labor for SunLine mechanics—for troubleshooting and making the repairs on the bus or supporting manufacturer work on the bus. There are no electric propulsion costs for the CNG buses because they are not hybrids. The preventive maintenance for the CNG buses was almost exclusively in the powerplant category.
• Non-lighting electrical (charging, cranking, and ignition) – The AT fuel cell bus had no costs in this category. The CNG buses mostly had preventive maintenance repairs in this category for spark plugs at the 24,000-mile preventive-maintenance cycle for each bus.
• Air intake – Costs for this system for the study bus groups were low or zero.
• Cooling – Costs for this system for the study bus groups were low or zero
• Transmission – Costs for this system for the study bus groups were low or zero.
13
Table 7. Propulsion-Related Maintenance Costs by System (Evaluation Period)
Maintenance System Costs AT FCB CNG Mileage 11,006 163,232 Total Propulsion-Related Systems (Roll-up) Parts cost ($) 29.52 8,364.64 Labor hours 194.75 166.75 Total cost ($) 9,767.02 16,702.14 Total cost ($) per mile 0.89 0.10 Exhaust System Repairs Parts cost ($) 0.00 803.41 Labor hours 0.0 4.0 Total cost ($) 0.00 1,003.41 Total cost ($) per mile 0.00 0.01 Fuel System Repairs Parts cost ($) 0.00 271.86 Labor hours 0.0 0.0 Total cost ($) 0.00 271.86 Total cost ($) per mile 0.00 0.00 Powerplant System Repairs Parts cost ($) 29.52 3,718.65 Labor hours 90.25 102.25 Total cost ($) 4,542.02 8,831.15 Total cost ($) per mile 0.41 0.05 Electric Propulsion System Repairs Parts cost ($) 0.00 0.00 Labor hours 67.0 0.0 Total cost ($) 3,350.00 0.00 Total cost ($) per mile 0.30 0.00 Non-Lighting Electrical System Repairs (General Electrical, Charging, Cranking, Ignition) Parts cost ($) 0.00 2,692.92 Labor hours 0.0 15.5 Total cost ($) 0.00 3,467.92 Total cost ($) per mile 0.00 0.02 Air Intake System Repairs Parts cost ($) 0.00 327.32 Labor hours 0.0 0.0 Total cost ($) 0.00 327.32 Total cost ($) per mile 0.00 0.00 Cooling System Repairs Parts cost ($) 0.00 244.03 Labor hours 37.5 31.5 Total cost ($) 1,875.00 1,819.03 Total cost ($) per mile 0.17 0.01 Transmission System Repairs Parts cost ($) 0.00 83.99 Labor hours 0 13.5 Total cost ($) 0.00 758.99 Total cost ($) per mile 0.00 0.00
14
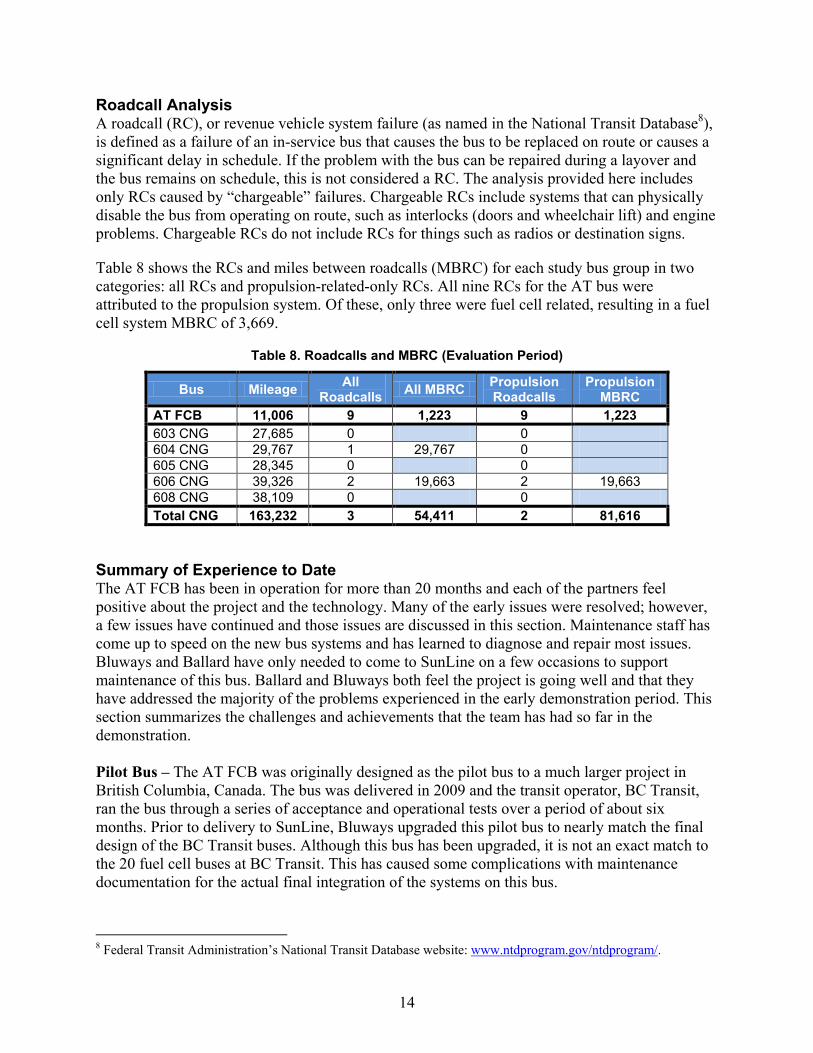
Roadcall Analysis A roadcall (RC), or revenue vehicle system failure (as named in the National Transit Database8), is defined as a failure of an in-service bus that causes the bus to be replaced on route or causes a significant delay in schedule. If the problem with the bus can be repaired during a layover and the bus remains on schedule, this is not considered a RC. The analysis provided here includes only RCs caused by “chargeable” failures. Chargeable RCs include systems that can physically disable the bus from operating on route, such as interlocks (doors and wheelchair lift) and engine problems. Chargeable RCs do not include RCs for things such as radios or destination signs.
Table 8 shows the RCs and miles between roadcalls (MBRC) for each study bus group in two categories: all RCs and propulsion-related-only RCs. All nine RCs for the AT bus were attributed to the propulsion system. Of these, only three were fuel cell related, resulting in a fuel cell system MBRC of 3,669.
Table 8. Roadcalls and MBRC (Evaluation Period)
Bus Mileage All Roadcalls All MBRC Propulsion
Roadcalls Propulsion
MBRC AT FCB 11,006 9 1,223 9 1,223 603 CNG 27,685 0 0 604 CNG 29,767 1 29,767 0 605 CNG 28,345 0 0 606 CNG 39,326 2 19,663 2 19,663 608 CNG 38,109 0 0 Total CNG 163,232 3 54,411 2 81,616
Summary of Experience to Date The AT FCB has been in operation for more than 20 months and each of the partners feel positive about the project and the technology. Many of the early issues were resolved; however, a few issues have continued and those issues are discussed in this section. Maintenance staff has come up to speed on the new bus systems and has learned to diagnose and repair most issues. Bluways and Ballard have only needed to come to SunLine on a few occasions to support maintenance of this bus. Ballard and Bluways both feel the project is going well and that they have addressed the majority of the problems experienced in the early demonstration period. This section summarizes the challenges and achievements that the team has had so far in the demonstration. Pilot Bus – The AT FCB was originally designed as the pilot bus to a much larger project in British Columbia, Canada. The bus was delivered in 2009 and the transit operator, BC Transit, ran the bus through a series of acceptance and operational tests over a period of about six months. Prior to delivery to SunLine, Bluways upgraded this pilot bus to nearly match the final design of the BC Transit buses. Although this bus has been upgraded, it is not an exact match to the 20 fuel cell buses at BC Transit. This has caused some complications with maintenance documentation for the actual final integration of the systems on this bus.
8 Federal Transit Administration’s National Transit Database website: www.ntdprogram.gov/ntdprogram/.
15
Hydrogen Leak – During regular scheduled maintenance, SunLine detected a minor leak at a check valve in the hydrogen system. The leak was repaired and the PRD valve was replaced.
Propulsion System Issues – Problems that caused downtime for the bus included a faulty motor controller and coolant flow sensor. The motor controller issue was intermittent, which made it more difficult and time-consuming to diagnose. Replacing the controller cable resolved the major issues, but other issues surfaced, so the motor controller was replaced. SunLine had some difficulty getting the correct part, which resulted in a longer downtime than usual.
Traction Battery Issues – This bus has had some issues with the traction batteries, controller, and charger that have been resolved during the evaluation period for this report. Bluways has provided an external battery charger so that the batteries can be balanced on a more regular basis. Many hybrid electric propulsion systems use this type of strategy—external balancing of the batteries for better electric storage performance and longevity of the batteries. SunLine reports that the regular equalization of the batteries has had a positive effect on the bus performance.
Air Conditioning Issues – The extreme high summer temperatures at SunLine (in the desert) have resulted in problems with the air conditioning. The hybrid system is configured to cool the batteries with air from the bus's air conditioning unit. The summer heat in SunLine’s service area affects how well the air conditioning can keep up with demand for cooling passengers while keeping the batteries within proper operating temperature range. Bluways has worked with ThermoKing to resolve the integration issues and believes these issues are now resolved.
16
What’s Next for SunLine
This report covers SunLine’s operation of the fuel cell and CNG buses from July 2011 through January 2012. The agency will continue working with DOE/NREL to collect data on the buses in service. The next report is expected to be published in late 2012.
SunLine will continue to operate the AT fuel cell bus as well as its newest fuel cell electric bus, the American Fuel Cell Bus (AFCB). Funded under the FTA’s National Fuel Cell Bus Program, the AFCB project brings a new team of manufacturers to the fuel cell bus industry—ElDorado, BAE SYSTEMS, and Ballard. The design features a number of advancements that are expected to result in a highly efficient bus. Elements include advanced energy storage and new power electronics, high-efficiency accessories, and the newest-generation fuel cell on a U.S.-built chassis. The bus was delivered to the agency in late 2011 and is now in service.
17
Contacts
DOE 1000 Independence Ave., SW Washington, DC 20585 Jason Marcinkoski, Technology Development Manager, Fuel Cell Technologies Program Phone: 202-586-7466 E-mail: [email protected] NREL 15013 Denver West Parkway Golden, CO 80401 Leslie Eudy, Senior Project Leader Phone: 303-275-4412 E-mail: [email protected] Battelle 505 King Avenue Columbus, OH 43201 Kevin Chandler, Program Manager Phone: 614-424-5127 E-mail: [email protected] SunLine 32-505 Harry Oliver Trail Thousand Palms, CA 92276 Tommy Edwards, Director of Maintenance Phone: 760-343-3456 E-mail: [email protected]
Ballard Power Systems 9000 Glenyon Parkway Burnaby, BC, Canada Daljit Bawa, Market Manager - Bus Segment Phone: 604-412-3108 E-mail: [email protected] Jeff Grant, Business Development Manager Phone: 604-453-3578 E-mail: [email protected] Bluways USA, Inc. 12302 Kerran Street Poway, CA 92064 Rob Del Core, Director, Product Management Phone: 858- 413-1759 E-mail: [email protected]
18
Fuel Cell Bus Related Reports
All NREL hydrogen and fuel cell-related evaluation reports can be downloaded from the following website: www.nrel.gov/hydrogen/proj_fc_bus_eval.html.
SunLine Eudy, L. (2012). American Fuel Cell Bus Project: Developing and Demonstrating the Next-Generation Fuel Cell Electric Bus Made in America. DOT/FTA – NFCBP – FC4 – March 2012.
Eudy, L.; Chandler, K. (2011). SunLine Transit Agency Advanced Technology Fuel Cell Bus Evaluation: Second Results Report and Appendices. NREL/TP-5600-52349-1, NREL/TP-5600-52349-2, Golden, CO: National Renewable Energy Laboratory.
Eudy, L.; Chandler, K. (2011). SunLine Transit Agency Advanced Technology Fuel Cell Bus Evaluation: First Results Report. NREL/TP-5600-50500, Golden, CO: National Renewable Energy Laboratory.
Eudy, L.; Chandler, K. (2009). SunLine Transit Agency, Fuel Cell Transit Bus: Fifth Evaluation Report and Appendices. NREL/TP-560-46346-1, NREL/TP-560-46346-2. Golden, CO: National Renewable Energy Laboratory.
Chandler, K.; Eudy, L. (2009). SunLine Transit Agency, Fuel Cell Transit Bus: Fourth Evaluation Report and Appendices. NREL/TP-560-44646-1, NREL/TP-560-44646-2. Golden, CO: National Renewable Energy Laboratory.
Eudy, L. (2008). SunLine Begins Extended Testing of Hybrid Fuel Cell Bus. DOE/GO-102008-2610. Golden, CO: National Renewable Energy Laboratory.
Chandler, K.; Eudy, L. (2008). SunLine Transit Agency, Hydrogen-Powered Transit Buses: Third Evaluation Report and Appendices. NREL/TP-560-43741-1, NREL/TP-560-43741-2. Golden, CO: National Renewable Energy Laboratory.
Chandler, K.; Eudy, L. (2007). SunLine Transit Agency, Hydrogen-Powered Transit Buses: Evaluation Results Update. NREL/TP-560-42080. Golden, CO: National Renewable Energy Laboratory.
Chandler, K.; Eudy, L. (2007). SunLine Transit Agency, Hydrogen-Powered Transit Buses: Preliminary Evaluation Results. NREL/TP-560-41001. Golden, CO: National Renewable Energy Laboratory.
Eudy, L. (2006). SunLine Expands Horizons with Fuel Cell Bus Demo. DOE/GO-102006-2287. Golden, CO: National Renewable Energy Laboratory.
Eudy, L. (2006). SunLine Tests HHICE Bus in Desert Climate. DOE/GO-102006-2333. Golden, CO: National Renewable Energy Laboratory.
Chandler, K. (2006). Ten Years of Compressed Natural Gas (CNG) Operations at SunLine Transit Agency. NREL/SR-540-39180. Golden, CO: National Renewable Energy Laboratory.
19
General Eudy, L.; Chandler, K.; Gikakis, C. (2011). Fuel Cell Buses in U.S. Transit Fleets: Current Status 2011. NREL/TP-5600-52927. Golden, CO: National Renewable Energy Laboratory.
Eudy, L. (2010). Fuel Cell Transit Bus Evaluations: Joint Evaluation Plan for the U.S. Department of Energy and the Federal Transit Administration. NREL/TP-560-49342. Golden, CO: National Renewable Energy Laboratory.
Eudy, L.; Chandler, K.; Gikakis, C. (2010). Fuel Cell Buses in U.S. Transit Fleets: Current Status 2010. NREL/TP-560-49379. Golden, CO: National Renewable Energy Laboratory.
Eudy, L.; Chandler, K.; Gikakis, C. (2009). Fuel Cell Buses in U.S. Transit Fleets: Current Status 2009. NREL/TP-560-46490. Golden, CO: National Renewable Energy Laboratory.
Eudy, L.; Chandler, K.; Gikakis, C. (2008). Fuel Cell Buses in U.S. Transit Fleets: Current Status 2008. NREL/TP-560-44133. Golden, CO: National Renewable Energy Laboratory.
Eudy, L.; Chandler, K.; Gikakis, C. (2007). Fuel Cell Buses in U.S. Transit Fleets: Summary of Experiences and Current Status. NREL/TP-560-41967. Golden, CO: National Renewable Energy Laboratory.
AC Transit Chandler, K.; Eudy, L. (2011). Zero Emission Bay Area (ZEBA) Fuel Cell Bus Demonstration: First Results Report. NREL/TP-5600-52015. Golden, CO: National Renewable Energy Laboratory.
Eudy, L. (2010). Bay Area Transit Agencies Propel Fuel Cell Buses Toward Commercialization. DOE/GO-102010-3067. Golden, CO: National Renewable Energy Laboratory.
Chandler, K.; Eudy, L. (2010). National Fuel Cell Bus Program: Accelerated Testing Evaluation Report #2 and Appendices. FTA-CO-26-7004-2010.1. Golden, CO: National Renewable Energy Laboratory.
Chandler, K.; Eudy, L. (2009). National Fuel Cell Bus Program: Accelerated Testing Evaluation Report and Appendices. FTA-CO-26-7004-2009.1. Golden, CO: National Renewable Energy Laboratory.
Chandler, K.; Eudy, L. (2007). Alameda-Contra Costa Transit District (AC Transit), Fuel Cell Transit Buses: Third Evaluation Report and Appendices. NREL/TP-560-43545-1, NREL/TP-560-43545-2. Golden, CO: National Renewable Energy Laboratory.
Chandler, K.; Eudy, L. (2007). Alameda-Contra Costa Transit District (AC Transit), Fuel Cell Transit Buses: Evaluation Results Update. NREL/TP-560-42249. Golden, CO: National Renewable Energy Laboratory.
Chandler, K.; Eudy, L. (2007). AC Transit, Fuel Cell Transit Buses: Preliminary Evaluation Results. NREL/TP-560-41041. Golden, CO: National Renewable Energy Laboratory.
20
Eudy, L. (2006). AC Transit Demonstrates Three Prototype Fuel Cell Buses. DOE/GO-102006-2286. Golden, CO: National Renewable Energy Laboratory.
BurbankBus Eudy, L. (2010). Fuel Cell Bus Takes a Starring Role in the BurbankBus Fleet. DOE/GO-102010-3035. Golden, CO: National Renewable Energy Laboratory.
Connecticut Transit Eudy, L. (2011). Connecticut Nutmeg Fuel Cell Bus Project: Demonstrating Advanced-Design Hybrid Fuel Cell Buses in Connecticut. DOT/FTA – NFCBP – FC3 – July 2011.
Chandler, K.; Eudy, L. (2010). Connecticut Transit (CTTRANSIT) Fuel Cell Transit Bus: Third Evaluation Report and Appendices. NREL/TP-560-47334-1, NREL/TP-560-47334-2. Golden, CO: National Renewable Energy Laboratory.
Chandler, K.; Eudy, L. (2009). Connecticut Transit (CTTRANSIT) Fuel Cell Transit Bus: Second Evaluation Report and Appendices. NREL/TP-560-45670-1, NREL/TP-560-45670-2. Golden, CO: National Renewable Energy Laboratory.
Chandler, K.; Eudy, L. (2008). Connecticut Transit (CTTRANSIT) Fuel Cell Transit Buses: Preliminary Evaluation Results. NREL/TP-560-43847. Golden, CO: National Renewable Energy Laboratory.
Eudy, L. (2008). CTTRANSIT Operates New England’s First Fuel Cell Hybrid Bus. DOE/GO-12008-2529. Golden, CO: National Renewable Energy Laboratory.
San Francisco Municipal Transportation Agency Eudy, L. (2011). Compound Fuel Cell Hybrid Bus Hits the Streets of San Francisco: San Francisco Hosts National Fuel Cell Bus Program Demonstration . DOT/FTA – NFCBP – FC2 – July 2011.
Santa Clara Valley Transportation Authority Chandler, K.; Eudy, L. (2006). Santa Clara Valley Transportation Authority and San Mateo County Transit District, Fuel Cell Transit Buses: Evaluation Results. NREL/TP-560-40615. Golden, CO: National Renewable Energy Laboratory.
Eudy, L. (2005). VTA, SamTrans Look into Future with Bus Demo. DOE/GO-102005-2147. Golden, CO: National Renewable Energy Laboratory.
21
Appendix A: Fleet Summary Statistics
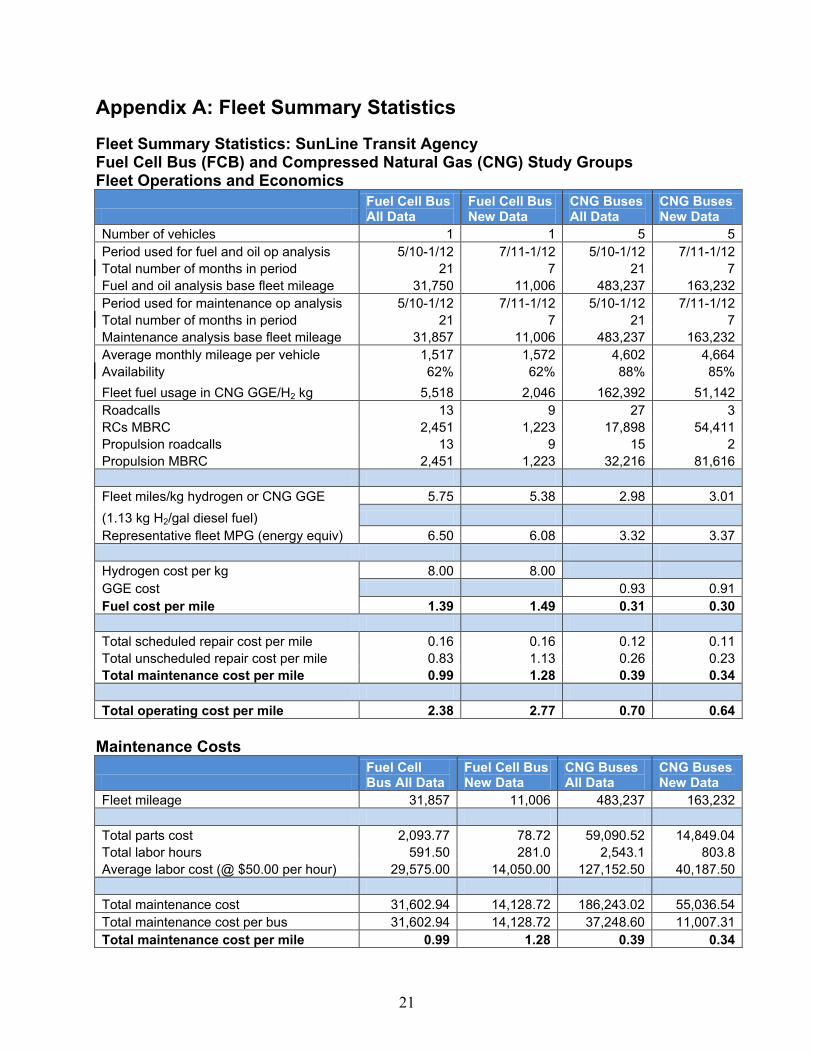
Fleet Summary Statistics: SunLine Transit Agency Fuel Cell Bus (FCB) and Compressed Natural Gas (CNG) Study Groups Fleet Operations and Economics
Fuel Cell Bus All Data
Fuel Cell Bus New Data
CNG Buses All Data
CNG Buses New Data
Number of vehicles 1 1 5 5 Period used for fuel and oil op analysis 5/10-1/12 7/11-1/12 5/10-1/12 7/11-1/12 Total number of months in period 21 7 21 7 Fuel and oil analysis base fleet mileage 31,750 11,006 483,237 163,232 Period used for maintenance op analysis 5/10-1/12 7/11-1/12 5/10-1/12 7/11-1/12 Total number of months in period 21 7 21 7 Maintenance analysis base fleet mileage 31,857 11,006 483,237 163,232 Average monthly mileage per vehicle 1,517 1,572 4,602 4,664 Availability 62% 62% 88% 85% Fleet fuel usage in CNG GGE/H2 kg 5,518 2,046 162,392 51,142 Roadcalls 13 9 27 3 RCs MBRC 2,451 1,223 17,898 54,411 Propulsion roadcalls 13 9 15 2 Propulsion MBRC 2,451 1,223 32,216 81,616 Fleet miles/kg hydrogen or CNG GGE 5.75 5.38 2.98 3.01 (1.13 kg H2/gal diesel fuel) Representative fleet MPG (energy equiv) 6.50 6.08 3.32 3.37 Hydrogen cost per kg 8.00 8.00 GGE cost 0.93 0.91 Fuel cost per mile 1.39 1.49 0.31 0.30 Total scheduled repair cost per mile 0.16 0.16 0.12 0.11 Total unscheduled repair cost per mile 0.83 1.13 0.26 0.23 Total maintenance cost per mile 0.99 1.28 0.39 0.34 Total operating cost per mile 2.38 2.77 0.70 0.64
Maintenance Costs
Fuel Cell Bus All Data
Fuel Cell Bus New Data
CNG Buses All Data
CNG Buses New Data
Fleet mileage 31,857 11,006 483,237 163,232 Total parts cost 2,093.77 78.72 59,090.52 14,849.04 Total labor hours 591.50 281.0 2,543.1 803.8 Average labor cost (@ $50.00 per hour) 29,575.00 14,050.00 127,152.50 40,187.50 Total maintenance cost 31,602.94 14,128.72 186,243.02 55,036.54 Total maintenance cost per bus 31,602.94 14,128.72 37,248.60 11,007.31 Total maintenance cost per mile 0.99 1.28 0.39 0.34
22
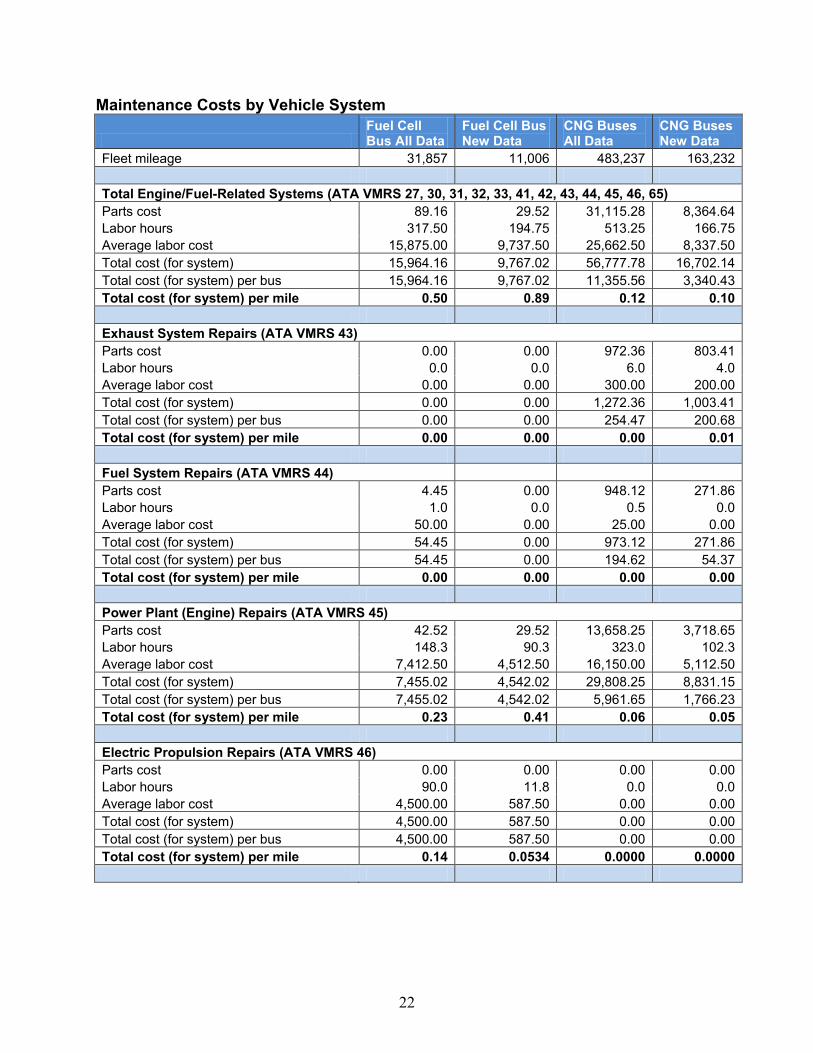
Maintenance Costs by Vehicle System
Fuel Cell Bus All Data
Fuel Cell Bus New Data
CNG Buses All Data
CNG Buses New Data
Fleet mileage 31,857 11,006 483,237 163,232 Total Engine/Fuel-Related Systems (ATA VMRS 27, 30, 31, 32, 33, 41, 42, 43, 44, 45, 46, 65) Parts cost 89.16 29.52 31,115.28 8,364.64 Labor hours 317.50 194.75 513.25 166.75 Average labor cost 15,875.00 9,737.50 25,662.50 8,337.50 Total cost (for system) 15,964.16 9,767.02 56,777.78 16,702.14 Total cost (for system) per bus 15,964.16 9,767.02 11,355.56 3,340.43 Total cost (for system) per mile 0.50 0.89 0.12 0.10 Exhaust System Repairs (ATA VMRS 43) Parts cost 0.00 0.00 972.36 803.41 Labor hours 0.0 0.0 6.0 4.0 Average labor cost 0.00 0.00 300.00 200.00 Total cost (for system) 0.00 0.00 1,272.36 1,003.41 Total cost (for system) per bus 0.00 0.00 254.47 200.68 Total cost (for system) per mile 0.00 0.00 0.00 0.01 Fuel System Repairs (ATA VMRS 44) Parts cost 4.45 0.00 948.12 271.86 Labor hours 1.0 0.0 0.5 0.0 Average labor cost 50.00 0.00 25.00 0.00 Total cost (for system) 54.45 0.00 973.12 271.86 Total cost (for system) per bus 54.45 0.00 194.62 54.37 Total cost (for system) per mile 0.00 0.00 0.00 0.00 Power Plant (Engine) Repairs (ATA VMRS 45) Parts cost 42.52 29.52 13,658.25 3,718.65 Labor hours 148.3 90.3 323.0 102.3 Average labor cost 7,412.50 4,512.50 16,150.00 5,112.50 Total cost (for system) 7,455.02 4,542.02 29,808.25 8,831.15 Total cost (for system) per bus 7,455.02 4,542.02 5,961.65 1,766.23 Total cost (for system) per mile 0.23 0.41 0.06 0.05 Electric Propulsion Repairs (ATA VMRS 46) Parts cost 0.00 0.00 0.00 0.00 Labor hours 90.0 11.8 0.0 0.0 Average labor cost 4,500.00 587.50 0.00 0.00 Total cost (for system) 4,500.00 587.50 0.00 0.00 Total cost (for system) per bus 4,500.00 587.50 0.00 0.00 Total cost (for system) per mile 0.14 0.0534 0.0000 0.0000
23
Maintenance Costs by Vehicle System (continued)
Fuel Cell Bus All Data
Fuel Cell Bus New Data
CNG Buses All Data
CNG Buses New Data
Electrical System Repairs (ATA VMRS 30-Electrical General, 31-Charging, 32-Cranking, 33-Ignition) Parts cost 0.00 0.00 12,363.06 2,692.92 Labor hours 13.5 0.0 86.5 15.5 Average labor cost 675.00 0.00 4,325.00 775.00 Total cost (for system) 675.00 0.00 16,688.06 3,467.92 Total cost (for system) per bus 675.00 0.00 3,337.61 693.58 Total cost (for system) per mile 0.02 0.00 0.03 0.02 Air Intake System Repairs (ATA VMRS 41) Parts cost 0.00 0.00 1,079.29 327.32 Labor hours 0.0 0.0 0.0 0.0 Average labor cost 0.00 0.00 0.00 0.00 Total cost (for system) 0.00 0.00 1,079.29 327.32 Total cost (for system) per bus 0.00 0.00 215.86 65.46 Total cost (for system) per mile 0.00 0.00 0.00 0.00 Cooling System Repairs (ATA VMRS 42) Parts cost 42.19 0.00 1,084.51 244.03 Labor hours 64.8 37.5 81.3 31.5 Average labor cost 3,237.50 1,875.00 4,062.50 1,575.00 Total cost (for system) 3,279.69 1,875.00 5,147.01 1,819.03 Total cost (for system) per bus 3,279.69 1,875.00 1,029.40 363.81 Total cost (for system) per mile 0.10 0.17 0.01 0.01 Hydraulic System Repairs (ATA VMRS 65) Parts cost 0.00 0.00 679.25 222.46 Labor hours 0.0 0.0 0.0 0.0 Average labor cost 0.00 0.00 0.00 0.00 Total cost (for system) 0.00 0.00 679.25 222.46 Total cost (for system) per bus 0.00 0.00 135.85 44.49 Total cost (for system) per mile 0.00 0.00 0.00 0.00 General Air System Repairs (ATA VMRS 10) Parts cost 0.00 0.00 58.72 42.86 Labor hours 4.5 0.0 34.5 20.5 Average labor cost 225.00 0.00 1,725.00 1,025.00 Total cost (for system) 225.00 0.00 1,783.72 1,067.86 Total cost (for system) per bus 225.00 0.00 356.74 213.57 Total cost (for system) per mile 0.01 0.00 0.00 0.01
24
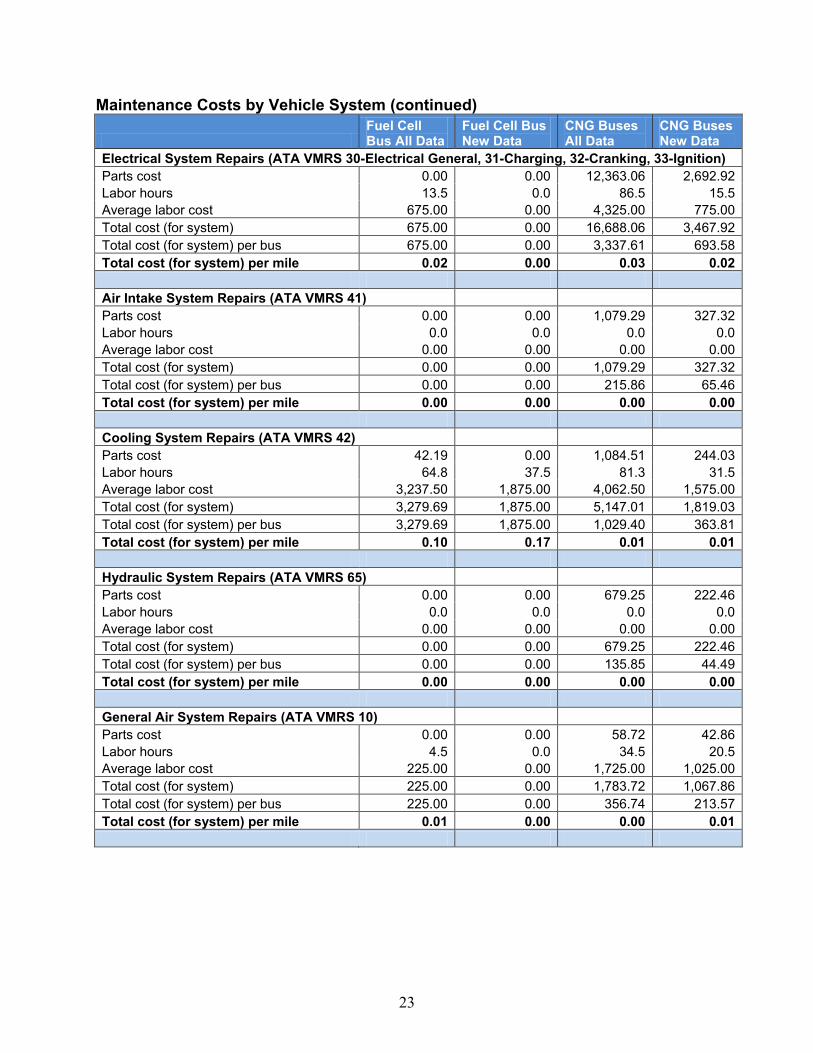
Maintenance Costs by Vehicle System (continued)
Fuel Cell Bus All Data
Fuel Cell Bus New Data
CNG Buses All Data
CNG Buses New Data
Brake System Repairs (ATA VMRS 13) Parts cost 4.99 0.00 4,791.59 70.99 Labor hours 0.0 0.0 86.3 0.5 Average labor cost 0.00 0.00 4,312.50 25.00 Total cost (for system) 4.99 0.00 9,104.09 95.99 Total cost (for system) per bus 4.99 0.00 1,820.82 19.20 Total cost (for system) per mile 0.00 0.00 0.02 0.00 Transmission Repairs (ATA VMRS 27) Parts cost 0.00 0.00 330.44 83.99 Labor hours 0.0 0.0 16.0 13.5 Average labor cost 0.00 0.00 800.00 675.00 Total cost (for system) 0.00 0.00 1,130.44 758.99 Total cost (for system) per bus 0.00 0.00 226.09 151.80 Total cost (for system) per mile 0.00 0.00 0.00 0.01 Inspections Only - no parts replacements (101) Parts cost 0.00 0.00 0.00 0.00 Labor hours 97.5 32.3 782.0 236.3 Average labor cost 4,875.00 1,612.50 39,100.00 11,812.50 Total cost (for system) 4,875.00 1,612.50 39,100.00 11,812.50 Total cost (for system) per bus 4,875.00 1,612.50 7,820.00 2,362.50 Total cost (for system) per mile 0.15 0.15 0.08 0.07 Cab, Body, and Accessories Systems Repairs (ATA VMRS 02-Cab and Sheet Metal, 50-Accessories, 71-Body) Parts cost 1,501.13 15.65 15,912.37 5,549.53 Labor hours 107.0 23.0 827.5 284.3 Average labor cost 5,350.00 1,150.00 41,375.00 14,212.50 Total cost (for system) 6,851.13 1,165.65 57,287.37 19,762.03 Total cost (for system) per bus 6,851.13 1,165.65 11,457.47 3,952.41 Total cost (for system) per mile 0.22 0.11 0.12 0.12 HVAC System Repairs (ATA VMRS 01) Parts cost 22.73 0.00 2,795.15 276.93 Labor hours 37.0 11.0 70.3 19.5 Average labor cost 1,850.00 550.00 3,512.50 975.00 Total cost (for system) 1,872.73 550.00 6,307.65 1,251.93 Total cost (for system) per bus 1,872.73 550.00 1,261.53 250.39 Total cost (for system) per mile 0.06 0.05 0.01 0.01
25
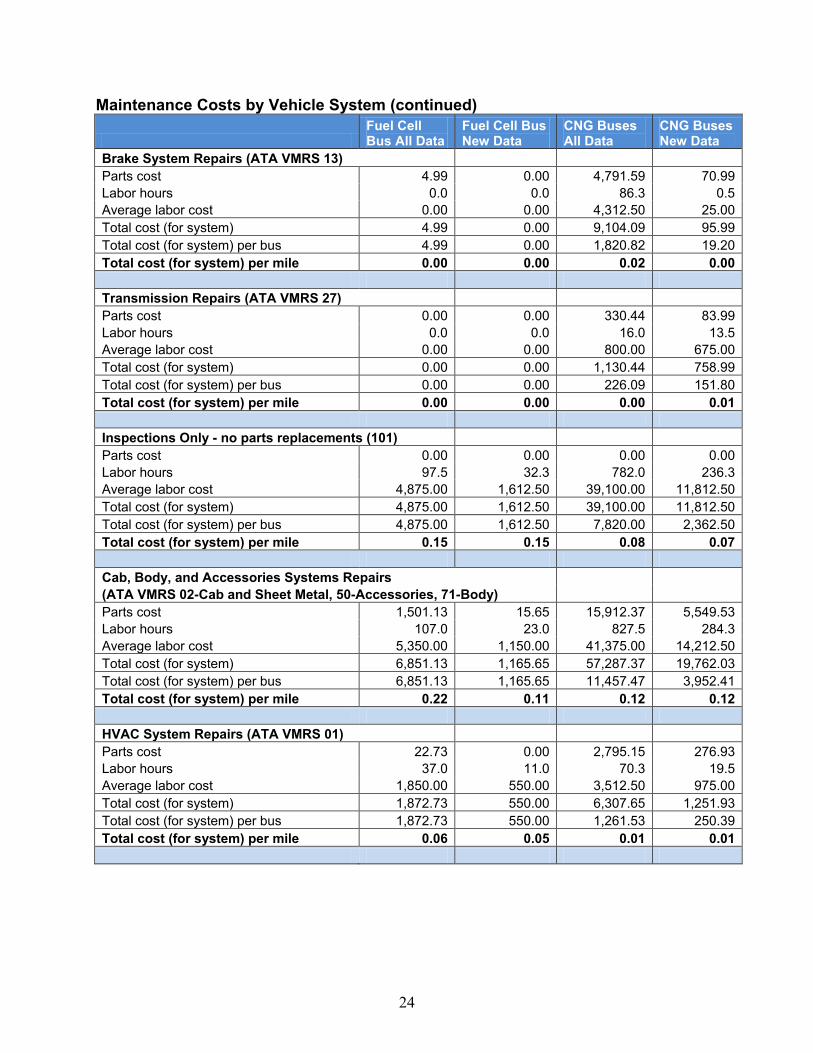
Maintenance Costs by Vehicle System (continued)
Fuel Cell Bus All Data
Fuel Cell Bus New Data
CNG Buses All Data
CNG Buses New Data
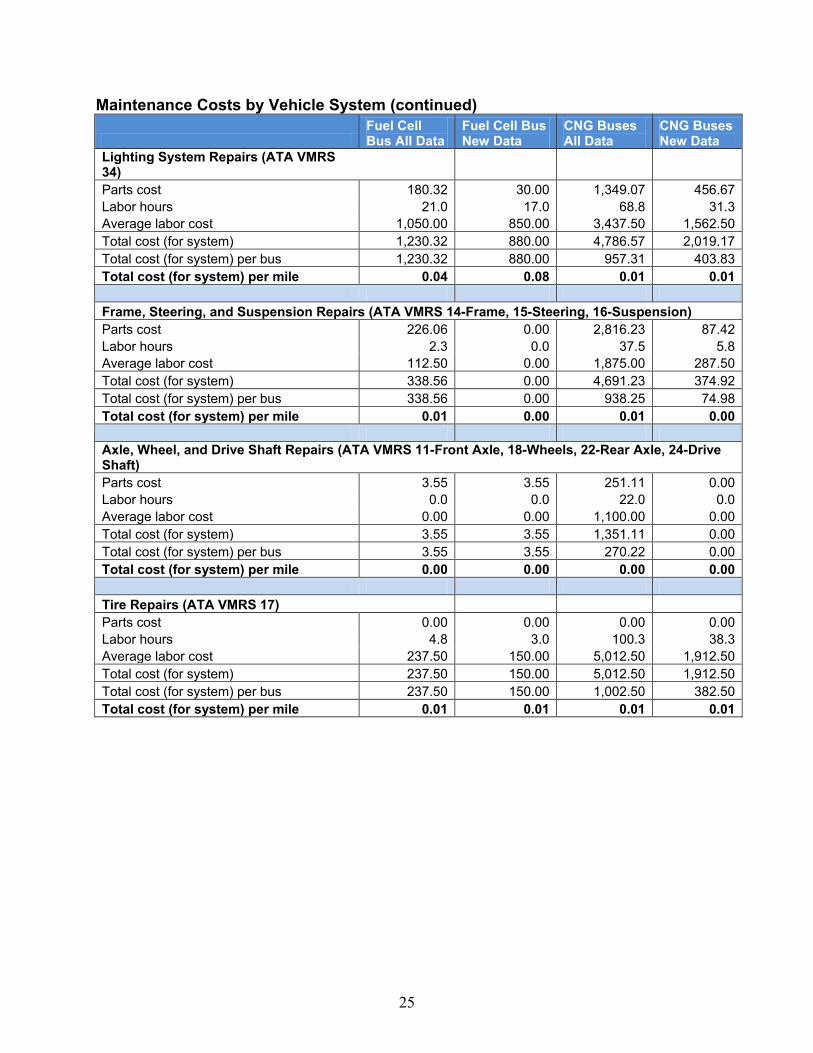
Lighting System Repairs (ATA VMRS 34) Parts cost 180.32 30.00 1,349.07 456.67 Labor hours 21.0 17.0 68.8 31.3 Average labor cost 1,050.00 850.00 3,437.50 1,562.50 Total cost (for system) 1,230.32 880.00 4,786.57 2,019.17 Total cost (for system) per bus 1,230.32 880.00 957.31 403.83 Total cost (for system) per mile 0.04 0.08 0.01 0.01 Frame, Steering, and Suspension Repairs (ATA VMRS 14-Frame, 15-Steering, 16-Suspension) Parts cost 226.06 0.00 2,816.23 87.42 Labor hours 2.3 0.0 37.5 5.8 Average labor cost 112.50 0.00 1,875.00 287.50 Total cost (for system) 338.56 0.00 4,691.23 374.92 Total cost (for system) per bus 338.56 0.00 938.25 74.98 Total cost (for system) per mile 0.01 0.00 0.01 0.00 Axle, Wheel, and Drive Shaft Repairs (ATA VMRS 11-Front Axle, 18-Wheels, 22-Rear Axle, 24-Drive Shaft) Parts cost 3.55 3.55 251.11 0.00 Labor hours 0.0 0.0 22.0 0.0 Average labor cost 0.00 0.00 1,100.00 0.00 Total cost (for system) 3.55 3.55 1,351.11 0.00 Total cost (for system) per bus 3.55 3.55 270.22 0.00 Total cost (for system) per mile 0.00 0.00 0.00 0.00 Tire Repairs (ATA VMRS 17) Parts cost 0.00 0.00 0.00 0.00 Labor hours 4.8 3.0 100.3 38.3 Average labor cost 237.50 150.00 5,012.50 1,912.50 Total cost (for system) 237.50 150.00 5,012.50 1,912.50 Total cost (for system) per bus 237.50 150.00 1,002.50 382.50 Total cost (for system) per mile 0.01 0.01 0.01 0.01
26
Notes 1. To compare the hydrogen fuel dispensed and fuel economy to diesel, the hydrogen dispensed was also converted into diesel energy equivalent gallons. Actual energy content will vary by locations, but the general energy conversions are as follows: Lower heating value (LHV) for hydrogen = 51,532 Btu/lb LHV for diesel = 128,400 Btu/lb 1 kg = 2.205 lb 51,532 Btu/lb * 2.205 lb/kg = 113,628 Btu/kg Diesel/hydrogen = 128,400 Btu/gal /113,628 Btu/kg = 1.13 kg/diesel gal 2. The propulsion-related systems were chosen to include only those systems of the vehicles that could be affected directly by the selection of a fuel/advanced technology. 3. ATA VMRS coding is based on parts that were replaced. If there was no part replaced in a given repair, then the code was chosen by the system being worked on. 4. In general, inspections (with no part replacements) were included only in the overall totals (not by system). Category 101 was created to track labor costs for PM inspections. 5. ATA VMRS 02-Cab and Sheet Metal represents seats, doors, etc.; ATA VMRS 50-Accessories represents things like fire extinguishers, test kits, etc.; ATA VMRS 71-Body represents mostly windows and windshields. 6. Average labor cost is assumed to be $50 per hour. 7. Warranty costs are not included.
27
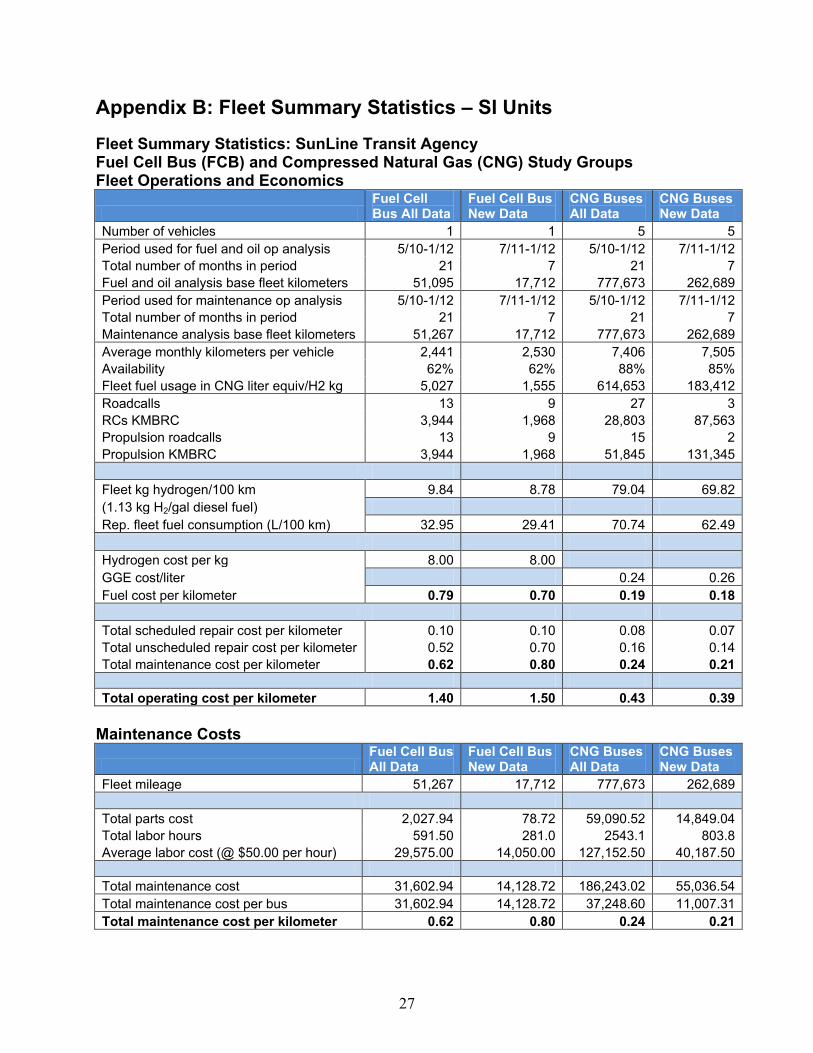
Appendix B: Fleet Summary Statistics – SI Units
Fleet Summary Statistics: SunLine Transit Agency Fuel Cell Bus (FCB) and Compressed Natural Gas (CNG) Study Groups Fleet Operations and Economics
Fuel Cell Bus All Data
Fuel Cell Bus New Data
CNG Buses All Data
CNG Buses New Data
Number of vehicles 1 1 5 5 Period used for fuel and oil op analysis 5/10-1/12 7/11-1/12 5/10-1/12 7/11-1/12 Total number of months in period 21 7 21 7 Fuel and oil analysis base fleet kilometers 51,095 17,712 777,673 262,689 Period used for maintenance op analysis 5/10-1/12 7/11-1/12 5/10-1/12 7/11-1/12 Total number of months in period 21 7 21 7 Maintenance analysis base fleet kilometers 51,267 17,712 777,673 262,689 Average monthly kilometers per vehicle 2,441 2,530 7,406 7,505 Availability 62% 62% 88% 85% Fleet fuel usage in CNG liter equiv/H2 kg 5,027 1,555 614,653 183,412 Roadcalls 13 9 27 3 RCs KMBRC 3,944 1,968 28,803 87,563 Propulsion roadcalls 13 9 15 2 Propulsion KMBRC 3,944 1,968 51,845 131,345 Fleet kg hydrogen/100 km 9.84 8.78 79.04 69.82 (1.13 kg H2/gal diesel fuel) Rep. fleet fuel consumption (L/100 km) 32.95 29.41 70.74 62.49 Hydrogen cost per kg 8.00 8.00 GGE cost/liter 0.24 0.26 Fuel cost per kilometer 0.79 0.70 0.19 0.18 Total scheduled repair cost per kilometer 0.10 0.10 0.08 0.07 Total unscheduled repair cost per kilometer 0.52 0.70 0.16 0.14 Total maintenance cost per kilometer 0.62 0.80 0.24 0.21 Total operating cost per kilometer 1.40 1.50 0.43 0.39
Maintenance Costs
Fuel Cell Bus All Data
Fuel Cell Bus New Data
CNG Buses All Data
CNG Buses New Data
Fleet mileage 51,267 17,712 777,673 262,689 Total parts cost 2,027.94 78.72 59,090.52 14,849.04 Total labor hours 591.50 281.0 2543.1 803.8 Average labor cost (@ $50.00 per hour) 29,575.00 14,050.00 127,152.50 40,187.50 Total maintenance cost 31,602.94 14,128.72 186,243.02 55,036.54 Total maintenance cost per bus 31,602.94 14,128.72 37,248.60 11,007.31 Total maintenance cost per kilometer 0.62 0.80 0.24 0.21