summary of the mayo 2001 late winter moose survey · summary we conducted an early-winter survey of...
TRANSCRIPT

MOOSE SURVEY
FARO
EARLY WINTER 2011
Prepared by:
Matt Clarke, Ryan Drummond, Rick Ward, and Susan Westover
June 2012

MOOSE SURVEY
FARO EARLY WINTER 2011
Yukon Fish and Wildlife Branch
TR-12-31
Acknowledgements We would like to thank the Ross River Dena Council and the communities of Ross River and Faro for their assistance and support. We would specifically like to thank Norman Sterriah and Kim Redies for their assistance in organizing local observers from Ross River. Thanks also to all of our observers, including Bernie Redies, Shawn Cain, Harald Rocca, Gordon Peter, Ray Henderson, Harold Boehm, Jessie Luchinski, Doug Hannah, Dustin Grantham, AJ Charlie, Hartwig Schaupp, Robbie Morris, Don Marks, and Terry Ladue. We would also like to thank Jim Healy (Whitehorse Air) for fixed-wing support during the stratification component of the survey, and Randy Marks (TRK Helicopters) and Doug Hladun (TransNorth Helicopters) for providing rotary aircraft support during the survey period. Environment Yukon (Fish and Wildlife Branch and Conservation Officer Services Branch) and Energy, Mines and Resources (Assessment and Abandoned Mines Branch) provided funding and staff for this survey. © 2012 Yukon Department of Environment
Copies available from: Yukon Department of Environment Fish and Wildlife Branch, V-5A Box 2703, Whitehorse, Yukon Y1A 2C6 Phone (867) 667-5721, Fax (867) 393-6263 E-mail: [email protected]
Also available online at www.env.gov.yk.ca Suggested citation: CLARKE, M., R. DRUMMOND, R. WARD, AND S. WESTOVER. 2012. Moose survey: Faro early-winter
2011. Yukon Fish and Wildlife Branch Report TR-21-31, Whitehorse, Yukon, Canada.

Moose Survey Faro Early Winter 2011 i
Summary We conducted an early-winter survey of moose in the area north of Faro 3 –18 November 2011. The main purpose of this survey was to estimate the abundance, distribution, composition, and population trend of the local moose population.
Total Survey Area • We attempted to count all moose in survey blocks covering about 31% of the
area. We counted a total of 866 moose: 210 adult bulls, 522 adult and yearling cows, 37 yearling bulls, and 97 calves.
• We estimated the population at 2,352±23% moose in the entire survey area compared to 2450±27% in 2004. The 2011 estimate was equal to a density of about 364 moose per 1,000 km2 of total area. This estimate was above the Yukon-wide average of about 157 moose per 1,000 km2 of total area.
• The adult bull per 100 adult cow ratio declined from 53 in 2004 to 42 in 2011. This figure is below the Yukon average of 64 bulls for every 100 adult cows but at a level considered adequate to ensure that cows are bred during the rut.
• We estimated that there were about 19 calves and 15 yearlings for every 100 adult cows in the total survey area. This ratio suggests that survival of calves was low during the summer and fall of 2011, and average for calves born in 2010.
Game Management Subzone 4-45 • While individual GMS are not generally treated as independent areas in our
assessments or population management strategies. GMS 4-45 has been consistently assessed over three census surveys due to concerns over access and overall harvest patterns. Given the additional information for this subzone, we conducted a separate analysis to identify potential long term trends.
• We estimated 406±28% moose in 2011 compared to 485±30% in 2004 and 566±20% in 1997. This represents an annual decline of 2% or a decrease of 28% since 1997.We estimated that there were about 32 adult bulls for every 100 adult cows in GMS 4-45. This number is well below the current Yukon average of 64 adult bulls per 100 adult cows.
• We estimated that there were about 20 calves and 9 yearlings for every 100 adult cows in GMS 4-45. This ratio suggests that survival of calves was low during the summer and fall of 2011, and for 2010.
• Reported moose harvest by licensed hunters in GMS 4-45 was higher than the allowable range set out in the Yukon moose management guidelines. This data does not include harvest by First Nations hunters.

Moose Survey Faro Early Winter 2011 ii
Table of Contents Acknowledgements ......................................................................... Inside Cover Summary ......................................................................................................... i
Total Survey Area .......................................................................................... i Game Management Subzone 4-45.................................................................. i
Table of Contents ............................................................................................ ii List of Tables.................................................................................................. iii List of Figures ................................................................................................ iii Introduction .................................................................................................... 1
Previous Surveys .......................................................................................... 1 Present Survey ............................................................................................. 1 Community Involvement ............................................................................... 4
Study Area ...................................................................................................... 4 Methods .......................................................................................................... 5 Weather and Snow Conditions ........................................................................ 7 Results and Discussion ................................................................................... 7
Entire 2011 Faro Survey Area (GMS 4-38, 4-40 [partial], 4-42 through 4-48, and 4-51) ..................................................................................................... 8
Identification of High and Low Moose Density Blocks ................................. 8 Coverage .................................................................................................... 8 Observations of Moose ............................................................................... 8 Distribution and Abundance of Moose ....................................................... 8 Ages and Sex of Moose ............................................................................. 11 Age Ratios and Recruitment ..................................................................... 12 Harvest .................................................................................................... 12 Faro Area Volunteer Harvest Restriction Program ..................................... 17
Game Management Subzone 4-45............................................................... 19 Status and Trend: 1997 to 2011 .............................................................. 19 Moose Abundance and Trend ................................................................... 19 Composition and Sex Ratios..................................................................... 19 Age Ratios and Recruitment ..................................................................... 23 Harvest .................................................................................................... 23
Entire Faro Study Area, excluding GMS 4-45 .............................................. 23 Other Wildlife Sightings ................................................................................ 25 Conclusions and Recommendations .............................................................. 26 Literature Cited ............................................................................................. 27 APPENDIX 1 – Results of the 2011 and 2004 early-winter moose population surveys of the entire Faro study area excluding GMS 4-45. ........................... 29

Moose Survey Faro Early Winter 2011 iii
List of Tables Table 1. Observations of moose during the November 2011 survey in the Faro
survey area. ............................................................................................ 11 Table 2. Results of the 2011 and 2004 early-winter moose population surveys
of the Faro area. ..................................................................................... 14 Table 3. Average annual (2007-2011) reported moose harvest 1 and allowable
harvest summary for the 2011 Faro survey area. .................................... 15 Table 4. Average annual (2007-2011) reported moose harvest1 and allowable
harvest summary for the Faro voluntary harvest restriction area. ............ 22 Table 5. Results of the 1997, 2004 and 2011 early-winter moose population
surveys of the Faro Game Management Subzone (GMS) 4-45 comparison area. ....................................................................................................... 24
List of Figures Figure 1. 2011 Faro moose census area. ......................................................... 2 Figure 2. Moose survey history, Faro area. ...................................................... 3 Figure 3. Fire history in the Faro moose survey area. ...................................... 6 Figure 4. Stratification results in the Faro moose survey area.......................... 9 Figure 5. Census survey results in the Faro moose survey area. .................... 10 Figure 6. Moose harvest rates in the Faro study area..................................... 16 Figure 7. Annual reported moose harvest (1979-2011) and 3% to 4% annual
allowable harvest (AAH) range in the Faro survey area. ........................... 18 Figure 8. Annual reported moose harvest (1994-2011) and annual allowable
harvest (AAH) levels in the voluntary harvest restriction area. ................. 20 Figure 9. Annual reported moose harvest (1994-2011) by hunter type in the
voluntary harvest restriction area (GMS 4-42 to 4-46). ............................ 21


Moose Survey Faro Early Winter 2011 1
Introduction This report summarizes the results of the early-winter survey of moose in the Faro survey area 3–18 November 2011 (see Figure 1). The main purpose of this survey was to estimate the abundance, distribution, composition, and population trend of the local moose population.
Previous Surveys Moose population monitoring in the Faro area began in 1997 with a census survey (also known as an early-winter intensive population survey). We surveyed Game Management Subzone (GMS) 4-45 to determine moose numbers, distribution, and population composition (Yukon Renewable Resources 1997; Figure 2). We were concerned about GMS 4-45 because increased access meant it was being more heavily hunted (Yukon Renewable Resources 1997; Figure 2).
We carried out a less intensive trend survey of the sub-alpine plateau in GMS 4-45 in 1999 (Yukon Renewable Resources 1999) to monitor population composition and trend. We also carried out 2 low intensity early-winter composition surveys in 1998 and 1999 (Yukon Renewable Resources 1998, 1999).
Between 2002 and 2005 we conducted a telemetry study, where satellite radio collars were used on 13 moose. The goal of the study was to find out the proportion of resident and non-resident moose rutting in the area. We also wanted to look at their movement patterns and travel
distances, to see if there was any evidence that the area could sustain a high annual harvest rate, because of local concerns about the long-term welfare of the moose population (Environment Yukon 2007).
The 2004 census survey covered a larger area than the 1997 survey to address continuing concerns about increased moose harvest as well as moose numbers, distribution, and age/sex characteristics in areas next to GMS 4-45 (Environment Yukon 2004). The 2011 survey covered the same area as in 2004.
Because we surveyed GMS 4-45 using similar methods in 1997, 2004, and 2011, we can compare the results to help us understand the status of the moose population in this area of high-quality moose habitat.
Present Survey The 2011 survey was part of continued monitoring of high-priority moose populations throughout Yukon. High-priority populations are ones that are being harvested in relatively high numbers and/or their habitat is threatened.
The mountain blocks to the north and east of Faro, particularly in the GMS 4-45 area, are important rutting and post-rutting areas for moose (Figure 2). GMS 4-45 has also become a popular hunting area for many Yukon residents. Concentrations of moose, particularly in accessible sub-alpine regions during the rut, make them vulnerable to over-harvest.

Moose Survey Faro Early Winter 2011 2
Figure 1. 2011 Faro moose census area.
62•3JD'N
62•0'D'N
13,'UD'W
Map 1 ' 2011 Faro Moose Census Area
CJ Survey Area
C3 Game Management Sub zones
0 5 10 1"""""1
20
Kilometres
40
Dgital Chan oflhe Wortd (OCVll)compiled by U.S. Defense Mip ping Agency at 1 : 1 D 00 ,000.
1 Game MinagemeM Subzones r compiled by 8nBronmeM 'rukon against 1 : 1 ,000 ,000 0 CW. Shaded relief created by &wironmeM Yukon tomtheir 30m digital elev.Jtion model.
Milp compiled May2012 by &wironmeM Yukon, Watson Lake, YT.
13,'UD'W
13J'UD'W 132'UD'W
•3JD'N
·auN
13J'UD'W 132'UD'W

Moose Survey Faro Early Winter 2011 3
Figure 2. Moose survey history, Faro area.
62•3J[fN
62·naN
134'U[fW
~~~~----~----~------~------~~ d Map2 ta Survey History
/
!" CJ Census Area 2004 and 2011 ' Mount Gilli~
00 GM S 4-45 Intensive Survey 1997
D GMS 4-45 Census Subset 2004 and 2011
c::3 Game Management Subzones
0 5 10 20 40
13,'U[fW
13J'U[fW
13J'U[fW
132'U[fW
Dgilal Chan oflhe Wortd (OCVll)compiled by U.S. Defense
Mlpp;ngAgencyat1:1000,000 ~ Game Min agement Subz ones compiled by 8nBron me nt 'ru kon aga•nst 1 1 ,000 ,000 0 CW
~~·~,:] ~~~~r:l:f;.::ne::~the•r 30m d1gital elewhOn model C
132'U[fW
•3J[fN
·naN

Moose Survey Faro Early Winter 2011 4
Community Involvement Moose have been a key part of the subsistence lifestyle for generations of First Nation peoples. Today, moose is the game species most widely hunted by both First Nation and non-First Nation hunters.
Faro community members have been concerned for some time about high hunting pressure and moose harvest in GMS 4-45. They want to make sure that hunting opportunities are maintained for future generations. Both Ross River and Faro community members have participated as observers in moose surveys in the area. The moose harvest has also been monitored very carefully, with greater scrutiny than most areas of Yukon.
A voluntary harvest threshold system has been used in the Faro area since 1999 (details of this program are available in the Harvest section of this report). This program was developed in collaboration with Faro area residents and others to show that harvest can be managed voluntarily instead of using legislative means, such as closures or permits.
In the last few years, the voluntary harvest threshold has been reached early in September because of the high hunter interest in the area. Compliance with the voluntary closure has declined as a result. During recent community meetings, Faro residents have said that they would like to pursue a new management system, preferably by legislative means.
Study Area The Faro survey area is about 6,470 square kilometres (km2). Most of the area is habitable moose range (about 6,084 km²), except for alpine habitats that are 1,676 m (5,500 ft.) or more above sea level and water bodies larger than 0.5 km2. The survey area stretches south from the South Macmillan and Riddell rivers to the Robert Campbell Highway, and east from Drury Lake to Tay and Dragon lakes (Figure 1). It includes Game Management Subzones 4-38, 4-40 (western portion), 4-42 through 4-48, and 4-51. The major geographic features are the Anvil and South Fork mountain ranges, and the Pelly River valley.
The survey area lies in the Yukon Plateau North ecoregion (Yukon Ecoregions Working Group 2004). This ecoregion is made up of relatively rolling highlands with an east–west orientation. Mean annual temperatures are near –5°C, but temperatures vary widely by season and elevation. Extreme temperatures in the lower valley floors have ranged from –62 to 36°C (Yukon Ecoregions Working Group 2004). In higher areas, the extremes are more moderate.
Rain and snow fall is relatively moderate in the ecoregion, but is higher in the east because of the mountains. Annual amounts range from 300 to 600 mm. Winds are usually light, and only moderate to strong in thunderstorms or unusually active weather systems (Yukon Ecoregions Working Group 2004). High elevation slopes (1,500–

Moose Survey Faro Early Winter 2011 5
1,800 m) are mainly covered with willow (Salix sp.) and shrub birch (Betula glandulosa). Lower elevations are covered with black spruce (Picea mariana) and white spruce (P. glauca). Trembling aspen (Populus tremuloides) or lodgepole pine (Pinus contorta) grow in warmer and better-drained sites (Yukon Ecoregions Working Group 2004).
Large forest fires in this region between 1946 and today have produced forest stands of many different ages (Figure 3). Most of the recent fires in the study area (between 2000 and 2010) occurred near the South Fork range, and as far east as the 2010 burns around Laforce and Teddy lakes. Older fires took place south of the Faro town site in 1958 and north of the town site in 1969. In 1980 a fire burned east of Swim Lakes, and smaller fires occurred in the 1990s. The western part of the study area between the Pelly River and Drury Lake is an area of old burns from fires in 1951, 1953, and 1958. The old burn of 1958 also covers parts of the Tay River valley and the 1953 burn covers an area north of Connolly Lake.
Methods We have adapted a relatively new survey technique, developed by the Alaska Department of Fish and Game (Kellie and DeLong 2006) to survey moose. The field sampling is similar to the way we carried out our moose surveys in the past, except that we count moose in rectangular rather than irregularly
shaped survey units. The technique has 6 steps:
1. The survey area is divided into uniform rectangular blocks about 16 km² each in size.
2. Observers in fixed-wing aircraft fly over all the blocks, and classify (or “stratify”) each block as having either high, medium, low, or very low expected moose numbers, based on local knowledge, number of moose seen, tracks, and habitat. This is called the “stratification” part of the survey.
3. We combine these categories of blocks into high or low “strata,” and then randomly select a sample of blocks in each stratum for our census. We usually select a higher proportion of the high blocks than the low blocks.
4. We try to count every moose within the selected blocks (the “census” part of the survey), using helicopters at a search intensity of about 2 minutes per km2. We classify all moose by age (adult or calf) and sex. Yearling cows are often difficult to distinguish from adults, so they are counted together.
5. To estimate the number of moose that we missed during Step 4, we repeat our counts at double the search intensity in a portion of our survey blocks. We use these double counts to develop a “sightability correction factor” to correct the census results for moose that we overlooked.

Moose Survey Faro Early Winter 2011 6
Figure 3. Fire history in the Faro moose survey area.
Map3 Fire History in the Faro Survey
111111 1946-1960
111111 1961-1970
111111 1971-1980
111111 111111 111111
1981-1990
1990-2000
2001 - 201 0
c:J 2011 Faro Moose CensusArea
~ Game Management Subzone 4-45
0 5 10 20 14111
Game Minagement Subzones ~ compiled by 8nBron me nt 'ru kon against 1 : 1 ,000 ,000 0 CW. Shaded rel;efcreated by C• ,._".,.."'L-I 8nBronment Yukon tomtheir 30m digital elev.Jtion model.

Moose Survey Faro Early Winter 2011 7
6. We use computer programs to estimate the total number of moose by age and sex in the entire survey area.
We base the estimate on the numbers of moose counted in the blocks during the census, the distribution of these blocks, how we classified the blocks we did not count, and the sightability corrections (Becker and Reed 1990). Generally, the more blocks that are searched during the census portion of the survey, the more precise and reliable the resulting population estimate.
In the harvest section of this report, we estimate total moose numbers in each Game Management Subzone (see Tables 5 and 6) by multiplying the average estimated moose density in the high and low stratum blocks by the number of high and low stratum blocks per Game Management Subzone respectively.
We use appropriate statistical tests to compare estimates between years and use alpha = 0.1 as the cut-off for significance.
Weather and Snow Conditions Weather conditions were variable during this survey. Temperatures were moderate to cold, ranging from –7° C to –26°C. Winds were mainly light to calm, with a few days of moderate to strong winds (National Climate Data and Information Archive 2012). We were able to fly every day of the survey period,
although several days were cut short because of snow and visibility problems. Light conditions varied, with a similar number of days with bright light to days with flat light.
Snow depth was intermediate (greater than 15 cm) and coverage was complete. Light snow fell throughout the survey period, which helped survey crews to track and sight moose. Snowpack conditions in the study area between October 2011 and February 2012 were above average by 11% to 30% (Yukon Department of Environment 2012). Although snow depth and accumulation were higher than average in the Faro area during the 2011–2012 winter, the snow conditions during the survey were average and probably did not affect the distribution of moose.
Results and Discussion The 2011 survey covered the same area as the 2004 survey and included 9 complete Game Management Subzones (GMSs) and one partial GMS. We present results for the entire 2011 Faro survey area—GMS 4-38, 4-40 (partial), 4-42 through 4-48, and 4-51—and compare them to our 2004 survey results. In a separate section, we present longer-term trends and comparisons for GMS 4-45, going back to 1997.

Moose Survey Faro Early Winter 2011 8
Entire 2011 Faro Survey Area (GMS 4-38, 4-40 [partial], 4-42 through 4-48, and 4-51) Identification of High and Low Moose Density Blocks
We classified 201 (49.6%) of the 405 survey blocks as having high expected moose numbers and 204 (50.4%) as having low expected moose numbers (Figure 4). Most of the blocks with higher expected moose numbers were in the subalpine areas in the Anvil and South Fork ranges, including Mount Mye, Mount Aho, Mount Connolly, Mount Kulan, and the willow plateau north of Mount Mye.
Coverage
We surveyed 127 of the 405 blocks, or approximately 31% of the total area (Figure 5). This number included 90 of 201 (44.8%) blocks expected to contain relatively high numbers of moose, and 37 of 204 (18.1%) blocks expected to contain few or no moose.
It took 62.9 hours to count moose in these blocks, for a total search intensity of 1.86 minutes per km². Search intensity was slightly lower in the high-abundance blocks (1.85 minutes per km²) than in the low-abundance blocks (1.90 minutes per km²).
We used an additional 7.5 hours to recount portions of survey blocks to calculate our sightability correction factor (SCF). Overall, the SCF recounts resulted in 7 additional moose sighted.
We used another 32.7 hours of helicopter time in ferrying between survey blocks, to a remote fuel cache near Dragon Lake on the North Canol Road, and back and forth to Faro. Total flight time (survey and ferry time combined) was 103.1 hours.
Observations of Moose
We counted a total of 866 moose: 210 adult bulls, 522 adult and yearling cows, 37 yearling bulls, and 97 calves (Table 1). We observed an average of 570 moose for every 1,000 km² in the high-abundance blocks, and 80 moose per 1,000 km² in the low blocks.
Distribution and Abundance of Moose
In early winter, moose tend to concentrate in shrubby areas, subalpine willow flats, and creek draws with abundant willows. In 2011, we saw most of the moose in and around high-elevation subalpine habitats in the Anvil and South Fork mountain ranges and in the Mount Connolly and Mount Kulan areas, with few moose seen in the valley bottoms (Figure 5). The one notable exception was an area south of the Riddell River, where we saw 20 moose at lower elevation in an old burn on a north-facing slope. Tracks in the area showed that these moose had moved down from the subalpine, possibly due to the harsh winter weather in the area overnight. In general, the distribution of moose was consistent with the previous early winter survey in 2004 (Environment Yukon 2004).

Moose Survey Faro Early Winter 2011 9
Figure 4. Stratification results in the Faro moose survey area.
62•3JD'N
62•0'D'N
d Ia
13,'UD'W
Map4 <;: stratification Survey Results in the Faro Moose Survey Area
Mount'Gillis D 2011 Faro Survey Area
Expected Number of Moose per Block
D High (High Stratum)
D Low (Low Stratum) 0 5 10 20
134'UD'W
13J'UD'W
13J'UD'W
132'UD'W
Game Min agement Subz ones compiled by 8nBron me nt 'ru kon against 1 : 1 ,000 ,000 0 CW. Shaded relief created by 8nBronment Yukon tomtheir 30m digital elewtion model.
132'UD'W
•3JD'N
·auN

Moose Survey Faro Early Winter 2011 10
Figure 5. Census survey results in the Faro moose survey area.
134~0'W
Map 5 Census Survey Results in the
Faro Moose Survey Area ~ Survey Area
~GMS 4-45 0 Moose Observed in Survey Unit
1 to 10 Moose Observed in Survey Unit
More than 10 Moose Observed in Survey Unit
20
134"0'0"W
30 40
I
\.:
Digital Chan of the VJorld (DCW) compiled by u .s . Defense
MappingAgencyat1:1,000,000 ~ Game Management Subzones compiled by Environment Yukon against 1:1,000,000 OCW. Shaded relief created by EnVJ.·ron":lent Yukon from their 30 m d!Qital elevat•on model.
Map compiled May 2012 by C ....._ Enwonment Yukon. Watson ~ Lake, YT.
132"0'0''W
"O'O''N
Moose Survey Faro Early Winter 2011 11
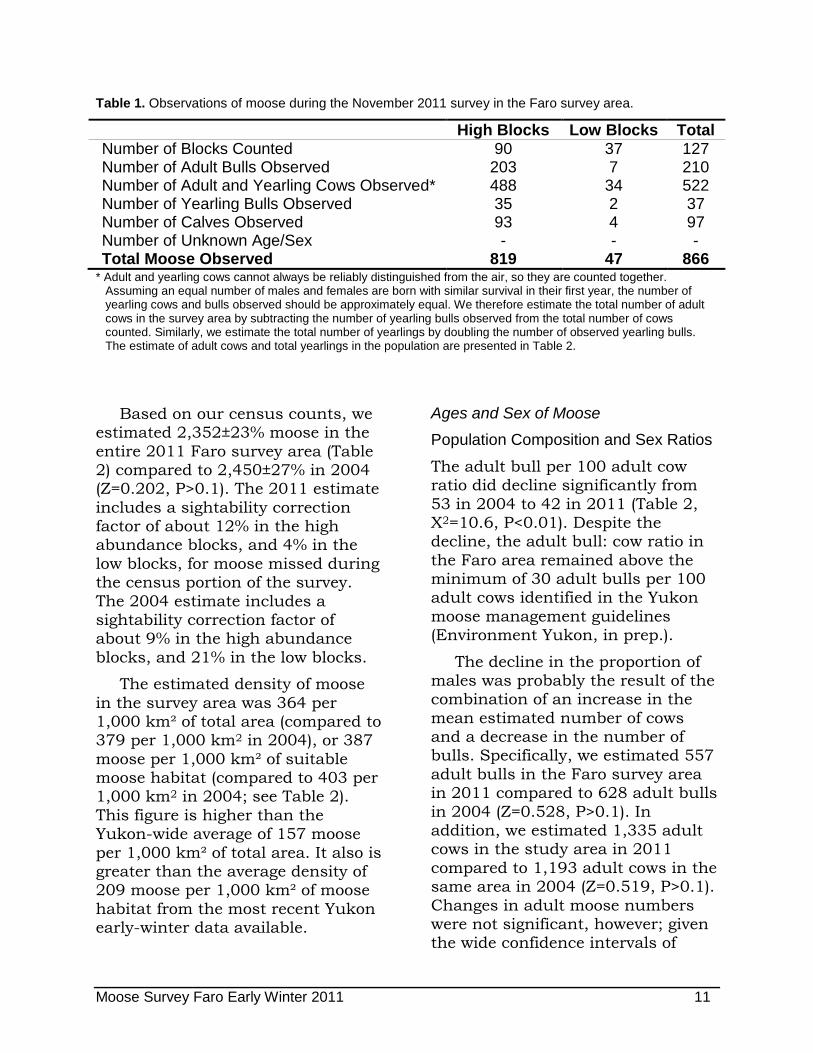
Table 1. Observations of moose during the November 2011 survey in the Faro survey area.
High Blocks Low Blocks Total Number of Blocks Counted 90 37 127 Number of Adult Bulls Observed 203 7 210 Number of Adult and Yearling Cows Observed* 488 34 522 Number of Yearling Bulls Observed 35 2 37 Number of Calves Observed 93 4 97 Number of Unknown Age/Sex - - - Total Moose Observed 819 47 866
* Adult and yearling cows cannot always be reliably distinguished from the air, so they are counted together. Assuming an equal number of males and females are born with similar survival in their first year, the number of yearling cows and bulls observed should be approximately equal. We therefore estimate the total number of adult cows in the survey area by subtracting the number of yearling bulls observed from the total number of cows counted. Similarly, we estimate the total number of yearlings by doubling the number of observed yearling bulls. The estimate of adult cows and total yearlings in the population are presented in Table 2.
Based on our census counts, we estimated 2,352±23% moose in the entire 2011 Faro survey area (Table 2) compared to 2,450±27% in 2004 (Z=0.202, P>0.1). The 2011 estimate includes a sightability correction factor of about 12% in the high abundance blocks, and 4% in the low blocks, for moose missed during the census portion of the survey. The 2004 estimate includes a sightability correction factor of about 9% in the high abundance blocks, and 21% in the low blocks.
The estimated density of moose in the survey area was 364 per 1,000 km² of total area (compared to 379 per 1,000 km2 in 2004), or 387 moose per 1,000 km² of suitable moose habitat (compared to 403 per 1,000 km2 in 2004; see Table 2). This figure is higher than the Yukon-wide average of 157 moose per 1,000 km² of total area. It also is greater than the average density of 209 moose per 1,000 km² of moose habitat from the most recent Yukon early-winter data available.
Ages and Sex of Moose
Population Composition and Sex Ratios
The adult bull per 100 adult cow ratio did decline significantly from 53 in 2004 to 42 in 2011 (Table 2, X2=10.6, P<0.01). Despite the decline, the adult bull: cow ratio in the Faro area remained above the minimum of 30 adult bulls per 100 adult cows identified in the Yukon moose management guidelines (Environment Yukon, in prep.).
The decline in the proportion of males was probably the result of the combination of an increase in the mean estimated number of cows and a decrease in the number of bulls. Specifically, we estimated 557 adult bulls in the Faro survey area in 2011 compared to 628 adult bulls in 2004 (Z=0.528, P>0.1). In addition, we estimated 1,335 adult cows in the study area in 2011 compared to 1,193 adult cows in the same area in 2004 (Z=0.519, P>0.1). Changes in adult moose numbers were not significant, however; given the wide confidence intervals of

Moose Survey Faro Early Winter 2011 12
estimates (Table 2) a difference of over 500 cows and 250 bulls would be required between surveys to detect a change with 90% confidence.
Age Ratios and Recruitment
Calf survival to early winter was poor (19 calves per 100 adult cows; see Table 2). This figure was well below the Yukon average of 33 calves per 100 adult cows, and below the minimum 25 calves per 100 adult cows for maintaining stable moose populations (Environment Yukon, in prep.). The number of calves added to the population in 2011 was significantly lower than the recruitment of 36 calves per 100 adult cows estimated for the area in 2004 (X2=51.179, P<0.001).
One percent of cow-calf groups contained twins, which was much lower than the 8% estimated during the 2004 survey. Despite the lower observed calf recruitment in 2011, calf survival varies greatly depending on temperature, precipitation, snow depth, and predation. We cannot determine specific trends in calf recruitment when we are only comparing data from 2 years. If calf recruitment remains low over several years compared to the Yukon average, it suggests a decreasing moose population.
Yearling recruitment was average in 2011 (10 yearlings per 100 adult moose; Table 2). This figure is within the 8 to 15 yearlings per 100 adult moose that normally shows a stable to increasing moose population (Environment Yukon, in prep.). In 2004, estimated yearling recruitment was also 10 yearlings per 100 adult moose.
Harvest
Several indicators suggest that that harvest in the entire Faro survey area is approaching and possibly exceeding the maximum recommended bull harvest rate of 4% (Yukon Renewable Resources 1996) as a result of high harvest pressure in several GMS.
Specifically, we calculated that an average of 51moose (2007 to 2011) were harvested annually in the entire survey area by licensed hunters for a licensed harvest rate of 2.2% (Table 3). We usually estimate First Nation harvest as equal to that of licensed resident hunters. As such, we calculated a total average annual harvest rate of 3.4%.
On an annual basis, the reported harvest peaked at 71 moose in 2006, which would represent a total harvest of 6% of the 2011 population with estimated First Nation harvest factored in. Similarly, in each of the previous 5 years, the total estimated harvest ranged from 4.0 to 4.8% of the 2011 population.

Moose Survey Faro Early Winter 2011 13
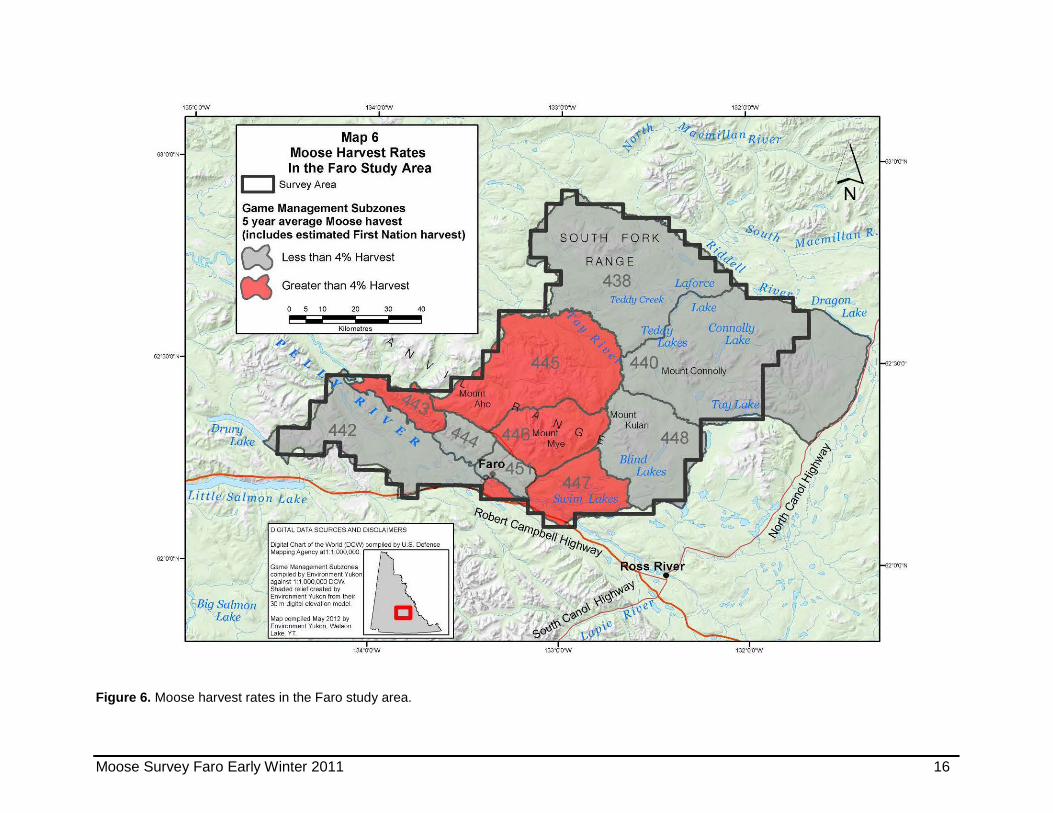
At a finer scale, average harvests in several GMS (4-43, 4-45, 4-46, and 4-47) exceeded the recommended maximum allowable rate of 4% when estimated First Nation harvest is included (Table 3, Figure 6). Within this group, some subzones are much smaller than others and can skew the interpretation of regional harvest rates. Therefore we combined the information from these areas of higher hunting pressure and calculated a licensed harvest rate of 4.3%. Total average harvest rate could be as high as 8.1% when First Nation harvest is estimated. This high harvest rate is probably the result of concentrations of moose in accessible sub-alpine regions and the expansion of off-road vehicle access trails from the Faro mine and surrounding area
Although there is year to year variation in the reported moose harvest by licensed hunters in the Faro study area, several long-term trends are apparent (Figure 7). First, there has been a relatively higher level of reported harvest in the Faro study area since 1995 (37 to 71 moose) compared to years previous. Second, the special guided harvest also has increased during this time period.
Lastly, information from moose radio collared in the Faro area from 2002 to 2005 indicates that most radio collared moose remained within 15 to 20 km of their original capture site (Yukon Fish and Wildlife Branch 2007). This data suggests that movement of moose among GMSs is relatively low, so that local over harvest may not be
replenished from surrounding subzones where harvest is lower.
The total harvest rates reported are a combination of licensed and First Nation harvest, each with its own biases. Specifically, the reported licensed harvest represents a minimum number of known hunted bulls whereas the estimate for the First Nation harvest could be skewed in either direction and may include cows. The harvesting of cow moose is a direct loss of reproductive capacity in a population and affects the maximum harvest rate that a population can sustain (Environment Yukon, in prep.).
Acknowledging the uncertainty in harvest estimates, results strongly suggest that the Faro area population is hunted at or above the maximum recommended harvest levels. The fact that harvest rates greater than 5% carry an unacceptably high risk of reducing a population (Gasaway et al. 1992) highlights the need for accurate harvest data, particularly in areas where estimated harvest rates approach these levels. Lastly, because frequent monitoring of hunted areas is not possible, the best alternative is for harvest to remain consistent and within conservative levels of the recommended harvest range to prevent significant population declines (Fryxell et al. 2010).

Moose Survey Faro Early Winter 2011 14
Table 2. Results of the 2011 and 2004 early-winter moose population surveys of the Faro area.
(* = statistically significant change)
Survey Year 2011 2004 Estimated Abundance1 (90% Confidence Range)2 Total Moose 2352 ± 23% (1819-2884) 2450 ± 27% (1777-3123) Adult Bulls (> 30 months) 557 ± 24% (421-692) 628 ± 32% (427-829) Adult Cows (> 30 months) 1335 ± 25% (1000-1670) 1193 ± 28% (855-1532) Yearlings (Approx. 18 months)3 205 ± 30% (144-266) 197 ± 70% (59-336) Calves (> 12 months) 256 ± 24% (196-317) 430 ± 32% (293-568) Unknown age/sex - - Estimated Population Ratios4 (90% Confidence Range)2 % Adult Bulls 24% ± 12% (21-26%) 26% ± 20% (21-31%) % Adult Cows 57% ± 6% (53-60%) 49% ± 11% (43-54%) % Yearlings 8% ± 26% (6-11%) 8% ± 59% (3-13%) % Calves 11% ± 14% (10-12%) 17% ± 20% (14-21%) % Unknown Age/Sex - - Adult Bulls per 100 Adult Cows 42 ± 17% (34-49)* 53 ± 29% (38-68) Yearlings per 100 Adult Cows 15 ± 30% (11-19) 16 ± 66% (6-27) Yearlings per 100 Adults 10 ± 26% (7-12) 10 ± 57% (4-15) Calves per 100 Adult Cows 19 ± 16% (16-22)* 36 ± 20% (28-43) % of Cow-Calf Groups with Twins5 1% ± 130% (0-2%) 8% ± 100% (0-16%) Density of Moose (per 1,000 km2)1 Total Area (6469.7 km2) 364 379 Moose Habitat Only6 (6084.3 km2) 387 403 1 Estimated numbers provided are based on a Not Pooled “sightability correction factor” or SCF applied to data analyzed using Geospatial analysis. In 2011, a SCF of 1.123 was applied to the High stratum and an SCF of 1.042 was applied to the Low stratum. In 2004 a SCF of 1.092 was applied to the High stratum and an SCF of 1.211 was applied to the Low stratum. The SCF is used to correct the estimate of moose abundance for animals that were missed by the survey crews during the census (see step 5 of methods section for a description of how the SCF is calculated).
2 This means that we are 90% sure that the true number of moose in the area lies within the range of moose numbers given in the brackets. 3 To account for yearling cows that cannot be identified from the air, the total number of yearlings is assumed to equal the estimated number of yearling bulls in the population x 2.
4 Estimated Population Ratios provided are based on the same Not Pooled “sightability correction factor” or SCF for 2011 and 2004 given above, but is applied to data analyzed using the Stratified Random Block MoosePop software. 5 Twinning Rate = the number of cows with 2 calves divided by the total number of cows with calves. It represents what percentage of cows that had calves, had twins.
6 Suitable moose habitat is considered all areas at elevations lower than ~1676 m (5.500 ft.), excluding water bodies ≤0.5 km2.

Moose Survey Faro Early Winter 2011 15
Table 3. Average annual (2007-2011) reported moose harvest 1 and allowable harvest summary for the 2011 Faro survey area.
(Game Management Subzone (GMS) 4-38, 4-40, 4-42 to 4-48, 4-51.)2
GMS GMS Area (km2)
Estimated Density3 (moose/
1000 km2)
Total Estimated number
of Moose
Average Resident Harvest
Average Non-
Resident Harvest
Average (Special Guided) Harvest
Average Reported Harvest1
(2007-2011)
Current Harvest
Rate (% of total
population)
2% Allowable
Annual Harvest
3% Allowable
Annual Harvest
4% Allowable
Annual Harvest
4-38 1368.3 365 499.4 1.4 3.2 0.2 4.8 1.0 10.0 15.0 20.0 4-40 1903.8 390 742.5 3.0 7.8 1.2 12.0 1.6 14.8 22.3 29.7 4-42 830.5 220 182.7 1.4 0.8 0.0 2.2 1.2 3.7 5.5 7.3 4-43 170.4 85 14.5 1.6 0.0 0.0 1.6 11.0 0.3 0.4 0.6 4-44 148.3 330 48.9 0.8 0.0 0.0 0.8 1.6 1.0 1.5 2.0 4-45 1034.8 385 398.4 19.0 1.6 1.2 21.8 5.5 8.0 12.0 15.9 4-46 422.7 560 236.7 4.8 0.0 0.0 4.8 2.0 4.7 7.1 9.5 4-47 421.3 130 54.8 1.6 0.0 0.4 2.0 3.6 1.1 1.6 2.2 4-48 668.7 445 297.6 0.4 0.0 0.4 0.8 0.3 6.0 8.9 11.9 4-51 132.4 140 18.5 0.2 0.0 0.0 0.2 1.1 0.4 0.6 0.7
Total 7101.2 351.2 2494.0 34.2 13.4 3.4 51.0 2.0 49.9 74.8 99.8
1 Does not include harvest by First Nations’ members. 2 The 2011 Faro survey area includes only the west half of GMS 4-40. However, GMS 4-40 data was included in the table due to the number of moose harvested in the vicinity of Connolly Lake, which was within the survey boundaries. Differences in the total estimated number of moose in Table 3 and Table 2 for the 2011 Faro survey area is due to the different area (total area in Table 3 vs. western portion only in Table 2) of GMS 4-40 used to calculate the estimate. 3 Based on 2011 Faro MoosePop SCF Not Pooled moose survey results.
Moose Survey Faro Early Winter 2011 16
Figure 6. Moose harvest rates in the Faro study area.
63'"0'0"N
629 30'0"'N
62'"0'0"'N
135"0'0'W 134"0'0'W
Map 6 Moose Harvest Rates In the Faro Study Area
c:::J Survey Area
Game Management Subzones 5 year average Moose havest (includes estimated First Nation harvest)
C3 Less than 4% Harvest
" Greater than 4% Harvest
20 30 40
I Kilometres
,.,1 -:4 tV
~Big Salmon Lake
Game Management Subzones complied by Enwonment Yukon aga inst 1·1 ,000,000 OCW Shaded relief created by Environment Yukon from the1r 30m digital eleva tioo model
Map compiled May 2012 by Environment Yukon , Watson Lake, YT
134"0'0'W
133"0'0'W
RANGE
438
132"0'0'W
O"N
132"0'0'W

Moose Survey Faro Early Winter 2011 17
Faro Area Volunteer Harvest Restriction Program
In an effort to reduce harvest in the area, the Faro Voluntary Harvest Restriction Program has been in place since 1999-2000. This program was intended to keep the moose population healthy while allowing Yukon hunters to stay voluntarily within harvest limits instead of using legislative means (e.g. permit hunt system, registration hunts). Once the total allowable harvest in the area is reached, signs are put up asking hunters to hunt elsewhere that season. Hunters are also asked to voluntarily stop special guiding in the area.
At first the program applied only to GMS 4-45, with an annual allowable harvest of 25 moose. In 2003, over-harvesting in the adjacent subzones became a concern as well. The program was expanded to include GMS 4-42, 4-43, 4-44, 4-45 and 4-46, with a total annual allowable harvest of 38 moose.
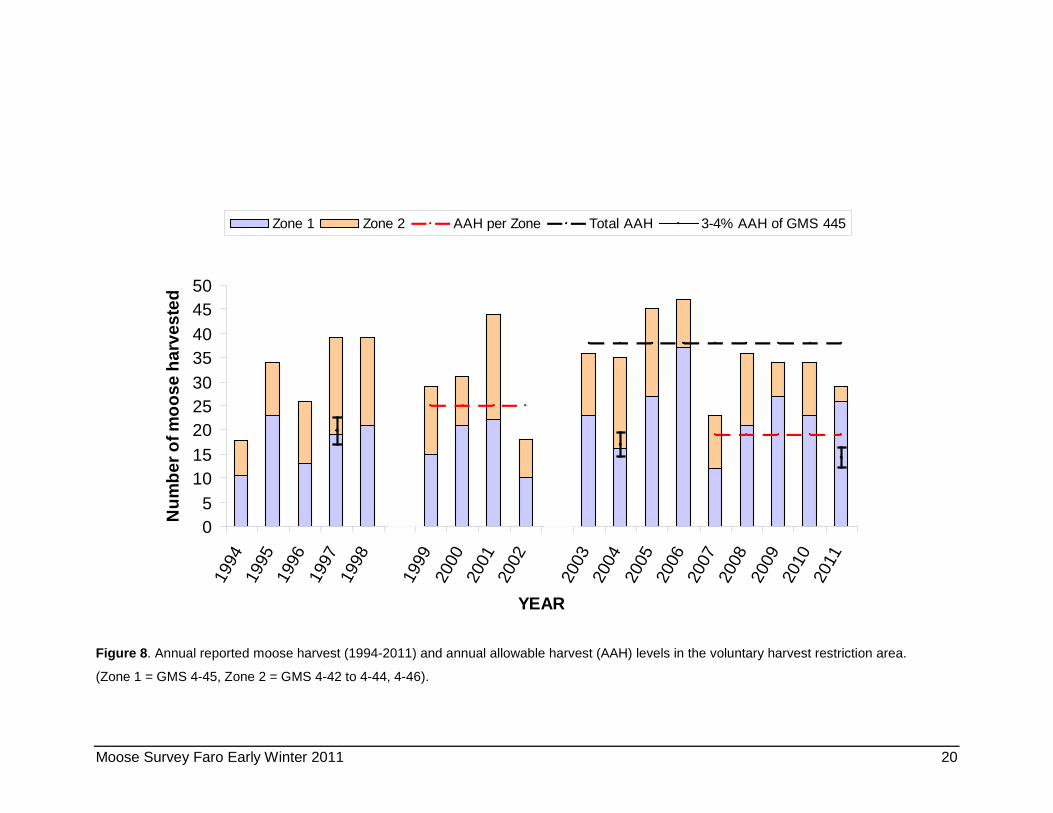
In 2006-2007, most moose harvested in the area were from GMS 4-45 (Figure 8). Therefore, for the 2007-2008 and later hunting seasons, the voluntary limit was divided into 2 zones: GMS 4-45 (zone 1) and surrounding subzones 4-42, 4-43, 4-44, and4-46 (zone 2).
Ideally, a maximum of 19 moose would be harvested from each zone, for a total annual allowable harvest of 38 moose. Each zone, however, has an annual allowable harvest of up to 23 moose, recognizing that moose move between the 2 zones. If 23 moose are harvested in one zone, it is closed to further harvest and the allowable harvest in the other zone is reduced to 15 moose (23 + 15 = 38).
This Voluntary Harvest Restriction Program was relatively successful in the early years. More recently, however, fewer hunters have been complying with this system. Similarly, the program has seen varying levels of success in limiting special guided hunts in this area (Figure 9). Most of the harvest in this area was by resident hunters, with some non-resident harvest via the local outfitter. No moose were harvested by non-residents in 2010 or 2011.
The reported annual harvest in the Voluntary Harvest Restriction area was about 31 moose per year averaged over 5 years (2007 to 2011), with most harvest occurring in zone 1 (Table 4). This figure represents a licensed harvest rate of 3.5% (which could be as high as 6.7% when First Nation harvest is estimated) of the 881 moose estimated in the 2 zones.

Moose Survey Faro Early Winter 2011 18
0
10
20
30
40
50
60
70
80
90
100
1979
1980
1981
1982
1983
1984
1985
1986
1987
1988
1989
1990
1991
1992
1993
1994
1995
1996
1997
1998
1999
2000
2001
2002
2003
2004
2005
2006
2007
2008
2009
2010
2011
YEAR
Num
ber o
f moo
se h
arve
sted
Special Guided HuntersNon-Resident HuntersResident Hunters3-4% AAH Range
Figure 7. Annual reported moose harvest (1979-2011) and 3% to 4% annual allowable harvest (AAH) range in the Faro survey area.
(Game Management Subzones: 4-38, 4-40, 4-42 to 4-48, and 4-51).
Moose Survey Faro Early Winter 2011 19
Game Management Subzone 4-45 Status and Trend: 1997 to 2011
We have intensively monitored and managed the moose harvest in GMS 4-45 since 1997. To look at moose numbers over time, we compare the estimated number of moose in this GMS in 1997, 2004, and 2011 (see Figure 2). Table 4 shows the results.
Moose Abundance and Trend
Overall, the current moose numbers, recruitment (the number of calves and yearlings added to the population), and harvest data show a trend of decreasing moose abundance.
We estimated 566±20% moose in the area in 1997, 485±30% in 2004, and 406±28% in 2011 (Table 5). This represents an annual decline of 2% or a decrease of 28% since 1997 (Z=1.702, 0.1>P>0.05)). This decrease in moose numbers is probably a result of the high harvest rates recorded, despite the voluntary harvest management program in place since 1999 (Environment Yukon 2004). This scale of decline represents a biologically significant reduction in moose numbers.
The average moose density for the subzone was 386 moose per 1,000 km2 of total area, or 412 moose per 1,000 km2 of suitable moose habitat. This figure was higher than the Yukon-wide average of 157 moose per 1,000 km2 of total area. It was also higher than the average density of 209 moose per 1,000 km2 of moose habitat from the most recent early-winter data for Yukon.
Composition and Sex Ratios
The ratio of adult bulls per 100 adult cows declined from 47 in 2004 to 32 in 2011 (Z=4.884, P<0.05). This figure was well below the Yukon average of about 64 adult bulls per 100 cows. In 1997 there were approximately 30 adult bulls per 100 adult cows, the minimum considered necessary to make sure that all cows are bred. While the adult bull: cow ratio was similar in 1997 and 2011, it was significantly higher in 2004.A low adult bull: cow ratio can be an indicator of excessive harvest and can lead to a decline in overall moose numbers. GMS 4-45 has the highest reported moose harvest averaged over 5 years, in any single GMS in Yukon, and one of the highest average harvest rates in the territory (see Table 3).
This change in sex-ratio was probably the result of a combined increase in the number of cows and a decrease in the number of bulls in the area. Specifically, we estimated 83 adult bulls in GMS 4-45 in 2011 compared to 115 in 2004 (Table 5, Z=0.927, P>0.1). In addition, we estimated 251 adult cows in this area in 2011 compared to 236 in 2004 (Z=0.244, P>0.1). Changes in adult moose numbers were not significant, however; given the wide confidence intervals of estimates (Table 5) a difference of over 100 cows and 50 bulls would be required between surveys to detect a change with 90% confidence.
Moose Survey Faro Early Winter 2011 20
05
101520253035404550
1994
1995
1996
1997
1998
1999
2000
2001
2002
2003
2004
2005
2006
2007
2008
2009
2010
2011
YEAR
Num
ber o
f moo
se h
arve
sted
Zone 1 Zone 2 AAH per Zone Total AAH 3-4% AAH of GMS 445
Figure 8. Annual reported moose harvest (1994-2011) and annual allowable harvest (AAH) levels in the voluntary harvest restriction area.
(Zone 1 = GMS 4-45, Zone 2 = GMS 4-42 to 4-44, 4-46).

Moose Survey Faro Early Winter 2011 21
05
101520253035404550
1994
1995
1996
1997
1998
1999
2000
2001
2002
2003
2004
2005
2006
2007
2008
2009
2010
2011
YEAR
Num
ber o
f moo
se h
arve
sted
Resident Hunters Non-Resident Hunters Special Guided Hunters
Figure 9. Annual reported moose harvest (1994-2011) by hunter type in the voluntary harvest restriction area (GMS 4-42 to 4-46).
Star
t of V
olun
tary
Har
vest
Res
tric
tion
Prog
ram
Expa
nded
to in
clud
e 4-
42 th
roug
h 4-
46
*Does not include unreported harvest from First Nation members.

Moose Survey Faro Early Winter 2011 22
Table 4. Average annual (2007-2011) reported moose harvest1 and allowable harvest summary for the Faro voluntary harvest restriction area.
(Game Management Subzone (GMS) 4-42 to 4-462)
GMS GMS Area (km2)
Estimated Density3 (moose/
1000 km2)
Total Estimated number
of Moose
Average Resident Harvest
Average Non-
Resident Harvest
Average (Special Guided) Harvest
Average Reported Harvest1
(2007-2011)
Current Harvest
Rate (% of total
population)
2% Allowable
Annual Harvest
3% Allowable
Annual Harvest
4% Allowable
Annual Harvest
4-42 830.5 220 182.7 1.4 0.8 0.0 2.2 1.2 3.7 5.5 7.3 4-43 170.4 85 14.5 1.6 0.0 0.0 1.6 11.0 0.3 0.4 0.6 4-44 148.3 330 48.9 0.8 0.0 0.0 0.8 1.6 1.0 1.5 2.0 4-45 1034.8 385 398.4 19.0 1.6 1.2 21.8 5.5 8.0 12.0 16.0 4-46 422.7 560 236.7 4.8 0.0 0.0 4.8 2.0 4.7 7.1 9.5
Total 2606.7 338.1 881.2 27.6 2.4 1.2 31.2 3.5 17.6 26.4 35.2
1 Does not include harvest by First Nations’ members. 2 The 2011 Faro survey area includes only the west half of GMS 4-40. However, GMS 4-40 data was included in the table due to the number of moose harvested in the vicinity of Connolly Lake, which was within the survey boundaries. Differences between Table 4 and Table 2 in the total estimated number of moose for the 2011 Faro survey area is due to the different area of GMS 4-40 used to calculate the estimate. 3 Based on 2011 Faro MoosePop SCF Not Pooled moose survey results.
Moose Survey Faro Early Winter 2011 23
Age Ratios and Recruitment
In 2011, calf survival to early winter in GMS 4-45 was poor (20 calves per 100 adult cows; see Table 4) and below the minimum 25 calves per 100 adult cows needed to maintain a stable moose population (Environment Yukon, in prep.). The number of yearlings added to the population was also very low in 2011 (6 yearlings per 100 adult moose; see Table 4). This figure was below the 8 to 15 yearlings per 100 adult moose normally found in areas with stable to increasing moose populations (Environment Yukon, in prep.).
The numbers of calves and yearlings recorded during the 1997 and 2004 surveys in GMS 4-45 were generally good to above average (35 to 45 calves per 100 adult cows and 9 to 18 yearlings per 100 adults, respectively; see Table 4). Three percent of cow-calf groups contained twins in 2011, which was lower than the number estimated during the 2004 (10%) and 1997 (7%) surveys.
Harvest
This subzone is reached through trails north of the Faro mine. In each of the previous 4 years (2008-2011), the harvest rate in GMS 4-45 was above the annual allowable maximum of 19 moose (Figure 8) and the average licensed 5-year harvest rate was 5.5% (which could be as high as 10.2% when First Nation harvest is estimated).
Recently (2008-2011), hunters have harvested moose in GMS 4-45 after the closure was announced and signs put up, and even after
they were specifically told about the voluntary limit (T.J. Grantham, Conservation Officer, pers. comm.).
Entire Faro Study Area, excluding GMS 4-45 We excluded GMS 4-45 for a separate analysis in the Faro study area to provide a clearer picture of the population trends in the surrounding GMSs (Appendix 1). Using data from 2004 and 2011, we compared the same population parameters as for the entire Faro study area (see Table 2) and for GMS 4-45 (see Table 5).
This separate analysis showed the same trends described for the entire Faro study area. Specifically, there was a decline from 2004 to 2011 in the ratio of adult bulls to adult cows (X2=7.207, 1 df, P<0.01), and in the ratio of calves to adult cows (X2=32.219, 1df, P<0.001). Low calf numbers may be the result of natural variation in calf survival. However, the decrease in the adult bull: cow ratio suggests a high harvest that was not limited to GMS 4-45. The remaining population data also showed similar patterns to results from the entire Faro study area.

Moose Survey Faro Early Winter 2011 24
Table 5. Results of the 1997, 2004 and 2011 early-winter moose population surveys of the Faro Game Management Subzone (GMS) 4-45 comparison area.
No sightability correction factor is included in results1.
Game Management Subzone 4-45 Comparison Area Survey Year 2011 2004 1997 Survey Method Geospatial2 Geospatial2 Stratified Random Block
Estimated Abundance1 (90% Confidence Range)3 Total Moose 406 ± 28% (293-519) 485 ± 30% (338-632) 566 ± 20% (452-681) Adult Bulls (> 30 months) 83 ± 36% (54-113) 115 ± 42% (66-164) 88 ± 31% (61-115)
Adult Cows (> 30 months) 251 ± 30% (177-325) 236 ± 31% (162-309) 291 ± 24% (220-361)
Yearlings (Approx. 18 months)4 23 ± 62% (9-37) 38 ± 86% (5-71) 84 ± 39% (51-117)
Calves (< 12 months) 50 ± 26% (37-63) 106 ± 40% (63-148) 101 ± 39% (62-141) Unknown age/sex - - 2 ± 162% (0-6)
Estimated Population Ratios1 (90% Confidence Range)3 % Adult Bulls 20 ± 20% (16-24%) 23 ± 31% (16-30%) 16 ± 23% (12-19%) % Adult Cows 63 ± 14% (54-72%) 48 ± 13% (42-55%) 51 ± 11% (46-57%) % Yearlings 5 ± 56% (2-8%) 8 ± 73% (2-14%) 15 ± 41% (9-21%) % Calves 12 ± 18% (10-14%) 22 ± 50% (11-33%) 18 ± 27% (13-23%) % Unknown Age/Sex - - <1 ± 167% (0-1%) Adult Bulls per 100 Adult Cows 32 ± 25% (24-40) 47 ± 40% (28-66) 30 ± 26% (22-38)
Yearlings per 100 Adult Cows 9 ± 61% (3-14) 16 ± 82% (3-30) 29 ± 51% (14-43)
Yearlings per 100 Adult Moose 6 ± 56% (3-10) 9 ± 93% (1-18) 18 ± 39% (11-25)
Calves per 100 Adult Cows 20 ± 21% (16-24) 45 ± 50% (22-68) 35 ± 28% (25-45)
% of Cow-Calf Groups with Twins5 3 ± 68% (1-4) 10 ± 103% (0-19) 7 ± 100% (0-13)
Density of Moose (per 1,000 km2)1 Total Area 386 461 548 Moose Habitat only6 412 492 586 Total Area (km2) 1053.0 1053.0 1033.5 Habitable Area (km2)6 986.5 986.5 966.7
1 To allow for comparison across years, no sightability correction factor is included in estimates provided. 2 For Geospatial data, the difference between total estimated numbers of moose and the sum of adults, yearling, calf and unknown numbers is because individual age/sex classes are unlikely to exhibit the same spatial correlation as that found in the sum of all observed moose in sampled units. The two sums may differ as a result. 3 This means that we are 90% sure that the true number of moose in the area lies within the range of moose numbers given in the brackets. 4 To account for yearling cows that cannot be identified from the air, the total number of yearlings is assumed to equal the estimated number of yearling bulls in the population x 2. 5 Twinning Rate = the number of cows with 2 calves divided by the total number of cows with calves. It represents what percentage of cows that had calves, had twins. 6 Suitable moose habitat is considered all areas at elevations lower than ~1676 m (5,500 ft.), excluding water bodies 0.5 km2 or greater in size.

Moose Survey Faro Early Winter 2011 25
Other Wildlife Sightings Besides the 866 moose we counted during the 2011 survey, we also saw 89 moose either outside the blocks that were surveyed or just outside the survey boundary. The total number we saw during the entire survey period was 955 moose.
We also saw 35 wolves in 4 possible packs. We saw one pack of 13 wolves on the north end of Jim Cooke Lake during the stratification survey. One week later we saw 12 wolves about 21 km northeast of Jim Cooke Lake during the census. We assumed that these were the same animals, especially since there was only one grey animal in each pack, with the rest black. We saw 3 other wolves on a moose kill about 11 km east of Jim Cooke Lake. We assumed that these animals were also part of this first pack because we saw them close together in time and location.
The second pack (9 wolves) was on the Tay River near Teddy Creek. One day later we saw 2 of these animals about 13 km south on the Tay River. We saw the third pack of 6 wolves on a moose kill on the south side of Mount Kulan, about 4 km north of Blind Creek. We saw the fourth pack of 3 wolves in GMS 4-45 on the large willow plateau north of Mount Mye, where much of the moose hunting pressure takes place.
We also saw 859 caribou from the Tay River Herd throughout the study area. We saw especially high numbers of caribou in the valleys surrounding Connolly Lake. We saw one grizzly bear in GMS 4-45 (north of Mt Mye), which emerged from its den as the helicopter passed over the area. We also saw 90 thinhorn sheep, one lynx, 2 red foxes, one snowshoe hare, 2 owls, and a raptor nest.

Moose Survey Faro Early Winter 2011 26
Conclusions and Recommendations • The Faro survey area contains high quality moose habitat resulting in
animal densities above Yukon-wide averages.
• We estimated that there were 2,352±23% moose in the entire Faro survey area in 2011, for an average density of about 364 moose per 1,000 km2 of total area.
• Several indicators suggest that that harvest in the entire Faro survey area is approaching and possibly exceeding the maximum recommended bull harvest rate of 4% (Yukon Renewable Resources 1996) as a result of high harvest pressure in several subzones.
• The 2007 to 2011 total estimated average annual harvest rate for bulls in the entire survey area was 3.4% (reported licensed and estimated First Nation harvest).
• Moose in GMS 4-45 declined by 28% since 1997.
• The ratio of adult bulls to adult cows in the entire survey area was significantly lower in 2011 than in 2004.
• The ratio of adult bulls to adult cows in GMS 4-45 was 32, near the minimum number of 30 considered sufficient to make sure that all adult cows are bred.
• The Voluntary Harvest Restriction Program was relatively successful in managing the moose harvest in the early years of the program. More recently, compliance with this system has declined and no longer is effective in altering hunter behaviour.
• We need complete harvest information (from both licensed and First Nation subsistence hunters) to more accurately estimate harvest and ensure that total harvest stays within allowable limits.
• Given the indicators and known harvest, restrictive measures are likely required to address harvest concerns and sustainably manage this high-density moose population.
Moose Survey Faro Early Winter 2011 27
Literature Cited BECKER, E. F., AND D. J. REED. 1990.
A modification of a moose population estimator. Alces 26:73-79.
ENVIRONMENT YUKON. 2004. 2004 Faro area moose survey results, population status, and harvest. Unpublished file report. Whitehorse, Yukon, Canada.
ENVIRONMENT YUKON. 2007. Faro moose telemetry study final report, draft. Whitehorse, Yukon, Canada.
ENVIRONMENT YUKON. In prep. Moose management guidelines for Yukon. Whitehorse, Yukon, Canada.
Fryxell, J. M., C. Packer, K. McCann, E. J. Solberg, and B.-E. Saether. 2010. Resource management cycles and the sustainability of harvested wildlife populations. Science 328:903–906.
GASAWAY, W. C., S. D. DUBOIS, D. J. REED, AND S. J. HARBO. 1986. Estimating moose population parameters from aerial surveys. University of Alaska, Institute of Arctic Biology, Biological Paper No. 22.
GASAWAY, W. C., R. D. BOERTJE, D. V. GRANGAARD, D. G. KELLYHOUSE, R. O. STEPHENSON, AND D. G. LARSEN. 1992. The role of predation in limiting moose at low densities in Alaska and Yukon and implications for conservation. Wildlife Society Monograph 120.
KELLIE, K. A., AND R. A. DELONG.
2006. Geospatial survey operations manual. Division of Wildlife Conservation, Alaska Department of Fish and Game, Fairbanks, Alaska, USA.
NATIONAL CLIMATE DATA AND INFORMATION ARCHIVE. 2012. http://www.climate.weatheroffice.gc.ca/climateData/hourlydata_e.html?Prov=YT&StationID=1548&Year=2011&Month=11&Day=3&timeframe=1
VAN BALLENBERGHE, V., AND W. B. BALLARD. 1994. Limitation and regulation of moose populations: The role of predation. Canadian Journal of Zoology 72:2071-2077.
YUKON DEPARTMENT OF ENVIRONMENT. 2012. Yukon snow survey bulletin and water supply forecast March 1, 2012. Yukon Water Resources Branch, Department of Environment, Whitehorse, Yukon, Canada
YUKON ECOREGIONS WORKING GROUP. 2004. Yukon Southern Lakes and Pelly Mountains ecoregions. Pages 207–226 in C. A. S. Smith, J. C. Meikle, and C. F. Roots, editors. Ecoregions of the Yukon Territory: Biophysical Properties of Yukon Landscapes. Agriculture and Agri-Food Canada, PARC Technical Bulletin No. 04-01, Summerland, British Columbia, Canada.

Moose Survey Faro Early Winter 2011 28
YUKON RENEWABLE RESOURCES. 1997. Summary of 1997 Faro moose survey results. Yukon Fish and Wildlife Branch, Yukon Renewable Resources, Whitehorse, Yukon, Canada.
YUKON RENEWABLE RESOURCES. 1998. Summary of 1998 Faro moose composition survey results. Yukon Fish and Wildlife Branch, Yukon Renewable Resources, Whitehorse, Yukon, Canada.
YUKON RENEWABLE RESOURCES. 1999. Summary of 1999 Faro moose trend and composition survey results. Yukon Fish and Wildlife Branch, Yukon Renewable Resources, Whitehorse, Yukon, Canada.

Moose Survey Faro Early Winter 2011 29
APPENDIX 1 – Results of the 2011 and 2004 early-winter moose population surveys of the entire Faro study area excluding GMS 4-45.
Survey Year 2011 2004 Estimated Abundance1 (90% Confidence Range)2 Total Moose 1912 ± 25% (1435-2389) 1842 ± 28% (1323-2361) Adult Bulls (> 30 months) 467 ± 26% (345-590) 486 ± 32% (329-643) Adult Cows (> 30 months) 1062 ± 28% (761-1362) 891 ± 29% (631-1151) Yearlings (Approx. 18 months)3 181 ± 31% (124-238) 152 ± 71% (44-261) Calves (> 12 months) 202 ± 27% (148-256) 302 ± 36% (194-410) Unknown age/sex - - Estimated Population Ratios4 (90% Confidence Range)2 % Adult Bulls 25% ± 14% (22-29%) 28% ± 23% (22-34%) % Adult Cows 54% ± 7% (51-58%) 47% ± 13% (41-53%) % Yearlings 10% ± 25% (7-12%) 9% ± 62% (3-15%) % Calves 10% ± 17% (9-12%) 16% ± 21% (13-19%) % Unknown Age/Sex - - Adult Bulls per 100 Adult Cows 47 ± 20% (38-56) 60 ± 32% (40-79) Yearlings per 100 Adult Cows 18 ± 29% (13-23) 19 ± 72% (5-33) Yearlings per 100 Adults 11 ± 25% (8-14) 11 ± 61% (4-18) Calves per 100 Adult Cows 19 ± 20% (15-23) 34 ± 22% (27-41) % of Cow-Calf Groups with Twins5 0% 4% ± 107% (0-9%) Density of Moose (per 1,000 km2)1 Total Area (5416.7 km2) 353 340 Moose Habitat Only6 (5097.8 km2) 375 361
1 Estimated number provided is based on a Not Pooled “sightability correction factor” or SCF applied to data analyzed using Geospatial analysis. In 2011, a SCF of 1.132 was applied to the High stratum and an SCF of 1.048 was applied to the Low stratum. In 2004 a SCF of 1.071 was applied to the High stratum and an SCF of 1.00 was applied to the Low stratum. The SCF is used to correct the estimate of moose abundance for animals that were missed by the survey crews (see step 5 of methods section for a description of how the SCF is calculated). 2 This means that we are 90% sure that the true number of moose in the area lies within the range of moose numbers given in the brackets. 3 To account for yearling cows that cannot be identified from the air, the total number of yearlings is assumed to equal the estimated number of yearling bulls in the population x 2. 4 Estimated Population Ratios provided are based on the same Not Pooled “sightability correction factor” or SCF for 2011 and 2004 given above, but applied to data analyzed using the Stratified Random Block MoosePop software. 5 Twinning Rate = the number of cows with 2 calves divided by the total number of cows with calves. It represents what percentage of cows that had calves, had twins. 6 Suitable moose habitat is considered all areas at elevations lower than ~1676 m (5.500 ft.), excluding water bodies 0.5 km2 or greater in size