summary bangladesh national health accounts 1997-2012
TRANSCRIPT
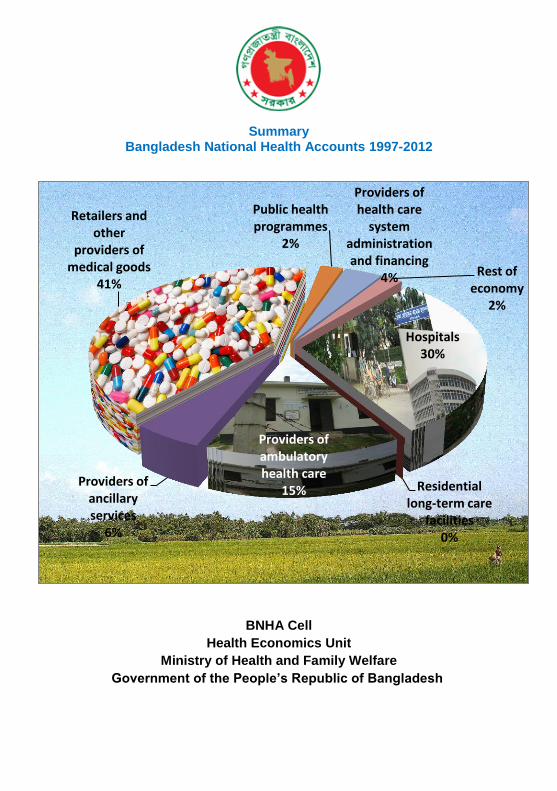
Summary Bangladesh National Health Accounts 1997-2012
BNHA Cell
Health Economics Unit
Ministry of Health and Family Welfare
Government of the People’s Republic of Bangladesh
Hospitals 30%
Residential long-term care
facilities 0%
Providers of ambulatory health care
15% Providers of
ancillary services
6%
Retailers and other
providers of medical goods
41%
Public health programmes
2%
Providers of health care
system administration and financing
4% Rest of economy
2%

2
Bangladesh National Health Accounts 1997 - 2012
Summary
This report presents the results of the Bangladesh National Health Accounts
(BNHA) 1997-2012. This round of BNHA has been developed and updated
based on the System of Health Accounts (SHA) 2011 guidelines but also
preserved the option of producing tables compatible to SHA 2001 manual for
National Health Accounts. The BNHA framework used in the earlier rounds of
NHA has been revised in this round (NHA-IV) through extensive consultations
within BNHA cell, and the guidance of an international NHA expert. New
estimation methods and data sources have been used to improve private
expenditure estimates. Revisions to the framework and classifications of
health accounts have also been made.
NHA-IV tracks the total health expenditure in Bangladesh between the fiscal
years 1997 to 2012, cross-stratified and categorized by financing
classifications, provider and function on annual basis. Its main goal is to inform
national policymakers and other stakeholders of the magnitude and profile of
health spending. It also serves in institutionalizing the monitoring of health
outlays.
Adoption of SHA2011 provides two new financing classifications that provide
more specific answers to the questions: “where does the money come from?”
and “what instruments are used for fund raising?” This new classification
provides better interpretation of public and private funding in the health care
sector.

3
Total Health Expenditure (THE)
Total health expenditure (THE) in Bangladesh is estimated at Taka 325.1
billion ($4.1 billion) in 2012, Taka 153.9 billion ($2.2 billion) in 2007, Taka 81.5
billion ($1.4 billion) in 2002 and Taka 46.4 billion ($1.1 billion) in 1997. In
recent years THE grew at an annual average of around 14% in nominal terms.
In real terms, the growth level has been approximately 8% annually.
Table 1 Table: THE, GDP and Annual Growth Rates 1997 - 2012
Year
Total health expenditure GDP Per capita
Ratio of THE to GDP Amount
(Taka Million) Nominal
Growth rate Amount
(Taka Million) Nominal
Growth rate
GDP THE
Taka US $
PPP $
1997 46,356
1,807,013
14,767 379 $9 $19 2.6%
1998 51,101 10.2% 2,001,766 10.8% 16,039 409 $9 $20 2.6%
1999 56,529 10.6% 2,196,972 9.8% 17,270 444 $9 $21 2.6%
2000 62,474 10.5% 2,370,856 7.9% 18,519 488 $10 $23 2.6%
2001 71,959 15.2% 2,535,464 6.9% 19,452 552 $10 $26 2.8%
2002 81,488 13.2% 2,732,010 7.8% 20,760 619 $11 $29 3.0%
2003 87,429 7.3% 3,005,801 10.0% 22,532 655 $11 $30 2.9%
2004 100,251 14.7% 3,329,731 10.8% 24,628 741 $13 $33 3.0%
2005 114,338 14.1% 3,707,070 11.3% 27,059 835 $14 $36 3.1%
2006 134,873 18.0% 4,157,279 12.1% 29,952 972 $14 $41 3.2%
2007 153,887 14.1% 4,724,769 13.7% 33,604 1,095 $16 $44 3.3%
2008 178,943 16.3% 5,458,224 15.5% 38,330 1,257 $18 $49 3.3%
2009 205,120 14.6% 6,147,952 12.6% 42,635 1,422 $21 $52 3.3%
2010 244,331 19.1% 6,943,243 12.9% 47,524 1,672 $24 $58 3.5%
2011 289,017 18.3% 7,967,040 14.7% 53,220 1,931 $25 $64 3.6%
2012 325,094 12.5% 9,181,414 15.2% 60,563 2,144 $27 $68 3.5%

4
THE as a percent share of Gross Domestic Product (GDP) has remained
stable in recent years at around 3% In 2012, per capita spending on health
was Taka 2,167 ($27) compared to Taka 1,558 ($16) in 2007 and Taka 826
($9) in 1997. The Purchasing Power Parity (PPP) adjusted per capita
expenditure on health in nominal terms was Taka 5,440 ($68) in 2012; in real
terms it was Taka 2,167 ($27) for that year.

5
Total Health Expenditure by Financing Classifications
A significant introduction under NHA-IV is the disaggregation of all health
spending according to:
(i) Financing Schemes; and
(ii) Revenue of Financing Schemes.
Health care financing schemes encompass major types of financing
arrangements through which health services are paid for and obtained by
households. These include direct payments by households as well as third-
party financing arrangements, such as social health insurance, voluntary
insurance.
Revenues of Financing Schemes imply measurement of revenue sources of
individual financing scheme. Such information can be of critical importance to
policy makers, especially in assessing the mix of public and private
expenditures.
Figure: THE by Financing Schemes 2012
6
1
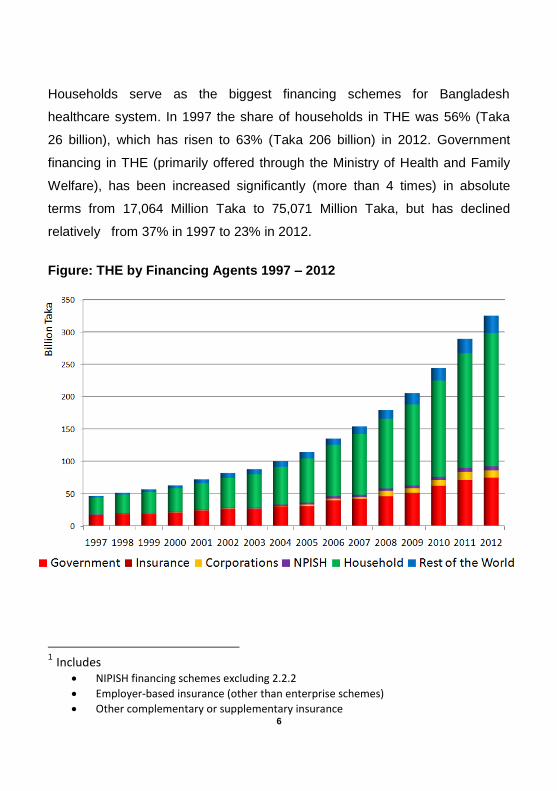
Households serve as the biggest financing schemes for Bangladesh
healthcare system. In 1997 the share of households in THE was 56% (Taka
26 billion), which has risen to 63% (Taka 206 billion) in 2012. Government
financing in THE (primarily offered through the Ministry of Health and Family
Welfare), has been increased significantly (more than 4 times) in absolute
terms from 17,064 Million Taka to 75,071 Million Taka, but has declined
relatively from 37% in 1997 to 23% in 2012.
Figure: THE by Financing Agents 1997 – 2012
1 Includes
NIPISH financing schemes excluding 2.2.2
Employer-based insurance (other than enterprise schemes)
Other complementary or supplementary insurance
7
Voluntary Health Insurance schemes are primarily in the form of spending to
provide or reimburse medical care for employees of business entities. As a
financing scheme, Voluntary Health Insurance Payment (NIPSH, Employers
and Others) was 5.25% of THE.
A cross classification of BNHA estimates between Financing Schemes and
Revenue of the Schemes for 2012 shows that NGOs own contribution (Non-
profit Institutions Serving Households (NPISH) in health care services for 2012
accounts for Taka 6 billion (approximately 2% of THE), while Taka 27 billion
direct assistance given to NGOs by the development partners is reflected in
the Rest of World Financing Schemes (8.35% of THE).

8
Total Health Expenditure by Functional Classifications
According to the System of Health Accounts 2011 (SHA 2011) guideline,
health care functions imply the types of goods and services provided and
activities performed within the health accounts boundary. Functional outlay
refers to current spending on health care and, relates to health care
consumption and it excludes investment outlays. Bangladesh national Health
Accounts (BNHA) boundary of functions is slightly different from the SHA 2011
and it includes expenditure on medical research, education and training.
Apart from the inclusion of medical research, education and training, BNHA
classification of functions remain consistent with SHA 2011 approach. All
health expenditures are categorized by core health care functions and include
such activities as: curative care, rehabilitative and long-term care, medical
goods, preventive care and health system and financing administration.
Disaggregation of expenditures by functional category shows that retail drugs
and medical goods and services of curative care account for major share of
THE. The share of retail drugs and medical goods and services has varied
amongst 38% to 43% during 1998 and 2012 period. Curative care services
share of THE was 22% in 1997 and 26% in 2012. In 2012, Taka 134 billion
($1.68 billion) was spent on retail drugs and medical goods and services; it
was Taka 62 billion ($0.9 billion) in 2007 and Taka 20 billion ($0.5billion) in
1997.
9
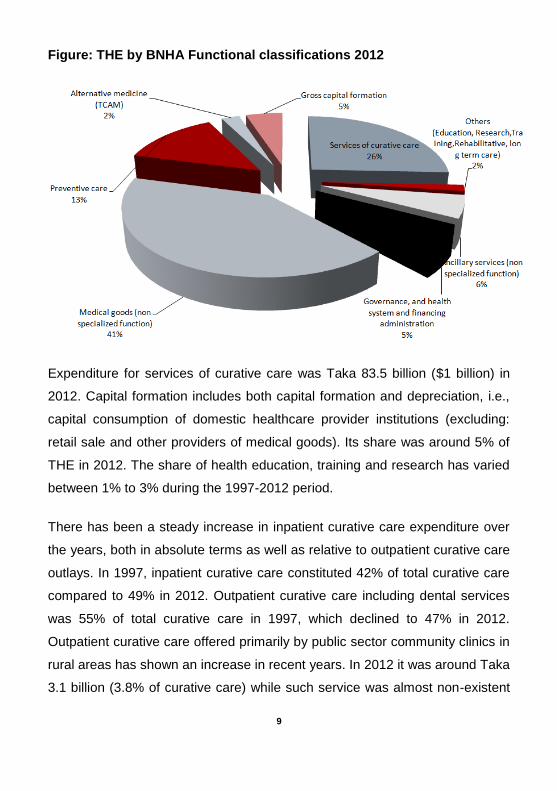
Figure: THE by BNHA Functional classifications 2012
Expenditure for services of curative care was Taka 83.5 billion ($1 billion) in
2012. Capital formation includes both capital formation and depreciation, i.e.,
capital consumption of domestic healthcare provider institutions (excluding:
retail sale and other providers of medical goods). Its share was around 5% of
THE in 2012. The share of health education, training and research has varied
between 1% to 3% during the 1997-2012 period.
There has been a steady increase in inpatient curative care expenditure over
the years, both in absolute terms as well as relative to outpatient curative care
outlays. In 1997, inpatient curative care constituted 42% of total curative care
compared to 49% in 2012. Outpatient curative care including dental services
was 55% of total curative care in 1997, which declined to 47% in 2012.
Outpatient curative care offered primarily by public sector community clinics in
rural areas has shown an increase in recent years. In 2012 it was around Taka
3.1 billion (3.8% of curative care) while such service was almost non-existent
10
through 2009.
Regular ancillary services encompass such activities as laboratory and
imaging. A total of Taka 17.8 billion was spent on ancillary services in 2012
compared to Taka 8 billion in 2007 and Taka 1.2 billion in 1997. The relative
share of laboratory services has been declined from 60.1% in 1997 to 57.1%
in 2012.
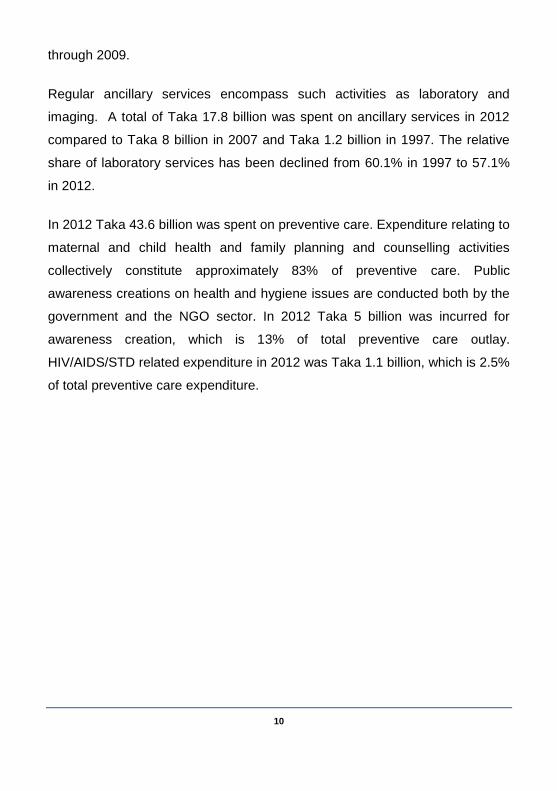
In 2012 Taka 43.6 billion was spent on preventive care. Expenditure relating to
maternal and child health and family planning and counselling activities
collectively constitute approximately 83% of preventive care. Public
awareness creations on health and hygiene issues are conducted both by the
government and the NGO sector. In 2012 Taka 5 billion was incurred for
awareness creation, which is 13% of total preventive care outlay.
HIV/AIDS/STD related expenditure in 2012 was Taka 1.1 billion, which is 2.5%
of total preventive care expenditure.

11
Total Health Expenditure by Provider Classifications
There are a wide range and types of healthcare providers in Bangladesh
ranging from modern specialized tertiary level hospitals to unqualified
practitioners. In this round of Bangladesh National Health Accounts (BNHA),
classifications of Healthcare Providers (HP) have been reclassified using
System of Health Accounts 2011 (SHA 2011) guideline. BNHA classifications
of HP are now compatible to the SHA 2011 classifications of providers, and
also capable of generating estimates by various categories of hospitals which
are normally reported as general hospitals expenditure under SHA 2011.
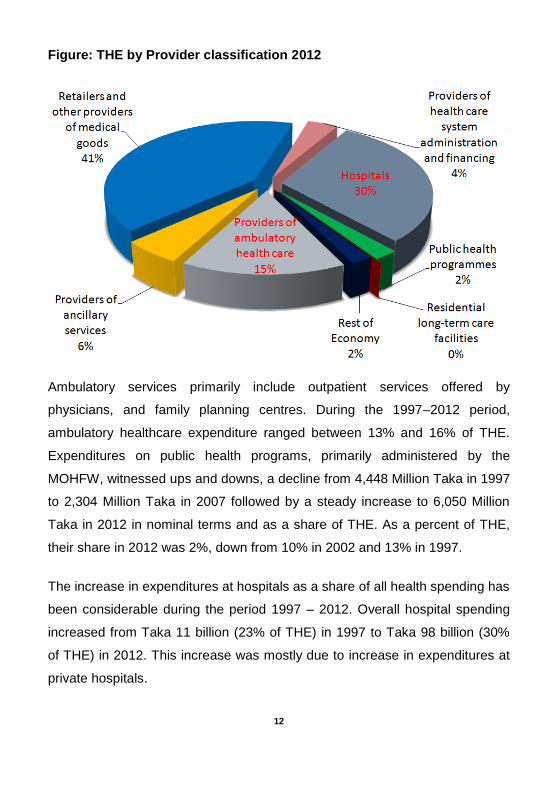
Three types of provider account for most health expenditures:
(i) Drug outlets and medical goods retailers Taka 134 billion (41%);
(ii) hospitals Taka 98 billion (30%) and
(iii) Ambulatory health services Taka 49 billion (15%) of THE in 2012.
The share of expenditures accounted for drugs and medical goods retailers
remained steady between 38% and 42% during the period 1997-2012.
Hospitals’ share of expenditures has also remained steady at around 30% of
THE over the past ten years.
12
Figure: THE by Provider classification 2012
Ambulatory services primarily include outpatient services offered by
physicians, and family planning centres. During the 1997–2012 period,
ambulatory healthcare expenditure ranged between 13% and 16% of THE.
Expenditures on public health programs, primarily administered by the
MOHFW, witnessed ups and downs, a decline from 4,448 Million Taka in 1997
to 2,304 Million Taka in 2007 followed by a steady increase to 6,050 Million
Taka in 2012 in nominal terms and as a share of THE. As a percent of THE,
their share in 2012 was 2%, down from 10% in 2002 and 13% in 1997.
The increase in expenditures at hospitals as a share of all health spending has
been considerable during the period 1997 – 2012. Overall hospital spending
increased from Taka 11 billion (23% of THE) in 1997 to Taka 98 billion (30%
of THE) in 2012. This increase was mostly due to increase in expenditures at
private hospitals.

13
Hospital expenditures covering general as well as teaching hospitals, mental
health substance abuse institutions, and specialized hospitals amounted to
Taka 98 billion ($1.1 billion) in 2012. Although upazila and public hospitals
below upazila-level continue to be major providers of health services in terms
of outlays made at these entities, their relative share of overall hospital
expenditures has declined from34.1% (Taka 2.9 billion) in 1997 to 27.4%
(Taka 4 billion) in 2001 and 24.1% (Taka 10,377 million) in 2012.
Figure: THE by Provider classification 1997 – 2012
Total expenditures at medical college hospitals were Taka 907 million in 1997
and Taka 2,237 million in 2012. As a percent of total expenditure in hospitals,
the share of medical 2college hospitals was 5.2% in 2012. The share of total
2 Illustrative examples
Taxis that provide patient transport under the supervision of health personnel
Schools with employed health professionals for e.g. treatment of ill children or providing health education
Prison health care services not provided in independent/separate health care

14
hospital expenditure at specialized hospitals was 3.4% and that of medical
university and postgraduate institutes was 0.8% in 2012.
Private hospitals in particular have grown in number over the past decade,
coupled with the entry of a handful of large-scale, tertiary level private
healthcare facilities (e.g. Apollo, United, Square) in Dhaka city. Expenditure at
private hospitals in 2012 was Taka 23.4 billion, which constitutes 54.5% of
total outlays on hospital services. In 1997, total expenditure at private
hospitals was Taka 2.2 billion.
Ambulatory healthcare providers are primarily involved in providing services
directly to outpatients who do not require inpatient care. These services are
provided by both the medical health services and public health services. The
major providers in this group are general physicians and ambulatory health
care centres. A total of Taka 49 billion was spent on such services in 2012.
The relative share of general physicians have declined from 49% in 1997 to
37% in 2012 while that of ambulatory health care centres have increased from
36% in 1997 to 46% in 2012. There has been a structural shift in major
metropolitan cities whereby more qualified and specialized physicians offer
their services from outpatient health care centres than from retail drug outlets
or their residence.
The Ministry of Health and Family Welfare (MOHFW) is the lead institution in
conducting public health programs in Bangladesh. In 2012 Taka 6 billion was
spent by the ministry under this activity, which constituted 82% of total public
health program outlay. The role of NGOs too is significant, and their share was
17% (Taka 1.3 billion) in 2012. The involvement of government entities outside
MOHFW is relatively nominal, incurring around Taka 61 million in 2012 for
promotion of public health activities.
establishments

15
Out-of-pocket Expenditure by Households
Out of pocket health expenditure by households (OOP) constitutes the major
component of total health spending in Bangladesh. Households spend over
Taka 205 million annually on health related goods and services. OOP share in
THE has increased from 55.9% in 1997 to 59.9% in 2005 to 63.3% in 2012. A
functional breakdown of services suggests that outlay on medical goods
comprises the biggest share of OOP. In 2012, households spent Taka 134
million on pharmaceutical drugs. Expenditure on drugs as a percentage of
OOP however has declined over time. In 1997, drug outlay was 75.3% of
OOP, 70.5% in 2001 and 65% in 2012. In 2012, Taka 44.8 million was spent
on curative care, and Taka 17.8 million on ancillary services. Ancillary services
are classified into such groups as laboratory services, imaging and so forth.
Figure: Share of OOP by Services 2012

16
The relative share of inpatient curative care expenditure steadily increased
during 1997 to 2004 period, and stabilized at around 11% subsequently; in
2012 it is 14%. The increase in inpatient curative care spending is justified due
to a combination of higher OOP in private hospitals and greater propensity to
use private sector facilities.

17
Total Health Expenditure by Geographical Classifications
The percentage distribution of healthcare spending by geographical region
has not changed much between 1997 and 2012, except for Dhaka and
Chittagong divisions.
Figure: Share of THE by Divisions 2012
In 2012, health expenditure in Dhaka division was Taka 133 billion translating
to 41% of total spending. In 1997, it was 28% of THE. In 1997, health
expenditure in Chittagong division accounted for 27%, a share that has
decreased to 18% in 2012. The main reason for this shift is due to faster
increase in private sector health spending as well as investment in Dhaka
division. The relative shares are much lower in Sylhet and Barisal, and have
changed little.
In 2012, Dhaka division had the highest per capita spending of Taka 2,722
followed by Khulna (Taka 2,371) and Chittagong (Taka 1,930). The lowest per

18
capita spending was in Sylhet division (Taka 1,379). During the period 1997 –
2006 Chittagong division had the highest per capita spending. Barisal,
Rangpur and Sylhet had relatively lower per capita expenditure than the other
four divisions.
Figure: Per capita THE by Divisions 2012
As a percentage share of total government spending on health, in 2012,
Dhaka (26%) and Chittagong (18%) are higher and lower in Barisal (8%) and
Sylhet (7%). Per capita government outlay however is lowest in Dhaka division
– Taka 396 while Chittagong division is the next lowest (Taka 464). Barisal
division has the highest per capita public spending (Taka 668) followed by
Khulna (Taka 631).
19
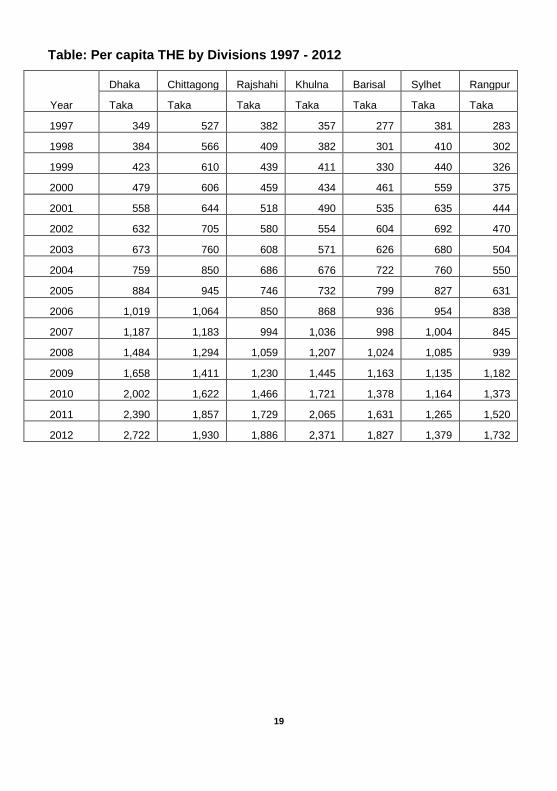
Table: Per capita THE by Divisions 1997 - 2012
Year
Dhaka Chittagong Rajshahi Khulna Barisal Sylhet Rangpur
Taka Taka Taka Taka Taka Taka Taka
1997 349 527 382 357 277 381 283
1998 384 566 409 382 301 410 302
1999 423 610 439 411 330 440 326
2000 479 606 459 434 461 559 375
2001 558 644 518 490 535 635 444
2002 632 705 580 554 604 692 470
2003 673 760 608 571 626 680 504
2004 759 850 686 676 722 760 550
2005 884 945 746 732 799 827 631
2006 1,019 1,064 850 868 936 954 838
2007 1,187 1,183 994 1,036 998 1,004 845
2008 1,484 1,294 1,059 1,207 1,024 1,085 939
2009 1,658 1,411 1,230 1,445 1,163 1,135 1,182
2010 2,002 1,622 1,466 1,721 1,378 1,164 1,373
2011 2,390 1,857 1,729 2,065 1,631 1,265 1,520
2012 2,722 1,930 1,886 2,371 1,827 1,379 1,732

20
Produced with financial and technical assistance from:
Rockefeller Foundation
World Bank
World Health Organization
Deutsche Gesellschaft für Internationale Zusammenarbeit (GIZ)