suicide of farmers in maharashtra background papers of farmers in maharashtra: background paper...
TRANSCRIPT

Suicide of Farmers in Maharashtra Background Papers
(Submitted to the Government of Maharashtra)
Srijit Mishra Sangeeta Shroff
Deepak Shah Vivek Deshpande
Anjali P. Kulkarni, Vinayak S. Deshpande P. R. Bhatkule
Indira Gandhi Institute of Development Research, Mumbai 26 January 2006


Contents
1 Farmers’ Suicides in Maharashtra: Content Analysis of Media Reports by
Srijit Mishra 5
2 Cotton Sector in Maharashtra by Sangeeta Shroff 253 Resurrection of Rural Credit Delivery System in Maharashtra by Deepak
Shah 45
4 Farmers’ Suicides: A Media Perspective by Vivek Deshpande 855 Agrarian Scenario in Yavatmal, Washim and Wardha Districts by Anjali P.
Kulkarni and Vinayak S. Deshpande 99
6 Poisoning Cases In Yavatmal Medical College, July 2004-June 05 by P. R. Bhatkule
125
The background papers given here is as sent by the authors. To ascertain similarity in presentation, the abstracts and the style formatting were done at IGIDR. Mr Srinivas Sajja provided valuable research assistance. Queries regarding background papers may be sent to the respective authors.
3

Suicide of Farmers in Maharashtra: Background Paper
Farmers’ Suicides in Maharashtra: Content Analysis of Media Reports1
Srijit Mishra2
(with assistance from Vibha Iyer and Mitali Kamkhalia)
This Version: 20 December 2005
Abstract
This paper has three parts. The first, an analysis of 192 news reports in a Marathi daily,
Deshonnati, cites 320 cases of farmers’ suicides in Maharashtra reported during 2004. A
study of circumstances reveals multiple risk factors – economic downfall, agrarian crisis, and
social disgrace among others. Indebtedness, a manifestation of economic downfall, becomes
acute with reliance on moneylenders. A comparison of news reports with government
investigation indicates scope for subjective interpretation in the latter. The second part, on
issues highlighted by the media in general, identifies several problems: adverse developments
affecting the Monopoly Cotton Procurement Scheme (MCPS) since the mid-1990s, increasing
price (and also yield) risk and reducing profitability in Cotton cultivation, withdrawal of the
state from the rural agrarian scenario and the questions of market-driven Bt (Bacillus
thuringiensis) versus cost-saving organic cotton. The third part is on suicide reportage,
suggesting that media follow the World Health Organization (WHO) guidelines of DOs and
DONTs.
Key words: Compensation Criteria, Content Analysis, Cotton, Deshonnati, Farmers’ Suicide,
Multiple Risk factors, Pesticide, Reporting Guidelines.
1 This has been prepared as a background paper for the study on ‘Suicide of Farmers in Maharashtra’ being conducted by the Indira Gandhi Institute of Development Research (IGIDR), Mumbai for the Government of Maharashtra. Comments from participants at the interim workshop on 18th August 2005 were helpful. The spontaneity with which Prakash Pohare, Editor, Deshonnati, responded to a request for material is commendable. Material given by Mahesh Mahatre, formerly with Sakal, Nagpur, was also helpful. 2 The author researches and teaches at the Indira Gandhi Institute of Development Research, Mumbai 400 065. He can be reached at [email protected].
5

Mishra, Farmers’ Suicides in Media
1. Introduction
Reportage on suicides can have both negative and positive impact on suicide contemplators.
Sensational reporting with detailed information on the mode of suicide, graphic illustrations
of the suicide, repetitive reporting with constant flashing of images related to the suicide, in
both print and electronic media have been found to lead to an increase in suicides due to the
imitation effect or the ‘Werther Effect’ (World Health Organisation, WHO, 2000).3 Imitation
can take the form of contagion, “a process by which exposure to the suicide or suicidal
behavior of one or more persons influences others to commit or attempt suicide” (Centers for
Disease Control and Prevention, CDC, 1994). A case in point would be suicide by charcoal
burning that first occurred in November 1998 in Hong Kong (Lee et al, 2002). This new
method was reported in detail in the media and soon became common knowledge. In 2002 it
happened to be the second most important method of committing suicide (Au et al, 2004). It
is not the information on suicide per se but the manner in which the information has been
presented that poses a risk to the vulnerable sections of society (WHO, 2000). Responsible,
accurate and appropriate reporting can help deter several potential suicide victims from
taking the step. Guidelines for reportage on suicides in media have been prepared by CDC
(1994), WHO (2002) and other organizations.
Positive and negative effects notwithstanding, media can be an important source of
information on suicides. In a recent study on farmers’ suicides in Maharashtra, the
researchers relied on a list provided by a Marathi daily, Deshonnati (Dandekar et al, 2005).
The current exercise is a content analysis of media reports on farmers’ suicides in
Maharashtra. It has three parts.
In the first part, we undertake an analysis of suicide cases in Maharashtra reported from
January 1, 2004 to December 31, 2004 in the Marathi daily Deshonnati (2004a).4 We
analyze the available information on division/district wise distribution of suicide deaths,
3 The term “Werther effect” is used to designate imitation or copycat suicides following Goethe’s novel Die Leiden des jungen Werther (The Sorrows of Young Werther) where the hero shoots himself after an ill-fated love, and shortly after its publication in 1774, there were many reports of young men using the same method to commit suicide. 4 An independent list provided by Deshonnati suggests that there were 394 farmers’ suicide deaths during 2004 in Maharashtra. In the current analysis, however, we will restrict ourselves to the 320 suicide deaths, including one case of December 29, 2003, that we culled out from 192 news reports of 2004 (Deshonnati, 2004a). From these 320 cases, there are three instances of two suicide deaths in the same household. There were four women from among whom two committed suicide with their husbands; another was a widow and yet another married (case 1 in Table 7). There was also an instance of a shocked son taking his life a day after his father’s suicide.
6

Suicide of Farmers in Maharashtra: Background Paper
monthly pattern of suicide deaths, age of person committing suicide, method of committing
suicide, possible causes or risk factors and some details on sources of loans, as indebtedness
is one of the major risk factors. While our primary source of information in terms of data
about the suicide victims has been obtained from reports in Deshonnati (sections 2-7), we
have compared a few news reports with Government investigation (section 8).
Next, we refer to editorials and write-ups from the Marathi dailies Deshonnati and Sakal,
English language daily newspapers, The Hindu, The Hindu Business Line, Hindustan Times
and the English fortnightly, Frontline to discuss some of the larger issues put forward by the
media in the context of farmers’ suicides in Maharashtra (section 9).
Finally, we suggest some guidelines for suicide reportage (section 10). Concluding remarks
are in section 11.
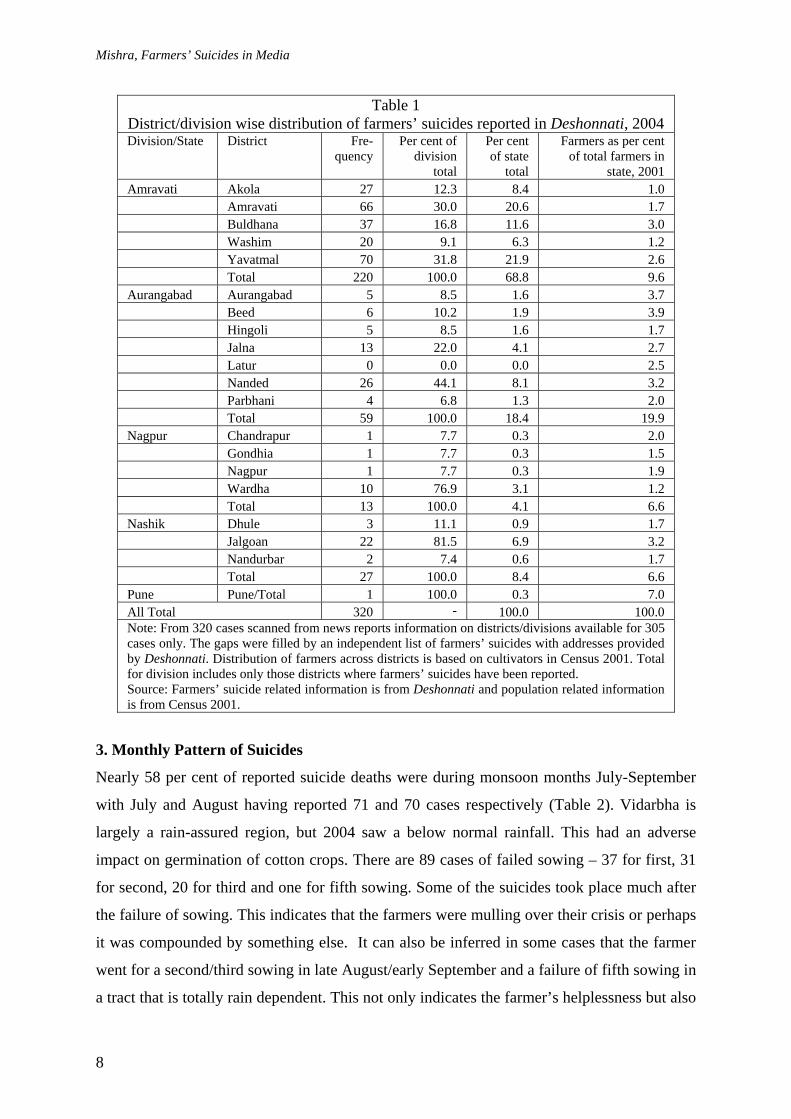
2. Distribution of Suicides by Districts/Divisions
The highest number of cases, 220, were seen in Amravati division (Western Vidarbha),
accounting for 69 per cent of the cases. Yavatmal district with 70 suicides accounts for 32 per
cent of the suicides in this division. Outside Amravati division, the high incidence districts
are Wardha in Nagpur division (Eastern Vidarbha), Nanded and Jalna in Aurangabad division
(Marathwada) and Jalgaon in Nashik division (Khandesh). Excluding Jalgaon, all the other
districts are around Yavatmal, suggesting that Yavatmal seems to be the epicenter of the
recent spate of farmers’ suicides. These districts also happen to be among the cotton growing
districts of Maharashtra.
7
Mishra, Farmers’ Suicides in Media
Table 1 District/division wise distribution of farmers’ suicides reported in Deshonnati, 2004 Division/State District Fre-
quency Per cent of
division total
Per cent of state
total
Farmers as per cent of total farmers in
state, 2001 Amravati Akola 27 12.3 8.4 1.0 Amravati 66 30.0 20.6 1.7 Buldhana 37 16.8 11.6 3.0 Washim 20 9.1 6.3 1.2 Yavatmal 70 31.8 21.9 2.6 Total 220 100.0 68.8 9.6 Aurangabad Aurangabad 5 8.5 1.6 3.7 Beed 6 10.2 1.9 3.9 Hingoli 5 8.5 1.6 1.7 Jalna 13 22.0 4.1 2.7 Latur 0 0.0 0.0 2.5 Nanded 26 44.1 8.1 3.2 Parbhani 4 6.8 1.3 2.0 Total 59 100.0 18.4 19.9 Nagpur Chandrapur 1 7.7 0.3 2.0 Gondhia 1 7.7 0.3 1.5 Nagpur 1 7.7 0.3 1.9 Wardha 10 76.9 3.1 1.2 Total 13 100.0 4.1 6.6 Nashik Dhule 3 11.1 0.9 1.7 Jalgoan 22 81.5 6.9 3.2 Nandurbar 2 7.4 0.6 1.7 Total 27 100.0 8.4 6.6 Pune Pune/Total 1 100.0 0.3 7.0 All Total 320 - 100.0 100.0 Note: From 320 cases scanned from news reports information on districts/divisions available for 305 cases only. The gaps were filled by an independent list of farmers’ suicides with addresses provided by Deshonnati. Distribution of farmers across districts is based on cultivators in Census 2001. Total for division includes only those districts where farmers’ suicides have been reported. Source: Farmers’ suicide related information is from Deshonnati and population related information is from Census 2001.
3. Monthly Pattern of Suicides
Nearly 58 per cent of reported suicide deaths were during monsoon months July-September
with July and August having reported 71 and 70 cases respectively (Table 2). Vidarbha is
largely a rain-assured region, but 2004 saw a below normal rainfall. This had an adverse
impact on germination of cotton crops. There are 89 cases of failed sowing – 37 for first, 31
for second, 20 for third and one for fifth sowing. Some of the suicides took place much after
the failure of sowing. This indicates that the farmers were mulling over their crisis or perhaps
it was compounded by something else. It can also be inferred in some cases that the farmer
went for a second/third sowing in late August/early September and a failure of fifth sowing in
a tract that is totally rain dependent. This not only indicates the farmer’s helplessness but also
8

Suicide of Farmers in Maharashtra: Background Paper
lack of a proper extension service. In such situations even a third sowing is not advisable.
Untimely rainfall both at the time of harvest or after harvest will destroy the exposed crop.
Excessive rain can adversely affect the lives and property of farmers (Sakal, 2005). This
reminds us of a saying rooted in rain-dependent peasant societies: Abundance of water,
destroys life; Paucity of water, destroys life.
Table 2 Month wise distribution of suicides reported in Deshonnati, 2004
Months Frequency Per cent of Total January 13 4.1 February 6 1.9 March 6 1.9 April 13 4.1 May 5 1.6 June 12 3.8 July 71 22.2 August 70 21.9 September 43 13.4 October 32 10.0 November 22 6.9 December 27 8.4 Total 320 100.0 Note: January 2004 includes one case of December 2003, reported in 2004.
4. Distribution of Suicides by Age
In Table 3, of the 269 cases reporting on age, 84 belonged to the age group 30-40 years and
85 belonged to the 40-50 years age group. Overall, 77 per cent of the suicide deaths were by
individuals below 50 years of age. Two of the four women victims were in the age group 40-
50 years, while one woman was 21 years old. The age of the widow farmer is not available
from the reports.
Table 3 Age-wise distribution of suicides reported in Deshonnati, 2004
Age interval Frequency Per cent of Total Cumulative Percentage 19-20 3 1.1 1.1 20-30 34 12.6 13.8 30-40 84 31.2 45.0 40-50 85 31.6 76.6 50-60 39 14.5 91.1 60-70 20 7.4 98.5 70+ 4 1.5 100.0 Total 269 100.0 - Note: From 320 cases, information on age is available for 269 cases only.
9

Mishra, Farmers’ Suicides in Media
5. Distribution by Method of Suicides
In Table 4, of the 313 reports where mode of suicide was mentioned, 76 per cent consumed
pesticide. Ironically, pesticides, which are used to kill pests, are now proving to be deadly to
the farmer himself. In the local language it is referred to as vishari aushad (poisonous
medicine). Poison indeed, but where is the medicinal value.
Caution is suggested while administering pesticides because they not only kill the harmful
pests, but also the beneficial ones. Over time, the harmful pests become resistant leading to
an increase in the number of sprayings and usage of more powerful varieties of pesticides.
We came across some cases where farmers committed suicide in a state of shock and in a
moment of impulse, wherein the suicide has been committed on the farm after seeing the
failed crop. A 45-year-old farmer from Yavatmal and a 50-year-old farmer from Hingoli
consumed pesticide moments after seeing their failed crops; the former after third time
sowing and the latter after second time sowing and failure due to inadequate rains.
In contrast to the impulse action by some farmers there are others who perhaps mulled over
the issue and the act had been a pre-planned decision. On July 24, a 26-year-old farmer from
Nanded, who had suffered losses due to a failed second sowing purchased a pesticide called
Kurokron and took it to his fields where he consumed it. In Jalgaon, a 30-year-old farmer had
suffered a crop failure for the second time and was under great stress due to mounting debts.
On August 14, he waited for his family to go out and consumed pesticide when he was alone
at home. It perhaps looks as if the impulse action was more by farmers in their 40s whereas
the planned action was by those in their 20s or 30s, but with few cases it is not proper to
generalize on this pattern. It is, however, important to note that those who planned could be
imitating their action after reading news reports about farmers facing similar crisis.
Table 4 Method wise distribution of suicides reported in Deshonnati, 2004
Method Frequency Per cent of Total Consumed pesticide 237 76.2 Hanging 52 16.7 Drowning 11 3.5 Immolation 9 2.9 Lay under moving train 2 0.6 Total 311 100.0 Note: From 320 cases, information on mode of committing suicide is available for 311 cases only. All the female victims consumed pesticide.
10

Suicide of Farmers in Maharashtra: Background Paper
6. Distribution by Risk Factors
Suicides are a culmination of multiple risk factors. Inferring risk factors from news reports
will be difficult for two reasons. First, the purpose of the news reports was not intended to
highlight all possible risk factors. Second, as the concerned individual is no more surviving,
news reports or any investigation would be based on information or circumstantial evidence
collected from others.
Table 5 Risk Factor wise distribution of suicides reported in Deshonnati, 2004*
Freq uency
Per cent of sub-group Total
Per cent of All Total
Single Risk Factor Indebtedness 45 66.2 15.7 Crop failure 17 25.0 5.9 Miscellaneous# 6 8.8 2.1 Total (single risk factor) 68 100.0 23.8 Double Risk Factors Indebtedness+ Crop failure 168 96.0 58.7 Indebtedness+ Daughter’s/Sister’s marriage 4 2.3 1.4 Indebtedness+ Miscellaneous# 3 1.7 1.0 Total (double risk factors) 175 100.0 61.2 Triple Risk Factors Indebtedness+ Crop failure+Daughter’s/Sister’s marriage@ 31 72.1 10.8 Indebtedness+ Crop failure+Miscellaneous# 11 25.6 3.8 Indebtedness+ Harvest stolen+Daughter’s marriage 1 2.3 0.3 Total (triple risk factors) 43 100.0 14.7 All Total 286 - 100.0 Note: * Data are for households. From the 317 households, information on risk factors was available for 286 households. The three households with two suicides, one had a single risk factor of not receiving compensation for land that got submerged under water, another also had a single risk factor of indebtedness and the third one had two risk factors of indebtedness and crop failure. # Miscellaneous reasons are the following: For single risk factor we have cheating in land transaction (2 cases), failure to receive government compensation in return for land that got submerged under water, denial of loan, and shock of a high electricity bill. For double risk factors we have crop destroyed by fire (two cases) and illness. For triple risk factors we have illness (3 cases), family dispute (3 cases), taluka not being included under drought relief zone, denial of loan, wait of four days at cotton market to sell produce, not getting right price and unsuccessful in obtaining water even after digging well twice. @ Includes one case with a fourth risk factor of shock after receiving an electricity bill for Rs.13000/-.
In Table 5, from the 286 households where risk factors have been reported, 24 per cent of the
reports mention a single risk factor, 61 per cent mention two risk factors and the rest mention
three/four risk factors. Overall, indebtedness had the highest incidence finding mention in 66
per cent of cases reporting a single risk factor and in all the cases of double, triple and four
11

Mishra, Farmers’ Suicides in Media
risk factors. Thus, indicating the economic crisis among the deceased households. Agrarian
crisis is somewhat reflected in crop failure finding mention in 79 per cent of the cases and
also in some miscellaneous cases like not receiving the right price for crop, long wait at
government marketing centre prior to selling of produce, non receipt of compensation in
return for land that got submerged under water, non receipt of drought relief compensation,
crop loss due to fire, crop being stolen, unsuccessful attempt at digging well for irrigation,
being cheated in land transactions and litigation of land among others. An economic crisis
that gets manifested in indebtedness and an agrarian crisis of crop failure or other related
problems are interconnected. To be specific, crop failure can accentuate indebtedness through
non-payment of existing loans or bring about the need for more loans.
In addition to economic and agrarian crisis, if there is a social responsibility like a recent or
an impending marriage in the household (71 percent of the cases reporting three risk factors
have indicated this), illness and intra family conflict among others. From the 36 cases citing
daughter’s/sister’s marriage, all the cases report indebtedness and 32 of them crop
failure/loss. Age is available for 25 of these - four were in their 20s, two were in their 30s, 11
were in their 40s and eight were in their 50s. Thus, as one would expect, those in their 20s
were concerned about their sister’s marriage and those above the age of 40 were concerned
about their daughter’s marriage.
On intra family conflict we cite the following case to suggest how economic and agrarian
crisis can have a social bearing. The risk factors can feed into each other and have a
cascading effect on the perpetrators mind. For instance, a woman committed suicide on
August 6, 2004. The family land was only recently partitioned so that two married sons could
support their families. The deceased along with her husband and an unmarried son had in
their share 20 acres of land. They had an outstanding loan of Rs.70,000 from a bank and
moneylenders. When the second sowing failed, the deceased’s family found it difficult to
repay the debts and make their two ends meet. The grim economic situation led to constant
arguments between the deceased and her husband. One such argument triggered the fateful
event, but this intra-family conflict has its roots in the larger economic and agrarian crisis.
A farmer committed the fateful act on August 15, 2004, the Independence Day. The farmer
felt dejected at not being able to meet his daughter’s demand for a new dress that she wanted
to wear for the flag hoisting ceremony. Inability to cater to such a simple demand was a loan
12

Suicide of Farmers in Maharashtra: Background Paper
of Rs.3000/- for which interest alone amounted to Rs.7000/-. Crop failure made loan
repayment impossible and with passing time even meeting daily household expenses was
difficult. His daughter’s demand exposed his unfreedom. He chose to end his life on the day
India attained freedom. The timing is poignant. Such acts reflect anger against society that is
directed at self and is also a call for help. Is anybody listening?
After a four-day wait at the government cotton market in Karanja to sell his produce, a farmer
committed suicide by consuming Monokron on the night of November 27, 2004. The
deceased owned 20 acres of land and had an outstanding loan of Rs.1 lakh from informal
sources and another Rs.40,000 from a bank. His suicide note also indicated of a poor
agricultural produce. Wait in winter nights at the cotton market might have physically
exhausted him, but more importantly it would add to his expenses. Indebtedness, poor
agricultural production, long wait to sell crop and physical exhaustion all coupled together.
Indebtedness is also taking the form of Kheda Kharidi a form of interlinked transaction
amongst the cotton farmers of Vidarbha, 80 per cent of who are indebted. Moneylenders and
traders give loan to farmers and in turn buy the produce at a pre-determined price from the
farmers and sell it at a higher rate to the Government (Sakal, 2004d).
A peasant leader is of the opinion that indebtedness and economic decline is just the
beginning of several other complications, such as family disputes, domestic altercations,
illness and alcoholism among others (Joshi, 2004). In other words, even when non-economic
reasons are cited as the immediate cause or as a trigger factor leading to suicide of a farmer,
the economic decline brought about through an agrarian crisis would be the underlying factor.
The economic crisis is depicted through indebtedness. Below, we look into the various
sources of loans.
7. Distribution by Source of Loans
From the 263 cases on indebtedness, news reports gave information on the sources of loans
for 153 cases. In Table 6, one observes that 55 per cent of the loans are from a single source,
42 per cent are from double sources and a few are from triple sources. About 82 per cent
have taken some loan from formal sources like the bank and 53 per cent have taken some
loan from moneylenders. In fact in 39 per cent of the cases loans were from both the formal
sources like bank and the moneylender.
13

Mishra, Farmers’ Suicides in Media
Table 6 Distribution of sources of loans reported in Deshonnati, 2004
Sources of loans
Frequency Per cent of sub-group
Total
Per cent of All Total
Single source of loans Formal sources like bank (Bank) 60 71.4 39.2 Moneylender 19 22.6 12.4 Friends and Relatives 4 4.8 2.6 Traders 1 1.2 0.7 Total 84 100.0 54.9 Double source of loans Bank + moneylender 54 84.4 35.3 Bank + relative 6 9.4 3.9 Bank + trader 1 1.6 0.7 Moneylender + relative 3 4.7 2.0 Total 64 100.0 41.8 Triple source of loans Bank + moneylender + relatives 4 80.0 2.6 Bank + moneylender + trader 1 20.0 0.7 Total 5 100.0 3.3 All Total 153 100 Note: From 317 households, information on sources of loans is available for 153 households. This includes one household with two deaths, which incidentally had borrowed from two sources - bank and moneylender.
There is an instance of a 35-year-old farmer in Yavatmal reacting adversely and committing
suicide to a simple rejection of a loan application. The dire need of money is borne out from
the fact that the farmer had to sell tin sheets from his house roof to buy pesticides, which he
used for committing suicide.
In other cases, the farmers resort to informal sources of credit after having defaulted on their
bank loan and hence being considered ineligible for subsequent loans. A farmer from
Yavatmal was rejected a loan as he had outstanding dues of an earlier loan that he had
borrowed for social expenses. Hence, he borrowed from a moneylender to go in for second
sowing. One of his daughters also had to give up her schooling. All this disturbed him
mentally and he committed suicide on August 13, 2004.
The resort to informal sources does away with paper work and reduces delay in obtaining
loans. For instance, a farmer had applied for loan on April 24, 2004 at a bank. However, due
to delay in the loan getting sanctioned, he had to borrow from informal sources. Delayed
14

Suicide of Farmers in Maharashtra: Background Paper
rainfall led to crop failure and he was worried about paying back the loans. On July 18, 2004
he consumed pesticide in his field.
It has been cited that interest rates as high as 14 percent per annum in the institutional sector
make it difficult for the farmers to pay back their debts. Crop loans are insufficient to cover
more than 70 percent of the input requirements and farmers complain that bank credit meets
only 15 percent of their needs. For the rest they turn to moneylenders and traders doubling up
as moneylenders who charge interest rates anywhere between 30 to 120 percent a year
(Bunsha, 2004). In one of the articles, a peasant leader also blames the highly ‘coercive’
measures adopted by the organized sector recovery officers for prompting suicides. Farmers
pay an 8 per cent premium on their bank loans towards crop insurance. Only when drought is
officially declared, the banks allow them to claim insurance (Joshi, 2004).
The reliance on informal sources of credit is quite apparent. This exposes the farmer to high
rates of interest, which become evident if there is a crop failure. It will be improper to state
that loans per se act as a risk factor, but when coupled with crop failure or other factors it
becomes one of the most important risk factors.
8. Comparing Three Sources of Information
It can be argued that media reports will sensationalize and emphasize some particular aspects
that they consider newsworthy. The Government also conducts its independent investigation
to identify whether a particular household ought to be considered eligible for receiving
compensation or not. We take up a few cases to highlight the differences in reporting. We
also provide the information from these households obtained from our field survey in Table 7
(Mishra, 2005, Annexure 3).
The Government report does not consider case 1 for compensation because the deceased
happens to be a female member without legal ownership of land. In case 2, the Government
report does not consider the farmer to be indebted perhaps because there was no documentary
evidence to substantiate loans from informal sources. In case 3, the deceased being a
sharecropper is considered landless. In case 4, government’s investigation accepts that the
deceased farmer was indebted, but also adds that there was no coercion to repay.
15

Mishra, Farmers’ Suicides in Media
Table 7 Comparing Deshonnati reports with Government Investigation and Our Field Survey
Information. No Deshonnati report Government report Field Survey 1 48-year-old woman. Residing with
her were her husband and one unmarried son. Family has 20 acres of land. Her husband had borrowed Rs. 29,000 from a bank and Rs. 40,000 from a moneylender. When the second sowing failed, the deceased became depressed. This led to frequent altercations between the couple.
55-year-old female. There is no land or loan in her name. The case was not considered for compensation. It was observed that the suicide was not linked to crop failure or indebtedness and was due to personal reasons.
48-year-old female. Family has 19 acres of land and an outstanding debt of Rs. 32000 from bank and relatives. Some of the relatives are said to have pressurized the deceased for repayment of loan.
2 Had taken a loan of around Rs. 40,000 from informal sources. His second sowing had produced dissatisfactory results.
33-year-old male who was not found to have committed suicide due to indebtedness.
33-year-old male. Family has 7 acres land. The deceased had borrowed Rs. 7000 from a moneylender against his land as collateral. Since the loan could not be repaid, the moneylender seized the land. This drove the deceased to suicide.
3 The deceased was a sharecropper who had sold off his 1.5 acres land. He had borrowed from a moneylender for a second sowing.
28-year-old male who did not have any land or loans to his name. Hence he did not commit suicide due to indebtedness.
30-year-old male. He had taken some loan from a private moneylender and to repay it he had to sell 2.5 acres of land.
4 The deceased was a marginal farmer who had borrowed from a bank. Successive crop failures led to indebtedness and the deceased could not repay his loans.
65-year-old male who had taken a loan from a bank, but there was no evidence of any pressure on him to repay.
60-year-old male. The deceased had 14 acres of land and an outstanding loan of over Rs. 8000 from a co-operative bank. He committed suicide due to indebtedness and crop failure.
Note: The outstanding loan amount obtained from our field survey could be underestimates because it does not include the interest amount to be paid or because the respondents may not be aware of all the loans taken by the deceased or because the household might have repaid some amount of the loan by the time of our survey.
Our field survey points out that in all the four cases households are dependent on farming for
earning their livelihood and they were indebted. Compared to our survey, there is over
reporting of the loan amount by Deshonnti (Cases 1 and 2), but it is true that the deceased
households did take loans from informal sources. Having said this we need to qualify that our
survey has a time lag and it is possible that the outstanding loan of the family could have
changed. It is also possible for respondents to be unaware of all the debts taken by the
deceased.
The government reporting is to determine ownership of land, indebtedness and pressure for
repayment of loan because compensation is decided on all these. If interpretation of
ownership is restricted to the individual then a wife (Case 1, Table 7) or son (see Sainath,
2005b) committing suicide will not be considered eligible. However, there are exceptions to
16

Suicide of Farmers in Maharashtra: Background Paper
this. There is an instance of a farmer household receiving compensation after their son’s
suicide. This means that there is scope for subjective interpretation by the investigating
officer. It is for the officer to interpret land ownership (deceased individual or family
members), indebtedness (formal sources only or to include informal sources also) and
pressure for repayment (official coercion or otherwise).
9. Other Related Issues
In Maharashtra the Monopoly Cotton Procurement Scheme (MCPS) was started in 1971 to
protect cotton farmers from market uncertainties and ensure to them a fair price for their crop.
The scheme run by the Maharashtra Cotton Growers’ Federation was successful until mid-
1990s. There were two developments, which adversely impacted the scheme. The first was
internal to the scheme. The office bearers of the Federation took to rent seeking at various
stages. There is manipulation at grading and weighing stages during procurement. To prevent
crosschecking of this manipulation, a convenient way out is to set stocks on fire (Sakal,
2003a, b; Hardikar, 2005). At times, the wait to complete the procedure of selling to the
Federation itself turns out to be traumatic as was in the case of a farmer committing suicide
after a four-day long wait at the cotton market (Deshonnati, 2004a).
The second development is the liberalized policies of the government. It reduced import duty
on cotton to 5 per cent in 2002. With the lifting of quantitative restrictions under the World
Trade Organization (WTO) treaties, cotton imports from the U.S. increased from 21,221
tonnes in 1999 to 48,805 tonnes in 2000. With a glut in the world market, prices fell and
MCPS accumulated a loss of Rs.2,795 crore by 2002 (Bunsha, 2002). In 2003, private traders
were allowed to participate in the cotton market. As this season witnessed a rise in
international prices, private traders offered a higher price than MCPS and procurement under
this scheme was low. In 2004 international/local open market prices fell and procurement
under MCPS increased. Under MCPS, procurement was 42 lakh bales of cotton in 2004-05 at
a total cost of Rs.5600 crore and to disburse this the Maharashtra State Coperative Cotton
Growers Marketing Federation (MSCCGMF) has either taken loans or has sought assistance
from the Government. Tthe MSCCGMF had paid Rs.2300/- per quintal, which is higher than
the minimum support price fixed by the Centre. From the total procurement, the MSCCGMF
has been able to sell only 17.5 lakh bales and is faced with a problem of storage due to dearth
or godowns (Wadke, 2005a, 2005b). In 2005-6, the Cotton Advisory Board (CAB) has
estimated a cotton production of 255-260 lakh bales at the all India level. With a carry over
17

Mishra, Farmers’ Suicides in Media
stock of 72 lakh bales from 2004-5, the open market price in 2005-6 is likely to be lower than
the minimum support price declared by the Central Government. Meanwhile, the MSCCGMF
has also decided that in the current season (2005-6) it will not pay a price that is higher than
that fixed by the Center.
Another issue that has been discussed is the reducing profitability of cotton cultivation as;
market prices for produce have not kept pace with that of the input intensive cost of
production (Bunsha, 2004). Cotton prices crashed from 75 cents a pound to an all-time low of
35 cents in October 2001. On the other hand farmers are now dependent on an external
agency for seeds. The new genetically engineered seeds like Bt (Bacillus thuringiensis, a
toxin producing bacterium that will control bollworm and other Lepidopteran insects) have a
royalty as high as 70 per cent. Fertiliser costs have increased three fold; pesticide spending
has increased per acre cost from Rs. 90 to around Rs. 3000. Annual power bills have
increased from Rs. 900 for a 3 Horse Power (HP) set to Rs. 4500. There is also an increase in
transportation costs, wage bill and interest payments (Katakam, 2002; Sainath, 2005d).
A parallel development is the withdrawal of the state from the rural agrarian scenario. The
rural credit structure has collapsed; rural branches of banks have reduced in absolute numbers
and percentage since 1990. This has led to increased borrowing from informal sources, which
in turn are exploitative (Sainath, 2004a, 2005a, c). Recent reports from the media have
carried statements that organized sector provides only 8-10 percent of credit forwarded to
farmers. And there is a close nexus between the police personnel and moneylenders that has
resulted in police pressurizing the farmers to repay to the moneylender (Maitra, 2005a, b).
This provides a strong case for quick implementation of the recommendations suggested by
the ‘Task Force on Cooperative Credit System’ that calls for reducing intervention from state
Governments and giving the authority of regulation to the Reserve Bank of India among other
things (Venkitaramanan, 2005). With changing technical know-how, a greater support from
agricultural extension services is called for. However, this is not the case. In Yavatmal alone,
there are 1200 krishi kendras (private input sale points) and just one full time quality control
inspector (Sainath, 2005d). In the absence of adequate extension services, farmers have to
rely on the input dealers. In an unregulated market, this makes them vulnerable to supplier-
induced-demand and spurious inputs.
18

Suicide of Farmers in Maharashtra: Background Paper
A three-year intensive field study conducted in Andhra Pradesh showed that MECH-12Bt,
MECH-162Bt and MECH 184Bt varieties did not produce satisfactory results compared to
non-Bt varieties. In 2005, the Genetic Engineering Approval Committee did not renew the
sale of these varieties in Andhra Pradesh, but ironically renewed the permission for sale in
Maharashtra. In fact, a newspaper quoted that in Marathwada one-third of the area under
cotton production in 2005-6 was under legal Bt cotton and another 45 per cent under illegal
Bt cotton. The illegal seed market comprises of companies who have not obtained mandatory
permission required for commercial sale of their Bt gene variety from the government
(Hindustan Times, 2005).
Another study in Andhra Pradesh and Maharahstra showed that 60 per cent of the farmers in
who used Bt cotton failed to break even and input costs for Bt cotton are about Rs.1,000
higher than that for non-Bt cotton. The use of Bt cotton in the Indian context has also been
criticized because land size is small and not enough to grow the required 20 per cent ‘refugia’
crop. It has also been observed that Bt seeds have not made the crop completely resistant to
Bollworm and have also resulted in lower yields of poorer quality as compared to other
hybrid varieties. Also since these seeds require more water, their use in a rain fed region like
Vidarbha is questionable (Krishnakumar, 2003, 2004; Sakal, 2003c).
A way suggested to combat reducing profitability is organic farming because it can reduce
dependence on market for inputs. The cost of cultivation reduces by less than half the amount
if chemicals would have been used. There exists a niche market for organic cotton that
provides 10-20 per cent premium over chemically produced cotton. What can come in the
way of shifting is that in the initial year of transition the yields may be relatively lower.
Nevertheless, it is an alternative that shows promise (Deshonnati, 2004b; Menon, 2003).
10. Guidelines for Suicide Reportage
News reports and other articles in the media related with farmers’ suicides in Maharashtra
highlight a number of important issues. The reports have initiated debate in the policy forum
as well as among researchers. At the same time, some reporting may also provide clues for
suicide contemplators. We did a survey among few reporters (some of them having covered
suicides). All of them pointed out that this is a sensitive issue and that they are careful while
reporting such cases. However, none of them were aware of any guidelines. It would be of
19

Mishra, Farmers’ Suicides in Media
help if WHO (2000) guidelines on DOs and DONTs while reporting on suicides, given in
Table 8, are disseminated among the media fraternity.
To provide a clear account of suicide reporting in provision with guidelines by WHO we
dwell in to the reporting style usually followed.
“Chinkhali Taluk: Shri Shivajirao Maruti Jhagare died by hanging himself on 20th July.”
Many newspapers follow this reporting style. What is required here is use of anonymity, by
avoiding name. Instead of direct mention of the method of suicide, it is better to substitute it
with words such as asphyxiation. Thus, the reporting style could have been as follows. A
farmer from Chinkhali taluka died due to asphyxiation caused by self-harm.
“Ever mounting debts and crop failure drove a young farmer to consume pesticide.” This
report has two parts. The first part gives simplistic reason in the form of debt and crop failure.
This primes the readers to think that suicide can be an escape route. The second part provides
the method, which could be avoided by using medical terms. Instead, the reporting could be
as follows. The grim and stressful circumstances such as mounting debts and crop failure
broke down the defenses of a young farmer. He was found dead due to organic toxicity
caused by consuming chemicals.
So and so died of … “Next to the body was found a letter stating the trauma, stress and
economic incapacity by him for repaying the debts.” This is an example of reporting a
suicide note. It is usually advisable not to report a suicide note verbatim, but if necessary then
only the gist be printed in the report.
Similarly, other precautions for reporting are to avoid giving photos of the deceased or of the
incident, avoid carrying news in the front page and avoid using the word ‘suicide’ or ‘self-
harm’ in the title of the story. This measure should be taken in order to insulate the readers
and suicide contemplators from getting primed and ruminative about the event.
Statements that are representative of religious or cultural stereotypes should also be avoided.
For instance, statements like “members of so and so community are more prone to suicides
than others.” This could not only lead to ill feeling among communities and cultures, but also
can be erroneously attributed as the cause of suicide. This should be avoided.
20

Suicide of Farmers in Maharashtra: Background Paper
It is very important that when one writes about suicide the general representation of the event
should have hope as the undertone, and compassion for the deceased, but with a strong appeal
that the act could be averted with appropriate seeking of help. It is of equal importance to
mention suicide as a symptom of mental trauma, provide inputs by professional such as
psychiatrist and psychologist, information on help lines and spiritual gurus. The reporters
should take care to highlight that suicide though it seems ‘an easy escape route,’ has an
indelible mark on the people close to the deceased who then have to fight there own mental
trauma.
The general newspaper analyses have shown that reporters usually get their information from
government officials. The latter too have an important role in shaping the report that media
presents to the public. Officials should refrain from a ‘no comment’ response; should avoid
dictating how the suicide should be reported and help by giving accurate and responsible
responses to the reporters’ queries. There is a strong case for co-operation between the
government and the media (CDC, 1994 and CDC et al, undated).
Table 8 DOs and DONTs for Suicide Reportage
Dos DONTs Work closely with health authorities in presenting the facts.
Don’t publish photographs or suicide notes.
Refer to suicide as a completed suicide, not a successful one.
Don’t report specific details of the method used.
Present only relevant data, on the inside pages.
Don’t give simplistic reasons.
Highlight alternatives to suicide. Don’t glorify or sensationalize suicide. Provide information on helplines and community resources.
Don’t use religious or cultural stereotypes.
Publicize risk indicators and warning signs Don’t apportion blame.
11. Concluding Remarks
This content analysis has three parts. The first part is an analysis of news reports on farmers’
suicides during January 1-December 31, 2004 in a Marathi daily, Deshonnati (2004a). It
looked into district wise distribution, monthly pattern, age, possible risk factors and loan or
debt details. Further, a few cases were taken to compare between the news reports and
government investigation done to decide on providing compensation.
21

Mishra, Farmers’ Suicides in Media
From 192 news reports 320 cases of suicides in 317 households were obtained. In two
instances both husband and wife committed suicide together and in one instance the son
committed suicide a day after his father’s death. The highest incidence of suicide was in
Amaravati division constituting 69 per cent of the cases and the epicenter seems to be in
Yavatmal district and 58 per cent of the suicides took place in the July-September period.
Further, 77 per cent (N=269) were below 50 years and 76 per cent (N=313) committed
suicide by consuming pesticide.
On risk factors (N=286), we could identify single risk factor in 24 per cent of the cases,
double risk factors in 61 per cent of the cases and triple risk factors in the remaining 15 per
cent of the cases. Indebtedness is the most common risk factor. It was identified in 66 per
cent of the single risk factor and all the double and triple risk factors. Crop failure is
identified in 25 per cent of the single risk factor and 96-97 per cent of the double and triple
risk factors. Another important risk factor happens to be daughter’s or sister’s marriage,
which was identified in 13 per cent of the total cases. It needs to be reiterated that risk factor
are not mutually exclusive. They can co-exist and even feed into each other aggravating the
overall stress of an individual.
On sources of loan (N=153), there is a greater reliance on formal sources like bank (82 per
cent), but this does not preclude the reliance on moneylenders (53 per cent). In fact, in 39 per
cent of the cases loans were taken from both bank and moneylender. The most intriguing part
of moneylender’s functioning is that they charge interest rates between 30-120 per cent per
annum.
Comparing between the media report and the government investigation suggests that the
latter is aimed at identifying whether the case is eligible for compensation or not and that
there is scope for subjective interpretation, which, more often than not, goes against the
deceased individual’s household receiving compensation.
In the second part, English and Marathi newspaper were analyzed to obtain further insights
into the problem of farmers’ suicide. The issues discussed point out the following. The office
bearers of the Monopoly Cotton Procurement Scheme (MCPS) indulge in rent seeking. This
coupled with liberalized policies has adversely affected the scheme since mid-1990s.
Farmer’s price risk has increased because its volatility is linked with the global scenario.
22

Suicide of Farmers in Maharashtra: Background Paper
Existence of MCPS in an open market has given it a structure where loss is in-built. Cost of
cotton cultivation is reducing its profitability. The state seems to be withdrawing and this is
evident from the decline of formal credit institutions, poor extension services and decline of
asset generating investments. The introduction of Bt (Bacillus thuringiensis) cotton in an
unregulated market has raised a number of questions. Organic cotton is suggested as an
alternative to counter reducing profitability as well as the questions around Bt.
In the third part, we discuss on suicide reportage. Dissemination of guidelines by World
Health Organisation (WHO) on DOs and DONTs are suggested. A case for cooperation
between the media and the government is also made.
References:
Au, SKJ; Yip, SFP; Chan, LWC; Law, YW (2004): Newspaper Reporting of Suicide Cases in Hong Kong, Crisis, 25 (4): 161-168.
Bunsha, D (2002): Drowning Cotton’s Lifebuoy, Frontline, January 19. Bunsha, D (2004): Vidarbha’s Trauma, Frontline, August 13. Centres for Disease Control and Prevention (CDC) (1994): Suicide Contagion and the
Reporting of Suicide: Recommendations from a National Workshop, MMWR, 43 (RR-6): 9-18, April 22.
CDC et al (undated): Reporting on Suicide: Recommendations for the Media,
http://www.afsp.org/education/recommendations/5/1.htm (accessed 20 December 2005)
Dandekar, A; Narawade, S; Rathod,R; Ingle, R; Kulkarni, V; Sateppa, YD (2005): Causes of
Farmer Suicides in Maharashtra: An Enquiry, Final Report Submitted to the Mumbai High Court, Tata Institute of Social Sciences, Rural Campus, Tuljapur.
Deshonnati (2004a): 192 News Reports on Farmers’ Suicide, January 1-December 31. Deshonnati (2004b): Editorial, November 1. Hindustan Times (2005): State Has Lowest Cotton Yields, Aurangabad Correspondent,
November 18. Joshi S (2004): Death is Better than Debt, The Hindu Business Line, September 16. Katakam A (2001): The Death Trap, Frontline, December 21. Katakam A (2005): The Roots of A Tragedy, Frontline, July 2.
23

Mishra, Farmers’ Suicides in Media
Krishnakumar A (2003): A Lesson From the Field, Frontline, May 24. Krishnakumar A (2004): Bt Cotton, Again, Frontline, May 8. Maitra, PK (2005a): Money Lenders Harassed Us Everyday, Hindustan Times, November 18. Maitra, PK (2005b): Police Pressure Feeds Cotton Crisis, Hindustan Times, November 20. Menon, M (2003): Organic Cotton: At Last, Freedom for Farmers, InfoChange News &
Features, May 7. Mishra, S (2005): Suicide of Farmers in Maharashtra: Interim Report, Submitted to
Government of Maharashtra, Indira Gandhi Institute of Development Research, Mumbai, November.
Sainath, P (2005a): Six Out of Ten? The Hindu, May 31. Sainath, P (2005b): Vidharbha: Whose Suicide Is It Anyway? The Hindu, June 25. Sainath, P (2005c): No Free Power Link to Farmers' Suicides, The Hindu, June 28. Sainath, P (2005d): As You Sow So Shall You Weep, The Hindu, June 30. Sakal (2003a, b, c): Editorial, October 28, October 30, December 20. Sakal (2004a, b, c, d): Editorial, July 14, July 22, August 15, November 5. Sakal (2005): Editorial, February 1. Venkitaramanan, S (2005): Vaidyanathan Panel Report on Co-op Credit - Quick
Implementation will Revive System, The Hindu Business Line, July 25. Wadke, R (2005a): Maharashtra Seeks Subsidy for Cotton Purchase Under Monopoly
Scheme, The Hindu Business Line, June 13. Wadke, R (2005b):Maharashtra Cotton Federation Facing Problems of Plenty, The Hindu
Business Line, September 21.
World Health Organization (2000): Preventing Suicide: A Resource for Media Professionals, Department of Mental Health, http://www.who.int/mental_health/media/en/426.pdf (accessed 20 December 2005).
24

Suicide of Farmers in Maharashtra: Background Paper
25
Cotton Sector in Maharashtra1
Sangeeta Shroff2
This Version: 15 October 2005
Abstract
Maharashtra accounts for more than one-third of the total area under cotton in India,
thereby making it one of the principal cotton growing states in the country. About 24 lakh
cultivators (that is, 20 per cent of the total cultivators in the state) and their families are
involved in cotton production in the state. For most, cotton is the primary cash crop and
therefore the principal source of income. Their major concern is unremunerative returns.
This is mainly because of the following factors: yield uncertainty because of fluctuations in
productions that is largely rain-dependent, yield being much lower than the national average,
cost of cultivation being much higher than the price received, poor dissemination of scientific
farm techniques (farmers do not use certified seeds, seed sowing per unit land is not adhered
to, fertilizer usage is not as per recommended dose, insecticide usage is excessive causing
damage to crop and ecology), and the increasing inability of the Maharashtra State
Cooperative Cotton Growers Marketing Federation (MSCCGMF) in providing a cushion
against price volatility.
1 This has been prepared as a background paper for the study on ‘Suicide of Farmers in Maharashtra’ being conducted by the Indira Gandhi Institute of Development Research (IGIDR), Mumbai for the Government of Maharashtra. An earlier version was peer reviewed by two anonymous referees and also discussed in the interim workshop held on 18 August 2005 at IGIDR. 2 The author researches and teaches at Gokhale Institute of Politics and Economics, Pune 411 004. She can be reached at [email protected].

Shroff, Cotton Sector
26
1. Backdrop
Maharashtra is one of the principal cotton growing states in the country. The total area under
cotton (2001-02) was 31.04 lakh hectares, which is about 37 percent of the total area under
cotton in the country. The production however shows wide fluctuations over the years and
ranged from 11.55 lakh bales in 1991-92 to 31.4 lakh bales in 1996-97. These wide
fluctuations occur mainly due to heavy dependence of cotton crop in the state on monsoons.
Only 3 percent of the area under cotton is irrigated, while 97 percent of the cotton area is
dependent on rainfall which is erratic.
There are 22,000 villages, from 23 cotton producing districts wherein about 24 lakh
cultivators and their families are involved in cotton production in the state. As per the 2001
census, there are 120 lakh cultivators in Maharashtra, which means that 20 percent of them
grow cotton. For them, cotton is the primary cash crop and therefore the principal source of
income. The value of cotton crop in Maharashtra (inclusive of cottonseeds) varies from 5.4
percent to 10.8 percent of Gross State Domestic Product from agriculture.
2. Cotton Cultivation
2.1 Cotton Production Performance
Cotton is an important commercial crop grown in Maharashtra and constituted 14 percent of
the gross cropped area in 20001-02. It has highest area under cotton in the country which is
about 30.76 lakh hectares in 2000-01 while Gujarat which ranks second in terms of area had
16.15 lakh hectares during the same period, which is slightly less than half of Maharashtra’s
area. However, in terms of yield, the state shows a different picture as yield from cotton is
lowest in Maharashtra and much below All India average. While All India yield was 191 kg
per hectare in 2000-01, the yield in Maharashtra during the same period was 100 kg per
hectare. Nearly 97 percent of the cotton cultivated in Maharashtra is unirrigated while in
states such as Punjab and Haryana , the entire area under cotton is unirrigated. In Table 1 we
have shown District -wise Area, Production and Yield of cotton in Maharashtra for TE 90-91,
96-97 and 2000-01. Further in Appendix II we have shown Area, Production and Yield of
cotton in Maharashtra for the period 1990-91 to 2001-02.
From Table 1, it can be observed that area under cotton in Maharashtra which was 26.5 lakh
hectares in TE 1990-91 increased to 31.97 lakh hectares in TE 2000-01.Yavatmal didsrict had

Suicide of Farmers in Maharashtra: Background Paper
27
highest area under cotton constituting 14.29 percent area of the state in TE 2000-01. The four
major cotton growing districts of Akola, Amravati, Buldhana and Yavatmal together
constituted 43 percent of the area in the state in TE 2000-01 but contributed to only 38
percent of production mainly due to low yields. During the year 2000-01, the yield in
Buldhana was 69 kg per hectare, while in Amravati and Yavatmal it was as low as 82 kg and
91 kg per hectare respectively (see Appendix I). There are also wide fluctuations in yield
from year to year and the state average yield which was 100 kg per hectare in 2000-01
increased to 147 kg per hectare in 20001-02. Thus although cotton is an important crop in
Maharashtra in terms of area, the low yield is a major cause of concern for the cotton
economy of Maharashtra.
Table 1
Districtwise Area, Production, and Yield of Cotton in Maharashtra Districts Area Production Yield
TE 90-91
TE 96-97
TE 2000-01
TE 90-91
TE 96-97
TE 2000-01
TE 90-91
TE 96-97
TE 2000-01
Nashik 16.00 20.00 51.60 17.33 20.67 64.66 199.67 227.00 210.00 Dhule 671.33 815.33 962.00 551.00 708.67 771.00 140.00 157.67 136.00 Jalgaon 1721.33 2770.33 3942.00 1718.67 3390.33 4442.00 168.67 225.67 193.00 A ̀Nagar 14.67 28.00 143.00 20.67 52.33 227.00 237.67 332.67 271.00 Pune 1.67 1.67 4.70 3.00 1.67 11.70 307.33 430.67 430.60 Solapur 22.67 36.33 57.30 32.33 50.33 94.00 241.00 272.67 276.00 Satara 10.33 42.67 52.30 18.67 50.33 104.00 312.67 316.33 337.00 Sangli 14.33 21.67 33.30 25.33 27.33 71.30 303.33 249.67 330.00 Kolhapur 1.00 2.00 1.00 1.00 2.00 1.00 154.33 210.00 181.30 A B̀ad 595.00 993.33 1482.00 671.00 739.67 1056.00 191.67 152.00 152.00 Jalna 1190.33 1442.67 1570.00 780.00 1181.33 1295.00 110.33 143.33 139.00 Beed 283.33 759.67 1015.00 210.67 635.33 825.00 128.00 140.33 138.00 Latur 255.67 339.67 272.00 132.33 260.00 213.00 94.33 134.00 134.00 Nanded 2239.00 2714.00 2741.00 1419.00 1759.33 1563.00 108.33 113.33 97.00 Parbhani 2652.33 3114.67 3231.00 1470.67 2868.00 2196.00 95.00 157.33 114.00 Buldhana 2554.00 2502.33 2449.00 1636.33 2136.00 1850.00 108.33 135.00 124.00 Akola 3583.67 3497.67 3511.00 2251.00 4194.00 2654.00 106.67 181.33 128.00 Amravati 3627.00 3611.33 3187.00 2350.67 3564.33 1807.00 110.33 146.33 96.00 Yavatmal 4326.33 4496.00 4570.00 2179.00 3907.67 3096.00 85.67 128.00 118.00 Wardha 1499.33 1433.67 1355.00 1656.67 1756.67 1449.00 187.33 219.00 181.00 Nagpur 643.00 563.33 637.00 560.33 616.00 789.00 149.33 192.67 213.00 Chandrapur 659.67 576.33 542.00 495.33 624.00 473.00 128.00 169.00 148.00 Gadchiroli 2.33 1.33 NA 2.00 2.00 NA 142.67 132.33 NA Maharashtra 26584.33 29784.00 31974.00 18203.00 28547.33 24904.00 116.00 158.00 132.00 Note: TE is triennium ending. Area in ’00 hectares, Production in ’00 bales of 170 Kg each, Yield in Kg per hectare. Source: Season and Crop Reports, Maharashtra State (Various issues)
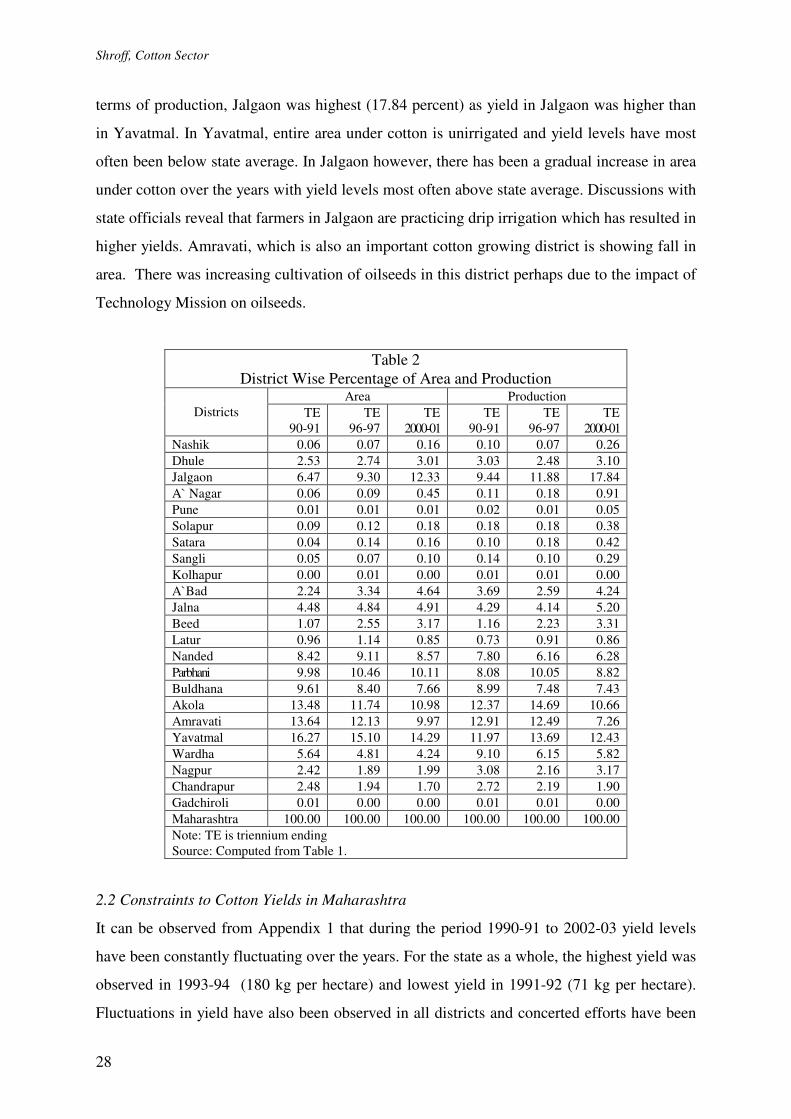
The District wise percentage of area and production is shown in Table 2. It can be observed
that while Yavatmal had highest area (14.29 percent) under cotton in Triennium 2000-01, in
Shroff, Cotton Sector
28
terms of production, Jalgaon was highest (17.84 percent) as yield in Jalgaon was higher than
in Yavatmal. In Yavatmal, entire area under cotton is unirrigated and yield levels have most
often been below state average. In Jalgaon however, there has been a gradual increase in area
under cotton over the years with yield levels most often above state average. Discussions with
state officials reveal that farmers in Jalgaon are practicing drip irrigation which has resulted in
higher yields. Amravati, which is also an important cotton growing district is showing fall in
area. There was increasing cultivation of oilseeds in this district perhaps due to the impact of
Technology Mission on oilseeds.
Table 2 District Wise Percentage of Area and Production
Area Production Districts TE
90-91 TE
96-97 TE
2000-01 TE
90-91 TE
96-97 TE
2000-01 Nashik 0.06 0.07 0.16 0.10 0.07 0.26 Dhule 2.53 2.74 3.01 3.03 2.48 3.10 Jalgaon 6.47 9.30 12.33 9.44 11.88 17.84 A ̀Nagar 0.06 0.09 0.45 0.11 0.18 0.91 Pune 0.01 0.01 0.01 0.02 0.01 0.05 Solapur 0.09 0.12 0.18 0.18 0.18 0.38 Satara 0.04 0.14 0.16 0.10 0.18 0.42 Sangli 0.05 0.07 0.10 0.14 0.10 0.29 Kolhapur 0.00 0.01 0.00 0.01 0.01 0.00 A B̀ad 2.24 3.34 4.64 3.69 2.59 4.24 Jalna 4.48 4.84 4.91 4.29 4.14 5.20 Beed 1.07 2.55 3.17 1.16 2.23 3.31 Latur 0.96 1.14 0.85 0.73 0.91 0.86 Nanded 8.42 9.11 8.57 7.80 6.16 6.28 Parbhani 9.98 10.46 10.11 8.08 10.05 8.82 Buldhana 9.61 8.40 7.66 8.99 7.48 7.43 Akola 13.48 11.74 10.98 12.37 14.69 10.66 Amravati 13.64 12.13 9.97 12.91 12.49 7.26 Yavatmal 16.27 15.10 14.29 11.97 13.69 12.43 Wardha 5.64 4.81 4.24 9.10 6.15 5.82 Nagpur 2.42 1.89 1.99 3.08 2.16 3.17 Chandrapur 2.48 1.94 1.70 2.72 2.19 1.90 Gadchiroli 0.01 0.00 0.00 0.01 0.01 0.00 Maharashtra 100.00 100.00 100.00 100.00 100.00 100.00 Note: TE is triennium ending Source: Computed from Table 1.
2.2 Constraints to Cotton Yields in Maharashtra
It can be observed from Appendix 1 that during the period 1990-91 to 2002-03 yield levels
have been constantly fluctuating over the years. For the state as a whole, the highest yield was
observed in 1993-94 (180 kg per hectare) and lowest yield in 1991-92 (71 kg per hectare).
Fluctuations in yield have also been observed in all districts and concerted efforts have been

Suicide of Farmers in Maharashtra: Background Paper
29
made by the government to improve yield. In fact the drive to improve cotton production in
all cotton producing states started soon after independence when development schemes such
as “Cotton Extension Scheme” and “Grow More Cotton campaign” were launched by the
government in the year 1950-51. These schemes however had certain deficiencies and to
overcome them, the government launched a new centrally sponsored scheme viz. Intensive
Cotton District Programme in 1971-72, which was later renamed as Intensive Cotton
Development Programme (ICDP) in 1979-80. The main objectives of the scheme were to
increase production of raw cotton by adopting improved farm practices and advanced
production technology.
Recently a fresh thrust to cotton research and development has been given by the launching of
a Technology Mission on Cotton (TMC) in February 2000. The purpose of this mission is to
bring the entire gamut of reaearch, technology transfer, marketing and processing of cotton
under one roof.
Studies by Government of India (2000) to evaluate the ICDP and also to evaluate the
Insecticide Resistance Management strategies (2002) indicated that the technology
disseminated has hardly been effective. These studies explained major constraints that retard
yield such as:
i. Cotton crop in Maharashtra is essentially rainfed and major regions are characterized by
scanty and uncertain rainfall. Only 3 percent of the cotton area is irrigated while 97
percent depends upon rainfall. Rainfall cotton yields are low owing to erratic and uneven
distribution of rainfall. Rainfall cotton suffers from moisture stress during post monsoon
season which coincides with flowering and boll development stages. The crop is also
grown on varying soil types with varying soil depth and wide range of soil moisture
storage. Yield therefore varies from year to year.
ii.The area under certified seeds does not exceed 40 percent. Even in the case of hybrids, a
sizeable share of the area is covered only by truthfully labelled seeds and not certified
seeds.
iii. Several technologies such as sowing in ridges and furrows and irrigation to alternate
furrows, adoption of proper seed rate, use of recommended dose of fertilizer etc. have
more or less not been adopted by farmers.

Shroff, Cotton Sector
30
iv. Since cotton crop supports insect pests throughout the season, farmers were accustomed
to using insecticides continuously, unmindful of the damage it causes to the crop. Overuse
and misuse of insecticides led to problems of harmful residues, pest resurgence,
development of insect resistance to insecticides and ecological upheavals. Farmers lack
extension services on how to deal with the insect pest outbreak crisis. With Insecticide
Resistance Management (IRM) strategies, farmers need to spray 0-1 times as compared to
their normal sprays of 7-10 applications.
v. While Integrated Pest Management programmes are becoming popular in the state, timely
availability of good quality bio agents at economical rates is a major constraint.
vi. There is indiscriminate release of new varieties, which do not have superiority in yield.
Private seed producers release hybrids to farmers in the name of research hybrids without
reference to "Variety Release Committee". This acts as a constraint.
vii. Late sowing and low plant population are other major constraints. Sowing is delayed, if
onset of monsoon is delayed. This adversely affects the productivity. Because of the
practice of wider inter row spacing, plant population per unit area is low.
viii. While marketing cotton, the produce of many varieties get mixed due to poor
infrastructure facilities in the market yards which makes the quality of the produce poor.
Most of the ginning and pressing units are poor and outdated. Due to this, not only is the
quality of cotton deteriorating but their efficiency is also low in terms of ginning
percentage.
ix. Most farmers were ignorant of proper and appropriate pest control technologies.
Insecticide application was mainly based on a calendar basis or under peer pressure.
Although government agencies tried to provide extension services, they never followed up
their visits. A large number of insecticide formulations were available in the market and
farmers were unable to choose the right formulation. Farmers mostly depended on
insecticide dealers for advice and to whom they were indebted. Heavy dose of insecticides
increased the cost of cultivation, lowered the yield and made cotton cultivation
unremunerative.
3. Cost of Inputs in Cotton Cultivation
In this section we have indicated the cost of inputs for important varieties of cotton which are
cultivated in Maharashtra. It may be noted that the Reports of The Commission For
Agricultural Costs and Prices published by the Department of Agriculture, GOI, regularly

Suicide of Farmers in Maharashtra: Background Paper
31
publish different cost estimates for various crops. In case of cotton however, these estimates
have not been published for Maharashtra. We therefore obtained these estimates from the
Maharashtra State Agricultural Prices Committee Cell.
Table 3 Per hectare item-wise cost of cultivation of Cotton (different varieties) in Maharashtra, 2002-03 No. Item H-6 NHH-44 LRA-5166
Unit of In-put
Inputs per
Hec-tare
Cost per
unit of Inputs
(Rs)
Total Costs per
Hectare (Rs)
Inputs per
Hec-tare
Cost per
unit of Inputs
(Rs)
Total Costs per
Hectare (Rs)
Inputs per
Hec-tare
Cost per unit
of Inputs
(Rs)
Total Costs per
Hectare (Rs)
1 2 3 1 Hired HumLab, M Days 12.47 50.00 623.50 10.88 47.00 511.36 12.23 51.20 626.18 F Days 69.47 47.00 3265.09 54.17 47.00 2545.99 64.43 47.00 3028.21 2 Bullock Labour, Pair Days 15.13 118.40 1791.39 15.18 94.13 1428.29 13.93 112.35 1565.04 3 Mach Charges Rs. 355.14 443.01 393.55 4 Seed Kg. 3.12 518.30 1617.10 2.44 353.83 863.34 5.90 86.27 508.99 5 Manures Cart 3.71 131.40 487.49 5.43 116.25 631.24 1.48 129.87 192.21 6 Fertilizers , N Kg. 43.64 10.00 436.40 50.78 10.00 507.80 41.17 10.00 411.70 7 P Kg. 22.71 17.28 392.43 26.39 17.28 456.02 25.49 17.28 440.47 8 K Kg. 5.37 7.09 38.07 10.50 7.09 74.45 9.56 7.09 67.78 9 Irrigation Charges Rs. 108.65 1.45 25.91 10 Insecticides Rs. 622.98 749.86 356.80 11 Insurance Charges Rs. 748.00 748.00 748.00 12 Incidental Charges Rs. 62.48 49.71 35.80 13 Work Capital, 1-12 Rs. 10548.72 9011.12 8400.64 14 Int on 13 Rs. 1107.62 946.17 882.07 15 Landrev,Cess&Tax Rs. 31.32 20.46 22.11 16 Depreciation Rs. 609.56 218.48 418.25 17 Cost ‘A’ (13-16) Rs. 12297.22 10196.23 9723.07 18 Rental value, Land Rs. 2556.25 1798.20 2041.67 19 Int. on FixedCapital Rs. 1150.96 520.66 1141.70 20 Cost ‘B’ (17-19) Rs. 16004.43 12515.09 12906.44 21 Family Hum Lab, M Days 21.96 62.50 1372.50 1046.34 13.15 64.00 841.60 22 F Days 11.55 58.75 678.56 17.81 58.75 862.45 9.82 58.75 576.93 23 SupervisionCharges Rs. 1229.72 14.68 58.75 1019.62 972.31 24 Cost ‘C’ (20-23) Rs. 19285.21 15443.50 15297.28 25 Cost ‘C’ per hectare Rs. 19285.21 15443.50 15297.28 26 Yield per hectare Qtls. 8.18 6.66 7.00 27 Value,main prod/hect Rs. 15337.50 10789.20 12250.00 28 Value,by-prod/hect Rs. - - - 29 Cost ‘C’,main prod/ha Rs. 19285.21 10443.50 15297.28 30 Per quintal Cost Rs. 2357.61 2318.84 2185.33 Note: Hum Lab indicates Human Labour, Int. indicates interest, Landrev indicates land revenue, depreciation is calculated on implements and farm buildings, prod indicates produce, items 25-29 are per hectare. Source: Agricultural Price Committee Cell, Maharashtra
The Maharashtra State Agricultural Prices Committee cell collects data on cost of cultivation
of various crops and on the basis of these estimates recommends Minimum Support Prices to
the centre. In order to obtain data for working out the cost of cultivation of each crop, a

Shroff, Cotton Sector
32
permanent machinery was created in four agricultural universities in the state in 1979. A three
stage stratified random sampling technique followed under the Centrally Sponsored
Comprehensive scheme has been adopted. While estimating the cost of cultivation, the state
APC considers items of direct expenditure and items of indirect expenditure. These estimates
are accordingly presented in Tables 3. It shows that for the year 2002-03 the cost of
production of H-6 variety was Rs 2357.61/- per quintal whereas the Minimum support price
(MSP) announced by CACP was Rs 1875/- per quintal. Again with respect to NHH-44 and
LRA-5166 while cost of production was Rs 2318.84/- and Rs 2185.33 per quintal
respectively, the MSP was Rs 1620/- and Rs 1750/- per quintal respectively. This indicates
that the MSP fixed is about 20 to 30 percent lower than the cost of production. As discussed
in the earlier section, attempts have to be made to increase the yield of cotton which would
lower the cost of cultivation.
4. Cotton Marketing in Maharashtra
4.1 Background
Maharashtra has highest area under cotton in the country and cotton is the primary cash crop
in the state. The marketing of this crop however has a unique feature, i.e. there is complete
state intervention. A scheme of Monopoly Procurement of Cotton was framed and given a
statutory form under the Maharashtra Raw Cotton (Procurement, Processing and Marketing)
Act, 1971. With the enforcement of this Act, all private trading in cotton was prohibited and
the cultivator was given only one option in regard to the selling agency, namely, the
Maharashtra State Co-operative Cotton Growers Marketing Federation Limited
(MSCCGMF). The main objectives of the scheme were (a) to ensure fair and remunerative
price of cotton to the growers in the state (b) to effect additional transfer of incomes to the
cotton growers by eliminating middlemen and securing in full the advantage of terminal price
(c) to bring about stability in the incomes of growers and thereby bring about stability and
growth in the overall production of cotton in the state (d) to supply scientifically graded
quality cotton to the consumer mills.
The hallmark of the monopoly scheme was the payment of a guaranteed price to the grower.
This price remained the same throughout the season and the cultivator was assured that he
would receive it even if the Federation could not sell at that price. The Maharashtra
Federation is a registered co-operative society.

Suicide of Farmers in Maharashtra: Background Paper
33
4.2 Financial Performance of the scheme
It is now little more than three decades since the scheme has been in operation. Its
performance during the first two decades i.e. from the period 1972-73 to 1993-94 showed that
it made losses in 8 out of 22 years. The major losses were in 1984-85 and 1985-86, when the
scheme made losses of Rs.77 crore and Rs.308 crore respectively. There was a bumper crop
of cotton in the country and prices in all primary markets began to crash. The Monopoly
Scheme was under strain as it had paid high guaranteed prices to the farmers but incurred
high marketing costs and realized low sale prices. To make good the losses, a sum of Rs.331
crore had to be transferred from the state exchequer to the federation for its survival. The
Price Fluctuation Fund which was devised essentially to ensure payment of guaranteed prices
in years of losses was completely wiped out and state had to come to the rescue of the
scheme. During the year 1985-86 as mentioned earlier, the scheme made heavy losses as the
ruling market prices were more or less on level with the centre’s support price but the
guaranteed prices announced by Maharashtra were 10 percent higher than the support prices
announced by the Commission for Agricultural Costs and Prices. Thus although in the 1985-
86 season the farmers received nearly 10 percent higher prices than their counterparts in other
states, this price was achieved at the expense of the exchequer. In this event, the problem was
further aggravated, as there was an inflow of cotton (of almost 10 lakh bales) from border
states which was against the spirit of the Maharashtra Raw Cotton Act, 1971. From the period
1986-87 to 1993-94 however, the scheme made profit continuously, mainly because of its
policy of fixing guaranteed price at support level. However, in 1993-94 a reverse situation
arose, when competitive prices in the border markets were substantially higher than
Maharashtra guaranteed price. In case of H-4 variety, for example the border prices were on
an average 40 percent higher than the Maharashtra guaranteed price. In this year while
production was estimated at 26 lakh bales, the procurement by the federation was only 13
lakh bales, which means that the Federation procured only 50 percent of the state’s
production. This adds to the financial loss of the scheme, as the growers could avoid
contributing to the Price Fluctuation Fund and Capital Formation Fund, the proceeds of which
are used for the functioning of the scheme. Further, due to surreptitious sale of cotton outside
the state, the growers could avoid repaying their dues to the co-operative credit societies. All
the case s of smuggling of cotton and disproportionate tender of cotton are dealt under section
20 of the Act. In the year 1999-2000, 6794 cases were filed against smuggling of cotton.

Shroff, Cotton Sector
34
However most of the cases filed were dismissed This was brought to light by a report on
Monopoly Procurement of cotton under the chairmanship of the Additional Chief Secretary.
Again, from the year 1994-95, the government began fixing guaranteed prices higher than
support prices. The growers were paid advance additional prices which resulted in them
receiving prices higher than their counterparts in neighbouring markets. The losses incurred
under the scheme since 1994-95 are indicated in Table 4.
Table 4
Losses incurred by Maharashtra Federation (Rs. crore) Year 1994-95 1995-96 1996-97 1997-98 1998-99 1999-00 2000-01 2001-02 Total
Losses 160.17 522.9 377.95 204.32 451 893 672 703.35 3984.69
Source : MSCCGMF
It can be observed that currently the Maharashtra Federation incurred losses to the tune of Rs.
3985 crore. The scheme provides that whenever the Final prices are lower than guaranteed
prices, the deficit is to be made good from the Price Fluctuation Fund. The Price Fluctuation
Fund and also another Fund (Capital Formation Fund where growers used to contribute 1 to 3
percent of guaranteed price) were completely wiped out as the scheme incurred losses year
after year. These losses are to be made good by the Government. A scheme which is heavily
dependent upon government subvention for its very survival can hardly be considered to be
efficient. The Monopoly Scheme aimed at ensuring fair price to the growers in the state and
securing to them the advantage of terminal price. It has however secured to its growers the
guaranteed price at the expense of the state exchequer.
4.3 Factors Responsible for huge and unsustainable losses
A number of factors are responsible for the huge losses incurred by the scheme. Since the
1994-95 season, the growers received guaranteed price on tender of their cotton. Further, if
the prices prevailing in the neighbouring markets were higher than guaranteed prices fixed in
Maharashtra, the growers also received an advance additional price. In Table 5 we have
shown prices paid to growers under Cotton Monopoly Procurement Scheme and those
prevailing in border markets.

Suicide of Farmers in Maharashtra: Background Paper
35
Table 5 Prices Paid to cotton Growers under Cotton Monopoly Procurement Scheme And
Border Prices (Rs) Year Support
Price Guaranteed
Price Adv Addl
Price Total Price Final Price Border
Price LRA-5166
1994-95 1140 1150 850 2000 1650 1648 1995-96 1260 1310 700 2010 1687 1800 1996-97 1290 1330 670 2000 1752 1900 1997-98 1430 1430 560 1990 1867 2050 1998-99 1545 1545 445 1990 1668 1300 1999-00 1650 1650 525 2175 1689 1950 2000-01 1700 1700 475 2175 2175 2080 2001-02 1750 1750 425 2175 - NA
Variety: H-4/H-6 1994-95 1200 1210 890 2100 1946 NA 1995-96 1350 1400 700 2100 1762 1750 1996-97 1380 1430 670 2100 1940 1850 1997-98 1530 1530 570 2100 1903 2000 1998-99 1650 1650 450 2100 1789 2200 1999-00 1775 1775 525 2300 1866 2025 2000-01 1825 1825 475 2300 NA 2153 2001-02 1875 1875 425 2300 NA NA
Source: MSCCGMF; Agricultural Price Committee Cell, GOM. There were several years when total price paid to farmers in Maharashtra were higher than
those prevailing in border markets. Paying unduly high guaranteed prices, which may stop
outflow of cotton to border states, led to other problems as these prices could not be
recovered at the time of sales. The problems were further accentuated as the federation was
slow in marketing its full pressed bales. Prior to the commencement of the 2001-2002 cotton
marketing season, the Federation had with it, stocks to the tune of Rs 2,220 crores. In Table 6
the interest cost incurred by the Federation to co-operative banks is indicated.
Table 6
Interest paid to Co-operative Banks (Rs Crore) Year 1994-95 1995-96 1996-97 1997-98 1998-99 1999-00 Total
Interest Paid 84.75 175.4 142.1 112.55 230.08 324.00 1068.88
Source: MSCCGMF
These mounting deficits mainly because of interest cost (besides storage and insurance) which
the government has to make good (sooner or later) would not be paid to cotton growers. The
huge budgetary subventions on these interest charges would go to the banks and other
financial institutions. The Federation often took as much as 23 months to dispose of its stocks
(Table 7).

Shroff, Cotton Sector
36
Table 7
Time taken in Disposing stocks Season 1994-95 1995-96 1996-97 1997-98 1998-99 Time in no. of months 23 23 15 23 17 Source: MSCCGMF
It has to compete with private trade in the market. The speed with which private traders
finalize deals, change their prices and service their clients cannot be matched by the
Federation because of its bureaucratic setup. The private traders dispose of their stocks
withen a period of 3 to 4 months Holding stocks for long, deteriorates the quality of cotton
and the Federation had to sometimes offer discounts on its sale operations. Also, improper
grading i.e., inferior quality being graded as superior quality is a common malpractice
observed. Further, there were 308 cases of fire during the period 1994-95 to 1999-2000 and
in 60 percent of the cases the reason for fire was not known. All these factors add to losses.
Besides the interest and other costs, the ginning and pressing rates (Table 8) paid by the
Federation are approximately 10 percent higher than that paid by neighbouring states. There
are times when the Maharashtra Federation procures as much as 180 lakh quintals of Kapas
and therefore ginning & pressing rates must be absolutely competitive to minimize cost. The
Federation often paid high guaranteed prices to the growers, which attracted surreptitious
movement of cotton into the state. Thus the scheme was not only subsidizing Maharashtra
farmers, but also those of neighbouring markets landing the scheme into greater financial
difficulty. In case ruling prices outside the state were higher, farmers moved it out in
contravention to the provision of the act.
Table 8 Ginning & Pressing charges ( Rs per quintal)
Charges Maharashtra Federation
Gujarat Andhra Pradesh
Ginning charges 58 54 50 Pressing charges 36 33 33 Source: MSCCGMF
The overall marketing operations of the Federation show that it is paying unsustainable
guaranteed prices, incurring huge marketing costs, holding large stocks due to slow sales and
grading is also not upto the mark. The assured guaranteed price however seems to be an
incentive to the grower to cultivate cotton. It is observed in Maharashtra that area has
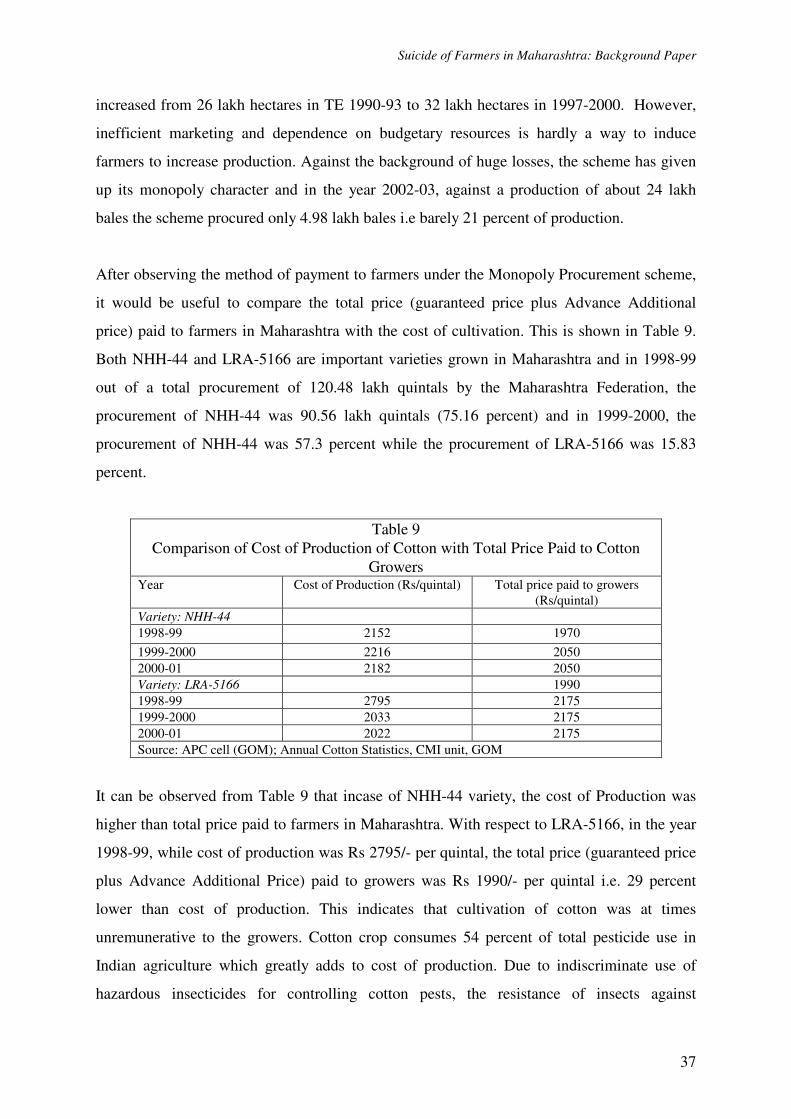
Suicide of Farmers in Maharashtra: Background Paper
37
increased from 26 lakh hectares in TE 1990-93 to 32 lakh hectares in 1997-2000. However,
inefficient marketing and dependence on budgetary resources is hardly a way to induce
farmers to increase production. Against the background of huge losses, the scheme has given
up its monopoly character and in the year 2002-03, against a production of about 24 lakh
bales the scheme procured only 4.98 lakh bales i.e barely 21 percent of production.
After observing the method of payment to farmers under the Monopoly Procurement scheme,
it would be useful to compare the total price (guaranteed price plus Advance Additional
price) paid to farmers in Maharashtra with the cost of cultivation. This is shown in Table 9.
Both NHH-44 and LRA-5166 are important varieties grown in Maharashtra and in 1998-99
out of a total procurement of 120.48 lakh quintals by the Maharashtra Federation, the
procurement of NHH-44 was 90.56 lakh quintals (75.16 percent) and in 1999-2000, the
procurement of NHH-44 was 57.3 percent while the procurement of LRA-5166 was 15.83
percent.
Table 9 Comparison of Cost of Production of Cotton with Total Price Paid to Cotton
Growers Year Cost of Production (Rs/quintal) Total price paid to growers
(Rs/quintal) Variety: NHH-44 1998-99 2152 1970 1999-2000 2216 2050 2000-01 2182 2050 Variety: LRA-5166 1990 1998-99 2795 2175 1999-2000 2033 2175 2000-01 2022 2175 Source: APC cell (GOM); Annual Cotton Statistics, CMI unit, GOM
It can be observed from Table 9 that incase of NHH-44 variety, the cost of Production was
higher than total price paid to farmers in Maharashtra. With respect to LRA-5166, in the year
1998-99, while cost of production was Rs 2795/- per quintal, the total price (guaranteed price
plus Advance Additional Price) paid to growers was Rs 1990/- per quintal i.e. 29 percent
lower than cost of production. This indicates that cultivation of cotton was at times
unremunerative to the growers. Cotton crop consumes 54 percent of total pesticide use in
Indian agriculture which greatly adds to cost of production. Due to indiscriminate use of
hazardous insecticides for controlling cotton pests, the resistance of insects against

Shroff, Cotton Sector
38
insecticides increases, and in turn compels the use of more number of sprays thus creating a
vicious cycle and increasing the cost of production. As regards payment for produce, most
farmers faced delayed payments. While guaranteed price was paid at the time of tender, the
payment of Advance Additional Price which was declared later in the season was delayed.
5. Other Policies in Cotton Sector
Efforts have been made by the government through various programmes such as Technology
Mission on Cotton to improve the yield of cotton. The other factors which influence are:
5.1 Trade Policies
Trade policies of the government also have an impact on the cotton economy. With respect to
imports, since 1970 they were canalized through Cotton Corporation of India. However, in
April 1994, keeping in tune with globalisation, cotton lint imports were placed under open
general license (OGL) ie. they were freely importable. Further, from July, 2001, raw cotton
exports were also under OGL.
Table 10 Import and Export of Raw Cotton
Import of Raw Cotton Export of Raw Cotton Year Quantity Value Quantity Value
1999-2000 2.37 125392.83 0.16 7706.96 2000-01 2.12 118472.63 0.30 22412.77 2001-02 3.87 205361.52 0.08 4269.40 2002-03 2.33 123760.89 0.12 5049.26 Note: Quantity in lakh tones and Value in Rs. Lakh. Source: Indian Cotton Annual, 2002-03, published by East India Cotton Association
However, despite free cotton exports, the government agencies are unable to gain from
exports due to depressed international prices of cotton. The cotlook index which was 91.77 in
1994-95 came down to 41.81 in 2001-02. As international prices were at the lowest levels in
2001-02, the country imported 3.87 lakh tonnes while our exports were only .08 lakh tones.
This is indicated in Table 10. With international prices being depressed there is hardly any
scope for the Maharashtra Federation which was holding large stocks of cotton to capitalize
on exports. Further, Indian cotton is often not acceptable in export markets on grounds of
quality considerations. Under these circumstances, a liberalized export policy may also not
help to revive the cotton economy.

Suicide of Farmers in Maharashtra: Background Paper
39
5. 2 Risk Management
Cotton is a crop characterized by frequent and sudden volatility in prices. The government
designed various price policies to impart stability to the cotton economy. The support price
mechanism operates throughout the country if needed. However, this mechanism has no role
to play in Maharashtra where farmers through the monopoly scheme are assured fixed
guaranteed prices and even a bonus in case of profits. Thus state interventions have been
playing a role in the cotton economy, especially in the state of Maharashtra.
State interventions while providing support to farmers suffer from their own limitations as
was observed in Maharashtra. It is therefore imperative to manage price volatility in other
ways. Price volatility can be managed with the introduction of futures trading in cotton. In
India, cotton had a long tradition of futures trading, much before independence, until it was
suspended in 1966 to curb the rising trend in prices. Futures trading was resumed in
December 1998 and the Government of India has granted permission to the East India Cotton
Association (EICA) to regulate and organize trading in cotton futures contract. EICA would
function under the guidance and directives of the Forward Markets Commission (FMC).
Futures contracts are a set of standardized exchange - traded risk management tools. Indian
Cotton Contract, a domestic futures contract in cotton, is an example of futures contract. The
primary economic purposes of the cotton futures market in serving the cotton industry as
recognized the world over are to provide a forum for price discovery and a tool for risk
Box 1
Establishment of EICA
EICA was established in 1921, to bring about orderliness in cotton trade. Nineteen regional associations and eleven marketing societies are registered with it. EICA has formulated a framework for trading in ready and forward contracts as well as imports and exports. It also prepares and maintains grade and staple standards in respect of all commercially grown cottons and has a well equipped laboratory which can evaluate all cotton samples. EICA has a Daily Rates Committee which ascertains and notifies the prices of various descriptions of specified staples and grades of cotton. These form the benchmark for both buyers and sellers for invoicing back and closing contracts. EICA’s services also include collection, compilation and dissemination of comprehensive data on supply, demand and prices of cotton. Futures trading in cotton which was suspended in 1966 and revived in1998 has been universally recognized as an effective modern tool for risk management and price discovery. EICA is the government nominated agency for conducting futures trading. Source: Office of EICA, Mumbai

Shroff, Cotton Sector
40
management. The ability to hedge price risk using futures contract in cotton will be an
incentive for farmers to take up cotton cultivation more extensively. The transparent price
discovery will enable farmers to plan the type of variety they prefer to sow according to the
realisation as reflected in the prices of futures market. Cotton futures can help kapas
processors, textile manufacturers, exporters of cotton textiles and a number of other market
functionaries to manage price risk associated with their purchases and inventories of cotton
and cotton based products.
Cotton futures contract can also be used by cotton yarn and cotton textile manufacturers to
have an efficient working capital management. The need to maintain a large inventory of
cotton to safeguard against price fluctuations can be greatly minimized thereby benefiting
them to reduce the cost of production. Thus instruments that minimize price risk such as the
futures contract in cotton would become a valuable and effective tool in the hands of the users
of cotton.
Futures trading in India, which was revived after 32 years, is still in an infant stage. The
trading in cotton futures contract is conducted in the designated trading hall of Cotton Green,
Sewri, Mumbai and is through open outcry system. However, futures trading have so far
remained on a low key due to certain impediments and hurdles. There is lack of awareness of
futures, and the new generation of persons functioning in the physical markets is not
conversant with either the utility of futures markets or the trading techniques. Also the
Forward Market Commission lacks full-fledged market intelligence and research cells for
gathering and disseminating speedily the market intelligence.
In futures markets, trading takes place only in units of 55 bales. This unit is quite high and
restricts small players. Further, traders find that the rules and regulations laid down by the
FMC regarding margins, netting, deposits, day-to-day clearing, sales tax, excise duty, octroi
and other measures are stringent and need to be rationalized
Finally, the operation of Monopoly Procurement Scheme of the Maharashtra Federation has
been one further impediment to successful futures. This is because futures trading require
large players in the markets. However, in Maharashtra, farmers are compelled to sell their
cotton to the Federation and hence cannot participate in futures markets. Also, they are

Suicide of Farmers in Maharashtra: Background Paper
41
assured of guaranteed price so they do not feel the need for futures as they do not face price
uncertainty. Again, a number of mills also buy directly from the Federation and therefore do
not enter futures markets. The Maharashtra Federation has its own bureaucratic set up
regarding sales and does not function in futures market.
Thus, due to a number of hurdles, trading in futures has been virtually negligible since
inception. Members have to still gain experience on the modus operandi of trading in these
contracts. Efforts have thus to be made to make futures trading in cotton more vibrant and
participatory. Efforts are being made by EICA to commence on-line futures trading so as to
make business more active and broad-based.
References:
Agricultural Finance Corporation (2000): Impact Evaluation Study of Intensive Cotton Development Programme, 1996-97 to 1998-99, Ministry of Agriculture, Government of India, November, Mimeo.
Cotton Marketing Intelligence Unit: Annual Cotton Statistics (Maharashtra), Cooperation
and Textile Dept, Government of Maharashtra. Directorate of Cotton Development (1999): Insecticide Resistance Management (IRM)
Strategies for Cotton Pests, Ministry of Agriculture, Government of India, Mumbai. Directorate of Cotton Development (2001): Insecticide Resistance Management Based Cotton
IPM: A Success Story, Department of Agriculture and Cooperation, Ministry of Agriculture, Government of India, Mumbai.
Directorate of Cotton Development (2002): Technology Mission of Cotton in Nutshell
Ministry of Agriculture, Government of India, Mumbai. EICA, Cotton Statistics & News, Various issues. EICA, Indian Cotton Annual, Various issues. Maharashtra State Cooperative Cotton Growers Federation, Unpublished Material through
personal communication. Shroff, Sangeeta (1997): Monopoly Procurement Scheme of Cotton in Maharashtra; Kapas
Price Comparison across markets, Indian Journal of Agricultural Economics, Volume 52, Jan-March.

Shro
ff, C
otto
n Se
ctor
42
A
ppen
dix
1 D
istr
ictw
ise
area
, pro
duct
ion
and
yiel
d of
cot
ton
in M
ahar
asht
ra
Dis
tric
t A
/P/Y
19
90-9
1 19
91-9
2 19
92-9
3 19
93-9
4 19
94-9
5 19
95-9
6 19
96-9
7 19
97-9
8 19
98-9
9 19
99-0
0 20
00-0
1 20
01-0
2 20
02-0
3 A
rea
19
11
12
12
15
32
37
98
121
150
157
135
108
Prod
uctio
n 28
9
19
19
11
62
84
179
199
226
256
167
83
Ahm
edna
gar
Yie
ld
247
139
267
267
283
329
386
311
280
257
277
211
130
Are
a 66
2 73
4 59
4 70
3 73
9 85
0 85
7 86
7 94
6 98
7 95
5 66
8 66
4 Pr
oduc
tion
539
375
658
633
638
607
881
872
1033
77
7 50
3 48
7 35
8 D
hule
Y
ield
13
9 87
18
8 15
3 17
7 12
1 17
5 17
1 18
6 13
3 89
12
4 92
A
rea
1893
20
40
2034
20
98
2633
27
79
2899
34
04
3719
39
91
4115
40
30
3840
Pr
oduc
tion
1909
11
16
2340
25
42
2553
31
43
4475
37
06
4895
56
20
2811
50
49
4682
Ja
lgao
n Y
ield
17
1 93
19
6 20
6 22
3 19
2 26
2 18
5 22
4 23
9 11
6 21
3 20
7 A
rea
17
7 11
3
9 23
28
31
42
56
5
7 62
54
Pr
oduc
tion
31
7 18
5
5 19
38
28
44
93
57
39
67
N
ashi
k Y
ield
30
6 17
0 27
2 28
3 31
0 14
0 23
1 15
4 17
7 28
4 17
0 10
8 21
1 A
rea
1 1
1 1
2 2
2 1
1 1
1 1
1 Pr
oduc
tion
1 1
1 1
1 2
3 1
1 1
1 1
1 K
olha
pur
Yie
ld
175
70
185
185
211
173
246
183
216
218
110
192
170
Are
a 2
1 1
1 3
1 1
2 3
4 7
2 82
Pr
oduc
tion
4 2
2 1
0 2
3 6
5 14
16
4
5 Pu
ne
Yie
ld
350
297
291
205
266
343
483
512
303
593
396
333
465
Are
a 19
19
20
17
22
16
27
32
31
33
36
31
30
Pr
oduc
tion
33
33
31
26
20
16
46
75
53
76
65
30
33
Sang
li Y
ield
29
6 29
7 26
2 26
2 28
6 17
3 29
0 39
9 29
2 39
2 30
7 16
5 18
5 A
rea
9 10
13
11
47
38
43
45
47
54
56
31
36
Pr
oduc
tion
16
23
26
21
10
70
71
108
81
126
106
30
41
Sata
ra
Yie
ld
300
389
340
326
355
313
281
399
292
398
322
149
193
Are
a 24
36
42
37
35
34
40
44
49
58
65
40
44
Pr
oduc
tion
25
36
74
50
31
55
65
73
68
102
112
35
75
Sola
pur
Yie
ld
175
170
298
229
267
275
276
282
237
299
292
149
290
Con
tinue
d

Suicide of Farmers in Maharashtra: Background Paper
43
Appendix 1 (continued)
Districtwise area, production and yield of cotton in Maharashtra District A/P/Y 1990-91 1991-92 1992-93 1993-94 1994-95 1995-96 1996-97 1997-98 1998-99 1999-00 2000-01 2001-02 2002-03
Area 633 644 610 587 861 1019 1100 1397 1526 1595 1324 1413 1355 Production 701 281 501 577 575 683 961 820 1483 1132 552 915 755 Aurangabad Yield 188 74 140 167 193 114 149 100 165 221 71 110 95 Area 236 336 691 405 617 854 808 829 1103 1112 829 1080 788 Production 173 155 576 388 367 800 739 476 914 872 689 798 557 Beed Yield 125 78 142 163 106 159 156 98 141 133 141 126 120 Area 1284 1303 1077 1150 1237 1550 1541 1520 1626 1703 1382 1572 1449 Production 913 541 777 900 863 1169 1512 1027 1734 1216 936 1834 2000 Jalna Yield 121 71 123 133 135 128 167 115 181 121 115 198 235 Area 235 271 241 248 298 356 365 286 316 280 222 171 98 Production 103 83 136 233 231 253 296 129 254 187 197 144 59 Latur Yield 75 52 96 160 143 121 138 77 137 114 151 143 102 Area 2349 2640 2397 2275 2454 2704 2684 2752 2781 2743 2700 2457 2146 Production 1239 744 1352 1641 1631 1810 1837 850 2086 1769 834 1651 1261 Nanded Yield 90 48 96 123 110 114 116 53 128 110 53 114 100 Area 0 0 0 0 0 29 19 15 40 30 26 25 19 Production 0 0 0 0 0 21 16 7 32 20 11 9 12 Osmanabad Yield 0 0 0 0 0 126 142 77 137 114 70 64 103 Area 2660 2801 2912 2674 2868 3214 3262 3325 3300 3327 3067 2034 1935 Production 1307 913 1725 3052 3053 2503 3048 1905 2818 2342 1430 1797 1949 Parbhani Yield 84 55 101 194 181 132 159 97 145 119 79 150 171
Continued

Shroff, Cotton Sector
44
Appendix 1 (continued) Districtwise area, production and yield of cotton in Maharashtra
District A/P/Y 1990-91 1991-92 1992-93 1993-94 1994-95 1995-96 1996-97 1997-98 1998-99 1999-00 2000-01 2001-02 2002-03 Area 3617 3592 3057 2951 3251 3619 3623 3682 3603 3595 3335 2314 2229 Production 2532 1160 2413 3715 3796 4454 4332 1834 2465 3408 2090 1949 2246 Akola Yield 119 55 134 214 132 209 203 85 116 161 107 143 171 Area 3730 3611 3332 3206 3414 3717 3703 3509 3209 3260 3091 3246 2790 Production 2539 1724 2534 3734 3764 3484 3445 1202 1429 2496 1497 1978 2437 Amravati Yield 116 81 129 198 122 159 158 58 76 130 82 119 149 Area 2667 2571 2186 2112 2436 2547 2524 2655 2658 2580 2198 2201 1683 Production 1699 717 1256 2075 2122 1861 2425 1199 2025 2635 892 1978 1947 Buldhana Yield 108 47 98 167 118 124 163 77 130 174 69 153 197 Area 4240 4161 4022 3879 4215 4653 4620 4453 4456 4461 4477 4370 4033 Production 2130 1686 2811 4153 4141 3683 3899 1843 2425 4481 2382 1949 3136 Yavatmal
Yield 85 69 119 182 105 135 144 70 93 171 91 119 132 Area 679 639 628 593 544 591 594 520 527 546 554 615 561 Production 464 362 381 572 554 652 666 318 443 612 364 1362 426 Chandrapur
Yield 116 96 103 164 128 188 191 104 143 191 112 120 129 Area 681 599 534 549 521 577 592 524 565 634 711 801 734 Production 536 407 345 484 453 720 675 254 699 1037 631 2272 712 Nagpur
Yield 134 116 110 150 172 212 194 82 210 278 151 163 165 Area 1552 1554 1324 1294 1378 1447 1476 1401 1322 1339 1404 1500 1362 Production 1829 1184 929 1439 1435 1921 1914 621 1003 1751 1594 884 1293 Wardha
Yield 200 129 119 189 211 226 220 75 129 222 193 153 151 Area 27212 27591 25743 24809 27599 30654 30847 31392 31991 32539 30769 31047 27999 Production 18753 11561 18907 26264 26254 27992 31433 17531 26189 30993 18026 26896 25961
Maharashtra state Yield 117 71 125 180 145 155 173 95 139 162 100 147 158 Note: Area in ’00 hectares, Production in ’00 bales of 170 kg each, Yield in kg per hectare Source: Agricultural Statistical Information, Maharashtra State, 2002 (Part II)

Suicide of Farmers in Maharashtra: Background Paper
Resurrection of Rural Credit Delivery System in Maharashtra1
Deepak Shah2
This Version: 6 January 2006
Abstract
The major problems plaguing the rural credit delivery system of Maharashtra are the
mounting overdue and the non-performing assets of rural financial institutions. In 1990s,
compared to 1980s, the growth in institutional finance through credit cooperatives and
membership of cooperative societies was slower whereas outstanding loans as a proportion
of loan advances grew at a much faster pace. In the latter part of 1990s the loan advances for
cotton crop per borrowing member seems to have declined. Across regions, Vidarbha showed
the lowest amount of credit flow through the primary agricultural cooperative credit societies
on per hectare of gross cropped area.
1 This has been prepared as a background paper for the study on ‘Suicide of Farmers in Maharashtra’ being conducted by the Indira Gandhi Institute of Development Research (IGIDR), Mumbai for the Government of Maharashtra. Critical comments and suggestions from two anonymous referees on an earlier version were helpful. 2 The author researches and teaches at Gokhale Institute of Politics and Economics, Pune 411 004. He can be reached at [email protected].
45
Shah, Rural Credit Delivery
1. Context
Commercialization of agriculture coupled with increasing requirement of credit have put a lot
of onus on various agricultural financial institutions to play a pivotal role in meeting the
increasing capital needs of the farmers and in ensuring timely supply of various inputs
besides providing other service facilities. The diversification of agriculture over the years has
further accentuated the need for the rapid development of rural infrastructure and larger flow
of credit to farming community (Shivamaggi, 2000). In view of increasing requirement of
rural credit and sustainability of rural financial institutions (RFIs) operating in India in the era
of financial sector reforms, the entire decade of 1990s was full of discussion on the positive
and negative impacts of these reforms and their implications for the agricultural sector. In the
era of financial sector reforms, sustainability, viability and operational efficiency of RFIs are
the major issues that need to be taken cognizance of in ensuring effective rural credit delivery
system. However, the major problems plaguing the efficiency of rural credit delivery system
are the mounting overdue3 and Non Performing Assets (NPAs)4 of RFIs. The overdue
problem of different entities of rural credit delivery structure is reported to be an all-pervasive
phenomenon that cuts across these different agencies (Puhazhendi and Jayaraman, 1999).
Among various states of India, the RFIs of Maharashtra are reported to show the highest
amount of overdues and outstanding loans over the past one decade (Gulati and Bathla,
2002). Even the proportion of overdues to outstanding loan of RFIs is substantially high in
this state. According to Gulati and Bathla (2002), the proportion of overdue to outstanding
loans of RFIs was more than 30 per cent in Maharashtra during 1997. The other states that
fall in the category of above 30 per cent overdue as proportion of loans outstanding of their
RFIs are Assam, Bihar, Jammu and Kashmir, Madhya Pradesh, Orissa and Tripura.
Among various states, Cooperative Banks operating in Maharashtra have shown highest
amount of NPAs. The share of Maharashtra in total NPAs of State Cooperative Banks (SCBs)
at all-India level was estimated at as much as 31.76 per cent in 2002, which increased to
37.81 per cent in 2003 and further to 43.16 per cent in 2004 (Table 1). On the other hand, the
3 Poor recovery of loans results in overdues. Overdues are defined as loans and interest thereon not repaid on due dates. The financial health of banking business heavily depends on recovery of loans. Of the total amount of loan due at different points of time, some of it is recoverable and some irrecoverable and the latter often turns into bad debt or defaults (Gulati and Bathla, 2002). 4 As per M. Narasimham (RBI 1991) Committee, the non-performing assets (NPAs) are those loan advances, which are marked with non-payment of interest or repayment of principal or both for a period of two quarters or more during the year ending. An amount is considered as ‘post due’ if it is unpaid for 30 days beyond due date. The NPAs are broadly classified as sub-standard, doubtful and loss assets.
46

Suicide of Farmers in Maharashtra: Background Paper
proportion of NPAs to loans outstanding of SCB in Maharashtra stood at much higher than
the national average of the same, whereas recovery with respect to SCB in Maharashtra was
perceptibly lower than the national average during the early 2000. These are certainly
disquieting features insofar as working of cooperative banks in Maharashtra is concerned.
Table 1 State-wise Performance of SCBs (As on 31 March)
Profit/Loss (+)/(-) Total NPAs NPAs as % to Loans
Outstanding Recovery (%) As at end June State
2001-02 2002-03 2003-04 2002 2003 2004 2002 2003 2004 2002 2003 2004 Andman & Nicobar 1.24 1.39 1.74 10.15 11.72 16.32 23.84 22.70 25.96 77.95 66.62 87.87Andhra Pradesh 2.35 3.00 4.16 1140.71 1668.52 1374.84 24.67 36.81 30.67 65.40 45.96 73.82Arunachal Pradesh 0.86 -0.51 -3.43 40.84 40.84 73.34 73.73 73.73 71.98 20.17 19.32 29.82Assam 10.57 -22.87 -13.99 150.17 182.96 199.00 61.35 67.97 67.49 19.88 24.69 31.54Bihar 1.14 1.26 114.02 221.88 365.37 254.55 41.85 67.65 51.95 12.00 20.20 51.49Chandigarh 1.49 2.34 1.60 2.85 3.79 3.88 31.91 37.10 37.18 62.32 61.95 58.08Chattisgarh -4.95 0.90 4.45 14.03 13.96 25.89 14.51 8.64 27.31 95.98 87.32 78.95Delhi 14.30 16.16 12.95 29.34 28.44 29.09 25.09 19.14 17.70 35.52 74.70 52.31Goa 1.04 0.21 5.16 82.99 91.13 79.65 25.22 28.26 24.76 59.58 65.73 65.94Gujarat 3.76 4.19 4.81 83.91 127.29 125.75 4.59 5.89 6.45 90.52 91.29 85.60Haryana 36.03 39.67 29.29 13.54 13.54 10.83 0.83 0.74 0.59 99.60 99.50 99.63H. P. 31.57 17.64 19.89 53.84 66.81 69.86 14.41 15.96 11.22 70.68 68.88 71.93J & K 1.06 1.22 4.58 14.10 13.68 15.41 25.16 21.76 23.50 33.62 43.04 38.22Karnataka 20.20 10.55 2.78 99.58 173.15 207.44 6.60 10.37 11.99 90.03 85.60 85.50Kerala 0.71 6.12 5.05 78.18 92.61 92.61 6.38 7.49 8.29 92.70 94.50 94.50M.P. -72.57 1.59 1.84 150.80 150.84 195.66 9.53 9.62 11.56 93.40 93.76 91.62Maharashtra 10.68 271.91 31.93 1404.28 2371.87 2733.22 16.09 26.63 32.41 69.60 68.66 68.59Manipur -3.05 -0.70 NA 14.84 13.62 13.62 94.50 65.66 65.66 4.25 8.91 8.91Meghalaya 2.95 2.99 0.70 19.63 20.02 22.36 22.01 22.36 24.14 35.90 38.97 31.10Mizoram -1.45 0.22 0.69 9.85 10.85 16.91 29.06 22.99 25.55 25.12 54.40 54.13Nagaland -2.25 -3.85 -1.77 14.82 21.65 21.40 43.20 57.38 55.42 18.60 27.27 27.27Orissa 7.50 10.37 13.47 148.15 167.60 155.39 16.20 16.61 14.14 84.41 78.01 82.93Pondicherry 1.46 1.77 1.96 8.42 8.17 8.17 11.32 8.55 8.55 69.46 78.21 78.21Punjab 19.24 21.01 31.35 59.79 61.16 60.56 3.41 2.81 2.68 96.22 95.38 96.13Rajasthan 13.07 15.04 17.55 83.25 37.85 26.98 8.40 3.40 2.20 88.01 95.46 83.37Sikkim 1.09 0.24 0.70 0.06 0.13 0.54 3.45 1.87 7.23 43.30 76.06 76.06Tamil Nadu 50.74 15.75 19.41 13.29 14.46 14.46 0.69 0.75 0.75 99.47 97.36 97.36Tripura -2.85 -1.84 -1.02 37.85 40.40 52.35 37.14 35.69 43.19 28.95 35.44 44.87Uttar Pradesh 17.07 27.28 27.36 355.57 393.97 344.27 12.95 14.70 12.29 74.87 70.55 71.81Uttranchal - - 0.04 - - - - - - - - -West Bengal 8.17 26.74 35.50 64.36 71.30 88.60 7.52 5.28 6.52 83.22 84.79 86.85All –India 171.17 469.79 372.77 4421.07 6277.66 6332.95 13.52 18.13 18.30 82.24 79.55 83.34Note: Rs. Crore Source: Compiled from ‘NABARD Annual Reports 2003-04 and 2004-05’, NABARD, Mumbai.
In fact, one can observe several weaknesses relating to working of RFIs in Maharashtra. One
of the earlier studies conducted in cooperative sector of Maharashtra has clearly shown better
financial health for the institutions at the district level as compared to the primary or grass
root level (Shah, 2001). It is not the cooperatives alone but there are several rural financial
institutions that are beset with similar plethora of deficiencies that impede their efficient
functioning. This necessitates a relook at the performance of various agricultural financial
institutions operating in Maharashtra, particularly over the past two decades, with a view to
47

Shah, Rural Credit Delivery
recommending, designing and framing appropriate policies to rejuvenate the existing rural
credit delivery in this state.
In view of growing NPAs and other deficiencies in the functioning of RFIs operating in the
state of Maharashtra, the major focus of this paper is on reviewing the entire rural credit
scenario of the state with an emphasis on credit flow through cooperatives, commercial
banks, regional rural banks (RRBs) and land development banks (LDBs), and also on
linkages of bank credit with various self-help groups (SHGs) operating in the state. Though
the focus of the paper is on the working of various RFIs operating in the state, a detailed
analysis is performed with respect to cooperatives.
2. Rural Credit Scenario of Maharashtra
The rural credit scenario of Maharashtra encompassed several aspects with major foci of
attention on annual credit plans prepared for various sectors by the State Level Bankers’
Committee (SLBC), potential linked credit plans for various regions of the state, progress of
various rural financial institutions overtime, distributional aspect of credit, micro-finance or
linkage of bank credit with various self-help groups, etc. Majority of these aspects are
evaluated in this paper with a focus on credit cooperatives, commercial banks, regional rural
banks (RRBs), land development banks (LDBs), and micro credit innovations.
3. Annual Credit Plan Under Lead Bank
The State Level Bankers’ Committee (SLBC) generally prepares Annual Credit Plan (ACP)
for each district with a view to achieve overall development of various sectors and regions of
the state.5 However, before formulating district level credit plans, block level credit plans are
prepared taking into account the village surveys conducted by each of the bank branches,
especially with respect to cropping pattern of the area, exploitable potential and demand for
credit for various activities. The purpose of this exercise is to achieve a balanced growth of 5 The SLBC is a recognized forum and it not only coordinates the activities of Bankers, NABARD, various departments of the state Government, development agencies, NGOs, etc. but also ensures effective implementation of various schemes relating to flow of credit for poverty alleviation programmes, besides helping to achieve the targets envisaged in the ACP. The members of this forum have a unique system of evaluating their own performance. The activities of the convener of SLBC not only encompass collection of meaningful performance related data but also facilitation of meaningful discussion on important issues and arriving at a consensus for effective implementation of various development programmes, besides ensuring flow of credit, in general, to different sub-sectors of the economy. The forum regularly meets and interacts with a view to ensure effective discharge of their respective role in terms of achieving the objectives envisaged in the State Credit Plan. This also helps in ensuring timely credit flows towards various programme aimed at employment generation.
48
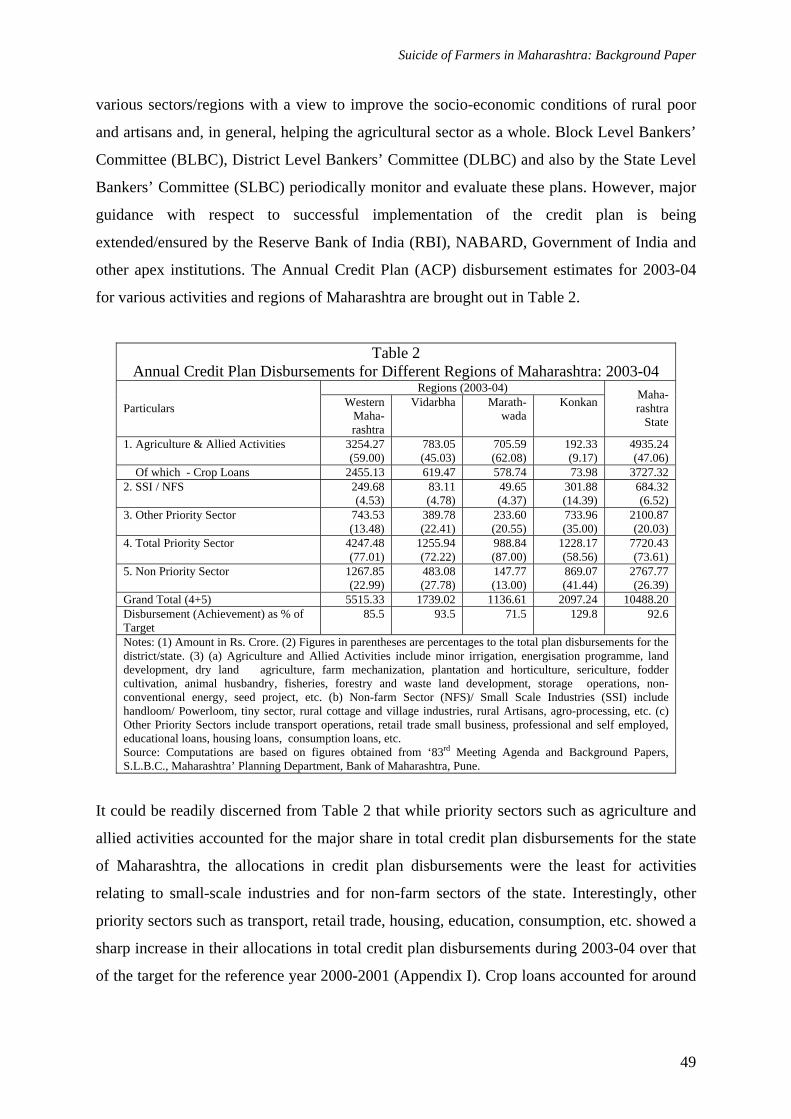
Suicide of Farmers in Maharashtra: Background Paper
various sectors/regions with a view to improve the socio-economic conditions of rural poor
and artisans and, in general, helping the agricultural sector as a whole. Block Level Bankers’
Committee (BLBC), District Level Bankers’ Committee (DLBC) and also by the State Level
Bankers’ Committee (SLBC) periodically monitor and evaluate these plans. However, major
guidance with respect to successful implementation of the credit plan is being
extended/ensured by the Reserve Bank of India (RBI), NABARD, Government of India and
other apex institutions. The Annual Credit Plan (ACP) disbursement estimates for 2003-04
for various activities and regions of Maharashtra are brought out in Table 2.
Table 2 Annual Credit Plan Disbursements for Different Regions of Maharashtra: 2003-04
Regions (2003-04)
Particulars Western Maha-rashtra
Vidarbha Marath-wada
Konkan Maha-rashtra
State
1. Agriculture & Allied Activities 3254.27 (59.00)
783.05 (45.03)
705.59 (62.08)
192.33 (9.17)
4935.24 (47.06)
Of which - Crop Loans 2455.13 619.47 578.74 73.98 3727.32 2. SSI / NFS 249.68
(4.53) 83.11 (4.78)
49.65 (4.37)
301.88 (14.39)
684.32 (6.52)
3. Other Priority Sector 743.53 (13.48)
389.78 (22.41)
233.60 (20.55)
733.96 (35.00)
2100.87 (20.03)
4. Total Priority Sector 4247.48 (77.01)
1255.94 (72.22)
988.84 (87.00)
1228.17 (58.56)
7720.43 (73.61)
5. Non Priority Sector 1267.85 (22.99)
483.08 (27.78)
147.77 (13.00)
869.07 (41.44)
2767.77 (26.39)
Grand Total (4+5) 5515.33 1739.02 1136.61 2097.24 10488.20 Disbursement (Achievement) as % of Target
85.5 93.5 71.5 129.8 92.6
Notes: (1) Amount in Rs. Crore. (2) Figures in parentheses are percentages to the total plan disbursements for the district/state. (3) (a) Agriculture and Allied Activities include minor irrigation, energisation programme, land development, dry land agriculture, farm mechanization, plantation and horticulture, sericulture, fodder cultivation, animal husbandry, fisheries, forestry and waste land development, storage operations, non-conventional energy, seed project, etc. (b) Non-farm Sector (NFS)/ Small Scale Industries (SSI) include handloom/ Powerloom, tiny sector, rural cottage and village industries, rural Artisans, agro-processing, etc. (c) Other Priority Sectors include transport operations, retail trade small business, professional and self employed, educational loans, housing loans, consumption loans, etc. Source: Computations are based on figures obtained from ‘83rd Meeting Agenda and Background Papers, S.L.B.C., Maharashtra’ Planning Department, Bank of Maharashtra, Pune.
It could be readily discerned from Table 2 that while priority sectors such as agriculture and
allied activities accounted for the major share in total credit plan disbursements for the state
of Maharashtra, the allocations in credit plan disbursements were the least for activities
relating to small-scale industries and for non-farm sectors of the state. Interestingly, other
priority sectors such as transport, retail trade, housing, education, consumption, etc. showed a
sharp increase in their allocations in total credit plan disbursements during 2003-04 over that
of the target for the reference year 2000-2001 (Appendix I). Crop loans accounted for around
49

Shah, Rural Credit Delivery
two-thirds share in total credit plan disbursements for agriculture and allied activities during
2003-04.
Among various regions, Western Maharashtra showed the highest share (52.59 per cent) in
total credit plan disbursements of the state during 2003-04, followed by Konkan (20.00 per
cent), Vidarbha (16.58 per cent), and Marathwada (10.83 per cent) regions. Nonetheless,
during this year, the share of priority sector in total credit plan outlay was relatively higher
for Marathwada region as compared to other regions.
It is to be further noted that, in the case of Konkan region, while agriculture and allied
activities accounted for only 9 per cent share in total credit plan disbursement during 2003-
04, the share of non-priority sectors in total credit plan disbursement was as high as 41 per
cent during the same year. Nonetheless, in the case of this region too, priority sectors
accounted for the highest share (59 per cent) in total credit plan disbursement, which was
mainly due to relatively higher share in credit plan disbursement for other priority sectors. In
general, except for Konkan region, all other regions of Maharashtra showed higher
allocations for agriculture and allied activities. Such increased allocations in plan
disbursements is a reflection of the importance of agriculture in Government’ overall policy
encompassing priority sector. Further, it is to be noted that in Maharashtra the disbursements
of credit as against targets have fluctuated considerably over time. For instance, while the
disbursement of credit was above the targets during the period between 1999-2000 and 2001-
02, this disbursement of credit stood well below 100 per cent between 2002-03 and 2003-04
(Table 3).
Table 3 Performance of ACP in Maharashtra: 1999-2000 to 2003-04
Year Target Achievement % Achievement to Target
1999-2000 6930.92 7058.92 101.85 2000-2001 8008.96 8268.09 103.00 2001-2002 9614.54 11027.18 114.69 2002-2003 10902.04 8827.79 80.97 2003-2004 11308.36 10488.20 92.60
Note: Amount in Rs. Crore. Source: Figures are obtained from ‘83rd Meeting Agenda and Background Papers, S.L.B.C., Maharashtra’ Planning, Department, Bank of Maharashtra, Pune.
50

Suicide of Farmers in Maharashtra: Background Paper
As a matter of fact, based on the human and natural endowments, NABARD has been
preparing Potential Linked Credit Plans6 (PLCP) by estimating resource requirement for
exploitation of potential for various agriculture and rural development activities. These
estimates are furnished to banks/S.L.B.C. through background paper. On the basis of these
estimates, banks have been preparing Service Area Credit Plans (SAP) or ACP for meeting
credit needs of agriculture and development of rural sector.
4. PLCP Performance
The estimates relating to potential linked credit plan (PLCP) projections, Service Area Plan
(SAP) targets and Ground Level Credit (GLC)/SAP achievements from 2001-02 to 2004-05
encompassing various sectors/activities and regions of Maharashtra are provided in Table 4.
Among Various regions, Western Maharashtra turns out to be the most important region since
this region not only attracts the major PLCP projections but also SAP targets/achievements of
the state. Further, though, in general, there has been nearly 30 per cent rise in SAP targets of
all the regions of Maharashtra during the period between 2001-02 and 2004-05, the rates of
increases in these targets are relatively faster for Konkan region (62.80 per cent), followed by
Vidarbha (40.64 per cent) and Western Maharashtra (37.93 per cent) regions with
Marathwada region recoding a decline (2.70 per cent) in this SAP target during the same
period. Interestingly, Vidarbha region in particular has recorded lower proportion of
achievements as against SAP targets during the given period. The PLCP projections are
available for 21 diversified activities with activities relating crop loans, non-farm sector,
other priority sector, minor irrigation and farm mechanization put together
Notably, diversification of agriculture over the years has accentuated the need for rapid
development of rural infrastructure and a larger flow of credit. Various credit cooperatives,
commercial banks and RRBs are by far the major financial institutions engaged in meeting
the capital requirements for diversified activities and developing the rural sector of the state.
Besides, LDBs are also playing a crucial role in meeting the increasing capital needs of the
6 PLCP is a comprehensive document of the potentials of economic activities in the district concerned. The exercise is based on the economic data relating to resource endowments, ongoing government schemes and the involvement of banks in the identified activities. Besides, the infrastructure available and requirement for the exploitation of potential are also assessed to make it a comprehensive document. NABARD had prepared Base PLCPs for five-year period coterminous with Eighth (1990-95), Ninth (1996-2001) and Tenth (2002-07) Five Year Plan periods for all the districts in the country. These used to be updated annually to bring out the required modifications in tune with the changing priorities and infrastructure.
51

Shah, Rural Credit Delivery
farmers of this state. Although there has been multi-agency set-up for rural banking, the
major institutional finance to farming community in Maharashtra comes from commercial
banks and credit cooperatives.
Table 4 Potential Linked Credit Plan (PLCP) Estimates of Exploitable Potential for Different
Regions of Maharashtra Year Regions
Western Maharashtra
Vidarbha Marathwada Konkan Maharashtra State
2001-02 - PLCP Projections 5364.90
(50.16) 1987.65 (18.58)
2332.37 (21.81)
1010.51 (9.45)
10695.44
- SAP Target 4124.29 (53.69)
1253.53 (16.32)
1635.88 (21.30)
667.49 (8.69) 7681.19
- SAP Achievement 4018.91 (60.54)
911.84 (13.74)
1175.86 (17.72)
531.30 (8.00) 6637.91
- % Achievement 97.44 72.74 71.88 79.60 86.42 2002-03 - PLCP Projections 7884.18
(51.06) 2471.49 (16.01)
2809.60 (18.20)
2274.53 (14.73)
15439.80
- SAP Target 4679.43 (53.85)
1429.24 (16.45)
1805.18 (20.77)
775.75 (8.93) 8689.60
- SAP Achievement 4677.81 (54.63)
1320.25 (15.42)
1674.36 (19.55)
890.25 (10.40)
8562.67
- % Achievement 99.97 92.37 92.75 114.76 98.54 2003-04 - PLCP Projections 15919.47
(71.84) 2457.10 (11.09)
2656.93 (11.99)
1126.54 (5.08)
22160.04
- SAP Target 5027.97 (52.69)
1991.07 (20.87)
1588.65 (16.65)
934.51 (9.79) 9542.20
- SAP Achievement 4578.82 (54.54)
1774.66 (21.14)
1115.54 (13.29)
925.62 (11.03)
8394.64
- % Achievement 91.07 89.13 70.22 99.05 87.97 2004-05 - PLCP Projections 7121.36
(51.42) 2580.28 (18.63)
2837.52 (20.49)
1309.34 (9.46)
13848.50
- SAP Target 5688.44 (56.16)
1762.94 (17.40)
1591.66 (15.71)
1086.68 (10.73)
10129.72
- SAP Achievement - - - - Notes: (1) Amount in Rs. Crore. (2) Figures in parentheses are percentages to the total potential linked credit plan for the state. (3) The activities for which the PLCP estimates are available include: Minor Irrgation and Energisation (MI), Land Development (LD), Dry Land Farming (DLF), Farm Mechanization (FM), Plantation & Horticulture (P&H), Sericulture (SERI), Animal Husbandry-Dairy (AH-D), Animal Husbandry-Poultry (AH-P), Animal Husbandry-Sheep, Goat and Poultry (AH-SGP), Inland Fishery (FISH-INL), Brakish Water Prawn (BRAKISH), Marine Fishery (FISH-MAR), Forestry/Waste Land Development (FORWL), Storage Godowns-Market Yard (SGMY), Non-Conventional Energy (NCES), Non-Farm Sector (NFS), Other Priority Sectors (OPRSEC), Crop: Crop Loan, Working Capital (WC), Self Help Groups (SHGs). Source: Compiled from ‘State Focus Paper Maharashtra, 2005-06’, NABARD, Pune.
5. Credit Delivery through Cooperatives
Short and medium term set-ups constitute the credit cooperative structure in Maharashtra. A
3-tier system is central to the structure of both the short term and the medium term credit
cooperatives. This 3-tire system consists of a Co-operative apex bank at the state level,
Central Co-operative banks at the district level and of Primary Agricultural Co-operative
52

Suicide of Farmers in Maharashtra: Background Paper
Credit Societies (PACS) at the village level. The three-tier set-up is not only meeting the
credit requirements of the farmers for seasonal agricultural operations (crop loans) but also
investing on farm assets that do not entail huge capital outlay. Although there has been
substantial increase in the membership of credit cooperatives in the state of Maharashtra, the
trend over the last two decades in terms of cooperative finances is not very encouraging in
this state, especially in more recent times.
The trend over the past two decades show a slower growth in institutional finance through
credit cooperatives during the decade of economic reforms (1991-2000) as against the decade
preceding it (1980-1990). Not only this, the reform period is also marked with a slower
growth in membership of credit cooperatives in Maharashtra (Table 5). On the other hand, the
outstanding loans of these cooperatives have grown at much faster rate as compared to their
loan advances during both pre-and post economic reform periods, though post economic
reform period showing slowing down in this outstanding loans.
Table 5 Cooperative Bank Finances in Maharashtra; 1980-2000
Cooperative Banks No. of Coop. Inst./Soc. No. of Members (‘000’) Loan Advances Outstanding Loans
Period
Ape
x
PAC
S
Tota
l
Ape
x
PAC
S
Tota
l
Ape
x
PAC
S
Tota
l
Ape
x
PAC
S
Tota
l
TE 1982/83 31 18565 18596 1109 5595 6704 3318 288 3606 1507 431 1938 TE 1990/91 34 19694 19728 1523 7910 9433 9298 929 10227 4811 1521 6332 TE 1999/00 34 20378 20412 1340 10432 11772 22195 2280 24475 15274 3456 18730 CGR (%) - 1980-90 - 1991-00 - 1980-00
1.33
- 0.37
-0.03NS
0.48 0.65
-0.03NS
0.48 0.65
1.01NS
-1.91 1.65
4.90 3.48 3.35
4.33 2.72 3.15
14.47NS
7.12 8.64
13.64
9.36 12.93
14.08NS
9.74 10.76
23.97NS
13.52 14.57
12.59
9.07 12.92
18.50 12.98 14.64
Notes: (1) Amount in Crores Rupees. (2) CGR = Compound Growth Rates. (3) All growth rates significant at 1 per cent level of probability. (4) NS: Growth rates not significant at 1 per cent level of probability. (5) Apex institutions include SCBs and DCCBs Source: Computations are based on figures obtained from various issues of ‘Economic Survey of Maharashtra’
One of the reasons for such a slow down could be the prudential discipline extended to
cooperatives and a large number of banks’ inability to meet section 11 of Banking Regulation
Act, 1949. This had restricted the loaning business of co-operatives to a large extent as their
capital base had eroded. It is to be noted that though growth in cooperative lending during
1980-90 was quantitatively higher, the quality of lending of cooperatives improved
substantially only during the second period. As a result of this cautious step taken by banks,
the growth in cooperative lending was slower during the period between 1991 and 2000.
53

Shah, Rural Credit Delivery
Another interesting feature of credit cooperatives, particularly of PACS in Maharashtra, is the
increasing trend in their share of medium and long term (MT <) advances and decline in
their share of short term (ST) advances (Table 6).
Table 6 Progress of PACS According to Type of Loan Advances, Recover and Outstanding Loans in
Maharashtra Loan Advances Recovery Outstanding Loan
Period ST MT LT Total ST MT LT Total ST MT LT Total
TE 1985
280 (81.79)
59 (17.35)
3 (0.86)
342 255 (87.75)
34 (11.85)
1 (0.40)
290 381 (72.23)
140 (26.53)
7 (1.24)
528
TE 1990
594 (72.67)
185 (22.63)
38 (4.71)
817 485 (77.85)
114 (18.32)
24 (3.83)
623 739 (61.97)
388 (32.58)
65 (5.45)
1192
TE 1995
790 (80.51)
162 (16.55)
29 (2.94)
981 656 (82.51)
124 (15.64)
15 (1.85)
795 1074 (59.18)
631 (34.76)
110 (6.06)
1815
TE 2000
1902 (76.05)
543 (21.69)
57 (2.26)
2502 1567 (81.37)
325 (16.90)
33 (1.73)
1925 2122 (60.09)
1219 (34.52)
190 (5.39)
3531
Notes: (1) Amount in Crores Rupees, (2) Figures in parentheses are percentages to the total, (3) TE: Triennium Ending; ST: Short Term; MT: Medium Term; LT: Long Term Source: Computations are based on figures obtained from various issues of ‘Co-operative Movement at a Glance in Maharashtra, Office of the Commissioner for Co-operation & Registrar of Co-operative Societies, Maharashtra State, Pune
The trends in recovery and outstanding loans of PACS in Maharashtra are also similar to their
loan advances, i.e., a declining share in short term recovery and outstanding loans in the face
of an increasing trend in their share of MT and LT recovery and outstanding loans during the
period between TE 1985 and TE 2000. This is a pointer to the fact that in more recent times
MT and LT loans have become the major foci of farm finance. Notably, while the main
business of PACS in Maharashtra is crop loans, very few among them also extend MT and
LT credit. The increase in MT and LT credit during the period between TE 1985 and TE
2000 could be due to conversion of ST loans or rescheduling, particularly during years of
climatic adversities. The increase in MT and LT loans through cooperatives is, therefore, an
indication of diversification of cooperative business, which may be an effort made by them to
reduce duplication of co-operative finances and to reduce the transaction cost. Nonetheless,
the PACS in Maharashtra are beset with several deficiencies in their functioning. The
deficiencies are noticed in respect of their law operational efficiency, high incidence of
overdue, low level of recovery, distributional aspect of ST and MT loans, coverage of SC/ST
members, etc. (Shah, 2000).
Among various deficiencies, the most important drawback of PACS in Maharashtra is the
coverage of their SC/ST members. The trend over the last two decades show a decline in the
proportion of SC/ST members to the total membership of PACS in Maharashtra after the
54

Suicide of Farmers in Maharashtra: Background Paper
early nineties period (Table 7). Similarly, the percentage of SC/ST in total borrowing
members of PACS also declined steadily over time. Not only this, the loan share of SC/ST in
total loan advancement also showed a continuously declining trend. The scenario obtaining in
respect of share of SC/ST in total loan recovery, outstanding loan and in loans overdue also
witnessed a declining trend. The message is loud and clear: The PACS generally did not pay
enough attention to their SC/ST members, as evident from the coverage of SC/ST members
and the recovery pattern of loans advanced to them, particularly during the period between
the early- and the late nineties. The imperative need of the hour is, therefore, to initiate
measures to increase the ST/ST membership of various PACS in the state of Maharashtra
with reasonably higher loan advances to them unlike other categories of farmers.
Table 7 Structural Changes in Coverage of Scheduled Casts/Scheduled Tribes by PACS in
Maharashtra: (1981 – 2000) Triennium Average % Change
Period Particulars 1 2 3
2 Over 1
3 Over 2
3 Over 1
1. Total Number of Societies 18383 19626 20349 6.77 3.68 10.70 2. Total Members 5570 7782 9594 39.71 23.29 72.25 - of which SC/ST 1148 1379 1495 20.09 8.41 30.19 - Percentage of SC/ST in total members 20.61 17.72 15.58 3. Total Borrowing Members 1520 1885 2561 23.99 35.89 68.49 - of which SC/ST 239 289 323 21.09 11.65 35.20 - Percentage of SC/ST in total borrowing members
15.72 15.33 12.61
4. Total members with outstanding loan 2764 3471 4089 25.58 17.79 47.92 - of which SC/ST 535 277 598 -48.22 116.00 11.84
- Percentage of SC/ST in total members with outstanding loan
19.36 7.98 14.62
5. Total Loans Advanced 28832 72375 250126 151.02 245.60 767.53 - of which SC/ST 1710 3335 11336 95.02 239.89 562.81 - Percentage of SC/ST in total loans advanced 5.93 4.61 4.53 6. Total Loans Recovered 24419 66135 192549 170.84 191.15 688.53 - of which SC/ST 1419 3586 7549 9152.63 110.53 431.87 - Percentage of SC/ST in total loans recovered 5.81 5.42 3.92 7. Total Loans Outstanding 43062 116202 353151 169.85 203.91 720.10 - of which SC/ST 3157 7012 15610 122.13 122.62 394.52 - Percentage of SC/ST in total loans outstanding 7.33 6.03 4.42 8. Total Loans Overdue 17490 57432 131255 228.37 128.54 650.44
- of which SC/ST 1683 3350 8922 99.01 166.32 430.00 - Percentage of SC/ST in total loans overdue 9.62 5.83 6.80 Note: (1) Amount in lakh rupees; Members in ‘000’. (2) Period 1=1981-1983; Period 2=1991-1993; Period 3=1998-2000.
Further, among various types of loans extended by PACS, short crop loan is by far the most
important one as farmers’ crop activity largely depends on it.7 Structural changes in crop loan
7 Short-term crop loans are provided to the farmers for the purchase of various inputs like seeds, fertilizers, pesticides, etc., and also for meeting expenses of labour, irrigation, etc. These loans are extended on the basis of acreage and cost of cultivation of the crops grown, subject to the repayment capacity of the farmers.
55

Shah, Rural Credit Delivery
issued by PACS at the aggregate level and also on per borrowing member basis over the
period between early eighties and the late nineties are brought out in Table 8.
It could be noticed from Table 8 that commercial crops, viz., sugarcane and cotton and the
important staple food crops like paddy and millets accounted for about 80 per cent share in
total crop loan advances of PACS all through the period between early eighties and the late
nineties with other field crops like wheat, pulses, oilseeds, etc. accounting for the remaining
20 per cent share in crop loan advances of PACS during this period. Further, although crops
like pulses, cotton, oilseed, and other field crops showed 6-10 folds rise in their loan
advances during the period between early eighties and the late nineties, this increase was not
very significant when measured on per borrowing member basis. For instance, while per
member borrowing for sugarcane, oilseed, pulses and other field crops rose by more than five
folds during the period between early eighties and the late nineties, this increase was hardly
two folds for wheat, paddy and millets during this period.
Table 8 Structural Changes in Crop Loan (ST) Advances of PACS in Maharashtra: (1981 – 2000)
Triennium Average % Change Share (%) Period Period Crop
1 2 3 2 Over 1 3 Over 2 3 Over 1 1 2 3 1. Paddy 1629 (107) 3282 (174) 7571 (296) 101.49 130.67 364.78 6.12 4.79 3.99 2. Wheat 620 (41) 1258 (67) 2433 (95) 102.96 93.48 292.68 2.33 1.84 1.28 3. Millets 4548 (299) 12278
(651) 22100 (863)
169.99 79.99 385.96 17.11 17.91 11.66
4. Pulses 246 (16) 1016 (54) 2956 (115) 312.45 190.91 1099.87 0.93 1.48 1.56 5. Cotton 4861 (320) 11051
(586) 32679 (767)
127.35 195.72 572.32 18.28 16.12 17.24
6. Sugarcane 10582 (696)
27027 (1434)
83259 (3251)
155.41 208.06 686.80 39.80 39.43 43.92
7. Oilseeds 1557 (102) 4426 (235) 11995 (468)
184.35 170.99 670.56 5.86 6.46 6.33
8. All others 2546 (168) 8199 (435) 26598 (1039)
221.99 224.41 944.57 9.57 11.96 14.03
Total 26588 (1749)
68537 (3636)
189591(7403)
157.77 176.62 613.06
Note: (1) Amount in lakh rupees, (2) Figures in parentheses are the amount of loan issued per borrowing members in rupees, (3) Period 1 = 1981 – 1983; Period 2 = 1991 – 1993; Period 3 = 1998 – 2000
One of the obvious reasons for higher per member borrowing for sugarcane, oilseeds, pulses
and other crops as against wheat, paddy and millets can be traced in cropping pattern and
changes in crop composition over time and the scale of finance for a particular crop. The
crops like sugarcane absorb larger proportion of the purchased inputs like seeds, fertilizers,
irrigation, etc. whose prices have increased over time, whereas millets account for relatively
lower cost of cultivation and hence show lower scale of finance.
56

Suicide of Farmers in Maharashtra: Background Paper
Several crops like wheat, millets, pulses and oilseeds, however, showed slowing down in
absolute loan advances during the second half as against the former half of the overall period.
On the other hand, paddy, cotton, sugarcane, and other field crops showed major increase in
their loan advances during the latter half as against the former half of the overall period.
Further, although cotton crop showed significant increase in loan advances, this increase was
hardly two folds on per member basis.
The slowing down in per borrowing member loan advances for cotton crop was more
significantly pronounced after the early nineties period. This is certainly a disturbing feature
in the light of the fact that Maharashtra accounts for the bulk of the nation’s total production
and acreage under cotton crop. A slowing down or decline in share of this crop in total crop
loan advances of PACS might certainly affect the cultivation of this crop in the state of
Maharashtra.
Although PACS extend loan for varied purposes, short-term crop loans account for the major
share in total loan advanced by them. These loans have direct bearing on crop production
and they are extended on the basis of acreage and cost of cultivation of the crops grown,
subject to the repayment capacity of the farmers. It is, therefore, essential to evaluate the
distribution pattern not only of crop loans but also total loan advanced by PACS across
various districts and regions of Maharashtra. Since distribution of loan is generally correlated
with gross cropped area (GCA), it has been evaluated on the basis of per hectare GCA.
Estimates relating to distribution of total as well as crop loan on the basis of per hectare GCA
encompassing the period between 1980-81 and 2002-03 for different districts and regions of
Maharashtra are provided in Table 9.
The estimates presented in Table 9 showed wide variation in the pattern of loan advances by
PACS across districts and regions of Maharashtra. While Western Maharashtra and
Marathwada regions of Maharashtra showed significantly high amount of total as well as
crop loans extended by PACS, the other regions like Vidarbha and Konkan were marked with
lower amount of loans in this respect. The Western Maharashtra and Marathwada regions
also showed higher growth in terms of loan advances by PACS on per hectare GCA basis
during the entire period between 1980-81 and 2002-03. Further, though Vidarbha and
Konkan regions also showed higher growth in loan advances through PACS during the
57

Shah, Rural Credit Delivery
reform period, this substantial increase could not offset the trend obtainable during the entire
period, as the growth in the same was very low during the pre-reform period.
Table 9 Flow of Credit Through PACS in Maharashtra: 1980/81-2002/03 Total Loan Per Hectare Gross Cropped Area Crop Loan Per Hectare Gross Cropped Area
CGR (%) CGR (%) Region/ District TE 1982-
83
TE 1992-
93
TE 2002-
03
1980/81- 1990/91
1991/92 - 2002/03
1980/81-2002/03
TE 1982-
83
TE 1992-93
TE 2002-
03
1980/81- 1990/91
1991/92 - 2002/03
1980/81-2002/03
Western Region Kolhapur 766.37 1508.68 3278.83 8.60 * 7.77 * 8.52 * 716.45 1185.27 2210.43 7.07 * 5.37 6.93 *
Solapur 97.16 354.65 3086.30 20.87 * 26.57 * 18.69 * 87.97 295.06 2506.17 18.41* 26.18 * 18.12 *
Sangli 246.32 592.69 5393.26 9.71 * 23.18 * 16.28 * 218.21 415.20 2968.57 7.66 * 20.08 * 13.99 *
Satara 159.14 536.90 1386.59 15.17 * 8.87 * 12.43 * 132.13 459.61 1342.59 15.52 * 10.01 * 13.46 *
Pune 126.70 419.33 1925.09 14.21 * 16.31 * 14.96 * 108.95 282.09 1050.68 10.68 * 13.10 * 12.67 *
Ahmednagar
235.49 531.76 725.63 12.84 * 1.86 6.12 * 189.41 336.37 452.30 9.65 * 2.30 5.51 *
Nasik 251.61 684.76 410.25 14.42 * -3.25 1.61 223.67 504.23 299.60 11.25 * -3.17 0.88 Dhule 148.92 242.93 362.30 12.91 * 3.53 4.07 * 133.84 204.72 233.81 10.74 * 1.70 2.39 *
Jalgaon 252.26 502.96 1926.13 14.29 * 16.34 * 9.98 * 230.14 407.95 1771.76 12.62 * 17.31 * 10.48 *
Total 218.64 539.93 1903.78 13.30 * 13.58 * 11.26 * 192.81 403.91 1350.95 11.00 * 12.85 * 10.47 *
Vidharba Region Yavatmal 159.61 125.13 231.71 1.72 6.00* 2.35 101.20 98.01 231.27 1.38 8.47* 4.75 *
Chandrapur
63.48 95.69 611.49 5.86 19.94 * 11.64 * 50.45 73.83 501.52 6.34 * 20.05 * 11.59 *
Bhandara 66.20 176.79 535.79 12.09 * 12.79 * 10.71 * 52.75 90.99 273.52 5.64 * 13.18 * 10.04 *
Nagpur 66.04 298.61 938.43 14.04 * 14.87 * 13.62 * 59.11 188.00 794.55 12.60 * 18.03 * 13.64 *
Wardha 122.58 194.59 664.57 5.12 13.49 * 9.80 * 106.79 141.23 561.01 1.98 14.22 * 9.80 *
Amravati 131.56 129.10 400.53 3.26 12.94 * 8.16 * 78.68 89.21 286.32 4.34 * 11.03* 8.16 *
Akola 117.62 197.06 325.82 5.87 6.06* 5.74 * 96.56 125.55 280.92 2.22 7.56* 5.45 *
Buldhana 147.64 166.19 981.00 1.11 20.43 * 10.27 * 113.45 109.04 758.78 0.83 22.54 * 10.60 *
Gadchiroli 17.01 64.18 114.16 11.91 * 7.05* 10.72 * 8.93 31.99 82.05 10.81 * 10.51 * 11.86 *
Total 111.82 165.57 529.09 5.11 * 13.10 * 8.66 * 82.51 109.89 421.31 3.77 * 14.28 * 9.03 *
Marathwada Region Aurangabad
127.36 551.44 1608.29 17.41 * 10.77 * 13.26 * 114.06 411.22 1395.31 14.65 * 14.39 * 13.08 *
Jalna 137.32 292.13 489.54 12.14 * 3.89 6.65 * 105.40 295.55 453.00 11.52 * 2.53 * 7.91 *
Parbhani 266.57 483.54 1241.16 12.98 * 13.26 9.76 * 189.88 329.95 1187.58 13.63 * 15.15 * 11.43 *
Beed 149.59 336.23 863.66 14.49 * 13.54 * 9.81 * 66.40 243.86 718.93 17.66 * 14.16 * 11.50 *
Osmanabad
101.29 538.78 4304.31 21.40 * 25.80 * 20.40 * 110.24 355.02 3536.16 16.21 * 27.58 * 19.61 *
Nanded 119.80 304.31 1232.92 14.05 * 14.20 * 10.82 * 102.82 202.28 1133.88 11.85 * 16.80 * 11.94 *
Latur 42.62 260.89 1343.44 27.72 * 20.32 * 18.51 * 37.58 197.08 962.24 27.54 * 21.17 * 17.84 *
Total 126.29 383.21 1445.76 15.90 * 14.70 * 12.98 * 97.15 282.55 1216.90 15.48 * 15.99 * 13.58 *
Konkan Region Thane 37.04 50.49 416.42 3.78 26.24 * 11.63 * 32.46 38.25 338.55 1.51 25.85 * 11.23 *
Raigad 54.89 207.68 564.08 19.38 * 15.34 * 10.58 * 34.78 94.33 441.15 17.43 * 17.77 * 12.40 *
Ratnagiri 53.94 72.26 222.05 6.48 15.04 * 7.17 * 32.97 52.82 182.93 7.50 * 16.35 * 8.55 *
Sindhudurg
115.05 245.57 1565.73 13.56 * 26.84 * 10.57 * 78.77 185.48 1040.05 14.51 * 24.49 * 10.60 *
Total 57.51 119.69 601.53 12.02 * 22.45 * 10.50 * 39.79 75.79 443.94 10.90 * 22.27 * 11.09 *
Maharashtra State
128.57 327.84 1120.03 12.40 * 13.78 * 11.22 * 103.06 244.94 858.30 11.02 * 14.26 * 11.23 *
Note: (1) Amount in Rupees, (2) * - Represent significance of growth rates at 1 per cent level of probability. Source: Computations are based on figures obtained from ‘Socio-Economic Abstracts of different districts of Maharashtra (various years), Directorate of Economics and Statistics, Government of Maharashtra, Mumbai’ and ‘Agricultural Statistical Information, Maharashtra State, Part-II, Pune’.
In general, the total loan advances through PACS on the basis of per hectare GCA increased
from Rs.219 in TE 1982-83 to Rs.1904 in TE 2002-03 for Western region, Rs.112 in TE
1982-83 to Rs.529 in TE 2002-03 for Vidarbha region, Rs.126 in TE 1982-83 to Rs.1446 in
TE 2002-03 for Marathwada region and Rs.58 in TE 1982-83 to Rs.602 in TE 2002-03 for
58

Suicide of Farmers in Maharashtra: Background Paper
Konkan region with an overall increase in the same from Rs.129 in TE 1982-83 to Rs.1120 in
TE 2002-03 for the state as a whole. Interestingly, crop loans accounted for 70-80 per cent
share in total loan advances of PACS across different districts and regions during the entire
period between 1980-81 and 2002-03. Such a wide variation in total and crop loan advances
through PACS could be a matter of concern, particularly in view of the existing cropping
pattern and share of various crops in total loan advances of these primary level credit
institutions operating in various districts and regions of Maharashtra (Appendix II).
In order to estimate the effect of factors on total loan advances through PACS in
Maharashtra, regressions were estimated. Time series data on related parameters
encompassing the period between 1980-81 and 2002-03 was used in the estimation with
further division of the entire period into two sub-periods, viz., period between 1980-81 and
1990-91 and 1991-92 and 2002-03. Three alternative specifications (Linear, Semi-log and
Cobb-Douglus) were estimated. However, the results of only linear specification of the
equations are reported considering R2 and statistical significance of variable, which, in this
specification, turned out to be better.8 The results of this exercise are shown in Table 10.
The independent variables included in the model explained 60-80 per cent variations in total
loan advances through PACS across various regions of Maharashtra during the period
between 1980-81 and 2002-03. The variables showed mixed trend insofar as their influence
on loan advances through PACS was concerned. While the state of Maharashtra showed
significant increase in loan advances with the increase in GCA between 1991-92 and 2002-
03, the period prior to this was marked with slower but significant growth in the same with
the increase in GCA resulting in overall rise in loan advances with rise in GCA between
1980-81 and 2002-03.
Interestingly, membership showed negative influence on loan advances through PACS
between 1980-81 and 1990-91, though not significant, and positive influence between 1991-
92 and 2002-03, resulting in increase in loan advances through PACS with the rise in their
membership during the period between 1980-81 and 2002-03.
8 The following model was considered for this purpose: LOAN=f (MEMB, GCA) where, LOAN=total loan advances (ST+MT+LT) through PACS in ‘000’ rupees MEMB =total membership of PACS in absolute numbers GCA= total gross cropped area in ‘00’ hectares for the concerned district
59

Shah, Rural Credit Delivery
Table 10 Factors Influencing Total Loan Advances (ST+MT+LT) Through PACS in
Maharashtra Regions/State Regression Estimates
1980-81 to 1990-91 Western Maharashtra Region
LOAN = -18429386.5 + 2.6516 * MEMB + 180.2815 GCA (0.8086) (122.0476) Adjusted R2 = 0.8672 F-Statistics = 33.6471 Observations = 11
Vidarbha Region LOAN = -4015568.6 – 0.4228 MEMB + 95.6357 * GCA (0.4302) (25.0014) Adjusted R2 = 0.5758 F-Statistics = 7.7880 Observations = 11
Marathwada Region LOAN = -10911828.6 + 1.1793 MEMB + 223.1239 *** GCA (1.0009) (112.9571) Adjusted R2 = 0.8163 F-Statistics = 23.2247 Observations = 11
Konkan Region LOAN = -438114.3 + 1.1289 * MEMB – 1.4878 GCA (0.1928) (14.1340) Adjusted R2 = 0.9012 F-Statistics = 46.6108 Observations = 11
Maharashtra State LOAN = -67858844.2 – 0.6744 MEMB + 396.3346 ** GCA (1.8585) (183.4516) Adjusted R2 = 0.8600 F-Statistics = 31.7053 Observations = 11
1991-92 to 2002-03 Western Maharashtra Region
LOAN = -69451217.5 + 15.3698 * MEMB + 265.2638 GCA (5.1051) (353.0479) Adjusted R2 = 0.8716 F-Statistics = 38.3227 Observations = 12
Vidarbha Region LOAN = -22033420.8 – 0.9208 MEMB + 429.7242** GCA (3.2181) (184.9523) Adjusted R2 = 0.2568 F-Statistics = 2.9002 Observations = 12
Marathwada Region LOAN = -37516384.7 + 6.4491 MEMB + 567.0245 GCA (6.0670) (823.0293) Adjusted R2 = 0.3137 F-Statistics = 3.5140 Observations = 12
Konkan Region LOAN = 836789.2 + 1.8598 MEMB – 177.3890 *** GCA (1.3630) (97.5247) Adjusted R2 = 0.6103 F-Statistics = 9.6125 Observations = 12
Maharashtra State LOAN = -234776692.0 + 4.1448 MEMB + 1059.8159 GCA (10.9437) (908.9431) Adjusted R2 = 0.6806 F-Statistics = 12.7182 Observations = 12
1980-81 to 2002-03 Western Maharashtra Region
LOAN = -69725192.8 + 3.2512 * MEMB + 787.4909 * GCA (1.1540) (205.7397)
Adjusted R2 = 0.8495 F-Statistics = 63.0721 Observations = 23 Vidarbha Region LOAN = -13453113.6 + 1.0070 MEMB + 227.8714 * GCA
(1.1452) (83.9556) Adjusted R2 = 0.5608 F-Statistics = 15.0439 Observations = 23
Marathwada Region LOAN = -12633761.3 + 3.6269 *** MEMB + 186.3942 GCA (1.7579) (328.3011) Adjusted R2 = 0.6359 F-Statistics = 20.2121 Observations = 23
Konkan Region LOAN = 158438.5 + 2.2211 * MEMB – 127.5344 * GCA (0.2830) (34.8745) Adjusted R2 = 0.7340 F-Statistics = 31.3458 Observations = 23
Maharashtra State LOAN = -119509416.0 + 2.1729 MEMB + 577.3805 *** GCA (2.0399) (318.7163) Adjusted R2 = 0.7282 F-Statistics = 30.4735 Observations = 23
Note: (1) Figures in parentheses show the standard errors of regression coefficients, (2) *, ** and *** indicate significance of regression coefficients at one, five and ten per cent level of probability, respectively.
Although positive association between loan advances and membership of PACS was
expected, the negative influence of GCA on loan advances through PACS in Konkan region
could again be considered as a matter of concern owing to the fact that 70-80 per cent of total
60

Suicide of Farmers in Maharashtra: Background Paper
loan advances of PACS were meant for various crops grown in this region of the state.
However, the reform period in general showed sharp increase in loan advances through
PACS in Maharashtra with the rise in GCA. For every annual hundred hectares addition to
GCA, the loan advances through PACS in Maharashtra increased by nearly Rs.1060 annually
between 1991-92 and 2002-03. This could be considered as a welcome scenario insofar as
loan advances through PACS vis-à-vis GCA across various regions of Maharashtra is
concerned.
6. Credit Flow through Commercial Banks
Despite several targets prescribed by the RBI for Public Sector Banks (PSBs)9, these banks
are reported to have defaulted merrily on majority of these targets (Mujumdar, 2001). This is
evident from the fact that, during the period between 1992 and 1996, the net bank credit of
PSBs to priority sectors at all-India level was well below 40 per cent. Not only this, at all-
India level, the net bank credit of PSBs to agriculture and to weaker sections remained well
below 18 per cent and 10 per cent, respectively, of their total advances all through the period
between 1991 and 2000. This is a reflection of the fact that the two sub-targets of credit to
agriculture and to weaker sections continue to remain unattained even in more recent times.
Thus, agriculture in general and weaker sections in particular are grossly neglected by PSBs.
However, in view of the recommendations of the Union Budget of 1996-97, which laid
emphasis on the need to double the size of rural credit in the subsequent five years, the RBI
had restored the priority sector credit of PSBs to the level of 41 per cent of their total
advances in March 1997, and it remained well above 40 per cent thereafter (Mujumdar,
2001).
As for institutional finance to farming community, the commercial banks in Maharashtra
have also not shown encouraging trends. The trend over the past two decades shows a slower
growth in rural institutional finance through commercial banks during the decade of
economic reforms as against the pre-economic reform period (Table 11). The commercial
banks in Maharashtra have not only shown slower growth in their loan advances and deposits
but also decline in their credit-deposit (C-D) ratio during the period of reforms as against the 9 In terms of directed credit, the Reserve Bank of India (RBI) has stipulated several targets for Public Sector Banks (PSBs). These encompass a minimum of: (a) 40 per cent of net bank credit to priority sectors, (b) 18 per cent of total advances to agriculture, (c) 10 per cent of total advances to weaker sections, (d) one per cent of net bank credit under differential rate of interest (DRI) scheme, and (e) maintenance of a 60 per cent of a credit-deposit ratio. Among these targets, (b) and (c) are the two sub targets of (a), i.e., 18 per cent of net bank credit to agriculture and 10 per cent to weaker sections with an overall 40 per cent of net bank credit to priority sectors.
61
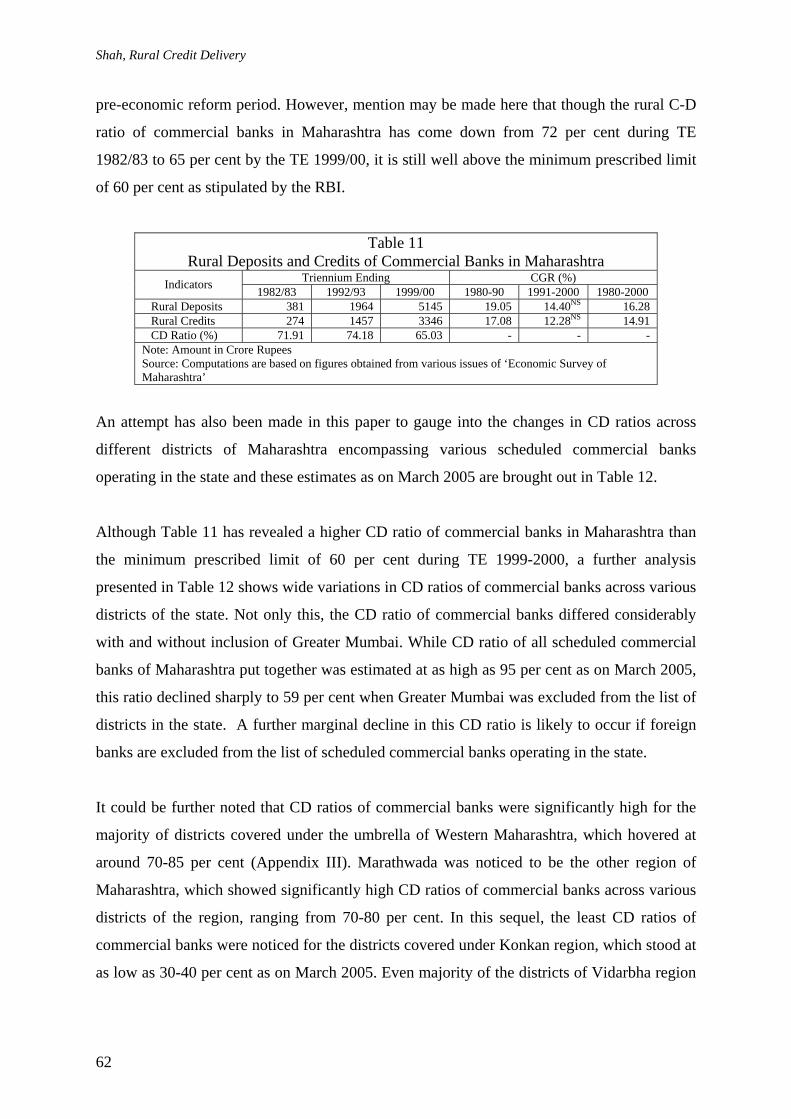
Shah, Rural Credit Delivery
pre-economic reform period. However, mention may be made here that though the rural C-D
ratio of commercial banks in Maharashtra has come down from 72 per cent during TE
1982/83 to 65 per cent by the TE 1999/00, it is still well above the minimum prescribed limit
of 60 per cent as stipulated by the RBI.
Table 11 Rural Deposits and Credits of Commercial Banks in Maharashtra
Triennium Ending CGR (%) Indicators 1982/83 1992/93 1999/00 1980-90 1991-2000 1980-2000 Rural Deposits 381 1964 5145 19.05 14.40NS 16.28 Rural Credits 274 1457 3346 17.08 12.28NS 14.91 CD Ratio (%) 71.91 74.18 65.03 - - - Note: Amount in Crore Rupees Source: Computations are based on figures obtained from various issues of ‘Economic Survey of Maharashtra’
An attempt has also been made in this paper to gauge into the changes in CD ratios across
different districts of Maharashtra encompassing various scheduled commercial banks
operating in the state and these estimates as on March 2005 are brought out in Table 12.
Although Table 11 has revealed a higher CD ratio of commercial banks in Maharashtra than
the minimum prescribed limit of 60 per cent during TE 1999-2000, a further analysis
presented in Table 12 shows wide variations in CD ratios of commercial banks across various
districts of the state. Not only this, the CD ratio of commercial banks differed considerably
with and without inclusion of Greater Mumbai. While CD ratio of all scheduled commercial
banks of Maharashtra put together was estimated at as high as 95 per cent as on March 2005,
this ratio declined sharply to 59 per cent when Greater Mumbai was excluded from the list of
districts in the state. A further marginal decline in this CD ratio is likely to occur if foreign
banks are excluded from the list of scheduled commercial banks operating in the state.
It could be further noted that CD ratios of commercial banks were significantly high for the
majority of districts covered under the umbrella of Western Maharashtra, which hovered at
around 70-85 per cent (Appendix III). Marathwada was noticed to be the other region of
Maharashtra, which showed significantly high CD ratios of commercial banks across various
districts of the region, ranging from 70-80 per cent. In this sequel, the least CD ratios of
commercial banks were noticed for the districts covered under Konkan region, which stood at
as low as 30-40 per cent as on March 2005. Even majority of the districts of Vidarbha region
62

Suicide of Farmers in Maharashtra: Background Paper
showed less than 60 per cent CD ratios of their commercial banks with the only exception of
Buldhana and Akola districts (Appendix III).
The foregoing estimates clearly underscore the fact that the districts belonging to Konkan
region in particular and Vidarbha region in general were marked with poor performance of
commercial banks as their loan advances fell much below 60 per cent of deposits as on March
2005. The falling CD ratio of commercial banks may have several adverse affects on the
livelihood of rural population in these districts/regions of Maharashtra.
Table 12 District and Bank Group-wise Distribution of the Number of Reporting Offices, Aggregate
Deposits and Gross Bank Credit of All Scheduled Commercial Banks in Maharashtra March 2005 SBI & Its
Associated Nationalised
Banks Foreign Banks RRBs Other Com.
Banks All Scheduled Commercial Banks
Districts
Dep
osits
Cre
dit
Dep
osits
Cre
dit
Dep
osits
Dep
osits
Dep
osits
Cre
dit
Cre
dit
Cre
dit
Off
ices
Dep
osits
Cre
dit
CD
R
atio
(%
)
1.Ahmednagar 447 282 952 803 - - - - 121 38 208 1520 1123 73.882. Akola 243 163 311 237 - - 51 38 48 21 102 653 459 70.293. Amravati 418 220 759 331 - - - - 59 21 145 1236 573 46.364. Aurangabad 788 558 935 821 4 1 147 101 405 384 166 2280 1865 81.805. Bhandara 145 55 226 98 - - 66 44 9 4 64 446 202 45.296. Beed 408 289 97 53 - - 127 43 17 37 98 650 422 64.927. Buldhana 254 212 150 120 - - 68 56 13 18 101 486 406 83.548. Chandrapur 410 157 830 266 - - 117 57 58 18 150 1415 498 35.199. Dhule 217 190 314 210 - - - - 29 18 77 560 418 74.6410. Gadchiroli 100 54 121 36 - - 66 28 8 4 41 295 122 41.3611. Gondia 97 66 242 125 - - 68 36 30 15 61 437 242 55.3812.Gtr. Mumb 43278 41415 124466 128513 38144 33548 - - 97867 114836 1533 303755 318313 104.7913. Hingoli 144 82 28 17 - - 57 22 10 8 38 239 129 53.9714. Jalgaon 479 421 704 531 - - - - 309 191 175 1492 1144 76.6815. Jalna 213 116 172 173 - - 84 92 22 12 77 492 393 79.8816. Kolhapur 292 232 1105 1076 - - - - 894 702 230 2291 2009 87.6917. Latur 388 251 222 206 - - 95 40 58 38 99 764 535 70.0318. Nagpur 1896 1192 4690 2365 5 1 - - 844 767 283 7435 4325 58.1719. Nanded 560 323 234 169 - - 159 69 62 30 130 1015 590 58.1320. Nandurbar 119 63 162 100 - - - - 19 7 45 299 171 57.1921. Nasik 1901 380 2190 1445 - - - - 534 284 235 4625 2109 45.6022.Osmanabad 219 137 116 57 - - 95 25 - - 71 430 219 50.9323. Parbhani 301 245 82 49 - - 71 44 15 10 72 469 347 73.9924. Pune 3030 1894 13234 8064 957 1272 - - 5848 4939 597 23069 16169 70.0925. Raigad 900 278 1282 461 - - - - 393 69 152 2574 808 31.3926. Ratnagiri 372 93 874 339 - - 64 51 98 44 133 1407 527 37.4627. Sangli 237 199 796 700 - - - - 533 239 183 1566 1139 72.7328. Satara 289 153 791 473 - - - - 469 214 152 1549 839 54.1629.Sindhudurg 215 84 503 173 - - 50 31 - - 81 769 288 37.4530. Solapur 366 242 1065 872 - - 66 57 217 103 221 1715 1274 74.2931. Thane 2288 647 10853 5735 17 16 86 17 3557 861 475 16802 7277 43.3132. Wardha 206 149 382 201 - - - - 26 14 73 615 364 59.1933. Washim 87 61 56 44 - - 55 38 - - 54 199 143 71.8634. Yavatmal 337 184 344 217 - - 104 53 54 30 117 839 484 57.69Maharashtra 61645 51090 169291 155079 39128 34838 1699 942 112626 123976 6439 384389 365925 95.20Maharashtra (Excl. Mumbai)
18367 9675 44825 26566 984 1290 - - 14759 9140 4906 80634 47612 59.05
Note: Amount in Rs. Crore Source: http://rbidocs.rbi.org.in/rdocs/Publications/PDFs/65232.pdf
63

Shah, Rural Credit Delivery
Notably, in due course of time, the outstanding loans of indirect finances of commercial
banks have grown at much faster pace as compared to their outstanding loans of direct
finances to farmers in Maharashtra (Table 13). Table 13 also shows an increasing trend in
share of Maharashtra in total outstanding loans of all scheduled commercial banks of India,
which has grown from 10 per cent during TE 1985 to as high as above 14 per cent by the TE
2000. These trends are certainly not very encouraging insofar as the commercial bank
finances to farming community in Maharashtra are concerned. Despite the recommendations
of the R.V. Gupta Committee, appointed in 1997, which encompass several changes in
commercial bank’s documentation, loan appraisal parameters, operational procedures and
loan product with built-in liquid saving product, the rural credit delivery through commercial
banks in Maharashtra has grown at lower pace, especially during the 1990s.
Table 13 Progress of Distribution of Outstanding Advances of Scheduled Commercial Banks to
Agriculture in Maharashtra Vis-à-vis India FDFI LEEBEW OTIF@ DFF Total
Period No. of Ac.
AO No. of Ac.
AO No. of Ac. AO No. of Ac. AO No. of Ac. AO
Maharashtra 1980 2649 18 1105 33 83396 90 485350 254 574500 395 (11.05) TE 1985 4416 11 5012 69 51141 113 906131 572 966700 765 (10.02) TE 1990 2458 16 176 44 20940 105 1548068 1388 1571642 1553 (10.06) TE 1995 4557 24 2454 212 13541 175 1577661 1819 1598212 2230 (10.10) TE 2000 2859 115 9256 386 21879 2241 1217692 3182 1251686 5924 (14.06)
India 1980 36700 206 12010 145 1085002 433 8501469 2789 9635181 3573 TE 1985 50135 325 38119 392 639520 695 13582102 6220 14955262 7632 TE 1990 44514 363 54823 484 606412 645 20665098 13950 21370846 15442 TE 1995 45271 389 69127 923 314821 860 20486449 19916 20915667 22088 TE 2000 58477 1455 71915 1589 178850 6095 16810610 33001 17119839 42140 Note: Amount in Rs. Crore, Figures in Parentheses are shares of Maharashtra in India’s total Outstanding Loans, @-includes loans to farmers through Primary Credit Societies, FDFI: Finance for Distribution of Fertilizer and other Inputs; LSEBEW: Loans to State Electricity, Board for Energization of Well, etc.; OTIF: Other Types of Indirect Finance; DFF: Direct Finance to Farmers; AO: Amount Outstanding Source: Computations are based on figures obtained from various issues of ‘Statistical Tables Relating to Banks in India, Department of Banking Operations and Development for the RBI, Bombay’
In order to realize high and sustained growth of GDP, Mujumdar (1998) has categorically
emphasized upon the need for the PSBs to support priority sectors irrespective of whether
there exist credit target or not. As regards rural credit delivery, the Ninth Plan Approach
Paper is categorical on priority sector advances. As per Ninth Plan Approach Paper, “Greater
credit flow will be ensured to meet the investment requirements of the farming community
for stepping up the growth of production. Efforts will be made to ensure timely and adequate
availability of credit, particularly to small and marginal farmers and tribal farmers at
64

Suicide of Farmers in Maharashtra: Background Paper
reasonable rates so as to enable them to make investments necessary for higher
production”[Approach Paper to the Ninth Five-Year Plan (1997-2002), p.56, 1996]. The
Ninth Plan, therefore, not only recognizes the role of priority sectors in the future growth of
the economy, but it also categorically emphasizes upon the imperative of enlarging the flow
of credit to these sectors. Hence, one of the suggestions of Mujumdar (1998) is in favour of
following such future credit policies which fall in line with the Ninth Plan priorities, and
which need to be implemented without any further delay.
7. Credit Flow through RRBs
At all-India level, a review of performance of RRBs over the past one decade or so shows an
estimated aggregated amount of loss to the tune of Rs.15.86 crores incurred by 130 RRBs in
1984-85, which is seen to have grown to Rs.621.00 crores incurred by 162 RRBs in 1991-92
and further to as high as Rs.3047.87 crores incurred by 152 RRBs in 1996-97. Due to huge
accumulated losses and operational deficiencies, the very survival of RRBs is now at stake
and it has become a matter of concern. In order to strengthen the organizational structure of
RRBs, several committees were constituted from time to time.10 Among various committees,
the recommendations of Bhandari Committee are noteworthy. This Committee had evolved a
forward looking policy framework, which mainly revolved around: (a) comprehensive
restructuring of select 49 RRBs including financial assistance to them, (b) Memorandum of
Understanding between RRBs and their Sponsor Banks, (c) freedom to select 70 RRBs from
Service Area Obligations in view of their inadequate business so as to provide them broader
business base, (d) relocation of loss making branches and opening extension counters, (e)
expansion and diversification of loan portfolio by allowing Non Target Group and Non
Priority Sector and rural housing finance, (f) widening of avenues of profitable investment
and surplus non-SLR funds, and (g) strengthening Board of Directors of RRBs by induction
of professionals as GOI nominees (Deshpande et. al., 1998). Majority of these policies were
seen to have emanated from the financial sector reforms initiated during 1994-95.
It is to be noted that considering the dismal performance of RRBs and their weak structure,
Government of India (GOI) unleashed in the first phase its financial sector reforms in 1994-
95 and embarked upon an ambitious plan of revamping initially 49 out of a total of 196 RRBs 10 The most important among these committees were Kelkar Committee, Agricultural Credit Review Committee (ACRC) under the Chairmanship of Prof. A.M. Khusro (1989), Committee on Financial System (1992) under the Chairmanship of Shri M. Narasimham, and Committee on Restructuring of RRBs (1994) under the Chairmanship of Dr. C. Bhandari.
65

Shah, Rural Credit Delivery
with the aim of improving their profitability besides launching several other policy reforms
aimed at improving their functional efficiency. In the second phase, based on the
recommendations of Basu Committee, another batch of 68 RRBs were brought under
restructuring during 1995-96. As a result of these revamping efforts, 40 RRBs were reported
to have shown profits (Capoor, 1998). Although various policies relating to restructuring and
revamping of RRBs were introduced in the first and second phase of financial sector reforms,
the policy relating to granting of permission by the RBI to RRBs to invest in non-target
avenues like shares and debentures of corporates, units of mutual funds, bonds of public
sector undertakings, etc. was severely criticized by Mujumdar (2001) as this had paved the
way for a reverse flow of funds from the rural to the urban sector.
Table 14 Progress of Deposit and Credit of Regional Rural Banks (RRBs) in Maharashtra
Vis-à-vis India Maharashtra All-India Period Deposit Credit CD Ratio (%) Deposit Credit CD Ratio (%)
1981 557 824 147.94 33147 40682 122.73 TE 1985 1724 2034 117.40 97075 107492 110.73 TE 1990 8851 10709 120.99 353554 321839 91.03 TE 1995 22757 17373 76.34 861931 528835 61.35 TE 2000 75492 41562 55.05 2685412 1152160 42.90 Note: Amount in Lakh Rupees Source: Computations are based on figures obtained from various issues of ‘Statistical Tables Relating to Banks in India, Department of Banking Operations and Development for the RBI, Bombay’.
Although RRBs generate major part of resources through deposits, too much dependence on
deposits and lack of attention paid to loan advances is certainly a disturbing feature. In course
of time, the RRBs in India have shown a drastic fall in their credit-deposit ratio. The C-D
ratio of RRBs at all-India level has come dawn from 123 per cent during 1981 to 43 per cent
by the TE 2000 (Table 14). The fall in this ratio is more sharp in the state of Maharashtra,
which has come dawn from 148 per cent during 1981 to 55 per cent by the TE 2000. It is to
be noted that in Maharashtra, as on March 2000, there were 582 branches of RRBs with
Marathwada region accounting for around 50 per cent share in total numerical strength of
these bank branches of RRBs (Shah, 2004). The decline in C-D ratio of RRBs is mainly due
to diversion of substantial portion of their resources to investments instead of lending in rural
areas. It should be recollected here that the chief objective of setting up of RRBs was the
effective coverage of small and marginal farmers, landless labourers, rural artisans, etc. with
a view to enhance their productive capabilities. The decline in their lending business is a
clear-cut reflection of deviation of RRBs from the objectives they were initially formed.
66

Suicide of Farmers in Maharashtra: Background Paper
It is not that during the period between 1981 and TE 2000 RRBs operating in Maharashtra
have shown poor performance. Even in more recent times, they have shown inconsistency in
terms deposits, credit and other operational indicators (Table 15).
Table 15 Operational Indicators of RRBs in Maharashtra: 2001/02 – 2003/04
Indicators 2001-02 2002-03 2003-04 No. of RRBs 10 10 10 No. of Branches 511 511 511 - of which Rural Branches 395 395 395 Deposits (Rs. lakh) 125083.38 144448.65 166186.00 Loans & Advances OS (Rs. lakh) 64528.73 68521.00 74999.00 % of Overdues 30 31 31 % of NPAs - 19.7 21.0 No. of Banks in Profit 9 9 9 No. of Banks in Loss 1 1 1 Source: Compiled from ‘State Focus Paper Maharashtra, 2005-06’, NABARD, Pune.
Though the credit business of RRBs has declined and their investment banking has gone up,
it may be necessary to look into the reasons for such changes. Some of the reasons for slower
growth in loan advances as against deposits of RRBs could be traced in: (a) inability of RRBs
to compete with commercial banks due to their limited area of operation, (b) ban on
requirement of staff of RRBs, (c) unfavourable age profile of the staff of RRBs, (d) high
deposit cost structure, (e) lower level of application of information technology (IT), etc. All
these factors might have contributed to poor performance of RRBs operating in the state of
Maharashtra.
It has been asserted by Shivamaggi (2000) that the major problem faced by RRBs in India is
the lack of staff motivation and specialization despite local recruitment of staff. The poor
performance of RRBs greatly owed it to their hurriedly recruited and trained staff that not
only lack exposure in dealing with a large number of small-term/composite loans but also in
terms their weak knowledge to deal with bank accounts, seek guidance at each stage of loan
application to its recovery.
67

Shah, Rural Credit Delivery
8. Credit Flow through LDBs
Long-term cooperative finance is provided through Land Development Banks (LDBs). These
banks have passed through three distinct stages of development.11 The loans of LDBs are
extended not only for land-based productive activities, viz., minor irrigation, farm
mechanization, plantation and land development but also for several other activities, which
are, in general, subsidiary to agriculture like poultry, dairy, piggery, sheep rearing, fishery,
sericulture, etc. (Kumar and Dixit, 1998). The non-farm sector encompasses loans to
agricultural labourers, rural artisans and small rural enterprises. The coverage of non-farm
sectors and finances for non-land based purposes has certainly broad-based the activities of
LDBs in more recent times.
In general, the flow of finances through LDBs encompass activities relating to agricultural
production sub-system (APS), agricultural input distribution sub-system (AIS), agricultural
produce marketing and processing sub-system (AMPS), and also long-term finance to
members of LDBs for the purpose of purchase of tractor and its accessories, minor irrigation,
milch and draught animal purchase, etc. The loans to members of LDBs for long-term
purposes are provided against the mortgage of their lands. Although the overall performance
of LDBs in India is satisfactory, they still have to do a lot of catching up to improve the
condition of rural India. The major problem crippling the functioning of LDBs is the
mounting amount of overdues and their outstanding loans, which have grown dramatically in
more recent times.12
11 The period between 1929 and 1954 represented the first stage when LDBs were termed as land mortgage banks (LMBs). The major objective of LMBs during this stage was to rescue the farmers out of the clutches of private money lenders. The second stage began when in view of the recommendations of the All India Rural Survey Committee (1951-54) these banks started concentrating on extending long term finances for productive purposes in the farm sector with the aim of meeting the objective of planned development envisaged under the first Five Year Plan initiated in 1951 (Kumar and Dixit, 1998). The beginning of third stage was marked when in the light of the recommendations of Committee to Review Arrangements for Institutional Credit for Agriculture and Rural Development (CRAFICARD) in 1980 the LDBs expanded their lending operations by extending credit for non-land based and for non agricultural activities; and at the latter stage their activities also encompassed finances for non farm sectors. During this stage, these LDBs were termed as Cooperative Agriculture and Rural Development Banks (CARDBs). 12 The overdues of Primary Cooperative Agriculture Rural Development Banks (PCARDBs) at all-India level is reported to have grown from Rs.196.43 crores in 1987 to Rs.435.20 crores in 1995 (Kumar and Dixit, 1998). Earlier, while reviewing the report of Agricultural Credit Review Committee, Shivamaggi (1996) had also cited overdue as the major problem facing the LDBs. This is despite the fact that the loans extended by LDBs not only help in creating productive assets but also in terms of generating adequate incremental income to the farmers.
68

Suicide of Farmers in Maharashtra: Background Paper
In the state of Maharashtra, the loan advances of LDBs have not only declined sharply during
the period of reform but also working capital of these banks fell marginally during this period
(Table 16). The membership of LDBs of Maharashtra has also grown at slower rate during
the period between 1991 and 2000 as against the period between 1981 and 2000. Even the
recovery of loans and share capital base of LDBs has weakened during the reform period.
Nonetheless, it is to be noted that the outstanding loans of LDBs in Maharashtra have grown
at slower pace during the period between 1991 and 2000 as against the period between 1981
and 2000 (Table 16).
Table 16 Progress of Maharashtra State Cooperative Land Development Banks (LDBs)
Period Membership Share Capital
Owned Funds
Borrow-ings
Working Capital
Loan Advances
Loans Recovered
Loans Outstanding
TE 1985 827 3743 7173 31182 44405 5651 2710 30627 TE 1990 926 4531 11922 48045 66685 8932 3846 49245 TE 1995 1111 7184 14766 68076 107311 13668 6089 82328 TE 2000 1189 9752 54633 109438 144262 4875 8641 99690 CGR (%) - 1981-00 - 1991-00
2.79* 1.65*
9.34* 7.07*
13.18* 38.61*
9.38* 8.79*
6.07* -0.27
0.54
-18.53
7.75* 6.83*
9.21* 5.64*
Note: Amount in lakh Rupees; Membership in thousands Source: Computations are based on figures obtained from various issues of ‘Co-operative Movement at a Glance in Maharashtra, Office of the Commissioner for Co-operation & Registrar of Co-operative Societies, Maharashtra State, Pune
It is to be noted here that among the agencies delivering agricultural credit, the weakest
institutions are LDBs mainly due to their structural and financial problems, and, at present,
the LDBs in Maharashtra stand liquidated. The unitary structure of LDB has been converted
into federal. At present, LDBs in Maharashtra are operating only in about 10 districts.
Further, it is to be noted that quite a few years ago the LDBs were termed as state cooperative
agricultural and rural development banks (SCARDBs) and primary cooperative agricultural
and rural development banks (PCARDBs). The progress of SCARDBs and PCARDBs in
Maharashtra encompassing the period between 2001-02 and 2003-04 is shown in Table 17.
The estimates shown in Table 17 clearly reveal poor performance of SCARDB and
PCARDBs in the state of Maharashtra as during the period between 2001-02 and 20303-04
not only their deposits and loan advances declined but proportions of overdue and NPAs have
grown during this period. Out of 29 branches of PCARDBs operating in the state, 27 are
running into losses.
69

Shah, Rural Credit Delivery
Table 17 Progress of SCARDB and PCARDB in Maharashtra: 2001/02 – 2003/04
Indicators 2001-02 2002-03 2003-04 No. of SCARDB 1 1 1
No. of Branches of SCARDB 1 1 1 Deposits of SCADB (Rs. lakh) 525 119 119
Loans & Advances OS of SCARD (Rs. lakh) 105944 101940 104599 % of Overdues of SCARDB 87 75 75
% of NPAs of SCARDB NA 45 64 No. of SCARDB in Profit - - - No. of SCARDB in Loss 1 1 1
No. of PCARDB 29 29 29
No. of Branches of PCARDB 291 291 291 Deposits of PCADB (Rs. lakh) 3473 2128 1802
Loans & Advances OS of PCARD (Rs. lakh) 75053 68563 63874 % of Overdues of PCARDB 70 78 84
% of NPAs of PCARDB 65 NA 79 No. of PCARDB in Profit 2 2 2 No. of PCARDB in Loss 27 27 27
Source: Compiled from ‘State Focus Paper Maharashtra, 2005-06’, NABARD, Pune.
Earlier, in order to tackle the problem of overdue of LDBs, certain suggestions were extended
by Kumar and Dixit (1998), which revolved around creation of greater coordination among
ST, MT and LT loans and streamlining operations of LDBs, checking diversion and misuse
of LDB’s credit, effective supervision of loan product, strengthening share capital base, and
mobilizing deposits and debentures through innovative deposits and debenture schemes.
Another important suggestion in this context is in favour of launching intensive membership
drive with a view to increase coverage of these long-term financial institutions. Some of the
agricultural and rural development banks, popularly known as LDBs, have already taken
initiatives in these directions.
9. Micro Finance
In the midst of apparent inadequacies of formal financial institutions and their failure to serve
and protect the interest of rural poor despite their phenomenal outreach, an informal segment
comprising of small groups of rural poor began to mobilize capital and savings of their
members and used these resources among their members on a micro scale. These groups were
termed as Self Help Groups (SHGs). The lending procedures of these groups were not only
simple but also effective due to small amount of loans involved in the process. Since the
concept of SHGs was relatively new, NABARD undertook the task of studying the
functioning of SHGs in India as well as in other countries. In this sequel, in 1988-89,
NABARD had made an attempt to conduct a survey of 43 non-government organizations
(NGOs) spread over 11 states in India. Findings of this investigation encouraged NABARD
70

Suicide of Farmers in Maharashtra: Background Paper
to launch a pilot project in 1991-92 which involved linkages between banks and SHGs.13 The
SHG-bank linkage programme got a real boost when, in April 1996, RBI had recommended
the banks that lending to the SHGs should be considered as an additional segment under
priority sector lending. Thus, in view of this recommendation, lending to SHGs was
integrated with the mainstream credit operations of the banks.
The SHG linkage programme received wider acceptability during 1997-98 when 30
commercial banks, 101 Regional Rural Banks, 17 co-operative banks and 265 NGOs spread
over 19 states and two Union Territories had participated in such a linkage programme. The
progress of SHG-Bank Linkage programme has been quite impressive over the past few
years. The information on progress under SHG-Bank Linkage Programme encompassing the
period between 1992 and 2005 is provided in Table 18.
Table 18 Progress of SHG-Bank Linkage Programme in India
Year
No. of SHGs Linked
Cumulative % age of Women Groups
No. of Participating
Banks
No. of States/Uts
No. of Districts Covered
Cumulative Bank Loan
Cumulative Refinance
1992-93 255 255 NA NA NA NA 0.29 0.27 1993-94 356 620 NA NA NA NA 0.65 0.46 1994-95 1,502 2,122 NA NA NA NA 2.45 2.29 1995-96 2,635 4,757 NA NA NA NA 6.06 5.66 1996-97 3,841 8,598 76 120 20 NA 11.84 10.65 1997-98 5,719 14,317 78 150 21 221 23.76 21.38 1998-99 18,678 32,995 84 202 24 280 57.07 52.06 1999-2000 81,780 1,14,775 85 266 24 362 192.98 150.13 2001* - 2,63,825 - - - - 480.87 394.98 2002* - 4,61,478 - - - - 1026.34 790.24 2003* - 7,17,360 - - - - 2048.67 1412.71 2004* - 10,79,091 - - - - 3904.20 2118.15 2005* - 16,18,476 - - - - 6898.46 3085.91
Note: Amount in Crore Rs. Source: Official records of NABARD, Pune. * - Annual Report (2004-05) of NABARD, Mumbai.
13 The linkage between banks and SHGs is a mechanism for channeling credit to the poor on a sustained basis. There are numerous potential advantages involved in the linkages between banks and SHGs with NGOs acting as facilitators or financial intermediaries. From the banks point of view, the advantages of linkage approach between banks and SHGs include reduction in transaction cost, mobilization of small savings, assured and timely repayment of loan leading to faster recycling of funds, opportunity for expansion of business and coverage of poor clientele, and prospects of future quality clients. In this process, NGOs not only act as bridge between banks and the poor and perform their role as financial intermediaries in unbanked and backward areas but they are also propagators of innovative credit delivery approaches. The efforts of NGOs develop thrift habit among the poor and provide them access to large quantity of finance. The efforts of NGOs in linking banks with SHGs also provide freedom, equality, self-reliance and empowerment among the members, besides making them available consumption/ production credit at their door-steps. This in turn helps the members of SHGs to have a window for access to better technology and upgradation of their skills. The NGOs also help SHGs to have access to various promotional assistance, besides scaling up of their operations.
71

Shah, Rural Credit Delivery
In the state of Maharashtra, the number of SHGs linked with bank credit has grown
significantly over the past five years. This could be witnessed from Table 19 which clearly
shows the strength of SHGs linked with bank credit to grow from as low as 1,930 as on
March 1999 to as high as 47,014 as on November 2004. Initially, only 11 districts of
Maharashtra were covered under the SHG-Bank linkage programme. However, in due course
of time, more and more districts were covered under the folds of this programme. At present,
all the 33 districts of Maharashtra are covered under the SHG-Bank linkage programme.
Table 19 Status of SHG-Bank Linkage in Maharashtra
Particulars/Cumulative Position
March 1999
March 2000
March 2001
March 2002
March 2003
March 2004
November 2004
No. of SHGs Linked 1930 4959 10468 19619 28065 38535 47014 Bank Loan (Rs. lakh) 378.98 929.89 1797.08 4230.14 6970.19 11361.01 15226.60 Refinance (Rs. lakh) 360.14 904.44 1768.22 3167.47 4022.33 4135.15 6074.56 No. of Districts Covered 20 29 29 33 33 33 33 Source: Compiled from ‘State Focus Paper Maharashtra, 2005-06’, NABARD, Pune.
Among various regions, the share of Vidarbha in total number of SHGs liked with bank credit
is noticed to be highest (55.72 per cent) in the state, followed by Western Maharashtra (22.68
per cent), Marathwada (15.63 per cent), and Konkan (5.98 per cent) region (Table 20).
A massive programme of promotion of SHGs has been launched by the NGOs and the State
Government agencies. As a result, 32,147 saving bank accounts of new SHGs were opened
during 2003-04. The NGOs engaged in promoting SHGs are mainly concentrated in the
districts of Vidarbha and Marathwada regions with their presence being relatively less in
Konkan and Western Maharashtra. Further, realizing the importance of NGO sector,
NABARD has been providing support to them for capacity building of their field staff as well
as promotional grants to them for formation of SHG as an ‘add-on’ activity. Upto September
2004, 87 NGOs were sanctioned grant assistance for promoting 11554 SHGs in the state of
Maharashtra. However, they could promote 9106 SHGs with credit linking to 2876 SHGs
upto September 2004. The banks have to credit link the remaining SHGs promoted by these
NGOs. It is to be noted apart from the role of banks as credit providers, they have been
associated in promotion of new SHGs by supporting them through grant assistance to work as
Self Help Promoting Institutions (SHPIs). For this purpose, the RRBs and DCCBs in the state
of Maharashtra have been sanctioned grant assistance under NABARD’s Low Cost Module.
Due to initiation of SHG-Bank linkage programme, there have been perceptible and
wholesome changes in the living standards of the members of SHGs in terms of their
72

Suicide of Farmers in Maharashtra: Background Paper
ownership of assets, savings and borrowing capacity, income generation activities and levels
of income.
Table 20 District-wise Cumulative No. of SHGs Credit Linked in Maharashtra
upto Nov. 2004 Region District No. of SHGs Percentage to Total
Western Maharashtra Ahmednagar 617 1.31 Dhule 748 1.59 Jalgaon 1170 2.49 Kolhapur 1366 2.91 Nandurbar 368 0.78 Nasik 827 1.76 Pune 3378 7.19 Sangli 613 1.30 Satara 570 1.21 Solapur 1004 2.14 Sub-Total 10661 22.68
Vidarbha Region Akola 2958 6.29 Amravati 1517 3.23 Bhandara 2347 4.99 Buldhana 267 0.57 Chandrapur 11094 23.60 Gadchiroli 2308 4.91 Gondia 398 0.85 Nagpur 576 1.23 Wardha 618 1.31 Washim 904 1.92 Yavatmal 3207 6.82 Sub-Total 26194 55.72
Marathwada Aurangabad 1840 3.91 Beed 525 1.12 Jalna 643 1.37 Latur 690 1.47 Nanded 2619 5.57 Parbhani 354 0.75 Osmanabad 598 1.27 Hingoli 79 0.17 Sub-Total 7348 15.63
Konkan Raigad 898 1.91 Ratnagiri 771 1.64 Sindhudurg 276 0.59 Thane 866 1.84 Sub-Total 2811 5.98 Grand Total 47014 100.00
Source: Compiled from ‘State Focus Paper Maharashtra, 2005-06’, NABARD, Pune.
In consonance of Government of India’s policy, NABARD has visualized a corporate
mission for reaching micro finance services to the rural poor of the country by credit linking
additional 5.85 lakh SHGs in three years upto 2006-07. In order to achieve the mission, the
strategy encompasses: (a) thrust on promotion of quality SHGs on a large scale with special
focus on comparatively backward states and regions, (b) designing and funding suitable
training and exposure programmes for all stakeholders, (c) providing assistance to partners
for promotion and nurturing of SHGs generally on add-on basis, (d) encouraging banks to
73

Shah, Rural Credit Delivery
analyse proper rating of SHGs before financing, (e) positioning financing SHGs as a business
proposition for the banks, (f) encouraging cooperatives to take-up SHG financing, (g)
widening the range of SHG promoting agencies by integrating SHG approach in social sector
development programmes of the development agencies and Panchayat Raj Institutions
(PRIs), (h) encouraging commercial borrowings by informal financial intermediaries like
NGOs, micro finance institutions, Federations of SHGs, etc. by providing start up lendable
resources to them, (i) large scale dissemination of the concept of SHGs among rural masses,
(j) shifting from financial services access to livelihood and income generation, and (k) pilot
project in Chandrapur - Need for cooperation and convergence of efforts from government
and banks.
In view of the above policy initiatives and the need to upscale the SHG linkage process, a
mission of credit linking 30,000 SHGs and promoting 37,500 new SHGs during 2004-05 has
been set for the state of Maharashtra. In order to cover half of the rural poor by 2006-07, it is
envisaged to credit link additional 90,000 SHGs in the coming years. Further, in order to
accelerate the pace of SHG-Bank linkage programme, the NABARD has also devised
district-specific and location-specific strategies in view of available potential, resources and
prevailing constraints. It is expected that with the increasing involvement of banking system
as well as NGOs the micro-credit movement will get further fillip in the years to come.
10. RIDF Status in Maharashtra
Under Rural Infrastructure Development Fund (RIDF), NABARD has financed a number of
projects for roads and bridges, irrigation projects, micro irrigation, etc. Creation of these
infrastructure leads to emergence of new economic opportunities before the farmers. From
the point of view of credit institutions, investment in rural infrastructure is crucial since it
directly influences investment decisions of farmers, builds up credit absorption capacity of
the area and increases effectiveness and impact of credit. In the state of Maharashtra, the
status of RIDF as on 31st October 2004 is shown in Table 21.
Maharashtra stands as one of the leading states in the country insofar as implementation of
RIDF is concerned. Out of total sanctioned amount of Rs.1285.0 crores under RIDF I to X,
Rs.642.09 crores has been disbursed as on October 31, 2004 for the development of irrigation
infrastructure in the state. The state-wise analysis of ratio of disbursements to sanctions under
RIDF reveals that Mizoram tops with 89 per cent, followed by Sikkim (81 per cent),
74

Suicide of Farmers in Maharashtra: Background Paper
Himachal Pradesh (72 per cent), Maharashtra (70 per cent), Meghalaya and Rajasthan (69 per
cent), Uttar Pradesh (68 per cent), Goa (67 per cent), Punjab (66 per cent) and Karnataka (65
per cent). Utilization of loans under RIDF was slow in relation to the sanctions due to various
reasons, viz., land acquisition problems, delays in tendering and drawl of funds, inadequate
budgetary support at state level, lack of coordination among implementing departments, etc.
(NABARD, 2005).
Table 21 RIDF Projects Sanctioned and Amount Disbursed Under Various Tranches in Maharashtra
(Data as on 31st October 2004) Irrigation Projects Road & Bridge
Project Micro
Irrigation Project
Others (RWSS) Total
Tranche
Nos
.
Am
t. Sa
nctio
ned A
mt.
Dis
burs
ed
Nos
.
Am
t. Sa
nctio
ned A
mt.
Dis
burs
ed
Nos
.
Am
t. Sa
nctio
neA
mt.
Dis
burs
edN
os.
Am
t. Sa
nctio
neA
mt.
Dis
burs
edN
os.
Am
t. Sa
nctio
ned A
mt.
Dis
burs
ed
RIDF-I 105 186.8 169.9 - - - - - - - - - 105 186.8 169.9RIDF-II 108 231.7 204.5 - - - - - - - - - 108 231.7 204.5RIDF-III - - - 721 254.3 246.0 - - - - - - 721 254.3 246.0RIDF-IV 13 100.5 84.1 899 201.5 185.5 - - - - - - 912 302.0 269.5RIDF-V - - - 1549 350.3 323.5 - - - - - - 1549 350.3 323.5RIDF-VI 38 175.4 73.0 1121 263.8 229.5 - - - - - - 1159 439.2 302.5RIDF-VII 81 173.8 59.1 963 234.5 161.4 - - - 228 121 39 1272 529.7 260.0RIDF-VIII 63 216.9 51.6 900 226.2 82.9 - - - - - - 963 443.1 134.4RIDF-IX - - - 269 67.0 23.4 - - - - - - 269 67.0 23.4RIDF-X - - - - - - 1 163 - - - - 1 163.1 -Total 1085.
0 642.1 6422 1598 1252 1 163 - 228 121 39 7059 2967.1 1933.7
Note: Rs. Crore Source: Compiled from ‘State Focus Paper Maharashtra, 2005-06’, NABARD, Pune.
11. Indebtedness and Suicides of Farmers
The declining share of loan for cotton crop vis-à-vis other field crops or very slow growth in
loan advances for this crop on per borrowing member basis has several adverse effects as
well as implications. One of the adverse effects of slowing down in loan advances for cotton
as well as other field crops is seen on the farming community of Vidarbha region of
Maharashtra where a significant number of cotton and other crop growers have committed
suicide either due to lack of loan advances to them or because of pressure created by various
financial institutions in terms of recovery of loan. Though there are several factors behind
suicide of farmers in this region, indebtedness of farmers cannot be ruled out as one of the
factors behind this drastic step taken by them.
75

Shah, Rural Credit Delivery
Among various regions of Maharashtra, Vidarbha has shown the lowest amount of credit
flow through PACS, which, during TE 2002-03, stood at only Rs.529 per hectare of GCA as
against Rs.1904 per hectare of GCA for Western Maharashtra, Rs.1446 per hectare of GCA
for Marathwada and Rs.602 per hectare of GCA for Konkan region (Table 9). Due to very
low amount of loan extended by PACS, Vidarbha region though shows positive association
between loan advances through PACS and GCA, the increase in loan advances through
PACS for every annual hundred hectares addition to GCA is noticed to be only Rs. 96
between 1980-81 and 1990-91 and as much as Rs. 430 between 1991-92 and 2002-03.
Contrary to this, for Marathwada region these estimates work out to be Rs.223 between 1980-
81 and 1990-91 and Rs. 567 between 1991-92 and 2002-03. (Table 10). These estimates are
concomitant of the fact that Vidarbha region still lags considerably behind other regions of
Maharashtra insofar as flow of credit through PACS is concerned, which form the major rural
lending agency in all the regions of the state.
Notably, so far more than 300 farmers are reported to have committed suicide in the state of
Maharashtra with Vidarbha region of the state alone showing 243 such cases14 (Sharma,
2004). Interestingly, 65 of these 243 cases had debts as little as Rs.8,000. The sad part of the
story is that a majority of those who committed suicide were relatively young, below the age
of 45 years. Interestingly, despite the fact that during the period April-July, 2004, at least 22
farmers had committed suicide in Vidarbha region of Maharashtra and that the deputy
secretary of relief and rehabilitation in Revenue Department of the state admitted to such a
number of suicides, Mr. Karani (Deputy Secretary of Relief and Rehabilitation in Revenue
Department of Maharashtra) stated that the government gives a financial assistance of Rs.1
lakh to the family of the farmer who committed suicide. However, the criteria for becoming
eligible for the assistance were such that families of almost two-thirds farmers who
14 Arjun Dharma Rathod and Praveen Krishnaji Wadekar from Yavatmal district of Maharashtra were facing pressure from bank officials for loan recoveries and were frustrated by monsoon failure. In July 2004, both of them added their names to the burgeoning number of suicides in the state. Three other farmers – one from Yavatmal and one each from Amravati and Wardha district – failed in their attempts but died in hospitals due to injuries. During the period April-July, 2004, at least 22 farmers had committed suicide in Vidarbha region with Yavatmal district alone accounting for 13 suicides. During this period, Buldana, Akola, Vashim and Wardha were the other districts of Vidarbha region from where suicides of farmers were reported. According to Suresh Kakani, deputy secretary of relief and rehabilitation in Revenue Department, there had been 190 cases of confirmed suicides by farmers in Maharashtra between 2001 to March 31, 2004 (Rabade, 2004). He was not certain about the number of suicides after April 2004.
76

Suicide of Farmers in Maharashtra: Background Paper
committed suicide did not get any government assistance15 (Rabade, 2004). It is interesting to
note that after a suicide is committed, the Divisional Commissioner conducts a probe into the
causes of the suicide. If the suicide case fits the criteria mentioned by the revenue department
then the case is forwarded to the Relief and Rehabilitation section in the secretariat. After
whetting the case, it is then forwarded to the Chief Minister who grants the aid from the Chief
Minister’s Relief Fund. This is certainly ridiculous in the sense that the families requiring
relief are not belonging to the categories affected by draught or any other adverse conditions
created by natural calamities or whether conditions. At this juncture, it is well-nigh
imperative to find out as to whether the farmers belonging to Vidarbha region committed
suicide due to lack of availability of finances to them or due to pressure created by the
financial institutions in terms of recovery of loan granted to them. An in-depth analysis
encompassing both economic and social factors is the need of the hour to gauge into the
reasons for such suicides of these socially and economically weaker sections of the rural
society.
As a matter of fact, the reason for suicide of farmers in Vidarbha region cannot be solely
attributed to indebtedness of farmers belonging to this region. There could be several other
factors, which might be playing some role in inducing the farmers to commit suicide. For
instance, a study conducted by Mohanty and Shroff (2003) revealed 14 cases of suicides each
in Yavatmal and Wardha districts during 2002 with Amravati recording 10 and Nagpur 4
such incidents. According to this study, while large and medium categories of farmers
belonging to higher caste committed suicide due to a variety of socio-economic reasons
independent of agriculture, the suicide committed by lower caste farmers was mainly due to
crop loss and indebtedness. The findings of this study need second look, as it does not
incorporate any strong statistical or econometric analysis encompassing social and economic
factors inducing farmers to commit suicide in the state of Maharashtra.
12. Concluding Remarks
The slower growth in institutional finances through commercial banks, credit cooperatives,
RRBs and LDBs, particularly during the decade of 1991-2000, and poor performance
thereafter is mainly due to adverse environment created by the financial sector reforms. As
15 The three criteria are that: (a) the person who committed suicide must be a farmer, (b) he should have taken a loan from the district cooperative bank or nationalized bank, and (c) there should be pressure for recovery of unpaid loan.
77

Shah, Rural Credit Delivery
pointed out by Mujumdar (1999), the new policy regime of financial sector reforms has
grossly neglected the rural credit delivery system. Due to unfavourable policy framework, the
entire rural credit delivery system encompassing rural branches of commercial banks,
cooperative credit institutions and RRBs is reduced to a moribund state (Mujumdar, 2001).
Mujumdar (1996), while lauding the financial sector reforms also felt that the exaggerated
importance given to developing institutions has resulted in “putting the core issues of the
financial system, like improving the rural credit delivery system, on the back- burner”. He
criticized the blind dependency on market forces, irrespective of their macro-economic
implications. He has also shown concern for the shrinking flow of financial resources to
agriculture, both in terms of investment and working capital. In fact, the public investment in
agriculture is reported to be declining (Thamarajakshi, 1999). Between 1992 and 1997, only 8
per cent of the total public investment went to agriculture, and the actual investment in this
sector fell about 40 per cent short of the planned level.
The RFIs operating in Maharashtra have not only shown slower growth in their loan advances
and other operational indicators during the period between 1991 and 2000 but also poor
performance thereafter. The credit cooperatives in particular have shown significantly high
NPAs in Maharashtra. The share of Maharashtra in total NPAs of SCBs at all-India level has
grown from 31.76 per cent in 2002 to as much as 43.16 per cent in 2004. Not only this,
majority of the districts of Vidarbha and Konkan regions of Maharashtra have shown less
than 60 per cent CD ratios of their commercial banks. The falling CD ratio of commercial
banks may have several adverse effects on the livelihood of rural population in these districts
of Maharashtra. Vidarbha region also shows not only very low magnitudes of credit flow
through cooperatives but also decline in share of loan for cotton crop vis-à-vis other field
crops. One of the adverse effects of slowing down in loan advances for cotton crop as well as
other field crops is seen on the farming community of this region where a significant number
of cotton growers have committed suicide either due to lack of loan advances to them or
because of pressure created by various financial institutions in terms of recovery of loan
despite crop failure. It has already been established by some recent studies that while large
and medium categories of farmers belonging to higher caste committed suicide due to a
variety of socio-economic reasons independent of agriculture, the suicide committed by lower
caste farmers is mainly due to crop loss and indebtedness.
78

Suicide of Farmers in Maharashtra: Background Paper
With a view to revive the agricultural credit delivery system, there is need to tackle twin
problems facing the system, viz., growing NPAs with falling CD ratios and poor recovery
performance of RFIs, aside from adopting innovative approaches like linking of Self-Help
Groups (SHGs) and Non-Government Organizations (NGOs) with mainstream financial
institutions. Such linkages are reported to have not only reduced transaction costs but also
ensured better repayment performance. One of the recent studies conducted in Maharashtra
has shown cent per cent recovery of loans through SHGs despite having excessively high
rates of interest (24-36 per cent per annum) on their loan advances (Kshirsagar and Shah,
2002). One of the reasons as to why Vidarbha region shows the highest number of SHGs
linked with bank credit (56 per cent of the state) can be traced in shrinking flow of credit in
this region through formal credit institutions.
Since the new generation lending institutions like SHGs have shown lower transaction cost
and higher rate of recovery despite excessively high rates of interest on their loan advances, it
is imperative for credit cooperatives and commercial banks to study the mechanism of new
generation lending institutions in terms of their pattern of loan recovery and interest rate
structure. These groups are also reported to have favourably impacted the social and
economic status of their members (Gulati and Bathla, 2002).
As for the rural credit scenario, one of the recent welcome developments has been the
establishment of the Rural Infrastructure Development Fund (RIDF) instituted by NABARD
with the objective of advancing loans to state governments and state-owned corporations for
hastening ongoing projects, mainly those related to medium and minor irrigation, soil
conservation, watershed management, etc (Mujumdar, 1998). However, it is also being
conceded by Mujumdar (2001) that the utilization of this fund is dismal at only 30 per cent.
One of the further disquieting features of RFIs in Maharashtra has been the high proportion
of NPAs to total assets, particularly of RRBs and SCARDBs, which are estimated to hover
around 36-48 per cent during the mid-to late nineties. One of the reasons for such high
incidence of NPAs of RFIs has been the familiar practice of debt forgiveness, which eroded
repayment and allowed defaulters to scot free with no deterrent reprimand. Political
interference in issues of prudent fiscal management has got a lot to do with this unfortunate
scenario (Shah, 2003).
79

Shah, Rural Credit Delivery
The RFIs of Maharashtra are also seen to be beset with high levels of NPAs or overdues, both
in forward and backward regions (Shah, 2004). There is, therefore, a need to take more
stringent and cohesive measures for recovery of loans from chronic and heavy defaulters. In
brief, in order to rejuvenate rural credit delivery system, the problems facing the system, viz.,
growing NPAs with falling CD ratios, high transaction costs and poor repayment
performance, need to be tackled with more fiscal jurisprudence reserving exemplary
punishment for willful defaults, especially by large farmers. In fact, the focus of rural credit
delivery system should be on strategies that are required for tackling issues such as
sustainability and viability, operational efficiency, recovery performance, small farmer
coverage and balanced sectoral development (Puhazhendhi and Jayaraman, 1999).
In order improve agricultural lending in Maharashtra NABARD (2004) came out with several
strategies, which revolved around: (a) provision of effective extension support by the State
Government to the units financed by banks with a view to identify good borrowers, (b)
formation of SHGs of tenant farmers as joint liability groups with the help of a voluntary
organization, (c) making available insurance cover for all crops subject to the criteria that the
unit for measurement of crop loan norms will be based on village-wise instead of mandal or
block-wise data, (d) provision of CD containing model schemes by NABARD to all the
banks and Government Departments in respect of new schemes in the state, and (e) revision
of scale of finance for crop loans. NABARD has already taken several initiatives in this
respect and revised unit cost for various farm sector investments on 10th September 2004
through unit cost committee, aside from providing a complete list of completed watersheds
through RIDF to banks on farm development works with credit.
References: Capoor, Jagdish (1998), Valedictory Address at the National Seminar on ‘Organisational
evelopment Approach to Revamping of Regional Rural Banks’, Proceedings of the National Seminar, Banking Institute of Rural Development, Lucknow.
Deshpande, D.V., M.K. Mudgal and K.K. Gupta (1998), ‘Status and Problems of RRBs’,
Proceedings of the National Seminar on ‘Organisational Development Approach to Revamping of Regional Rural Banks’, Banking Institute of Rural Development, Lucknow.
Gulati, Ashok and Seema Bathla (2002), ‘Institutional Credit to Indian Agriculture: Defaults
and Policy Options’, Occasional Paper-23, NABARD, Mumbai.
80

Suicide of Farmers in Maharashtra: Background Paper
Kumar, Sant and R.S. Dixit (1988), ‘Long-term Credit Requirements of Rural India: Role of PLDBs’ , in ‘India’s Rural Cooperatives’, Gurasharan Singh Kainth (Ed.), Regency Publications, New Delhi, pp. 185-192.
Kshirsagar, K.G. and Deepak Shah (2002), ‘Flow of Credit to Small and Marginal Farmers in
Maharashtra’, AERC study report, Gokhale Institute of Politics and Economics, Pune. Mohanty, B.B. and Sangeeta Shroff (2003), ‘Market Imperfections and Farmers’ Distress in
Maharashtra’, a study report of the AERC, Gokhale Institute of Politics and Economics, Pune.
Mujumdar, N.A. (1996), ‘Financial Sector Reforms: An Exercise in Introspection’, Economic
and Political Weekly (EPW), Vol.XXXI, No. 12, March 23, pp. 727-730. ------- (1998), ‘Credit Support to Priority Sectors: A Macro Perspective’, EPW, Vol. XXXIII,
No. 4, January 24, pp. 147-150. ------- (1999), ‘Reviving Rural Credit’, EPW, June 19-25, p 1577. ------- (2001), ‘The New Architecture of the Rural Credit System’, Professor M.L. Dantwala
Monograph Series Monograph No. 1, Department of Economics, University of Mumbai, Mumbai, August.
NABARD (2000), National Bank for Agriculture and Rural Development, Annual Report,
2000-01, Mumbai. NABARD (2004), State Focus Paper Maharashtra (2005-06), NABARD, Pune. NABARD (2005), National Bank for Agriculture and Rural Development, Annual Report,
2004-05, Mumbai. Puhazhendhi, V. and B.Jayaraman (1999), ‘Rural Credit Delivery: Performance and
Challenges Before Banks’, EPW, January 16, pp. 175-182. Rabade, Parag (2004), ’22 Maharashtra Farmers Commit Suicide’, Deccan Herald, July 18. Shah, Deepak (2000), ‘Primary Agricultural Cooperative Credit Societies in Maharashtra:
Some Emerging Issues’, Prajnan, Vol. 29, No. 1, April-June, pp. 31-51. ------- (2001), ‘How Far Credit Co-operatives are Viable in New Economic Environment: An Evidence from Maharashtra’, Prajnan, Vol. 30, No. 2, July- September, pp. 149-174. ------- (2003), ‘An Economic Evaluation of Agricultural Financial Institutions in
Maharashtra’, Artha Vijnana, Vol. 45, Nos. 3-4, September-December, pp. 185-296. ------- (2004), ‘Rural Credit Delivery System in Maharashtra: A Step Towards Rejuvenation’,
was presentation in the Panel No. 8 on ‘Intuitions and Agricultural Development’ of the 18th European Conference in Modern South Asian Studies (SASNET), held in Lund University, Sweden from July 6-9, 2004. (Full Paper at: http://www.sasnet.lu.se/EASASpapers/8 DeepakShah.pdf)
81

Shah, Rural Credit Delivery
------- (2004), ‘Financial Health of Credit Cooperatives in Maharashtra: A Case Study of
Sangli and Buldana Central Cooperative Banks’, paper in the 3rd International Cooperative Alliance (ICA) Regional Co-operative Research Conference, held in Chiangmai, Thailand, on Nov. 30, 2004. (Full Paper at: http://www.icaroap.coop/Publications/Publication%20PDF/Financial%20Health%20of%20Credit%20Co-operatives%20in%20Maharashtra.pdf
Sharma, Devinder (2004), ‘The Collapse of Green Revolution’, Deccan Herald, July 31. Shivamaggi, H.B. (1996), ‘Future Strategy for Development of Co-operatives’, Economic
and Political Weekly, Vol. XXXI, No. 20, pp. 1187-1188. ------- (2000), ‘Reforms in Rural Banking: Need for Bolder approach’, Economic and
Political Weekly, Vol. XXXV, No. 20, pp. 1714-1718. Thamarajakshi, R. (1999), ‘Agriculture and Economic Reforms’, Economic and Political
Weekly, Vol. XXXIV, August 14-20, p. 2293.
82

Suicide of Farmers in Maharashtra: Background Paper
Appendix 1 Annual Credit Plan Targets for Different Regions of Maharashtra: 2000-01
Regions (2000-01) Particulars Western
Maharashtra Vidarbha Marathwada Konkan Maharashtra
State
1. Agriculture & Allied Activities 2478.75 (59.34)
716.89 (53.09)
1073.39 (68.36)
178.31 (19.56)
4447.34 (55.53)
Of which - Crop Loans 1562.12 452.28 852.00 46.92 2913.32 2. SSI / NFS 337.40
(8.08) 70.71 (5.24)
103.00 (6.56)
158.37 (17.38)
669.48 (8.36)
3. Other Priority Sector 437.09 (10.46)
256.94 (19.03)
175.82 (11.20)
245.62 (26.95)
1115.47 (13.93)
4. Total Priority Sector 3253.45 (77.89)
1044.52 (77.35)
1352.21 (86.12)
582.30 (63.89)
6232.48 (77.82)
Of which - Employment Guarantee and Poverty Alleviation Programme
317.47 227.17 133.02 106.28 783.94
5. Non Priority Sector 923.60 (22.11)
305.91 (22.65)
217.95 (13.88)
329.19 (36.11)
1776.65 (22.18)
Grand Total (4+5) 4176.94 1350.43 1570.13 911.46 8008.96 Notes: (1) Amount in Crore Rs., (2) Figures in parentheses are percentages to the total plan targets for the state. Source: Computations are based on figures obtained from ‘Maharashtra State Annual Credit Plan’, Bank of Maharashtra,Pune, 2000-2001
83

Shah, Rural Credit Delivery
Appendix II Share of Crops in Total Loans Advances of PACS in Maharashtra: (2002-03)
Share in Total Crop Loan Advances stricts/ Region
Wheat Rice Jowar Pulses Other Food-grains
Total Food-grains
Cotton Oilseed Sugar-cane
Jute & Mesta
Other Non-Foodgrain
Total Non-Foodgrain
Amount of Loan
Advances
Western Region
Kolhapur - 7.78 0.17 0.06 0.91 8.92 0.09 0.85 89.27 - 0.88 91.08 1639694Solapur 0.90 0.11 2.13 0.14 4.90 8.26 1.77 5.71 71.24 - 13.01 91.72 3126131Sangli 0.76 0.30 12.48 - 2.27 15.80 1.48 4.64 49.63 - 28.45 84.20 2340053Satara 0.97 4.18 4.75 0.16 0.71 10.76 1.14 5.00 77.86 - 5.23 89.24 2298572Pune - 8.77 2.44 - 3.07 14.27 - 2.33 62.20 - 21.20 85.73 2788081Ahmednagar 1.49 0.04 25.36 0.22 1.09 28.22 0.10 0.64 69.77 - 1.27 71.78 683134Nasik 7.91 0.81 9.88 0.17 4.43 23.20 0.01 9.59 29.44 0.89 36.87 76.80 287316Dhule - - 34.14 4.85 0.76 39.75 22.04 23.78 14.28 - 0.15 60.25 210311Jalgaon - - 3.58 - 0.72 4.30 66.56 2.13 21.30 - 5.72 95.70 2486036 Total 0.64 3.03 5.68 0.13 2.31 11.79 11.47 3.88 59.88 0.02 12.96 88.21 15859328Vidharba Region
Yavatmal 1.97 - 17.38 - 1.47 20.82 43.15 20.26 11.50 - 4.27 79.18 249009Chandrapur - 65.62 - 2.81 1.58 70.01 25.52 4.32 - - 0.15 29.99 333478Bhandara 4.97 90.78 - - - 95.75 - - 4.25 - - 4.25 142786Nagpur 4.03 14.19 3.34 3.16 10.62 35.35 34.48 10.76 1.37 - 18.05 64.65 489706Wardha 1.97 - 17.38 - 1.47 20.82 43.15 20.26 11.50 - 4.27 79.18 249006Amravati 0.01 0.01 7.60 3.51 - 11.13 53.17 18.51 1.37 - 15.82 88.87 294592Akola - - 29.58 2.55 0.20 32.32 57.47 7.14 1.72 - 1.35 67.68 305002Buldhana - - 21.85 6.86 2.35 31.06 65.12 0.56 2.64 - 0.64 68.94 634799Gadchiroli - 80.16 - - - 80.16 - - - - 19.84 19.84 21324 Total 1.35 16.00 13.02 3.18 2.95 36.50 44.64 9.11 3.53 - 6.22 63.50 2719702Marathwada Region
Aurangabad - - 0.73 0.25 0.20 1.18 0.73 0.62 95.43 - 2.04 96.82 231572Jalna 3.09 - 4.94 1.39 3.35 12.77 50.85 2.47 33.90 - - 87.23 219809Parbhani 2.32 0.70 19.05 5.13 2.50 29.70 39.97 1.75 28.43 - 0.15 70.30 886002Beed 5.97 - 24.09 2.44 4.77 37.27 19.09 9.25 20.69 - 13.70 62.73 453560Osmanabad - - 7.38 7.50 - 14.87 - 12.87 71.52 - 0.74 85.13 875989Nanded 1.67 1.72 16.21 5.11 1.17 25.89 40.84 2.76 21.73 - 8.79 74.11 1036101Latur 1.89 2.24 5.40 6.96 1.24 17.73 0.81 18.77 33.49 0.35 28.85 82.27 1106108 Total 1.93 1.02 12.12 5.32 1.61 21.99 20.51 8.59 38.75 0.08 10.08 78.01 4809141Konkan Region
Thane - 100.0 - - - 100.0 - - - - - - 98802Raigad - 100.0 - - - 100.0 - - - - - - 46756Ratnagiri - 100.0 - - - 100.0 - - - - - - 215342Sindhudurg - 82.99 - - 11.74 94.73 - - 0.82 - 4.45 5.27 101177 Total - 96.28 - - 2.57 98.85 - - 0.18 - 0.97 1.15 462077Maharashtra State
0.97 5.91 7.71 1.52 2.24 18.35 16.85 5.35 48.04 0.03 11.38 81.65 23850248
Note: Amount in ‘000’ Rupees; Share in Per cent
Appendix III
CD Ratios of All-Scheduled Commercial Banks in Maharashtra – March 2005 Regions/Districts Name of the District Western Region Kolhapur (87.69); Solapur (74.29); Sangli (72.73); Satara (54.16); Pune (70.09);
Ahmednagar (73.88); Nasik (45.60); Dhule (74.64); Jalgaon (76.68) Vidarbha Region Yavatmal (57.69); Chandrapur (35.19); Bhandara (45.29); Nagpur (58.17); Wardha
(59.19); Amravati (46.36); Akola (70.29); Buldhana (83.54); Gadchiroli (41.36) Marathwada Region Aurangabad (81.80); Jalna (79.88); Parbhani (73.99); Beed (64.92); Osmanabad (50.93);
Nanded (58.13); Latur (70.03) Konkan Region Thane (43.31); Raigad (31.39); Ratnagiri (37.46); Sindhudurg (37.45) Note: Figures in parentheses are CD ratios per cent
84

Suicide of Farmers in Maharashtra: Background Paper
Farmers’ Suicides: A Media Perspective1
A VIEW OF MAIN FACTORS LEADING TO VIDARBHA’S AGRARIAN CRISIS
Vivek Deshpande2
This Version: 15 November 2005
Abstract
This paper identifies from a media perspective some of the main factors leading to the
agrarian crisis. Poor productivity due to factors like lack of irrigation, depletion in soil
fertility and vagaries of nature, lack of adequate market support, failure of supportive
government schemes due to their inherent flaws and political ad-hocism, ineffective farm
credit and insurance schemes, lack of timely government succour, absence of a strong
political lobby backing the farming community, a weak farmers’ movement, lack of agro-
processing units, absence of technological upgradation and lack of enterprise have been the
reasons for this crisis.
1 This has been prepared as a background paper for the study on ‘Suicide of Farmers in Maharashtra’ being conducted by the Indira Gandhi Institute of Development Research (IGIDR), Mumbai for the Government of Maharashtra. An earlier version was peer reviewed by two anonymous referees and also discussed in the interim workshop held on 18 August 2005 at IGIDR. 2 The author is a Special Correspondent with The Indian Express, Nagpur. He can be reached at [email protected]
85

Deshpande, Media Perspective
1. Introduction
We have been hearing for long how farmers have been caught in the vicious cycle of crop
failure and indebtedness. In Maharashtra, the problem appears to have aggravated severely
over the past about five years, with the result that many farmers chose the path of suicide to
escape it. The graph of deaths has been rising alarmingly since then. Obviously,
Maharashtra’s agrarian crisis has started boiling over. And mostly, farmers from Vidarbha,
particularly the cotton-growers, have been at the centre of this crisis.
The State government’s own data reveals over 800 farmers have ended lives over the past
five years. With nearly half of it happening over the past about two years, it’s quite evident
that the crisis is deteriorating faster of late. Interestingly, till date, only about one-fifth of
suicide cases have been found eligible for government aid. There are many doubting
Thomases, particularly in the government, who feel the media has been overplaying the
crisis. Many say the farmers are putting up a façade by citing agricultural reasons for their
taking the extreme step when the actual reasons are mostly personal. They are obviously not
looking at the issue with the kind of seriousness the situation demands. They need to ponder
why should farmers mostly from Vidarbha, that too from the cotton belt, have been
committing suicide, why have they been committing suicide in the last few years only, why
should there be spurt in suicide cases only during a particular time of the year, that is,
between the sowing and the harvest seasons (at sowing time, they are hard-pressed for money
and at the harvesting time, they go broke because of poor yield), and why are farmers shifting
from cotton to crops like soyabean.
While the government responds to problems like malnutrition deaths or natural disasters with
a bagful of schemes, the grave issue of farmers’ problems hasn’t yet evoked any fire-fighting
measures. The powers-that-be have, unfortunately, showed no sense of urgency to address the
issue.
In his press conference at Nagpur in September, 2005, Maharashtra’s Chief Minister Vilasrao
Deshmukh said the government needs to first find out the reasons behind the phenomenon
and a study has been instituted. It’s a bit too late in the day, but it has come all the same.
Sharad Pawar, who remains at the beck and call of the western Maharashtra farmers, visited
Vidarbha first time about an year-and-a-half (October, 2005) after becoming the Union
86

Suicide of Farmers in Maharashtra: Background Paper
Agriculture Minister. When reporters asked him for this delayed visit, he replied by saying:
“agriculture is a state subject.” So much for governance! The government, however, did
show the first signs of real seriousness when a young and suave Minister of State for
Agriculture Rana Jagjitsinh Padmasinh Patil travelled for three days along with the National
Commission on Farmers (NCF) led by its Chairman M S Swaminathan in Vidarbha’s
countryside immediately after Pawar’s visit, visiting families of the farmers committing
suicide and studying the problems faced by the farming community. And finally, the
government appears to have conceded, as the minister told the mediapersons at the end of his
tour, that the spate of farmers’ suicide indeed connects to the agricultural crisis faced by the
farmers and that the government’s latest decision to pay only the minimum support price
(MSP), and not the advance bonus, to cotton-growers needs an urgent revision.
The detailed analysis that follows in this paper is based on the news and views gleaned from
the reports appearing in the Nagpur media over the past about four years, apart from the
writer’s own understanding from his own sustained, regular coverage of the issue. It is worth
mentioning here that Dr Swaminathan’s views, too, coincided with almost all the points
raised by the media on this issue from time to time, thus lending them a great deal of
credency. The author has avoided mentioning basic statistical data like the number of farmers
and areas under cultivation etc, as these have been provided amply by other paper-writers.
The attempt here is to only grasp the ground realities influencing the farmers’ lives.
2. Reasons For The Crisis
The single most striking fact in the whole issue is that the overwhelming majority of those
committing suicide are of cotton farmers. Last year (2004), some orange and paddy
cultivators’ cases, too, were reported. Obviously, the crisis has been spreading. The reasons
are many and have piled up to critical levels over the past many years. Poor productivity due
to factors like lack of irrigation, depletion in soil fertility and vagaries of nature, lack of
adequate market support, failure of supportive government schemes due to their inherent
flaws and political ad-hocism, ineffective farm credit and insurance schemes, lack of timely
government succour, absence of a strong political lobby backing the farming community, a
weak farmers’ movement, lack of agro-processing units, absence of technological
upgradation and lack of enterprise have been the reasons for this crisis. Here, the region’s
contrast with western Maharashtra is, too, sharp to be missed. Despite being a deficient
rainfall area, agriculture in western Maharashtra has, by and large, been a success story. Good
87

Deshpande, Media Perspective
irrigation and a strong co-operative network especially in sugarcane, horticulture and animal
husbandry, coupled with strong political support, have ensured well-being of the western
Maharashtra farmer.
3. Irrigation Backlog
While each of the factors resulting in Vidarbha’s farming crisis has contributed in its own
way, there are some that stand out prominently. Poor irrigation, for instance, has been a major
cause for concern. Of the 59 lakh hectare cultivable land in the region, only 11,33,000 hectare
have been irrigated, when the achievable irrigation potential is to the tune of nearly 36,73,000
hectare (source: Vidarbha Statutory Development Board Member and former state minister
Madhukar Kimmatkar). Persistent and politically convenient clamour against the Forest
Conservation Act notwithstanding, many of the proposed projects have been stuck in the mire
of bureaucratic delays due to lack of much-needed political push. The biggest of them on
Vainganga river, called Gosikhurd, with a potential to irrigate 3 lakh hectares, is a very strong
case in point. Forget big dams, little effort is being made by the government or groups of
farmers and even the NGOs, to develop small watersheds. Examples like Haatgaon in
Yavatmal district, where farmers formed a water co-operative and built a medium-sized dam
with German Bank’s aid, are a few and far between. The result has been a poor yield of 2-3
quintals of cotton per acre, the lowest in the country. Moreover, the cotton grown is generally
a short-stapled one, considered by the cotton mills - the main buyers - as inferior.
4. MCPS: The Nemesis
The Monopoly Cotton Procurement Scheme (MCPS), designed in 1972 with a fixed-price
guarantee to the farmers to save them from the vagaries of market fluctuations and
unscrupulous traders by creating a network of co-operatives that would take care of the
scheme’s motto “cotton to cloth”, has been the single most important factor to influence the
lives of the farmers here - for the good in the initial two decades and for the worst in the past
more than a decade. With virtually the entire cotton industry coming up in Mumbai and
western Maharashtra, the “cotton-to-cloth” dream never realised. MCPS failed to achieve the
desired objective to create a symbiotic relationship between cotton industry and farmers, like
they have for sugarcane in western Maharashtra. As a result, there is no lobby of cotton
farmers.
88

Suicide of Farmers in Maharashtra: Background Paper
Today, with accumulated losses nearing Rs 5,000 crore, no ruling party dares to say that it
wants to continue the scheme. The Opposition clamour is for opposition’s sake. Privately
they, too, say the scheme isn’t “practical”. Barring the four paddy-producing districts in east
Vidarbha – Chandrapur, Gadchiroli, Bhandara and Gondia – cotton is the main cash crop for
farmers across the region. Slowly, however, as it has happened in most government schemes,
corruption started making inroads. Newspapers have been reporting about how graders made
money for certifying the cotton grade. Huge piles of cotton would be set on fire to tamper
with the evidence. In the last procurement season (2004-05), many farmers complained that
even the Bramha and Bunny varieties, which normally get the highest grade, couldn’t make it
this year as “the graders had specific orders from the government to avoid giving higher
gradation so that it doesn’t have to pay the Rs 2,500 per quintal to anyone and thus curtail the
bills to the extent possible.” The Maharashtra State Co-operative Cotton-growers’ Marketing
Federation, the official preocurement body, refuted the charge by saying that even those
varieties had poor staple length that year due to drought. The scheme degenerated into a
populist political tool in 1994 when then Sharad Pawar government started paying Rs 500 as
advance bonus over and above the minimum support price (MSP). The subsequent Shiv
Sena-BJP government had to continue it for obvious political reasons, without ensuring if and
how it was going to ensure the funds for it. Ideally, according to the Monopoly Act, it to be
paid from the profit earned by the scheme, if any. The hike, quite predictably, proved a bad
economics with the scheme running into losses that kept piling up each passing year due to its
incompatibility with the general order in prices. All this ultimately led to the farmer getting
their payments in instalments, and with crippling delays. This is where he got sucked into the
vicious cycle of borrowings - private and government - and repayments. With the banks
refusing to lend credit due to defaults, the farmer turned to private money-lenders, who often
doubled up as farm shop-keepers.
An ideal case that can be cited in this regard is that of Bhaurao Dandekar of Karanji in
Yavatmal district who took poison in the sowing season of 2004 as he was left with no one to
borrow from for the third sowing. And there were many like him who passed through a
similar situation and couldn’t cope with it. Presiding over this crisis, successive governments
were not able to muster enough courage to shake it off, with the result that, the MCPS losses
are currently pegged at a huge more than Rs 5,000 crore (Source: Cotton Federation
Chairman N P Hirani’s press conference at Nagpur in October, 2005). In 2003-04, the then
Vilasrao Deshmukh government did make a bold move by diluting the scheme and letting the
89

Deshpande, Media Perspective
private buyers in. Due to good price offered by them, and since the payments were made in
one go, the farmers sold almost the entire produce in the private market, saving the
government of a huge burden. But the very next year, political expediency staged a comeback
due to intervening elections and the government relapsed into the populist mode by
promising a ridiculously high price of Rs 2,700. Despite all its discrepancies, by and large,
the Vidarbha farmer still wants the MCPS to continue as “he is assured of a fixed price and
guaranteed one-time payment”. All he complains about is delayed and staggered payments.
Less wonder then if they once again clogged the market yards in the previous procurement
season. The scheme, implemented in its original form with the highest-ever price of Rs 2,500
per quintal, recorded the highest ever procurement figure of over 211 lakh quintals as against
the expected 150 lakh quintals.
The cash-strapped state government knew it had no funds to pay the farmer, but political
expediency had forced it to go ahead with the adventurous move. Nevertheless, as the
government price was much higher than the open market price, there was mad rush at the
agriculture producing marketing committees (APMC) yards. Meanwhile, conniving with the
yard staff, the traders made merry by procuring the farmers’ produce at low prices and then
selling it off to the Cotton Federation at government rate, thus pocketing the surplus. Many
farmers preferred to go to the traders as it fetched them one-time payment and saved them of
the cut from the payment on account of their past loan liabilities. Also, a record influx came
illegally from the neighbouring states. All this defeated the very purpose of the scheme to
give a bonus to the state farmers over and above MSP declared by the Centre. The farmers,
who went to the Federation yards, faced tremendous hardships. At many places, they had to
wait in queues for as long as seven days. Tired of the endless wait, Namdeorao Bonde (52)
committed suicide in Pandharkawada tahsil of Yavatmal district, the first reported case of its
kind.
The agonising wait was the proverbial last straw in indebted Bonde’s case.
For this year (2005), the government decided not to pay the advance bonus. Chief Minister
Deshmukh declared this quite resolutely at a press conference in Nagpur in September. Quite
obviously, the cash-strapped government, with a debt burden of over Rs 1.15 crore on its
head, is not feeling shy of saving its own skin and dumping the debt-wrecked farmer. Things
have, clearly, spun out of its control. Farmer leader Vijay Jawandhia points out that, had the
90

Suicide of Farmers in Maharashtra: Background Paper
government made provision for the amount of advance bonus in every year’s budget, what
now appear as “huge piled-up losses” wouldn’t have been there. Dipping cost-benefit ratio.
Another very important reason for Vidarbha’s farm crisis has been the growing costs of
inputs leading to escalation in the overall cost of production. As against this, the market
prices for the farm produces haven’t much gone up. This has badly affected the cost-benefit
ratio of not only cotton production, but many other crops. Prof Vinayak Deshpande of
Nagpur’s Post-Graduate Department of Teaching in Economics has demonstrated this aspect
in his paper.
The cost-benefit gap would be most severely evident in the current year as the government
has decided not to pay the advance bonus to the farmers. Clearly, the cotton farmer will be
getting only the MSP, which comes to Rs 1,980 per quintal for the highest grade cotton.
Since this grade of cotton is produced minimally in Vidarbha, the average price fetched by
most of the inferior grades of cotton taken together doesn’t go beyond Rs 1,600- 1,700. As
against it, the farmer is spending to the tune of Rs 2,200 on every quintal he is producing
(Source: Rajya Sabha questions). Thus, he is incurring a loss of at least Rs 500 per quintal in
the absence of the extra amount of advance bonus. The fact was prominently highlighted by
Dr Swaminathan during his Nagpur press conference. Even the Minister more than agreed
with this observation, saying a strong case exists for a rethink on the decision to pay only the
MSP. It remains to be seen though if the government changes its decision favourably in the
farmer’s interest in his hour of grave crisis.
5. Vicious Cycle Of Farm Credit
It has already been mentioned in the discussion on MCPS how farmers are forced to go to
private money-lenders due to their failure to pay off nationalised bank loans. But when so
many factors simultaneously compound the problem, even an innovative credit scheme can’t
work. An example of how such a scheme could be rendered ineffective under the kind of
circumstances that prevail in Vidarbha today was seen at Vijaygopal village of Wardha.
Many farmers there took the benefit of the Allahabad Bank’s credit scheme, which offered
them loans not only for farming but also for personal expenses like clearing previous loan
dues. But such was the severity of the drought this year in their area that they couldn’t reap
even 25 percent of the expected harvest. Naturally, they were left with nothing to pay back to
the bank this year. Having become defaulters, they were not eligible for a fresh loan from the
91

Deshpande, Media Perspective
bank this year and the vicious cycle of loan repayments would continue. The MCPS provides
for cutting the loan instalment amount from the payment to be made to the farmer against
procurement of his produce. The provision proved almost draconian, when in the worst-ever
drought of 2004-05, too, the government steadfastly refused to relax the norm for the year. As
mentioned earlier during the MCPS discussion, that prompted many farmers to sell off their
produce to private buyers.
6. Horticulture: How A Scheme Goes Awry
Another scheme that has wreaked havoc in the past few years is the state government’s
Horticulture Scheme launched in 1991 in the orange belt of the region. A classic example of
the fragmented approach of government planning, it offered huge subsidies, leading to
manifold increase in area under orange cultivation in a short time. The water-intensive crop,
however, soon gulped in huge quantities of groundwater through irrigation wells, with the
result that over the past five years, it has sunk to unfathomable depths. A round of the orange
region would reveal how desperate farmers have been openly flouting rules to sink borewells
to as deep as 1,300 feet below the ground, and with little success. Clearly, the scheme was
planned in an ad-hoc manner with no thought being spared for a parallel watershed
management. It took just over a decade for the scheme to spell doom for the farmers in the
orange belts of Nagpur and Amravati districts. To add to their woes were the Phytophthora
and other diseases that destroyed orange orchards across the region, forcing the orange
cultivators cut down lakhs of orange trees. It couldn’t have been more symbolic as the trees
found their way to Nagpur’s funeral ghats as firewood. The famous Nagpur mandarin is,
sadly, on its way out.
7. Lack Of Government Support, Insurance Against Vagaries Of Nature
The year 2004-05, according to Vidarbha farmers, was the worst they had seen from as far
back as they can recall. Farmers had to do two sowings in most of the areas and as many as
four Kharif sowings in certain pockets. And yet, they could harvest not even half of the
average yield (it was as low as 25 percent in many areas), soyebean being no exception.
What made the situation worse is lack of immediate government succour. Undoubtedly, the
state government hasn’t been fare to the Vidarbha farmer by not giving him timely support.
In 2004-05, the government inordinately delayed the assured Rs 1,000 per acre to marginal
farmers in the villages where the anewari (an index of the drop in production) is below 50
92

Suicide of Farmers in Maharashtra: Background Paper
percent. The Rs 20 crore assured to paddy cultivators in 2003-04, too, were given this year
only after there was a hue and cry in the State Legislature. The casualness was starkly evident
in the “phychological counselling” ritual it went through last year on a High Court directive.
A poorly informed team of government-counsellers, with virtually no understanding of the
farmers’ problems, went to select villages in the cotton district of Yavatmal to tell sparse
farmers’gatherings not to commit suicide as “hardships are inherent to lives and suicides
don’t lead us anywhere”.
8. Free Power Flew To The Rich In Western Maharashtra
Last year, the state government gloated “free power” scheme for farmers to fulfill the ruling
Democratic Front alliance’s “election promise”. The government’s own figures show how
most of the benefits went to rich farmers in western Maharashtra while the target
beneficiaries got virtually nothing. Of the total Rs 1,500 crore concession, Rs 900 crore went
to Pune and Nashik Divisions alone, which have the best irrigation network and highest
agricultural pumps per thousand hectare average (160 as against Vidarbha’s 92). Marathwada
got Rs 390 crore while the two Vidarbha divisions of Amravati and Nagpur received the
lowest share of only Rs 270 crore, MSEB figures reveal. There were no conditions of land-
holding. Naturally, the rich pocketed the greatest share and the scheme failed miserably as
most of the poor farmers, anyway, can’t afford to have a pump. For those poor farmers who
did have pumps, the scheme meant no benefits, what with there being no power available for
as long as nine hours at a stretch due to heavy load-shedding.
9. Lack Of Technological Support And Extension Of Research To Field
Vidarbha houses three premium institutes viz. Central Institute for Cotton Research (CICR),
National Research Centre for Citrus (NRCC) and the Punjabrao Krishi Vidyapeeth. Yet, the
farmer here continues to reel under crisis. Does he have any technological support from these
institutes? The answer from these institutes is as cliched as it can get: “We have mandate for
research, not for extension.” So, what are the technologies they have developed? CICR harps
on its Integrated Pest Management and Insecticide Resistance Management packages. It
claims to have worked wonders in some intervention villages in Wardha district, but admits it
hasn’t yet caught the imagination of farmers across the region. No doubt, the CICR has
developed some extremely useful technologies like fake Bt cotton as well as insecticide
resistance detection kits, but a vast majority of farmers is still out of its reach.
93

Deshpande, Media Perspective
The institute has been trying to develop its own Bt variety, but it has lagged way behind in
competition with multinational and Indian companies, which have swarmed across the fields
with their brands. It holds out a promise now with the effort appearing to bear fruits. It has
been able to introduce the Bt gene in the Bikaner Narma variety and is all set to hit the
market in two years from now. The farmers will have a variety this time, and not a hybrid,
seeds which he needs to buy afresh every year. Similar claims are made by NRCC too, but
extension remains the main gray area and the sad story of the death of orange continues
unabated.
CICR scientist admit that the most important of the areas – development of drought-resistant
cotton varieties for dryland farming regions like Vidarbha – has remained a far cry as far as
cotton research is concerned. There also are institutes like National Bureau of Soil Survey
and Land Use Planning (NBSS&LUB) in Nagpur, which have done a very useful study of
soil classification and its suitability. Whatever happened to that? Nobody knows.Training the
farmers in using such vitals technological inputs could have worked wonders, but alas!
10. Lack Of Strong Political Voice
Also to blame for the whole crisis is the political leadership of the region, particularly the
Opposition, which has done little beyond tokenism to salvage the farmers from this
seemingly unsurmountable crisis. By organising occasional road blocades for an impossible
Rs 2,700 per quintal to cotton farmers, they actually tried to score brownie points against the
ruling alliance than genuinely help the farmer. Journalists covering cotton know how
Opposition leaders “off the record” say that “the MCPS is not practical, but it gives them a
chance to get one up on the ruling government”. Their opposition, thus, is for opposition’s
sake and the farmers are mere pawns in the game of political one-upmanship.
Farmer’s organisations like Sharad Joshi’s Shetkari Sanghatana have remained too obsessed
with their political goals to genuinely do anything for the farmers. Gone are the days when
Joshi’sa one call could gather a crowd of lakhs of farmers. Today, he hardly attracts a few
thousand of them. Of late, while claiming that open market and globalisation are here to stay,
Joshi’s organisation staged some violent road blocades for the Rs 2,700 rate to cotton
farmers. Today, he appears to be fighting more for sugarcane than cotton farmers.
94

Suicide of Farmers in Maharashtra: Background Paper
There are farmer leaders like Vijay Jawandhia, who speak a lot of sense on the issue in
general. Jawandhia, a strong opponent of the extension of globalisation to agriculture, rightly
points out how politicians in western Maharashtra cut across party lines to lobby hard for
sugarcane farmers. Leaders like Sharad Pawar get the import duty on cane raised whenever
there is a crisis for cane farmers, but steadfastly refuses to increase the one on cotton, he
alleges. The government’s policy on sugar is one of protection. It controls the release of sugar
to check the fall in prices, but doesn’t bother about cotton dumping due to low import duty,
he argues. The import duty on sugar is 60 percent, but the Centre has always turned a deaf ear
to the demand to raise the one on cotton, which currently is a poor 10 percent. Now from
Cotton Federation to Marketing Minister, everybody has started clamouring for it, with little
effect. Erosion of farmers’ strength over the past decade and a half has helped the cotton
mills lobby call the shots, Jawandhia has another valid point. He says the situation wouldn’t
have come to this pass had the government regularly paid for the MCPS losses in annual
budgets. But with the state government itself going broke, it now appears a daunting task to
reverse the situation on its own.
11. Lack Of Individual Enterprise And Symbiosis With Industry
The Vidarbha farmer has had a poor history of enterprise. Though there are farmers doing
exceptionally good agriculture, they are working in isolation and are very few. Amidst
distressing stories of farmers’ suicides, a few farmers from villages on the fringes of Nagpur
have been earning to the tune of over Rs 40,000 a month by doing the highly lucrative radish
farming. Experiments like contract farming in cotton under the aegis of the Cotton
Corporation of India were initiated in a few villages, but they are not known to have achieved
spectacular results.
Also, despite the protective umbrella of MCPS, there has been virtually no growth of cotton-
based industry in Vidarbha. Ironically, despite the MCPS slogan of “cotton to cloth”, most of
the cotton mills came up in western Maharashtra. There is no symbiotic relationship between
the cotton farmers and the mills like that of the cane farmers with the sugar industry. The big
cotton consuming cloth mills, owned mostly by non-political private industrial houses, go for
the best deal in the international market, thus not bothering for the cotton farmers like the
sugar units owned by the politicians which protect the farmers’ interests by getting the
export-import policy to suit them.
95

Deshpande, Media Perspective
All these factors have combined to push the cotton farmer to the brink over the years.
Similar is the story of orange processing units. A huge spurt in orange production in the
ninetees couldn’t trigger the growth of these or exporting units in the region. All orange
processing units in the region have long downed shutters. This all-round failure has had a
crippling effect on the Vidarbha farmer who sees suicide as his only way out.
Irrigation first, experiments (Bt) later. In his hour of grave crisis, the “adopt-modern-
techniques” sermon sounds like the callous “eat-cake-if-you-can’t-eat-bread” advice. It is
only after the basic need for water is met that innovative techniques and technological
upgradations like Bt cotton could work. Bt pays only in irrigated patches and not in rain-fed
ones. That’s the reason why it has made a slow progress in Vidarbha, where of the 29 lakh
hectare under cotton last year, just about 34,000 hectare was under Bt. In the kind of financial
crisis that he is in, a price of Rs 1,600 per 450 gm is just impossible for the average Vidarbha
farmer to afford. If you sow this costly Bt in rain-fed patches, then the losses during droughts
could deal a crippling blow to the cultivators. Most of the farmers reporters, including this
author, have reported about in the past few years said they are too bogged down by the
financial crisis to afford the luxury of Bt experiment. Buts Bt is slowly but surely picking up
in the region. This year, the Bt area is four times that of the last year – 1.35 lakh hectare, as
per the government sources.
12. Crop Pattern
Another charge that the Vidarbha farmer faces is that he is slow in changing crop pattern.
Actually, the need for change in crop pattern was never so severely felt as over the last five
years. The Vidarbha farmers, however, seem to be shifting gears of late, though slowly. The
biggest example has been of soyabean, which is fast replacing cotton. The pace of this change
can be gauged from the fact that in Amravati Division of the region, it has gone up to over 9
lakh hectare this year (2005-06) compared to the normal Soyabean area of about 4.16 lakh
hectare.
13. Remedies
Now that a Minister has admitted that farmers are reeling under heavy debt, one of the first
thing the state government could do is release substantial funds for rural credit with the help
of Centre. Deputy Chief Minister R R Patil said the government is going to try that soon.
96
Suicide of Farmers in Maharashtra: Background Paper
There is an urgent case for reduction of interest rates on farm loans, as Dr Swaminathan
suggests. The government should also ponder waiving off part of the past loans if not the
whole of them. Also needed is relaxation in the condition for repayment of loans. The
defaulting farmers shouldn’t disqualify for fresh loans at least for the next one year.
Jawandhia, the Cotton Federation and NCF have suggested hiking import duty on cotton to
check dumping, but it doesn’t seem to have found any favours with the Central government.
It may well serve as a very effective remedy to help the farmers. As Swaminathan rightly
says, the cotton industry will have to play an affirmative role than merely look at their own
profits. A long-term plan for increasing irrigation in regions like Vidarbha and Marathwada
must be immediately unveiled and implemented. Without irrigation, even a dramatically
innovative rural credit scheme won’t work as pointed out earlier in this paper by citing the
case of Vijaygopal village.
Also, the current apparatus for extension of technology to the field seems to have gone awry.
The government needs to create a separate department for extension of research to farm and
hold it accountable for the job, which currently appears to be nobody's baby. By pressing into
service an army of trained personnel working as link between researchers and farmers, the
sagging farming scenario could be lifted from the depths it has fallen to. The governmental
research bodies, too, need to be held accountable for meeting the farmers’ needs. Currently,
they seem to be totally cut off from their target beneficiaries. As Dr Swaminathan suggests,
immediate reduction in insurance premiums for agriculture, which currently stand at 16
percent compared to one percent for non-farm enterprises, is a must. But if the government
schemes aren’t working and the politicians aren’t helping, then what do the farmers do?
Community and individual initiatives could also do the trick, like what Anna Hazare has done
at Ralegan Siddhi. But somebody has to lead the charge. The NGOs have a prominent role to
play here. They could help farmers do watershed management as first step in the direction of
freedom from habitual dependence on government. The government, too, needs to invest
heavily in this sector, with, ideally, no direct control. A strong government-sponsored
people’s movement could do the trick for Vidarbha’s crisis-ridden farming community.Of
course, it is not that the government can’t help innovatively. All it needs to do is listen to
some potentially useful suggestions by experts. At least one such idea from Vijay Jawandhia
could have worked wonders. Jawandhia had suggested that instead of doling out free power,
the government could have made available interest-free loan worth Rs 16,000 crore to the
97

Deshpande, Media Perspective
farmers and paid the Rs 1,600 crore it spent on free power towards interest. That could have
wiped out their entire loan burden. But the government needs to shed its bureaucratic inertia
to try out such novel ideas.
98

Suicide of Farmers in Maharashtra, Background Paper
Agrarian Scenario in Yavatmal, Washim and Wardha Districts1
Anjali P. Kulkarni, Vinayak S. Deshpande2
This Version: 8 August 2005
Abstract
In the three study districts there seems to be a shift from Cereals and Cotton to Pulses and
Soyabean. In general there is a significant backlog of irrigation in Vidarbha region. The
existing irrigated areas are largely under Sugarcane. Cotton cultivation requires credit.
Traditionally, Primary Agricultural Co-operative Societies provided this. In recent years,
moneylenders are also a prominent source of credit. Besides, Cotton cultivation is
increasingly becoming unremunerative – the increase in price is not commensurate with an
increase in costs. Further, the farmer has to largely depend on unregulated traders for seeds,
fertilizers and pesticides. To add to the price risk, 2004 also happened to be a rain-deficient
year in the selected districts and thereby exposing the farmers to yield risk also.
1 This has been prepared as a background paper for the study on ‘Suicide of Farmers in Maharashtra’ being conducted by the Indira Gandhi Institute of Development Research (IGIDR), Mumbai for the Government of Maharashtra. An earlier version was peer reviewed by two anonymous referees. This version is to be discussed in the interim workshop to be held on 18 August 2005 at IGIDR. 2 The authors research and teach at the Department of Economics, Nagpur University, Nagpur 440 010. They can be reached at [email protected] and [email protected] respectively.
99

Kulkarni and Deshpande, Agrarian Scenario
1. Introduction
Vidarbha, with an area of 97,404 sq. km. is one third of Maharashtra (3,07,713 sq.km.). The
area of Vidarbha is distributed between two revenue divisions i.e. Amravati (46,027 sq.km.)
and Nagpur (51,377 sq. km.) Out of the total geographical area of the region only 56,540
sq.km. is cultivable area. Area under the crops constitutes 57 per cent of the geographical
area, whereas area under forest works out to 28 per cent of the total area. Area under grazing
constitutes 7 per cent and area for miscellaneous purpose is that of 11 percent of the total
geographical area. In 2003, Vidarbha has an estimated population of 20.6 million, which is
one fifth of Maharashtra (93.7 million). Sixty per cent of State’s mineral production comes
from Vidarbha and 80 per cent of Forestland is in Vidarbha. It’s electricity generation is 2400
million units while it’s own requirement is 1100 million units leaving a surplus of 1300
million units which is supplied to rest of Maharashtra. Such a rich area of Vidarbha is
languishing in economic backwardness.
Vidarbha comprises 31.5% of the geographical area of the Maharashtra and nearly 22% of its
Population. Its contribution to the State Gross Domestic Product is between 16 & 17 per cent
on an average whereas it’s per capita income is about 25 % i.e. below the state average.
Vidarbha has several natural & geographical advantages. It has the largest mineral deposits,
the largest forest cover, largest thermal power generation, largest cotton and orange
production, largest untapped irrigation potential, largest industrial estate, centrally located,
basic infrastructure with good road, rail and air net work and a large trained manpower.
Cotton is one of the most important cash crops of Vidarbha and it can be said that Vidarbha
economy is linked to the economic condition of the cotton growers and cotton based
industries. More than 13 lakhs hectare in Vidarbha is under cotton cultivation as per the
information obtained for 2003-04. Out of this about 97 per cent is rain fed.
Vidarbha region which is rich in mineral and natural resources and self sufficient in most of
the agricultural products is unfortunately suffering in recent years in terms of reduction in
agriculture output and growing backlog of development within the state of Maharashtra.
Number of factors is responsible for the backwardness of the region. Farmers’ suicide has
shaken the policy makers and the social scientists. Number of attempts is being made to
analyse the problems of farmers’ suicide. In order to analyse the problem in depth changing
agrarian structure of the region needs to be studied. A study of three districts of the Vidarbha
100

Suicide of Farmers in Maharashtra, Background Paper
i.e. Yavatmal, Washim & Wardha, which have witnessed heavy incident of suicides may help
the policy makers to explain the current situation and to frame the suitable policies in future
to avoid recurrence of such kind of incidents.
Changing agrarian structure has far reaching impact on the socio-economic and psychological
fabric of the economy and on quality of life of the rural population. Suicides of farmers have
confirmed that increase in developmental activities in general will not help the individuals to
improve their quality of life. One of the important aspects of agrarian structure is its changing
pattern of cultivation of crops, which ultimately gets reflected in area allocated for the
various crops. Within crops food grains and cash crops ultimately influence the standard of
living of the rural area. Cash crops being the high yielding source of income, the tendency of
the farmers is to go for cash crops. The irrigation plays an important role in making choice
for the cash crops. The area under irrigation therefore plays a vital role in the agrarian
structure by influencing the political power equations and market strategies at micro and
macro level. The size distribution of land holdings and institutional finance formal and no
formal institutions catering to the needs of the farming community also play a major role in
shaping the agrarian structure. Input providers like seeds, fertilizers and pesticide suppliers
may also act as mediator in changing the pattern of crop cultivation. These input suppliers
may supply inputs on credit in order to boost up their sales also influence the cropping pattern
and may bring a substantial change in the power and water requirement for the various crops.
Suicide of farmers seems to be the reflection of the agrarian crisis, which the region of
Vidarbha is facing since last so many years. This agrarian crisis may be due to non-
availability of substantial irrigation facility, power, marketing facility, extension services, etc.
The districts of Vidarbha i.e. Yavatmal, Washim & Wardha has aroused lot of debate about
the root causes of farmers suicide. Investigations relating to the changing agrarian structure
are being made by the academicians, administrators and policy makers to identify the factors
leading to such a phenomena of suicide, which has occurred, on a massive scale.
In this background paper an attempt has been made to examine the changing agrarian
structure of the above mentioned three districts by incorporating some of the related variables
like cultivated and irrigated area under various crops, production and productivity of various
crops, institutional arrangement for agricultural finance, consumption of fertilizers, hybrid
varieties of seeds, etc. This information is collected broadly for the period of ten years i.e.
from 1995-96 to 2004-05. In some of the cases data are also collected at the tehsil level for
101

Kulkarni and Deshpande, Agrarian Scenario
these three districts. The study of the above-mentioned agriculture related variables might
help to study the rural economy and to identify and analyse the factors responsible for this
phenomenon of mass suicides.
2. Limitation of the Study
Availability of the time series data is one of the major limitations of this study. The data are
mainly collected from the Government offices and from the various reports prepared by
governmental and non-governmental agencies. In some cases there are data gaps also due to
non-availability of time series data. The problem was acute for the District Washim, which is
formed in the year 1998 and got separated from the earlier Akola District.
3. Economy of Suicide Prone Districts
The economy of three Districts i.e. Yavatmal, Washim and Wardha with high incidence of
suicides is dominated by the agriculture sector. Agriculture constitutes the main source of
livelihood to the majority of the population in the region. Lack of adequate development in
the non- agriculture sector/non farm sector has restricted the income and employment
generating opportunities to the rural population and compelled them to take recourse to
agriculture. Lack of adequate irrigation facilities in the region has further aggravated the
situation by making agriculture subject to vagaries of monsoon. The importance of
agriculture in these three Districts can be judge by analyzing some vital statistics of these
three Districts.
Gross cropped area of these Districts accounted for 8.98 per cent of the gross cropped area of
the State of Maharashtra. In the State Gross Irrigated Area constituted 15.4 per cent of the
gross cropped area. However irrigated area of these three Districts accounted for only 4.45
per cent of the gross cropped area in 2003-04 which is almost ¼th of the State average in this
respect. If the comparison is made with the total irrigated area of the State these three
Districts claimed only 2.60 per cent share in the total irrigated area of the State. Production of
foodgrains in these three Districts accounted for only 6.40 per cent of the total production of
food grains in the State. It is noteworthy that the share of these three Districts in the
production of foodgrains is marginally higher than their share in total area in relation to State
average. The yield per hectare, which can be taken as a proxy for productivity of food grains,
is higher in these three Districts as compared to State average. Thus, in spite of low irrigation
the yield per hect. of food grains is higher in Yavatmal, Washim and Wardha Districts as
102

Suicide of Farmers in Maharashtra, Background Paper
compared to State average. Studies, which have been conducted so far, have pointed out that
the incidence of suicides has a link with the cotton growing area. Therefore there is a need to
study area under cotton for these three Districts. In terms of area under cotton the share of
these three Districts is 20.36 per cent in 2003-04 in the State. However in production of
cotton they claim a lower share of 19.31 percent in the State. The yield per hect. of cotton is
lower (179.73 k.g. per hect) in these Districts as compared to State average of 190 k.g. per
hect. This may be a natural outcome of lower share of cotton in area as well as in production
in relation to State average. These three Districts also account for a very small share in
irrigated area under cotton in relation to State.
4. Changing cropping pattern
4.1 Foodgrains
Changing cropping pattern reflects the preferences of the farmers for a particular crop.
Substitution in terms of production of crops does take place depending on the number of
natural and manmade factors. The cropping pattern of three selected districts for two broad
categories of crops i.e. foodgrains and cash crops are considered in this section. The changes
in the cropping pattern have been examined at three points of time i.e. 1996-97, 2000-01 and
2003-04. Cropping pattern has been examined by measuring the share of food crops and cash
crops in gross cropped area. A further segregation of food grains has been made into two
broad categories i.e. cereals and pulses. Broadly, this would reflect change in the cropping
pattern within the category of food grains. In all the three districts under study the proportion
of area under food grains was in the range of 36% to 56% of the gross cropped area in the
year 1996-97. Washim district showed the highest proportion of area under food grains as
compared to Yavatmal and Wardha districts. There was a significant fall in the area under
cereals in all the three Districts in 2000-01 as compared to 1996-97. However the area under
cereals increased in the year 2003-04 in all the three districts. Highest growth in the area
under cereals as well as pulses was observed in Washim district. There is a substitution of
pulses for cereals to some extent as far as these three districts are concerned. Area under
Cereals has gone down whereas Pulses area has gone up during 1996-97 to 2003-04 (Table
1).
The behaviour of area under foodgrains does not show consistency in either direction in case
of Washim and Wardha districts. A rising trend in proportion of area under food grains is
observed in Yavatmal district. The share of area under cereals showed some uniformity in the
pattern of growth behaviour where fall in area is followed by rise in area for the time period
103

Kulkarni and Deshpande, Agrarian Scenario
under consideration. Area under Pulses showed consistently rising trend in case of Yavatmal
and Wardha districts.
Table 1 Changing Cropping pattern (% to GCA)
Area Yavatmal Washim Wardha 96-97 00-01 03-04 96-97 00-01 03-04 96-97 00-01 03-04 Foodgrains a) Cereals 32.44 14.23 23.12 49.72 6.33 16.23 29.06 14.83 18.79 b) Pulses 14.22 18.87 24.78 21.88 16.81 39.14 12.34 17.57 19.99 c) Total 40.82 41.93 42.27 56.08 49.68 55.37 35.78 35.95 31.85 Cash Crops a) Cotton 50.07 45.85 42.40 35.80 19.50 16.27 42.40 36.55 25.69 b) Sugarcane 0.84 0.76 0.63 0.24 0.52 0.26 0.18 0.91 0.67 c) Soyabean 3.66 7.77 11.04 12.53 15.11 26.21 15.76 35.25 40.12 d) Total 54.58 54.38 54.07 48.57 35.13 41.05 58.35 72.71 66.48
4.2 Cash Crops
Only three major cash crops i.e. cotton, sugarcane and soyabean have been selected to
indicate changes in the cropping pattern. These three crops constitute a major share (more
than 50%) in total area, under cash crops particularly in districts Yavatmal and Wardha.
Wardhsa district witnessed a significant rise in the area under three major cash crops from
58.35% in 96-97 to 66.48% in 03-04. However, its share in cash crop was highest i.e. 72.7%
in the year 2000-01. Yavatmal and Washim districts experienced a fall in their share of area
under cash crops for the study period. Washim district showed a major fall during 1996-97 to
2000-01.
Soyabean seems to be gaining preference for the farmers in terms of allocation of area under
cultivation in case of all the three districts. Area under Soyabean as a proportion of gross crop
area has more than doubled in all three districts during 1996-97 to 2003-04.
Thus these three districts have shown a major shift towards cultivation of cash crop in favour
of Soyabean and farmers are substituting this crop for Cotton. Thus economies of these three
districts seem to be mainly thriving on these three cash crops with a preference for Soyabean
in the recent period.
Surprisingly, the share of cotton crop i.e. the white gold of Vidarbha in all the three districts
is showing a declining trend. In all the three districts Yavatmal Washim and Wardha where
high incidence of suicides is reported, the area under cotton has significantly gone down in
104

Suicide of Farmers in Maharashtra, Background Paper
terms of GCA during the period of 1996-97 to 2003-04. Share of area under cotton crop has
declined significantly in Washim district. Yavatmal district showed continuous reduction in
the proportion of area under cotton reaching the level of 42.4 % in the year 2003-04. Thus,
from the above discussion, one can observe that in terms of allocation of area, cotton crop is
losing its earlier importance.
Sugarcane claims a small share in gross cropped area. In all the three districts it accounted for
less than one percent share.
5. Irrigation
Agriculture in Vidarbha is subject to vagaries of monsoon. Therefore, irrigation plays a vital
role in agrarian economy, which helps to minimize its adverse impact in the event of failure
of monsoon.
In all the three districts there is an increase in the proportion of gross irrigated area (GIA) to
gross crop area (GCA). Yavatmal and Washim districts experienced only a small growth in
the share of irrigated area for the period under consideration. However Wardha district
showed a spectacular rise in proportion of gross irrigated area to gross cropped area from
7.33% to 29.78% almost the four times growth. Distribution of irrigated area for foodgrains
and cash crops has been explained in the table no.2.
Yavatmal and Washim districts showed a growth in irrigated area under foodgrains. However
Wardha district showed a fall from 58% to 40% in the irrigated area under food grains.
Cereal claimed a major share in the irrigated area under food grains. In Washim district its
share was as high as 90% in the year 1999-00. In the all the three districts, even though the
irrigated area under pulses claims a smaller share as compared to Cereals, the proportion of
irrigated area under pulses has shown a tendency to rise in the recent period.
5.1 Irrigated area under cash crops
Yavatmal and Wardha districts showed a rising tendency of irrigated area under cash crops to
gross irrigated area. Whereas,Washim district shows a falling tendency for the same. Wardha
district experienced more than three times growth in proportion of irrigated area under cash
crops. It shows a change towards cropping pattern in favour of cotton. In case of this crop the
proportion has showed an increase from 1 per cent in 1995-96 to 24.83 % in 2000-01. The
105

Kulkarni and Deshpande, Agrarian Scenario
area under sugarcane has showed a tendency to go down indicating thereby substitution of
cotton for sugarcane for the above period.
Yavatmal district showed a small rise in irrigated area under cotton whereas Washim district
exhibited a marginal fall in the irrigated area under cotton. In case of sugarcane, Washim
district witnessed a significant fall in irrigated area from 10.69 % in 1995-96 to 1.89 % in
1999-00. Share of irrigated area under sugarcane has remained almost constant in Yavatmal
district.
The proportion of irrigated area under cotton to gross irrigated area accounts for a very small
share, less than one percent in Washim district. However, Yavatmal and Wardha districts
showed a relatively satisfactory situation. Irrigated area under cotton crop showed a
spectacular rise from 1.0% to 24.83% from 1995-96 to 2000-01 in case of Wardha district
and from 9.85% to 12.90% growth in irrigated area under cotton in case of Yavatmal district.
Table 2 Changing Cropping pattern, Irrigated Area (Percentage)
Area Yavatmal Washim Wardha 95-96 99-00 02-03 95-96 97-98 99-00 95-96 97-98 00-01
Foodgrains a) Cereals 40.26 36.31 45.94 54.44 71.50 90.05 46.07 43.55 24.75 b) Pulses 4.26 5.93 8.39 6.04 5.68 13.74 12.44 9.32 15.25 c) Total 44.52 42.25 54.33 60.48 77.18 103.79 58.52 52.87 40.00
Cash Crops a) Cotton 9.85 0.58 12.90 1.24 0.49 0.41 1.0 0.84 24.83
b) Sugarcane 21.23 21.79 20.73 10.69 2.67 1.89 7.0 7.94 2.22 c) Total 31.08 22.37 33.63 11.93 3.16 2.30 8.0 8.78 27.05
% of GIA to GCA
4.41 4.47 4.83 2.53 3.85 4.50 7.33 8.42 29.78
As compared to cotton, sugarcane accounted for a significantly higher share in irrigated area.
Washim and Wardha districts claimed less than 10% share in irrigated area under sugarcane
except for the year 1995-96 in Washim district. However, Yavatmal district showed a
marginal fall in its share as far as irrigation is concerned. Surprisingly, share of irrigated
sugarcane is higher in Yavatmal, Washim and Wardha districts than cotton in both the time
periods under consideration, except for the period 2000-01 in case of Wardha District. In this
District, the share of cotton for the period was significantly higher (24.83 percent) than
sugarcane 2.22 per cent. The information relating to this is presented in Table 2.
6. Credit Scenario
106

Suicide of Farmers in Maharashtra, Background Paper
6.1 Primary Agriculture Credit Societies (Loan for Cotton Cultivation)
Credit plays a critical role in agrarian structure of the rural economy. Lack of irrigation
facilities coupled with erratic behaviour of monsoon necessitates strengthening the rural
credit networking system to small and marginal farmers in the region. In the extension of
credit facilities to the farmers the role of informal as well as formal sources of finance need a
separate inquiry.
Timely & adequate availability of loan plays a vital role in the institutional credit given to
agricultural sector. Analysis of crop-wise distribution of loan is important in this context.
Distribution of loans among food & cash crops shows that in Wardha District around 43 to 45
per cent of loans given by the Prima Agricultural Credit Cooperatives are given for cotton
cultivation for the period 1992-2003. Wardha, Selu and Aarwi are the Tahsils where the
maximum beneficiaries are found for the cotton crop loan. In Washim as well as in Yavatmal
Districts the major portion of loan is given for cultivation of cotton. Sugarcane, which is
another cash crop of a region, has received a smaller share in total loans disbursed by the
District Primary Agriculture Cooperative Societies. Tables 3 and 4 show the distribution of
loans for food crops and cash crops for the three districts i.e. Yavatmal, Washim & Wardha.
Table 3
Distribution of loan provided by District Primary Agriculture Co-Operative Societies: Cash & Food Crops
District Year % share of Cash Crops % share of Food Crops Yavatmal 31-3-99 75.91 24.09 31-3-04 55.12 44.88 Washim 31-3-99 63.51 36.49 31-3-04 47.48 52.52 Wardha 31-3-99 54.89 45.11 31-3-01 54.65 45.35
The share of loan provided for the foodcrops has been observed to be rising for Yavatmal and
Washim Districts during 1999 to 2004. However, for Wardha District it has remained almost
constant. In case of cash crop there is a significant fall in the share of cash crop for Yavatmal
and Washim Districts, with Wardha District showing almost constant share. For all the years
mentioned in the above table the proportion of loan given for cash crops stands at the higher
level with exception of Washim District for the year 2004. The distribution of loan for two
major cash crops i.e. Cotton and sugarcane is shown in the following table.
107

Kulkarni and Deshpande, Agrarian Scenario
Table 4 Distribution of loan provided by District Primary Agriculture Co-Operative Societies: Cash Crops
District Year % share of Cotton
% share of sugarcane
Yavatmal 31-3-99 69.77 30.23 31-3-04 72.75 27.25 Washim 31-3-99 97.64 2.36 31-3-04 99.34 0.66 Wardha 31-3-99 81.81 18.19 31-3-01 78.95 21.05
Yavatmal and Washim Districts observed a significant rise in the share of loan provided for
cotton. However, Wardha showed a fall in the share provided to the cotton. Amongst cash
crops proportion of loan provided for cotton is on the higher side than the sugarcane. Though
Wardha experienced a rise in its share of area under cotton cultivation to GCA, its share in
cotton loan has significantly gone down. On the contrary the share of loan provided for
sugarcane cultivation has significantly improved though area for this crop has gone down in
total irrigated area. (Table 2)
Primary Agriculture Cooperative societies have provided maximum amount of loan for cash
crops. On an average in the district Yavatmal from 1996-02 near about 75% of the total loan
is provided for cash crops. Foodcrops constitute lower proportion. Amongst cash crops
maximum loan is provided for cotton crops in Yavatmal district. Near about 70% of the total
loan is normally provided for cotton in Yavatmal district. Similar trend has been observed in
other two districts i.e. Washim and Wardha. In the district Washim more than 95% loan is
provided for cotton amongst cash crops. The share of cash crops in total loan constitute near
about 64% on an average in the district Washim. In the year 2004, in both the districts
Yavatmal and Washim, there is a reduction in the share of loan for cash crops. In the district
Wardha near about 55% of the total loan is provided for cash crops. In this district also the
share of loan provided for cotton crops is on the higher side.
6.2 Loans per hectare for Cash Crops
Table 5 gives the information relating to loan per hector of area under cotton. It can be seen
that there is a rising trend of loans per hectare for all the three districts under study except for
the year 2001 in the District Wardha, in which there is a marginal fall over the earlier year.
108

Suicide of Farmers in Maharashtra, Background Paper
The district Washim indicates the maximum amount of loan per hector provided to the
farmers followed by Wardha.
Table 5
Loan per hecare of area under cotton (Rs per hectare) Year Yavatmal Washim Wardha 1998 268.00 - 449.64 1999 261.00 - 590.47 2000 268.00 820.72 - 2001 272.00 988.10 571.50 2002 282.00 1068.58 718.80 2003 - 2173.00 970.00
6.3 Role of financial institutions in providing loans to agriculture sector
Many financial institutions including National Bank for Agriculture and Rural Development
have been playing a major role in providing financial support to rural areas. Their role in
supplying loans to farmers for various activities has also been considered in this section.
Three aspects of priority sector lending i.e. Crop loan, agriculture credit and no farm lending
are analyzed.
6.4 Credit for Crops
Credit provided for crop loan in three Districts under consideration for two years i.e. 2002-03
and 2003-04 is presented in Table 6. At an aggregative level there was 32.36 percent growth
in crop loans given by various Institutions like CBs, ADCCB and RRB. The highest growth
in crop loans is observed in case of Wardha District, which is 180.22 percent whereas
Washim District showed a negative growth of the order of 1.28 per cent during the above
period. Yavatmal District showed a moderate growth of 16.42 per cent. The share of
Yavatmal and Washim Districts showed a reduction in their share of crop loans over a period
of one year. Whereas, Wardha District experienced more than doubling of it’s share during
this period.
Table 6 Institutional Credit for Various Crops, Rs.Lakh
Year Yavatmal Washim Wardha Crop loans s & total loans
2002-03 12732.70 (63.91) 4739.94 (23.79) 2451.20 (12.30) 19923.84 (100) 2003-04 14823.46 (56.20) 4679.21 (17.74) 6868.87 (26.04) 26371.54 (100) % Change 16.42 -1.28 180.22 32.36
109

Kulkarni and Deshpande, Agrarian Scenario
6.5 Agriculture Credit
In terms of total agriculture credit there was 11.89 per cent growth in all the three Districts
taken together (Table 7). Yavatmal District showed highest growth in Agriculture Credit
(14.81 per cent) followed by Wardha District. However, Washim District showed only
marginal growth of 1.09 per cent in total agricultural credit. There is insignificant rise in the
share of Yavatmal and Wardha Districts in the total agricultural credit. The share of Washim
District, on the contrary, is reduced during the period under consideration.
Table 7 Total Agriculture Credit (Rs. Lakh)
Year Yavatmal Washim Wardha Total 2002-03 18433.93 (58.28) 5224.66 (16.52) 7970.77 (25.20) 31629.36 (100) 2003-04 21164.44 (59.80) 5167.53 (14.60) 9058.00 (25.60) 35389.97 (100) % Change 14.81% 1.09% 13.64 11.89%
6.6 Credit to Non Farm Sector
Development of Non-farm sector helps to provide a cushion during the crisis situation in
agriculture sector. It has been been observed that regions where Non Farm activities are
undertaken, the severity of the problems gets reduced and rural people at least earn their
livelihood through these activities. Institutional credit provided to Non Farm Sector is
therefore analyzed with the help of Table 8.
Table 8 Credit to Non-Farm sector (Rs.in Lakh)
Year Yavatmal Washim Wardha Total 2002-03 3097 (76.12) 225.69 (5.55) 745.72 (18.33) 4068.41 2003-04 2776 (87.05) 32.66 (1.02) 380.56 (11.93) 3190.02 % Change -10.36 -85.53 -48.97 -21.59
The share of Yavatmal in the Non-farm credit stands at the highest level of 76.12 per cent in
the year 2002-03. In other two Districts i.e. Washim and Wardha it is 5.55 per cent and 18.33
percent respectively. Yavatmal District experienced growth in it’s share, whereas Washim
and Wardha Districts observed a fall in their share of Non farm Credit in the same year. All
the three Districts experienced negative growth in Non Farm Credit. In Washim District the
fall in the share of its credit is maximum (85.53%) followed by Wardha (48.97 %).
110
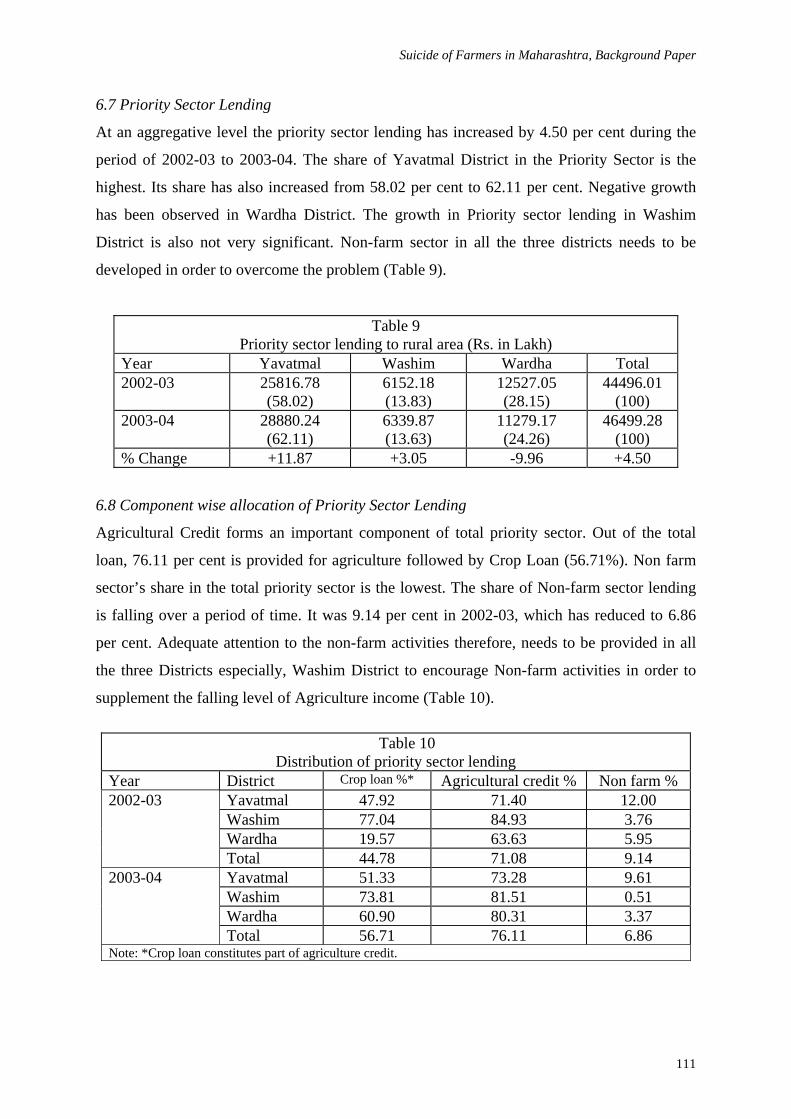
Suicide of Farmers in Maharashtra, Background Paper
6.7 Priority Sector Lending
At an aggregative level the priority sector lending has increased by 4.50 per cent during the
period of 2002-03 to 2003-04. The share of Yavatmal District in the Priority Sector is the
highest. Its share has also increased from 58.02 per cent to 62.11 per cent. Negative growth
has been observed in Wardha District. The growth in Priority sector lending in Washim
District is also not very significant. Non-farm sector in all the three districts needs to be
developed in order to overcome the problem (Table 9).
Table 9 Priority sector lending to rural area (Rs. in Lakh)
Year Yavatmal Washim Wardha Total 2002-03 25816.78
(58.02) 6152.18 (13.83)
12527.05 (28.15)
44496.01 (100)
2003-04 28880.24 (62.11)
6339.87 (13.63)
11279.17 (24.26)
46499.28 (100)
% Change +11.87 +3.05 -9.96 +4.50
6.8 Component wise allocation of Priority Sector Lending
Agricultural Credit forms an important component of total priority sector. Out of the total
loan, 76.11 per cent is provided for agriculture followed by Crop Loan (56.71%). Non farm
sector’s share in the total priority sector is the lowest. The share of Non-farm sector lending
is falling over a period of time. It was 9.14 per cent in 2002-03, which has reduced to 6.86
per cent. Adequate attention to the non-farm activities therefore, needs to be provided in all
the three Districts especially, Washim District to encourage Non-farm activities in order to
supplement the falling level of Agriculture income (Table 10).
Table 10
Distribution of priority sector lending Year District Crop loan %* Agricultural credit % Non farm % 2002-03 Yavatmal 47.92 71.40 12.00 Washim 77.04 84.93 3.76 Wardha 19.57 63.63 5.95 Total 44.78 71.08 9.14 2003-04 Yavatmal 51.33 73.28 9.61 Washim 73.81 81.51 0.51 Wardha 60.90 80.31 3.37 Total 56.71 76.11 6.86 Note: *Crop loan constitutes part of agriculture credit.
111

Kulkarni and Deshpande, Agrarian Scenario
6.9 Role of Moneylenders in providing financial support
In spite of the plethora of financial institutions operating in rural areas for providing credit to
agriculture sector there is no marginalisation of the role of informal credit institutions.
Moneylenders are still more accessible and timely credit providers in the rural areas. The
number of moneylenders operating in the three districts has almost remained constant during
the period of 1999 to 2003. Of course, considering the requirement of credit in the rural area,
the increase in number of moneylenders is not very high but their importance and role has
almost remained constant over a period of time. At the district level it has been observed that
moneylenders are providing maximum amount of loan to the individuals other than traders.
The information relating to role of moneylenders is summarized in Table 11.
Table 11
Loans Provided by Money Lenders Year No. of money
Lenders % of loan to
farmers % of loan to non
farmers 31-3-1999 158 83.24 17.56 31-3-2000 166 83.71 16.29 31-3-2002 149 91.25 8.75 31-3-2003 157 83.74 16.26
The moneylenders provide the maximum amount of loan to the farmers in all the years under
consideration. In the year 2002, it is 91.25 per cent of the total loan given to the farmers’ non-
farmers received the marginal share in the total loan. This shows that the farmers are
ultimately the beneficiaries as well as the individuals who come under the clutches of the
moneylenders.
The informal credit institutional framework is still dominating the rural credit lending.
However considering the demand side and the number of farmers who need to take loan,
moneylenders are fulfilling only the partial requirement of the farming community.
7. Area under Hybrid Crops
Extension of area under hybrid crops may increase input intensity of crops, which may, in
turn, increase demand for more loans. Therefore it is essential to study the area under hybrid
crops and its changing share over a period of time.
Cotton and Jawar are two main hybrid crops of the region. The area under hybrid cotton
shows yearly fluctuations in Yavatmal and Washim districts. In case of Wardha there is an
112

Suicide of Farmers in Maharashtra, Background Paper
increase in the area under hybrid cotton. No consistent pattern has been observed in terms of
area under hybrid cotton for the three districts. Washim showed an increase in the area till
2001-02 but later on there was a fall in the area under hybrid cotton. In the year 2001-02, in
the district Yavatmal, more than 93% area was diverted for hybrid cotton but in the next time
period there was a reduction by almost 4%. Washim district witnessed a rise in the share to
75.29% in 2001-02 from 40.33% in 1999-2000. Wardha district also observed a growth in the
share of area under hybrid cotton to total area under cotton from 61.61% in 1998-99 to
78.35% in 2000-01. This was followed by a reduction in the area insignificantly (Table 12).
Table 12
Area under Hybrid Cotton to Gross Area Under Cotton Sr. No.
District Year % of Hybrid cotton to total cotton
% of Hybrid Jawar to Total Jawar
1 Yavatmal 1995-96 n.a. 0.00 1996-97 n.a. 66.78 1999-00 85.66 - 2000-01 77.69 - 2001-02 93.10 - 2003-04 89.23 n.a. 2 Washim 1998-99 69.68 1999-00 40.33 - 2000-01 n.a. - 2001-02 75.29 - 3 Wardha 1996-97 n.a. 88.17 1997-98 n.a. 94.18 1998-99 61.61 n.a. 1999-00 74.04 86.33 2000-01 78.35 75.39 2001-02 77.53 79.88
8. Distribution of chemical fertilizers by different institutions
Distribution of fertilizers by a specific type of institution plays a strategic role in the agrarian
economy. Private institutes play a role of moneylenders in disguised form in the distribution
of fertilizers and have become a source of exploitation for the farmers. In order to find out the
role of institutions in supplying fertilizers, the information is collected for the distribution
undertaken by the regulated institutions and by the private institutions. The information
relating to distribution of chemical fertilizers is presented in Table 13.
113

Kulkarni and Deshpande, Agrarian Scenario
Table 13 Distribution of Chemical Fertilizers by Institutions (% to total)
Year Regulated Institutions Private Institutions 1998-99 32.50 67.50 1999-00 31.30 68.70 2001-02 27.45 72.50 2002-03 27.62 72.38
From Table 13 it can be seen that the ongoing process of privatization is affecting the rural
area of the three selected districts also. For all the three districts it seems that regulated
institutions are loosing their importance and this can be evidenced from the fact that their
share has declined from 32.50 per cent in 1998-99 to 27.62 per cent in the year 2002-03.
Private institute dominated the distribution process of chemical fertilizers. Their share
improved from 67.50 per cent to 72.38 per cent during 1998-99 and 2002-03. The use of
chemical fertilizers in general is rising and the private players are dominating the supply of
chemical fertilizers.
9. Gross Value of Output
Income from various crops to some extent decides the cropping pattern of the rural sector of
the economy. With recent trends towards market orientation, the realization of the
monetory/market value of the product becomes a major consideration of substitution of one
crop for the other as well as the changes in the area under crop. In the present analysis gross
value of output has been estimated by taking the data of production and annual average
market prices of the product. The estimates are made for gross value of output per hector. In
relation to selected food and cash crops. The following table shows the variations in gross
value of output of major crops for the selected three Districts of Vidarbha region. The gross
value of output for three major food crops i.e. Rice, Jawar and Wheat has shown wide
fluctuations for the period under consideration.
Table14
Gross Value of Output for major Food crops (Rs. Per hectare) Year Yavatmal Washim Wardha Total 1998-99 28404.09 23954.58 24703.79 77062.46 2002-03 22014.84 19465.50 23417.98 64898.32 % change -22.50 -18.74 -5.20 -15.78
From Table 14 it can be seen that there is a reduction in the gross value of major food crops
within four years by 15.78 percent. However, there is no consistent variation in the value of
114

Suicide of Farmers in Maharashtra, Background Paper
gross output in either direction. Farmers do make variations in selection of crops every year
depending on their own way of making calculations relating to the rate of returns. The
variations can also be explained in terms of fluctuation in market prices of selected crops and
their production. District wise information shows that the highest fall in the gross value of
output is witnessed in Yavatmal District. The fall in income from cultivation of food crops
might have changed the cropping pattern of Yavatmal District to some extent towards
cultivation of cash crops like cotton or soyabean. Almost same trend has been observed in
Washim as well as in Wardha District.
The gross value of rice per hectare shows a drastic fall in Washim District followed by
Yavatmal District. Only Wardha District shows some rise in the gross value of output of rice.
If the variations in the average annual market price of rice are observed they are very small.
For a major period the price of rice per hectare has almost remained constant except in 2003-
04 where a significant fall in the market price from Rs. 1160/- per quintal in 2002-03 to Rs.
1026/- per quintal in 2003-04 has been observed. Thus, a fall in the gross value of rice in
Wardha District cannot be attributable entirely to the fall in market price of rice (Table 15).
Table 15 Gross Value of Output-Rice Per hectare (Rs.)
Year Yavatmal Washim Wardha Total 1998-99 8654.88 7134.40 6126.40 21915.68 2002-03* 7447.20 3669.66 (99-00) 7563.20 (01-02) 18680.06 % change -13.95 -48.56 23.45 -14.76 Note: * The latest year for Washim and Wardha are 1999-2000 and 2001-02 respectively.
Other major food crop i.e. Wheat shows 48.48 percent growth in gross value of output in
2002-03 over 1995-96. Yavatmal District experienced only 35.88 per cent growth in gross
value of wheat, whereas in Wardha and Washim districts 59.81 per cent and 50.35 per cent
growth has been observed respectively (Table 16).
Table 16 Gross Value of Output-Wheat Per hectare (Rs.)
Year Yavatmal Washim Wardha Total 1995-96 6731.49 6483.27 6406.44 19621.20 2002-03* 9146.85 9747.82 10238.09 29132.76 % change 35.88 50.35 59.81 48.48 Note: * The latest year for Washim and Wardha are 1999-2000 and 2001-02 respectively.
115

Kulkarni and Deshpande, Agrarian Scenario
In case of Jawar only 0.44 per cent growth in gross value of output is observed for the period
under consideration (Table 17). Washim District reported negative growth in gross value of
output (-20.3%), whereas Yavatmal District showed 39.13 per cent growth in gross value of
output.
Table 17
Gross Value of Output-Jawar Per hectacre (Rs.) Year Yavatmal Washim Wardha Total
1995-96 3896.20 7588.35 5524.75 17009.30 2002-03 5420.79 6047.65 5616.69 17085.13 % change 39.13 -20.30 1.66 0.44
10. Changes in Market Prices
The behaviour of market price for these two major food crops shows significant yearly
variations. Price of wheat depicted a rise from Rs.590 per quintal in 1995-96 to Rs. 893 per
quintal in 2001-02. However there was a fall in price to Rs.858 and to Rs.867 in the
subsequent years. Thus in general there is a rise in price of Wheat for the period under
consideration. Price of Jawar also showed a rise from Rs.385 to Rs. 576 in 1999-00 over
1995-96. However in subsequent period, fluctuations in either direction has been observed in
it. The behaviour of cotton prices shows a consistent rise from Rs.1145/- in 1995-96 per
quintal to Rs.2115/- per quintal in 2000-01. However after this period there is continuous fall.
The data about the market prices of selected food crops and cotton are shown in Table 18.
Table 18 General Average Annual Market Prices of Selected Food Crops & Cotton
(Price in Rs. per quintal) Commo-dity
95-96 96-97 97-98 98-99 99-00 00-01 01-02 02-03 03-04
Rice - - - 1168 1120 1102 1132 1160 1026 Wheat 591 737 745 773 785 824 893 858 867 Jawar 385 441 406 534 576 467 486 419 459 Cotton 1145 1175 1320 1421 1565 2115 1449 1789 ---- Soyabean 925 - 946 817 861 1001 1128 1332 1529 Note: These prices are taken from Kalmna Market representing Vidarbha’s Market for agriculture produce.
11. Gross Value of Cotton per hectare
Cotton is considered to be the major cash crop of the economy of Vidarbha and it influences
the overall growth of the agriculture sector of the region. The estimates of gross value of
116

Suicide of Farmers in Maharashtra, Background Paper
output of cotton for the above mentioned three Districts of Vidarbha showed a rise from Rs.
4751.75 of 1995-96 to Rs. 8232.87 for the year 2001-02 (i.e. 73.26 per cent growth). Wardha
District observed highest growth in the gross value of output i.e. 111.35 per cent. Washim
district showed 72.48 per cent rise in value of output per hect. whereas Yavatmal District
indicated lowest growth in the gross value of cotton. (37.73 per cent) during the period 1995-
96 to 2001-02 (Table 19).
Table 19
Gross Value of Cash Crop- Cotton (Rs. Per hectare) Sr. No. Year Yavatmal Washim Wardha Total 1 1995-96 1545.75 1728.95 1477.05 4751.75 2. 2001-02 2128.91 2982.15 3121.81 8232.87 3. % Change 37.73 72.48 111.35 73.24
The growth in the gross value of output may be partially due to rising prices of cotton. The
net value of income from cotton depends on the cost of production incurred by the farmers.
The available data at the Maharashtra level show that cost of cultivation per hect. is rising
continuously over a period of time for all varieties of cotton. Cotton as a cash crop can
improve the standard of living of farmers provided their net earnings go up. Existing cost
structure does not ensure profitability to the cotton growers at the current market prices.
12. Crop Economy: Growth of Area, Production and Productivity
Since the economy of the selected districts thrives mainly on agriculture, the behaviour of
agricultural production, productivity and area under the cash crop needs to be analyses. An
attempt has been made to estimate the compound growth rate of area, production and
productivity under the major cash crop i.e. cotton. This is one of the cash crops of the region.
The growth behaviour of cotton has a major impact on the cash economy of suicide prone
area. The behaviour of area under cotton shows a declining trend in terms of compound
growth rate. It has reduced from 1.01 per cent in 1961-95 to 0.99 per cent for the entire
period of 1961 to 1999. However, upto 1997, there is some rising trend, though marginal in
terms of area under crop. The compound rate of growth for the year 1961-97 has been
estimated at 1.02 per cent as compared to 1.01 per cent for 1961-95. Thus, the fall in the area
seems to be mainly concentrated in the later period i.e. from 1997 onwards. Table 20
provides information relating to compound rate of growth of area, production and
productivity.
117

Kulkarni and Deshpande, Agrarian Scenario
Table 20 Compound Growth Rate of Area, Production & Productivity (Cotton)
District Area Production Productivity 1961
-95 1961
-96 1961
-97 1961
-98 1961
-99 1961
-95 1961
-96 1961
-97 1961
-98 1961
-99 1961
-95 1961
-96 1961
-97 1961
-98 1961
-99 Yavatmal 1.01 1.00 1.02 1.00 0.99 2.13 2.10 2.27 2.08 2.03 1.11 1.08 1.24 1.07 1.03 Wardha -0.59 -0.53 -0.55 -0.58 -0.63 3.59 3.62 3.68 3.22 3.02 4.19 4.17 4.25 3.83 3.67 Parbhani 0.36 0.38 0.49 0.59 0.67 2.75 2.88 3.12 2.10 3.24 2.37 2.49 2.62 2.49 2.55 Maharashtra -0.06 -0.17 -0.09 0.01 0.09 1.55 1.68 1.94 1.90 2.02 1.60 1.75 1.97 1.79 1.83
The estimates of compound growth rate of production, for Yavatmal District shows the same
tendency as that of area. From 2.13 per cent in 1961-95, it has increased to 2.27 per cent in
1961-97. However, for the period of 1961-99 there is a fall in the compound growth rate in
production to 2.03 per cent.
Behaviour of yield follows the same pattern as that of area and production in the District
Yavatmal. The growth behaviour of area under cotton for Wardha District, which is also a
major cotton-producing district does not reveal same pattern as growth in area. There is a
rising tendency of negative growth rate of area under cotton crop from -0.53 per cent in 1961-
96 to -0.58 percent in 1961-98 for Wardha and further accentuation to 0.63 per cent in 161-
99.
In-spite of negative growth in area under cotton in Wardha, the growth rate in production has
been observed to be positive with a rising trend of compound growth. However, after 1997,
the trend in the growth rate of production though positive, is observed to be declining as
estimated compound rate of growth has declined from 3.68 per cent to 3.02 per cent in 1961-
99.
The yield per hectare also reveals similar tendency i.e. increase in growth rate upto 1997
followed by a reduction in the rate of growth of productivity. Estimates of growth rates of
production and productivity of cotton crop are significantly higher for Wardha district as
compared to Yavatmal district. The growth rate of productivity is almost 3-4 to times higher
in Wardha district as compared to Yavatmal district.
A selection of major cotton producing district in Maharashtra i.e. Parbhani has been made to
compare the growth behaviour of area, production and productivity of Yavatmal and Wardha
district. A comparative analysis may throw some light on the major causes leading to suicides
118

Suicide of Farmers in Maharashtra, Background Paper
in cotton producing districts of Vidarbha. Compound growth rate of area, production and
productivity of cotton in Parbhani district has shown positive trend. Area under cotton has
shown a consistently rising trend from 0.36% in 1961-95 to 0.67% in 1961-99. The behaviour
of growth rate in production and productivity of cotton has also shown rising tendency except
for the period 1961-98 where some marginal fall has been observed. The growth rates in
production and productivity in Wardha district are significantly higher as compared to that of
districts Yavatmal and Parbhani.
Low growth rate in production and productivity may be explained by the inadequate
irrigation facilities, lack of support to the farm community with the help of procurement/
support prices or non-availability and accessibility of institutional loan during the period of
harvest. The role of natural factors creating uncertainty about incomes of agricultural sector
may be one of the contributing factors for the phenomena of suicide.
13. Compound growth rate of area, production and productivity- Food crops
The estimates of compound rate of growth are presented in Table 21. Productivity growth for
the districts under consideration is almost same. Except Wardha in the other two districts i.e.
Yavatmal and Parbhani the productivity growth is marginally higher than the State. The rate
of growth of productivity of food grains is about 2 percent. Surprisingly in the case of
Wardha District, though the rate of growth of area is negative, production and productivity
indicate positive trend. Compound rate of growth of production in the District is lower than
the State. The compound growth rate of area under the District Parbhani is higher than the
States compound growth rate of area.
Table 21 Compound Growth Rate of Area, Production & Productivity (Foodgrains)
District Area Production Productivity 1961-98 1961-99 1961-98 1961-99 1961-98 1961-99
Yavatmal 0.14 0.11 2.77 2.70 2.76 2.59Wardha -0.84 -0.92 1.18 1.06 2.04 2.00Parbhani 0.39 0.37 2.78 2.72 2.38 2.34Maharashtra 0.25 0.22 2.43 2.41 2.25 2.19
The area under cash crop needs to be supplemented with food crops in order to minimize the
risk. There is a need to have the proper combination of production of cash crops and food
crops both. Neglecting food crops totally to earn the higher level of incomes from cash crops
119
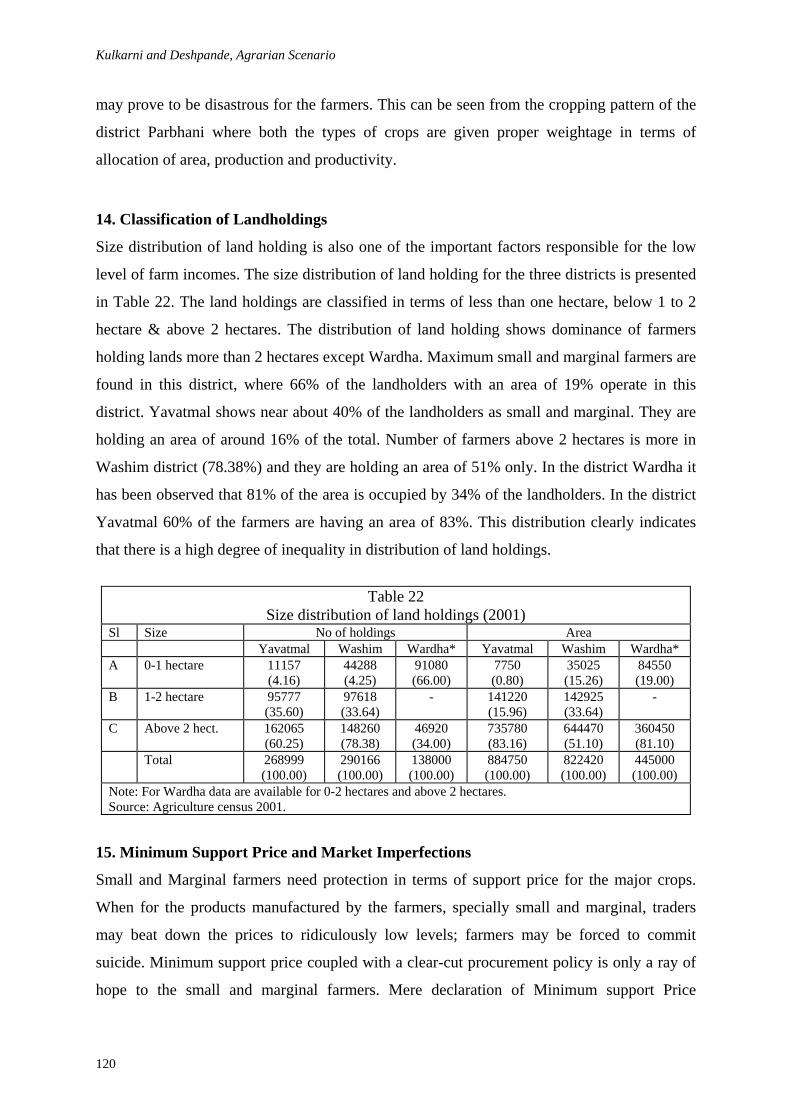
Kulkarni and Deshpande, Agrarian Scenario
may prove to be disastrous for the farmers. This can be seen from the cropping pattern of the
district Parbhani where both the types of crops are given proper weightage in terms of
allocation of area, production and productivity.
14. Classification of Landholdings
Size distribution of land holding is also one of the important factors responsible for the low
level of farm incomes. The size distribution of land holding for the three districts is presented
in Table 22. The land holdings are classified in terms of less than one hectare, below 1 to 2
hectare & above 2 hectares. The distribution of land holding shows dominance of farmers
holding lands more than 2 hectares except Wardha. Maximum small and marginal farmers are
found in this district, where 66% of the landholders with an area of 19% operate in this
district. Yavatmal shows near about 40% of the landholders as small and marginal. They are
holding an area of around 16% of the total. Number of farmers above 2 hectares is more in
Washim district (78.38%) and they are holding an area of 51% only. In the district Wardha it
has been observed that 81% of the area is occupied by 34% of the landholders. In the district
Yavatmal 60% of the farmers are having an area of 83%. This distribution clearly indicates
that there is a high degree of inequality in distribution of land holdings.
Table 22
Size distribution of land holdings (2001) Sl Size No of holdings Area Yavatmal Washim Wardha* Yavatmal Washim Wardha* A 0-1 hectare 11157
(4.16) 44288 (4.25)
91080 (66.00)
7750 (0.80)
35025 (15.26)
84550 (19.00)
B 1-2 hectare 95777 (35.60)
97618 (33.64)
- 141220 (15.96)
142925 (33.64)
-
C Above 2 hect. 162065 (60.25)
148260 (78.38)
46920 (34.00)
735780 (83.16)
644470 (51.10)
360450 (81.10)
Total 268999 (100.00)
290166 (100.00)
138000 (100.00)
884750 (100.00)
822420 (100.00)
445000 (100.00)
Note: For Wardha data are available for 0-2 hectares and above 2 hectares. Source: Agriculture census 2001.
15. Minimum Support Price and Market Imperfections
Small and Marginal farmers need protection in terms of support price for the major crops.
When for the products manufactured by the farmers, specially small and marginal, traders
may beat down the prices to ridiculously low levels; farmers may be forced to commit
suicide. Minimum support price coupled with a clear-cut procurement policy is only a ray of
hope to the small and marginal farmers. Mere declaration of Minimum support Price
120

Suicide of Farmers in Maharashtra, Background Paper
unsupported by procurement policy is of no help. Farmers do not prefer to grow all possible
varieties of crops, if there is no guarantee about adequate returns. It is also necessary to have
the consistency in the policy of procurement to create confidence among farmers. In number
of cases it has been observed that products are rejected and do not get support price because
of the low quality of produce. Farmers also had to wait in a big queue and spend several days
outside market yard. There is no adequate staff in the yard to clear the procurement process.
Even if the produce is purchased at MSP there is infinite delay in making payments for sale
consideration. The marketing infrastructure in this context needs complete revamping with
wide coverage of networking facilities.
Minimum support price provides a benchmark price and a safe level of commitment from the
Government. This price also helps him to provide guidelines for entering in negotiations for
the price with the traders. Farmers can even make contracts with traders about selling of
product to him on some agreeable price. The advantage of this system is farmers can procure
loan for the traders for cultivating a crop and it becomes a commitment for both buyers and
sellers. With the kind of financial crisis State government is facing, procurement of food
grains is going to be the first casualty and this will cause irreparable loss to small and
marginal farmers. Marketing of agricultural produce has been a serious issue in the context of
farmers mass suicides. Though there is existence of market yards in several places, small and
marginal farmers are deprived of their rightful share. These farmers lack the power to assert
their rights in the market yard and they are in many cases ignorant about the prices of
products. Behaviour of cotton prices under monopoly procurement scheme for the region of
Vidarbha is presented Table 23. Cotton Prices under Monopoly Procurement Scheme have
almost remained stagnant till 2002-03. This holds good for both types of cotton procured
under the above scheme. Farmers in most of the cases have switched over to hybrid varieties
of cotton, which involves higher cost of production. This factor has also contributed in
making cotton cultivation economically unviable.
Table 23 Behaviour of Cotton Prices under monopoly Procurement Scheme (Rs. Per Qtl.)
Year Fair Average quality. Fair 2000-01 2050 1725 2001-02 2050 1725 2002-03 2050 1725 2003-04 2250 1925 2004-05 2250 1925 Source: Maharashtra State Government G.R. issued from time to time.
121

Kulkarni and Deshpande, Agrarian Scenario
16. Rainfall Situation in Suicide Prone Districts
One of the important reasons for farmers’ suicide was the scanty rainfall in all the three
districts considered for the present study. In Yavatmal district the position of rainfall was
better in the year 1999-00 compared to all other years from 1998-99 to 2004-05. In the year
1998-99 as well as in 2000-01 the rainfall situation was bad. In the year 2000-01, the
cumulative rainfall for this year on an average was 776.98 mm. The situation has not
improved in the successive years. On the contrary the rainfall situation became worse after
2002-03. In comparison with 1999-00, in all other years, the average rainfall was inadequate.
Table 24 Rainfall and Production of cotton and Rice in Yavatmal, Washim and Wardha
Districts District Year Production of
cotton Production foodgrains
average rainfall (mm)
Yavatmal 1998-99 2425 4272 595.40 1999-00 4481 4259 1065.60 2000-01 2382 3847 776.98 2001-02 3056 3776 828.61 2002-03 3136 3566 905.27 2003-04 3823 3141 849.91 Washim 1999-00 1067 2376 996.45 2000-01 535 1872 591.87 2001-02 884 2421 791.13 2002-03 726 979 1289.83 2003-04 625 2206 807.47 Wardha 1998-99 1003 1376 232.85 1999-00 1751 1229 1068.8 2000-01 1594 1350 970.35 2001-02 1362 1403 895.92 Note: Production figures are in 1000 bales for Cottona and in 1000 tons for Rice. Normal rainfall for Yavatmal, Washim and Wardha are 966.3 mm, 828 mm and 939.55 mm respectively.
In the district Washim almost similar pattern has been observed, 2000-01 was a bad year for
the district. The rainfall was the lowest in this year. The situation of rainfall improved in the
year 2002-03 significantly. In both the districts Yavatmal and Washim after 2000-01 in the
year 2002-03 there was an improvement in rainfall but in the subsequent year there was again
sudden reduction.
In the district Wardha 2001-02 was the bad year in terms of rainfall. 1998-99 was the worst
year considering the position of rainfall in the other years. 1999-00 received the highest
rainfall in Wardha but after that there was reduction upto 2001-2002. There was some sign of
improvement in 2002-03 but in subsequent years the district suffered from scanty rainfall. In
all the three Districts the actual rainfall is below the normal rainfall in almost all the years.
122

Suicide of Farmers in Maharashtra, Background Paper
The data relating to rainfall is presented in Table 24 along with production of cotton and food
grains.
Normal rainfall in three Districts is taken into account along with production of cotton as
cash crop. It may be noted that Districts where normal rainfall is on the higher side the
tendency of the production is to go up. Out of these three Districts, Washim shows lower
level of normal rainfall, in this district the production of cotton in comparison with other two
districts is also on the lower side. Adequate rainfall helps to improve the production of crops
specially cash crop. Food grains production does not appear to be directly related to rainfall,
but cash crops production and rainfall seem to be interrelated to some extent.
17. Conclusion
During the last forty-five years infrastructure facilities like irrigation, roads, marketing etc.
were not created sufficiently and therefore the productivity of land has declined. Agro-based
industries, particularly textiles are not attracted to this region and trade turnover has been
reduced. The agrarian economy of Vidarbha remained backward mainly due to non -
diversification of crops and lack of supporting non - farm activities. Cotton crop has
remained as single largest growing crop in the region however the productivity has remained
low throughout the period under consideration. Maximum suicides have been reported in
Vidarbha particularly after a second crop failure and in some cases third also, left farmers
with no chance to repay their loans. Even a hand - to - mouth existence was rendered
difficult. Mounting debt owing to crisis in the crop is the most common reason for the
suicides in Vidarbha. Excess amount of rain or drought both the situations affect the agrarian
economy of Vidarbha. Lack of crisis management and insufficient cushion to tackle vagaries
of nature affect the economy of Vidarbha. Monopoly Cotton Procurement Scheme of the state
government is a unique scheme for protecting the farmers, but the scheme is not operating as
smooth as required for providing cushion to the farmers. Farmers have to operate ultimately
at the mercy of private traders. The waiting period in some cases is required to get the proper
price for the crops but unfortunately farmers in this region cannot afford to wait for too long
and they are forced to sell their produce to private traders. In order to avoid the interest
accumulation of the loan taken by them for the moneylenders they are forced to sell the
produce at a lower price. Farmers were selling off their produce to private traders but a vast
majority always opted for the government scheme despite the erratic and painful payment
schedule. But in recent years the operation of the scheme has forced the farmers to sell their
123

Kulkarni and Deshpande, Agrarian Scenario
produce to the traders. The three districts of Vidarbha Yavatmal, Washim and Wardha are
peculiar. Cotton is the major crop of the region but the area under cotton is falling in districts
like Washim and Wardha. No equivalent type of cash crops is substituted in order to balance
the incomes of the farmers. The substitution takes place continuously for traditional crops
like Jowar, wheat, cereals, etc. There is no significant change in the cropping pattern, except
farmers have started cultivating soyabean. More and more area is coming under soyabean
crop. The excess production of soyabean has affected the prices and in the next time period
its area under cultivation has gone down.
The agrarian scenario of Vidarbha needs a special and area - specific treatment. Some areas
will have to be identified to grow special type of crops and the link needs to be established
for marketing of their crops. Agriculture extension services have a special role to play in this
regard. The issue need not be considered in an isolated manner for the farming community
alone. The industrial infrastructure needs to be developed by considering the availability of
agricultural inputs from the region. Developmental programs of other regions and the success
stories of other regions cannot be planted as it is in this region. The quality of soil,
availability of natural resources, culture, tradition of this region need to considered while
setting the policy framework for the region of Vidarbha.
The Human development Report of Maharashtra, 2002 highlights the backwardness of the
districts of Vidarbha. The Human development Index of Yavatmal was 0.22 and amongst the
35 districts of Maharashtra it’s rank was 34’th. Washim is also another district of Vidarbha
where the Human Development Index was 0.36 and its rank was 31’st. Wardha is better in
terms of Human development which was 0.49 and its rank was 16’th. In terms of Per Capita
District Domestic Product also Yavatmal is lagging behind with 30’th rank in the state of
Maharashtra. Washim and Wardha stand in 19’th and 16’th position respectively. The three
suicide prone districts indicate high literacy rate of more than 70%. But the skill formation
required for supplementing developmental activities normally takes place after the 10’th
standard. But in case of Yavatmal the dropout rate per 100 was 64, in Washim and Wardha
this rate was 49 and 46 respectively. This clearly shows that this population is not available
for further developmental activities and it affects the entrepreneurial skills also. Obviously
this affects their standard of living and they have to depend on minimum income generating
activities. The aspect of educational attainment also needs to be considered along with other
factors mentioned above.
124

Suicide of Farmers in Maharashtra: Background Paper
Poisoning Cases in Yavatmal Medical College, July 2004-June 051
P. R. Bhatkule2
This Version: July 2005
Abstract
Using a sample of case records of poisoning cases reported (435 of 938) in the Medical
College at Yavatmal during July 2004-June 2005, one observes that 68 per cent were males
and 54 per cent were in the age group of 26-35 years. Most of the cases were from rural
areas (83 per cent) and almost 90 per cent were labourers. Time distribution of all the 938
cases indicates that the maximum cases were reported in the July-September quarter (29 per
cent) and the minimum cases were reported in the April-June quarter (21 per cent). From the
cases analysed, 45 per cent were diagnosed with organophosphorous poisoning and another
17 per cent with other pesticides. Almost all the cases were suicidal in nature (93 per cent).
Analysis of the case record further indicate that 76 per cent were cured, 15 per cent of lives
could not be saved despite medical interventions and the remaining 9 per cent were
discharged as they wanted to leave against medical advise.
1 This has been prepared as a background paper for the study on ‘Suicide of Farmers in Maharashtra’ being conducted by the Indira Gandhi Institute of Development Research (IGIDR), Mumbai for the Government of Maharashtra. After submission the author was transferred to Nagpur and without access to relevant data. The scope for revising this paper – to extend the analysis to all cases instead of a sample of the reported cases and to earlier years – was limited. 2 The author researches, teaches and practices Preventive and Social Medicine, Shri Vasantrao Naik Government Medical College, Yavatmal (now at the medical college in Nagpur). His postal address is: Dr PR Bhatkule, 32 Shirdi Nagar, PO Ayodhya Nagar, Nagpur 440 024. .
125

Bhatkule, Poisoning in Yavatmal
1. Introduction
As per the WHO report in 1999 more than three million poisoning cases with 251881 deaths
occurred Worldwide in a year. Of these 99% occurred in developing countries.
Its incidence is steadily rising and now at least 10 percent of all adult emergency admission to
hospitals is due to suffering from poisoning in Britain. Accidental poisoning in the home is
also very common, especially in young children. The nature of poison varies in different parts
of the world and even in the same country depending on the socio-economic factors and
cultural environment and also due to the occupations in which they are working.
In developing countries like India agrochemical is the commonest agent responsible for
poisoning. It has been revealed from the record of Shri Vasantrao Naik Government Medical
College (V.N.G.M.C.), Yavatmal that 314 (14.9 percent) out of total 2105 deaths had been
due to the different types of poisons. During January 2004-June2005, it has been noted that
55 percent deaths and 20 percent admissions were due to Organo phosphorous compounds
and other type of the insecticides consumption.
Area served by Shri V.N.G.M.C. Yavatmal is a rural and tribal area. A large number of the
cases of poisoning are coming to the hospital from the peripheral area. This study has been
undertaken to study the trends of poisoning in the cases reported in this hospital.
2. Materials And Method
The study was conducted at Shri V.N.Govt.Medical College, Yavatmal it is both a hospital
and institute for medical training. There is a separate section where records are made
available at the hospital. The records include information such as patient’s age, sex, address,
occupation, mode of poisoning, nature of poisoning, duration of hospital stay, type of
treatment received, outcome after treatment etc. The records could be traced for all cases that
were admitted and information was collected in pre-designed performa from the Medical
Record Section for July 2004 to June 2005. Deaths due to poisoning cases were cross-
checked from the death registers. Investigator did analyses of the records. Statistics were
performed on the data such as percentages, average, chi square test, ‘p’ value etc.
126

Suicide of Farmers in Maharashtra: Background Paper
2. Observation And Discussion
In this study, total 9397 medico legal cases were reported in V.N.G.M.C hospital during the
period of July 2004- June 2005. Out of these 938 (9.98%) cases were poisoning (which
excludes snake bites cases). In this study the analysis was done for only 435 cases due time
constraints. The rest of the cases will be analyzed within due course of time. The analysis of
the same with conclusions will be reported in final reports. In this study, out of 435 patients
282 (64.8%) were male and 153 (35.2%) were female (Table 1). The male female ratio is
around 2:1.
Table 1 Sex Wise Distribution
Sex Group Male Female Total
282(64.8) 153(35.2) 435(100)
Table 2 Age Wise Distribution of Poison Cases
Age Group No Percentage 0-12 30 7 13-18 53 12 19-25 - - 26-35 235 54 36-50 87 20 50 + 30 7
Youngest patient was 1 ½ year old, while the oldest was 70 years old (Table 2). It was also
observed that 54 % patients were in young and active age group i.e. 19 to 35 years and male
and female shared the same ratio. Similar findings were reported by Multani et al (1991) and
Singh et al (1997). This may be because this age group is more involved in all types of
strains, domestic, educational and employment. Males have easy accessibility to
agrochemicals due to more involvement in agricultural work particularly in rural areas.
Table 3 Rural and Urban Distribution of Poison Cases
Area No of cases Percentage Rural 360 82.7 Urban 75 17.3 Total 435 100
127

Bhatkule, Poisoning in Yavatmal
Patients reported from rural area observed to be more than urban areas. This may be due to
large population in rural area than that in urban (Table 3).
Table 4 Occupation Wise Distribution of Cases.
Occupation group No of cases Percentage Agriculturist 38 8.7 Labourers 388 89.2 Other 9 2.1 Total 435 100.0
It was observed that majority of the patients i.e. 89.2 percent were from laborers group (Table
4). These laborers were either working in agriculture sector or in construction work and also
belongs to low socio-economic group. It may be due to more stress and strain and easy
accessibility to agro-chemical because of their occupation. It has been also noted in the study
that only 8.7 per cent patients were agriculturist or farmer. The rest of the 2.1 per cent were
from high income group, servicemen or students.
Average number of cases attending per month was found to be 78 (Table 5). The table shows
that in the first quarter of the year was 23 percent case while in the 2nd , 3rd and 4th quarter of
the year the per cent distribution were 21.2, 29.2, 26.6 respectively. So this distribution does
not seem to be uniform.
Table No 5 Time Distribution of Cases Attended
Months No of cases Percentage January-March 216 23 April-June 198 21.2 44.2 July-Sept 274 29.2 Oct-Dec 250 26.6 55.8 Total 938 100.0 N=938 cases, period July 2004-June 2005.
More cases were admitted in the 2nd half of the year, i.e 29.2 and 26.6 percent than in the 1st
half of the year. After application of the x2 test, difference was found to be statistically
significant (p0.05). This may be due to more exposure of the labourers to pesticides spraying
operations that are commonly carried out during this part of the year. The similar type of
finding was observed in previous study carried in V.N.G.M.C Yavatmal in Oct 2003.
128

Suicide of Farmers in Maharashtra: Background Paper
Table 6 Name and Type of poison abused.
Name and type No of cases Percentage Organophosphorous 195 44.82 Other pesticides 73 16.78 Rodenticide (Zinc Phosphide) 49 11.26 Alcohol 35 8.08 Drug intoxification 19 4.36 Kerosene/Diesel 13 2.98 Unknown 51 11.72 Total 435 100.0
Most common agents responsible for poisoning are organophsophorous compounds like
endrin, Rogar, Novacran etc, amongst 44.82 percent, followed by other insecticides in 16.78
per cent and rodenticides in 11.26 per cent of cases (Table 6). Alcohol intoxication was
observed to to be 8.06 percent. And other poisons such as drug intoxication, phenyl, dettol,
seeds of chandrajyoti, kerosene,diesel, camphor constitute 7.34 percent. Similar finings were
observed in previous data of Oct 2003 investigation. Easy availability of highly toxic
substance like organo phosphorous compound has pushed up the incidence of poisoning.
Similar type of findings were reported by another investigator Basu et al(1999) and Multani
et al (1991).
Table 7 Mode of poisoning
Mode No of Cases Percentage Suicidal 404 92.8 Accidental 31 7.5 Homicidal 0 0 Total 435 100.0
The most common mode of poisoning was suicidal (self consumed) in 92.8 percent, followed
by accidental poisoning as 7.2 percent (Table 7). From this observation, it can be concluded
that in times of stress, the patients resort to agrochemical to commit suicide. It was observed
that majority of the cases (75.9%) were cured and discharged, while 9.2 % left hospital in
spite of them being advised otherwise (Table 8). Mortality due to poisoning was found to be
14.9 percent in this hospital, in spite of all medical efforts. The overall mortality rate in the
study of Multani et al (1991) it was 25.5 % and Singh et al was 17.3 %. In comparison, the
the mortality rate found by this hospital study was less.
129

Bhatkule, Poisoning in Yavatmal
Table 8 Outcome of the Polio cases
Outcome No of cases Percentage Cured 330 75.9 DAMA 40 9.2 Death 65 14.9 Total 435 100 Note: DAMA indicates discharged against medical advice.
3. Conclusion
In Shri Vasantrao Naik Government Medical College Hospital, Yavatmal a rural medical
college of Vidarbha, most of the cases were referred from primary health centers (PHCs) and
belonged to labour group with low socio economic status. Common age group affected
among both males and females was 19-35 years. Average number of cases reported per
month in this hospital is 78. However during second half of the year that is July to Dec the
number of poisoning cases admitted increase. Most common chemical agent responsible for
poisoning cases was found to be Organo phosphorous compounds i.e. 44.82 percent cases
consumed followed by insecticide (16.78 percent) and rodenticide (11.26 percent). Mortality
rate among all admitted poisoning cases was 14.9 percent.
References
Basu, D., Bhandari, B., Kunda, A.K., Sarkar, N. (1999): Profile of Acute Poisoning in a teaching hospital Calcutta, Journal of Association of Physicians in India, 47 (1).
Bhatkule, PR, Ku Wahab, SN and Pathak, AA (2003): Some Epidemological Factors Related
to Poisoning Cases, Milestone: Journal of DMER, 2 (2): 193-7. Davidson (1974): Principles and Practice of Medicine, EIBS publication, 11th edition, pp.
947-951. Multani, B.S., Gupta, M.M., Kazol, H.L., Chopra, B.K. (1991): Spectrum of Acute Poisoning
in Adults, Journal of Association of Physicians in India, 39 (11). Murty, O. P., Acute Poisoning in India, AIIMS, Delhi. Singh, Surjit, Weigh, N., et al (1997) Changing Pattern of Acute Poisoning in Adults
experience of large North West Indian Hospital (1970-1989), Journal of Association of Physicians in India, Vol .45 (3).
Zinc and Mohanty, Pattern of Acute Poisoning at IGNC Nagpur.
130