a committing to child survival: a promise renewed · committing to child survival: a promise...
TRANSCRIPT
A
Committing to Child Survival:A Promise Renewed
Progress Report 2012
Acknowledgements
R e n e w i n g t h e P r o m i s e — i n e v e r y c o u n t r y , f o r e v e r y c h i l d
© United Nations Children’s Fund (UNICEF), September 2012Permission is required to reproduce any part of this publication. Permission will be freely granted to educational or non-profit organiza-tions. Please contact:Division of Policy and Strategy, UNICEF3 United Nations Plaza, New York, NY 10017, USA
Cover photo credit: © UNICEF/NYHQ2012-0176/Asselin
This report, additional online content and corrigenda are available at www.apromiserenewed.orgFor latest data, please visit www.childinfo.org.ISBN: 978-92-806-4655-9
This report was prepared by UNICEF’s Division of Policy and Strategy.
Report teamStatiStical tableS, FigureS, Planning and reSearch: Tessa Wardlaw, Associate Director, Statistics and Monitoring Section, Division of Policy and Strategy; David Brown; Claudia Cappa; Archana Dwivedi; Priscilla Idele; Claes Johansson; Rolf Luyendijk; Colleen Murray; Jin Rou New; Holly Newby; Khin Wityee Oo; Nicholas Rees; Andrew Thompson; Danzhen You.editorS: David Anthony; Eric Mullerbeck.deSign and layout: Upasana Young.branding: Boris De Luca; Michelle Siegel.coPy editing and ProoFreading: Lois Jensen; Louise Moreira Daniels.webSite: Stephen Cassidy; Dennis Yuen.
UNICEF Country Offices contributed to the review of country example text.
Policy and communications advice and support were provided by Geeta Rao Gupta, Deputy Executive Director; Yoka Brandt, Deputy Executive Director; Robert Jenkins, Deputy Director, Division of Policy and Strategy; Mickey Chopra, Associate Director, Health, Pro-gramme Division; Katja Iversen; Ian Pett; Katherine Rogers; Francois Servranckx; Peter Smerdon.
3
Contents
Foreword . . . . . . . . . . . . . . . . . . . . . . . . . . . . . . . . . . . . . . . . . . . . . . . . . . . . . . 4
Overview . . . . . . . . . . . . . . . . . . . . . . . . . . . . . . . . . . . . . . . . . . . . . . . . . . . . . . 5
Chapter 1: Levels and trends in child mortality . . . . . . . . . . . . . . . . . . . . . . . . . . . . . . . . . 6
Under-five mortality rate league table, 2011 . . . . . . . . . . . . . . . . . . . . . . . . . . . . . . . . 12
Chapter 2: Leading causes of child deaths . . . . . . . . . . . . . . . . . . . . . . . . . . . . . . . . . . 14
Pneumonia . . . . . . . . . . . . . . . . . . . . . . . . . . . . . . . . . . . . . . . . . . . . . . . . . . 17
Diarrhoea . . . . . . . . . . . . . . . . . . . . . . . . . . . . . . . . . . . . . . . . . . . . . . . . . . . 18
Malaria . . . . . . . . . . . . . . . . . . . . . . . . . . . . . . . . . . . . . . . . . . . . . . . . . . . . 19
Neonatal deaths . . . . . . . . . . . . . . . . . . . . . . . . . . . . . . . . . . . . . . . . . . . . . . . 20
Undernutrition . . . . . . . . . . . . . . . . . . . . . . . . . . . . . . . . . . . . . . . . . . . . . 21
HIV and AIDS . . . . . . . . . . . . . . . . . . . . . . . . . . . . . . . . . . . . . . . . . . . . . . . . . 22
Other contributing factors . . . . . . . . . . . . . . . . . . . . . . . . . . . . . . . . . . . . . . . . . . 23
Chapter 3: Getting to ‘20 by 2035’: Strategies for accelerating progress on child survival . . . . . . . . 26
Country examples . . . . . . . . . . . . . . . . . . . . . . . . . . . . . . . . . . . . . . . . . . . . . . 28
References . . . . . . . . . . . . . . . . . . . . . . . . . . . . . . . . . . . . . . . . . . . . 31
Tables: Country and regional estimates of child mortality and causes of under-five deaths . . . . . . . . 34
R e n e w i n g t h e P r o m i s e — i n e v e r y c o u n t r y , f o r e v e r y c h i l d
4
ForewordAnthony Lake, Executive Director, UNICEF
© UN
ICEF
/NYH
Q201
0-06
97/M
arkis
z
The story of child survival over the past two decades is one of significant progress and unfinished business.
There is much to celebrate. More chil-dren now survive their fifth birthday than ever before ― the global number of under-five deaths has fallen from around 12 mil-lion in 1990 to an estimated 6.9 million in 2011. All regions have shown steady reduc-tions in under-five mortality over the past two decades. In the last decade alone, prog-ress on reducing child deaths has acceler-
ated, with the annual rate of decline in the global under-five mortality rate rising from 1.8% in 1990-2000 to 3.2% in 2000-2011.
The gains have been broad, with marked falls in diverse coun-tries. Between 1990 and 2011, nine low-income countries — Ban-gladesh, Cambodia, Ethiopia, Liberia, Madagascar, Malawi, Ne-pal, Niger and Rwanda — reduced their under-five mortality rate by 60% or more. Nineteen middle-income countries, among them Brazil, China, Mexico and Turkey, and 10 high-income countries, including Estonia, Oman, Portugal and Saudi Arabia, are also making great progress, reducing under-five mortality by two-thirds or more over the same period.
Our advances to date stem directly from the collective com-mitment, energy and efforts of governments, donors, non-gov-ernmental organizations, UN agencies, scientists, practitioners, communities, families and individuals. Measles deaths have plummeted. Polio, though stubbornly resistant thus far to elimina-tion, has fallen to historically low levels. Routine immunization has increased almost everywhere. Among the most striking advances has been the progress in combatting AIDS. Thanks to the applica-tion of new treatments, better prevention and sustained funding, rates of new HIV infections ― and HIV-associated deaths among children ― have fallen substantially.
But any satisfaction at these gains is tempered by the unfinished business that remains. The fact remains that, on average, around 19,000 children still die every day from largely preventable causes. With necessary vaccines, adequate nutrition and basic medical and maternal care, most of these young lives could be saved.
Nor can we evade the great divides and disparities that per-sist among regions and within countries. The economically poor-est regions, least developed countries, most fragile nations, and most disadvantaged and marginalized populations continue to bear the heaviest burden of child deaths. More than four-fifths of all under-five deaths in 2011 occurred in sub-Saharan Africa and
South Asia. Given the prospect that these regions, especially sub-Saharan Africa, will account for the bulk of the world’s births in the next years, we must give new impetus to the global momentum to reduce under-five deaths.
This is the potential of Committing to Child Survival: A Promise Renewed, a global effort to accelerate action on maternal, newborn and child survival. In June 2012, the Governments of Ethiopia, India and the United States ― together with UNICEF ― brought together more than 700 partners from the public, private and civil society sectors for the Child Survival Call to Action. What emerged from the Call to Action was a rejuvenated global movement for child survival, with partners pledging to work together across technical sectors with greater focus, energy and determination. Since June, more than 110 governments have signed a pledge vowing to redouble efforts to ac-celerate declines in child mortality; 174 civil society organizations, 91 faith-based organizations, and 290 faith leaders from 52 countries have signed their own pledges of support.
Under the banner of A Promise Renewed, a potent global movement, led by governments, is mobilizing to scale up action on three fronts: sharpening evidence-based country plans and setting measurable benchmarks; strengthening accountability for maternal, newborn and child survival; and mobilizing broad-based social support for the principle that no child should die from pre-ventable causes. Concerted action in these three areas will hasten declines in child and maternal mortality, enabling more countries to achieve MDGs 4 and 5 by 2015 and sustain the momentum well into the future.
As the message of this report makes clear, countries can achieve rapid declines in child mortality, with determined action by governments and supportive partners. Our progress over the last two decades has taught us that sound strategies, adequate resources and, above all, political will, can make a critical differ-ence to the lives of millions of young children.
By pledging to work together to support the goals of A Promise Renewed, we can fulfill the promise the world made to children in MDGs 4 and 5: to give every child the best possible start in life. Join us.
5
Overview
bacKgroundTo advance Every Woman Every Child, a strategy launched by Unit-ed Nations Secretary-General Ban Ki-moon, UNICEF and other UN organizations are joining partners from the public, private and civil society sectors in a global movement to accelerate reductions in preventable maternal, newborn and child deaths.
The Child Survival Call to Action was convened in June 2012 by the Governments of Ethiopia, India and the United States, togeth-er with UNICEF, to examine ways to spur progress on child survival. A modelling exercise presented at this event demonstrated that all countries can lower child mortality rates to 20 or fewer deaths per 1,000 live births by 2035 – an important milestone towards the ultimate aim of ending preventable child deaths.
Partners emerged from the Call to Action with a revitalized commitment to child survival under the banner of A Promise Re-newed. Since June, more than 100 governments and many civil society and private sector organizations have signed a pledge to redouble their efforts, and many more are expected to follow suit in the days and months to come. This global movement will focus on learning from and building on the many successes made in reducing child deaths in numerous countries over the past two decades. More details on A Promise Renewed are available at <www.apromiserenewed.org>.
Priority actionSTo meet the goals of A Promise Renewed, our efforts must focus on scaling up essential interventions through the following three priority actions:
evidence-based country plans: Governments will lead the effort by setting and sharpening their national action plans, assigning costs to strategies and monitoring five-year milestones. Develop-ment partners can support the national targets by pledging to align their assistance with government-led action plans. Private-sector partners can spur innovation and identify new resources for child survival. And, through action and advocacy, civil society can support the communities and families whose decisions pro-foundly influence prospects for maternal and child survival.
transparency and mutual accountability: Governments and partners will work together to report progress and to promote ac-countability for the global commitments made on behalf of chil-dren. UNICEF and partners will collect and disseminate data on each country’s progress. A global monitoring template, based on the indicators developed by the UN Commission on Information and Accountability for Women’s and Children’s Health, has been
developed for countries to adapt to their own priorities. National governments and local partners are encouraged to take the lead in applying the template to national monitoring efforts.
global communication and social mobilization: Governments and partners will mobilize broad-based social and political sup-port for the goal of ending preventable child deaths. As part of this effort, the search for small-scale innovations that demon-strate strong potential for large-scale results will be intensified. Once identified, local innovations will be tested, made public, and taken to scale. By harnessing the power of mobile technology, civil society and the private sector can encourage private citizens, es-pecially women and young people, to participate in the search for innovative approaches to maternal and child survival.
annual rePortSIn support of A Promise Renewed, UNICEF is publishing yearly re-ports on child survival to stimulate public dialogue and help sus-tain political commitment. This year’s report, released in conjunc-tion with the annual review of the child mortality estimates of the UN Inter-Agency Group on Mortality Estimation, presents:
• Trends and levels in under-five mortality over the past two decades.
• Causes of and interventions against child deaths. • Brief examples of countries that have made radical reduc-
tions in child deaths over the past two decades. • A summary of the strategies for meeting the goals of A Prom-
ised Renewed. • Statistical tables of child mortality and causes of under-five
deaths by country and UNICEF regional classification.
The analysis presented in this report provides a strong case for proceeding with optimism. The necessary interventions and know-how are available to drastically reduce child deaths in the next two decades. The time has come to recommit to child survival and renew the promise.
6
Chapter 1: Levels and trends in child mortality
© UNICEF/NYHQ2010-0776/ LeMoyne
7
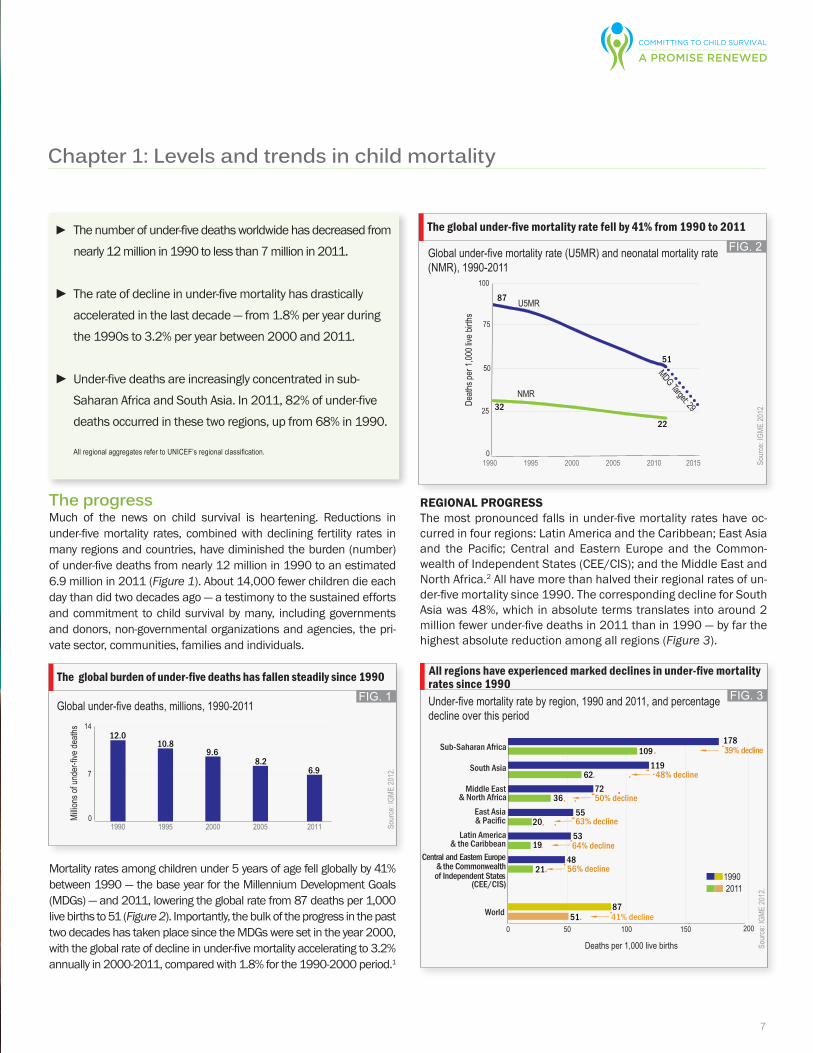
The progressMuch of the news on child survival is heartening. Reductions in under-five mortality rates, combined with declining fertility rates in many regions and countries, have diminished the burden (number) of under-five deaths from nearly 12 million in 1990 to an estimated 6.9 million in 2011 (Figure 1). About 14,000 fewer children die each day than did two decades ago — a testimony to the sustained efforts and commitment to child survival by many, including governments and donors, non-governmental organizations and agencies, the pri-vate sector, communities, families and individuals.
Mortality rates among children under 5 years of age fell globally by 41% between 1990 — the base year for the Millennium Development Goals (MDGs) — and 2011, lowering the global rate from 87 deaths per 1,000 live births to 51 (Figure 2). Importantly, the bulk of the progress in the past two decades has taken place since the MDGs were set in the year 2000, with the global rate of decline in under-five mortality accelerating to 3.2% annually in 2000-2011, compared with 1.8% for the 1990-2000 period.1
regional ProgreSSThe most pronounced falls in under-five mortality rates have oc-curred in four regions: Latin America and the Caribbean; East Asia and the Pacific; Central and Eastern Europe and the Common-wealth of Independent States (CEE/CIS); and the Middle East and North Africa.2 All have more than halved their regional rates of un-der-five mortality since 1990. The corresponding decline for South Asia was 48%, which in absolute terms translates into around 2 million fewer under-five deaths in 2011 than in 1990 — by far the highest absolute reduction among all regions (Figure 3).
Chapter 1: Levels and trends in child mortality
► The number of under-five deaths worldwide has decreased from nearly 12 million in 1990 to less than 7 million in 2011.
► The rate of decline in under-five mortality has drastically accelerated in the last decade — from 1.8% per year during the 1990s to 3.2% per year between 2000 and 2011.
► Under-five deaths are increasingly concentrated in sub- Saharan Africa and South Asia. In 2011, 82% of under-five deaths occurred in these two regions, up from 68% in 1990.
AllregionalaggregatesrefertoUNICEF’sregionalclassification.
FIG. 1Globalunder-fivedeaths,millions,1990-2011
The global burden of under-five deaths has fallen steadily since 1990
Source:IGM
E2012.
Millio
nsofun
der-five
death
s
12.010.8
9.68.2
6.9
0
7
14
20112005200019951990
FIG. 3
Source:IGM
E2012.
19902011
World
Central and Eastern Europe& the Commonwealthof Independent States
Latin America & the Caribbean
East Asia & Pacific
South Asia
Middle East & North Africa
Sub-Saharan Africa178
109
7236
11962
5520
5319
4821
8751
39% decline
50% decline
48% decline
63% decline
64% decline
56% decline
41% decline0 50 100 150 200
(CEE/CIS)
Deathsper1,000livebirths
All regions have experienced marked declines in under-five mortality rates since 1990Under-fivemortalityratebyregion,1990and2011,andpercentagedeclineoverthisperiod
Globalunder-fivemortalityrate(U5MR)andneonatalmortalityrate(NMR),1990-2011
The global under-five mortality rate fell by 41% from 1990 to 2011
Source:IGM
E2012.
FIG. 2
87
51
32
22
0
25
50
75
100
1990 1995 2000 2005 2010 2015De
athsp
er1,000live
births
U5MR
NMR
MDG Target: 29
8
Levels and trends in child mortality
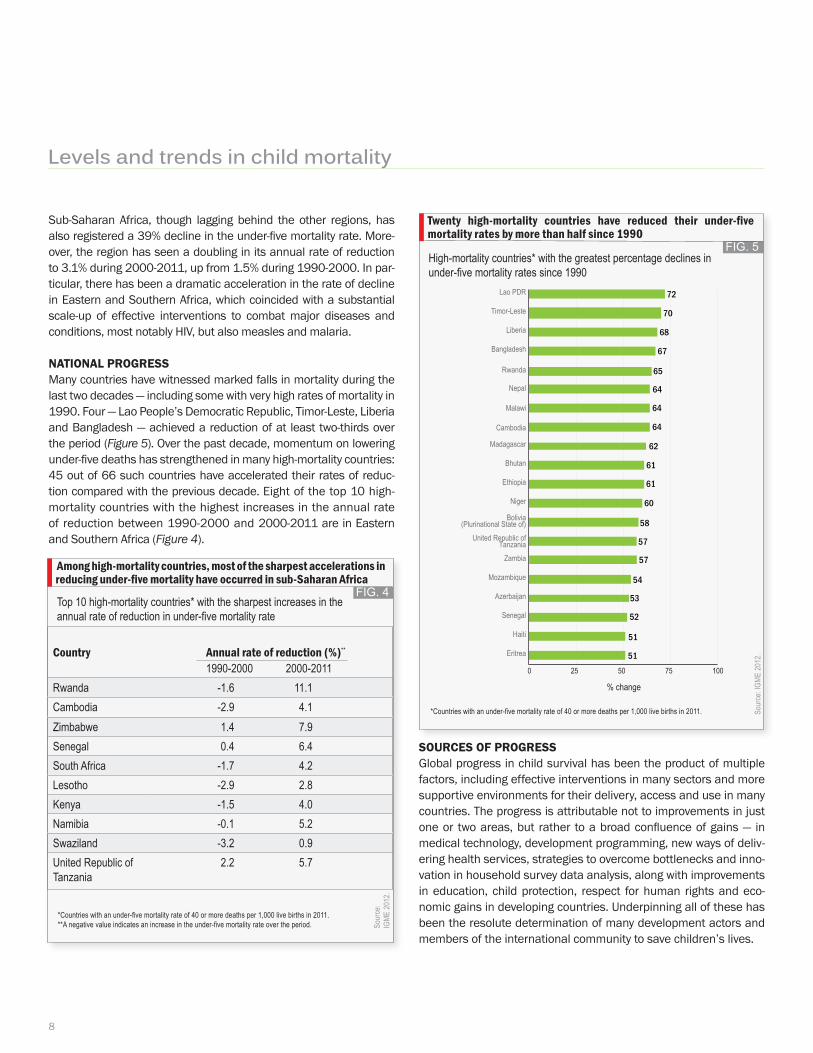
Sub-Saharan Africa, though lagging behind the other regions, has also registered a 39% decline in the under-five mortality rate. More-over, the region has seen a doubling in its annual rate of reduction to 3.1% during 2000-2011, up from 1.5% during 1990-2000. In par-ticular, there has been a dramatic acceleration in the rate of decline in Eastern and Southern Africa, which coincided with a substantial scale-up of effective interventions to combat major diseases and conditions, most notably HIV, but also measles and malaria.
national ProgreSSMany countries have witnessed marked falls in mortality during the last two decades — including some with very high rates of mortality in 1990. Four — Lao People’s Democratic Republic, Timor-Leste, Liberia and Bangladesh — achieved a reduction of at least two-thirds over the period (Figure 5). Over the past decade, momentum on lowering under-five deaths has strengthened in many high-mortality countries: 45 out of 66 such countries have accelerated their rates of reduc-tion compared with the previous decade. Eight of the top 10 high-mortality countries with the highest increases in the annual rate of reduction between 1990-2000 and 2000-2011 are in Eastern and Southern Africa (Figure 4).
SourceS oF ProgreSSGlobal progress in child survival has been the product of multiple factors, including effective interventions in many sectors and more supportive environments for their delivery, access and use in many countries. The progress is attributable not to improvements in just one or two areas, but rather to a broad confluence of gains — in medical technology, development programming, new ways of deliv-ering health services, strategies to overcome bottlenecks and inno-vation in household survey data analysis, along with improvements in education, child protection, respect for human rights and eco-nomic gains in developing countries. Underpinning all of these has been the resolute determination of many development actors and members of the international community to save children’s lives.
Among high-mortality countries, most of the sharpest accelerations in reducing under-five mortality have occurred in sub-Saharan Africa
FIG. 4
Country Annual rate of reduction (%)** 1990-2000 2000-2011Rwanda -1.6 11.1Cambodia -2.9 4.1Zimbabwe 1.4 7.9Senegal 0.4 6.4SouthAfrica -1.7 4.2Lesotho -2.9 2.8Kenya -1.5 4.0Namibia -0.1 5.2Swaziland -3.2 0.9UnitedRepublicofTanzania
2.2 5.7
Sour
ce:
IGME
2012.
*Countrieswithanunder-fivemortalityrateof40ormoredeathsper1,000livebirthsin2011.**Anegativevalueindicatesanincreaseintheunder-fivemortalityrateovertheperiod.
Top10high-mortalitycountries*withthesharpestincreasesintheannualrateofreductioninunder-fivemortalityrate
Twenty high-mortality countries have reduced their under-five mortality rates by more than half since 1990
Source:IGM
E2012.
FIG. 5High-mortalitycountries*withthegreatestpercentagedeclinesin under-fivemortalityratessince1990
*Countrieswithanunder-fivemortalityrateof40ormoredeathsper1,000livebirthsin2011.
0 25 50 75 100
Eritrea
Haiti
Senegal
Azerbaijan
Mozambique
Zambia
UnitedRepublicofTanzania
Bolivia(PlurinationalStateof)
Niger
Ethiopia
Bhutan
Madagascar
Malawi
Nepal
Rwanda
Cambodia
Bangladesh
Liberia
Timor-Leste
LaoPDR 72
70
68
67
65
64
64
64
62
61
61
60
58
57
57
54
53
52
51
51
%change
9
The challengeThere are worrying caveats to this progress. At 2.5%, the annual rate of reduction in under-five mortality is insufficient to meet the MDG 4 target. Almost 19,000 children under 5 still die each day, amount-ing to roughly 1.2 million under-five deaths from mostly preventable causes every two months. Despite all we have learned about saving children’s lives, our efforts still do not reach millions.
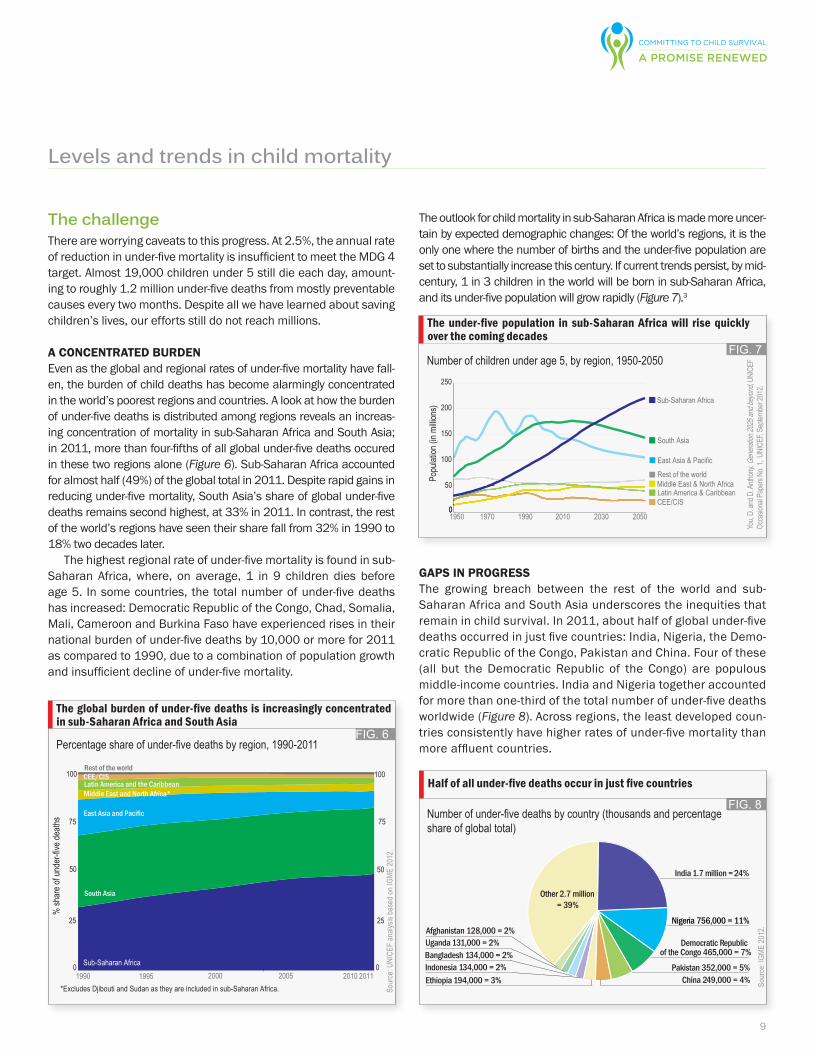
a concentrated burdenEven as the global and regional rates of under-five mortality have fall-en, the burden of child deaths has become alarmingly concentrated in the world’s poorest regions and countries. A look at how the burden of under-five deaths is distributed among regions reveals an increas-ing concentration of mortality in sub-Saharan Africa and South Asia; in 2011, more than four-fifths of all global under-five deaths occured in these two regions alone (Figure 6). Sub-Saharan Africa accounted for almost half (49%) of the global total in 2011. Despite rapid gains in reducing under-five mortality, South Asia’s share of global under-five deaths remains second highest, at 33% in 2011. In contrast, the rest of the world’s regions have seen their share fall from 32% in 1990 to 18% two decades later.
The highest regional rate of under-five mortality is found in sub-Saharan Africa, where, on average, 1 in 9 children dies before age 5. In some countries, the total number of under-five deaths has increased: Democratic Republic of the Congo, Chad, Somalia, Mali, Cameroon and Burkina Faso have experienced rises in their national burden of under-five deaths by 10,000 or more for 2011 as compared to 1990, due to a combination of population growth and insufficient decline of under-five mortality.
The outlook for child mortality in sub-Saharan Africa is made more uncer-tain by expected demographic changes: Of the world’s regions, it is the only one where the number of births and the under-five population are set to substantially increase this century. If current trends persist, by mid-century, 1 in 3 children in the world will be born in sub-Saharan Africa, and its under-five population will grow rapidly (Figure 7).3
gaPS in ProgreSS The growing breach between the rest of the world and sub- Saharan Africa and South Asia underscores the inequities that remain in child survival. In 2011, about half of global under-five deaths occurred in just five countries: India, Nigeria, the Demo-cratic Republic of the Congo, Pakistan and China. Four of these (all but the Democratic Republic of the Congo) are populous middle-income countries. India and Nigeria together accounted for more than one-third of the total number of under-five deaths worldwide (Figure 8). Across regions, the least developed coun-tries consistently have higher rates of under-five mortality than more affluent countries.
Levels and trends in child mortality
The under-five population in sub-Saharan Africa will rise quickly over the coming decades
You,D.an
dD.Anth
ony,Ge
neration
2025an
dbeyond,
UNIC
EF
OccasionalPapers
No.1,UNICE
F,Septe
mber2012.
FIG. 7Numberofchildrenunderage5,byregion,1950-2050
0
50
100
150
200
250
1950 1970 1990 2010 2030 2050
CEE/CIS
Restoftheworld
LatinAmerica&CaribbeanMiddleEast&NorthAfrica
SouthAsia
Sub-SaharanAfrica
0
EastAsia&Pacific
Populat
ion(in
millions)
Source:IGM
E2012.
Numberofunder-fivedeathsbycountry(thousandsandpercentageshareofglobaltotal)
Half of all under-five deaths occur in just five countries
FIG. 8
India 1.7 million = 24%
Nigeria 756,000 = 11%
Democratic Republic of the Congo 465,000 = 7%
Pakistan 352,000 = 5%China 249,000 = 4%Ethiopia 194,000 = 3%
Indonesia 134,000 = 2%Bangladesh 134,000 = 2%Uganda 131,000 = 2%Afghanistan 128,000 = 2%
Other 2.7 million = 39%
Source:U
NICE
Fanaly
sisbasedonIGME
2012.
Percentageshareofunder-fivedeathsbyregion,1990-2011FIG. 6
The global burden of under-five deaths is increasingly concentrated in sub-Saharan Africa and South Asia
*ExcludesDjiboutiandSudanastheyareincludedinsub-SaharanAfrica.
0
50
25
75
100
2005 201120101990 1995 2000Sub-SaharanAfrica
Rest of the world
Middle East and North Africa*
CEE/CISLatin America and the Caribbean
East Asia and Pacific
South Asia
%sh
areo
funder-fiv
edeaths
0
50
25
75
100
10
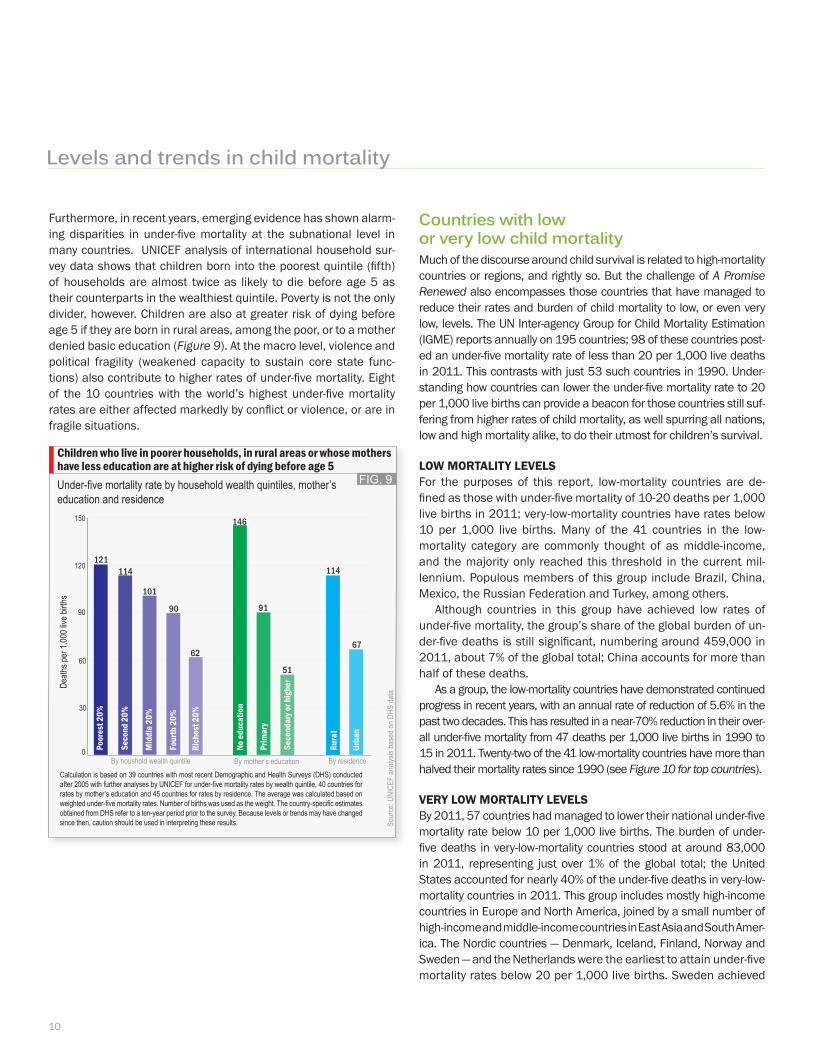
Furthermore, in recent years, emerging evidence has shown alarm-ing disparities in under-five mortality at the subnational level in many countries. UNICEF analysis of international household sur-vey data shows that children born into the poorest quintile (fifth) of households are almost twice as likely to die before age 5 as their counterparts in the wealthiest quintile. Poverty is not the only divider, however. Children are also at greater risk of dying before age 5 if they are born in rural areas, among the poor, or to a mother denied basic education (Figure 9). At the macro level, violence and political fragility (weakened capacity to sustain core state func-tions) also contribute to higher rates of under-five mortality. Eight of the 10 countries with the world’s highest under-five mortality rates are either affected markedly by conflict or violence, or are in fragile situations.
Countries with low or very low child mortalityMuch of the discourse around child survival is related to high-mortality countries or regions, and rightly so. But the challenge of A Promise Renewed also encompasses those countries that have managed to reduce their rates and burden of child mortality to low, or even very low, levels. The UN Inter-agency Group for Child Mortality Estimation (IGME) reports annually on 195 countries; 98 of these countries post-ed an under-five mortality rate of less than 20 per 1,000 live deaths in 2011. This contrasts with just 53 such countries in 1990. Under-standing how countries can lower the under-five mortality rate to 20 per 1,000 live births can provide a beacon for those countries still suf-fering from higher rates of child mortality, as well spurring all nations, low and high mortality alike, to do their utmost for children’s survival.
low mortality levelSFor the purposes of this report, low-mortality countries are de-fined as those with under-five mortality of 10-20 deaths per 1,000 live births in 2011; very-low-mortality countries have rates below 10 per 1,000 live births. Many of the 41 countries in the low- mortality category are commonly thought of as middle-income, and the majority only reached this threshold in the current mil-lennium. Populous members of this group include Brazil, China, Mexico, the Russian Federation and Turkey, among others.
Although countries in this group have achieved low rates of under-five mortality, the group’s share of the global burden of un-der-five deaths is still significant, numbering around 459,000 in 2011, about 7% of the global total; China accounts for more than half of these deaths.
As a group, the low-mortality countries have demonstrated continued progress in recent years, with an annual rate of reduction of 5.6% in the past two decades. This has resulted in a near-70% reduction in their over-all under-five mortality from 47 deaths per 1,000 live births in 1990 to 15 in 2011. Twenty-two of the 41 low-mortality countries have more than halved their mortality rates since 1990 (see Figure 10 for top countries).
very low mortality levelSBy 2011, 57 countries had managed to lower their national under-five mortality rate below 10 per 1,000 live births. The burden of under-five deaths in very-low-mortality countries stood at around 83,000 in 2011, representing just over 1% of the global total; the United States accounted for nearly 40% of the under-five deaths in very-low- mortality countries in 2011. This group includes mostly high-income countries in Europe and North America, joined by a small number of high-income and middle-income countries in East Asia and South Amer-ica. The Nordic countries — Denmark, Iceland, Finland, Norway and Sweden — and the Netherlands were the earliest to attain under-five mortality rates below 20 per 1,000 live births. Sweden achieved
Levels and trends in child mortality
Source:U
NICE
Fanaly
sisbasedonDH
Sdata.
Calculationisbasedon39countrieswithmostrecentDemographicandHealthSurveys(DHS)conductedafter2005withfurtheranalysesbyUNICEFforunder-fivemortalityratesbywealthquintile,40countriesforratesbymother’seducationand45countriesforratesbyresidence.Theaveragewascalculatedbasedonweightedunder-fivemortalityrates.Numberofbirthswasusedastheweight.Thecountry-specificestimatesobtainedfromDHSrefertoaten-yearperiodpriortothesurvey.Becauselevelsortrendsmayhavechangedsincethen,cautionshouldbeusedininterpretingtheseresults.
FIG. 9
Children who live in poorer households, in rural areas or whose mothers have less education are at higher risk of dying before age 5Under-fivemortalityratebyhouseholdwealthquintiles,mother’seducation and residence
Death
sper1,000live
birth
s
Seco
nd 2
0%
Mid
dle 2
0%
0
30
60
90
120
150
Byhousholdwealthquintile Bymother’seducation By residence
121114
101
90
62
146
91
51
114
67
Poor
est 2
0%
Seco
nd 2
0%
Mid
dle 2
0%
four
th 2
0%
Rich
est 2
0%
No ed
ucat
ion
Prim
ary
Seco
ndar
y or h
ighe
r
rura
l
Urba
n
11
this landmark first, in 1959; the other four, along with the Neth-erlands, had all achieved this level by 1966. Next were France, Japan and Switzerland, all in 1968, followed by Australia, Canada, Luxembourg, New Zealand and the United Kingdom in 1972, and Belgium, Singapore and the United States in 1974. Oman was the last country to reach this threshold, in 2002. Figure 11 shows the 10 countries with the lowest under-five mortality rates.
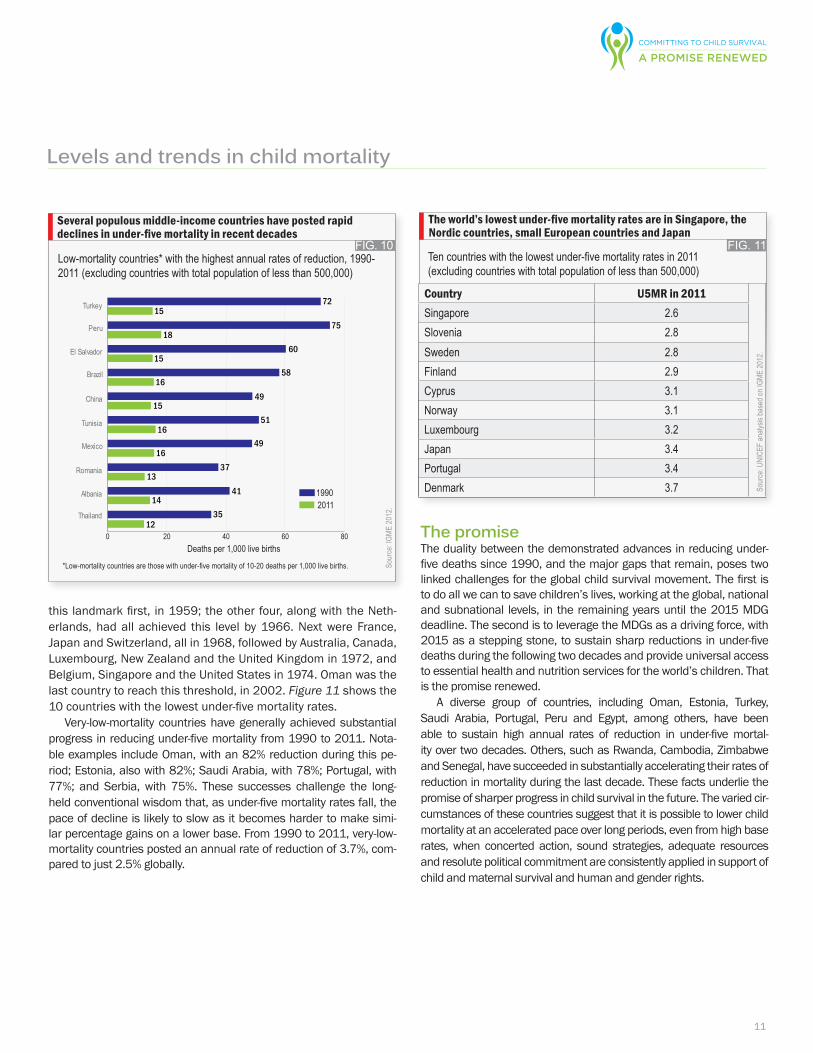
Very-low-mortality countries have generally achieved substantial progress in reducing under-five mortality from 1990 to 2011. Nota-ble examples include Oman, with an 82% reduction during this pe-riod; Estonia, also with 82%; Saudi Arabia, with 78%; Portugal, with 77%; and Serbia, with 75%. These successes challenge the long-held conventional wisdom that, as under-five mortality rates fall, the pace of decline is likely to slow as it becomes harder to make simi-lar percentage gains on a lower base. From 1990 to 2011, very-low- mortality countries posted an annual rate of reduction of 3.7%, com-pared to just 2.5% globally.
The promiseThe duality between the demonstrated advances in reducing under-five deaths since 1990, and the major gaps that remain, poses two linked challenges for the global child survival movement. The first is to do all we can to save children’s lives, working at the global, national and subnational levels, in the remaining years until the 2015 MDG deadline. The second is to leverage the MDGs as a driving force, with 2015 as a stepping stone, to sustain sharp reductions in under-five deaths during the following two decades and provide universal access to essential health and nutrition services for the world’s children. That is the promise renewed.
A diverse group of countries, including Oman, Estonia, Turkey, Saudi Arabia, Portugal, Peru and Egypt, among others, have been able to sustain high annual rates of reduction in under-five mortal-ity over two decades. Others, such as Rwanda, Cambodia, Zimbabwe and Senegal, have succeeded in substantially accelerating their rates of reduction in mortality during the last decade. These facts underlie the promise of sharper progress in child survival in the future. The varied cir-cumstances of these countries suggest that it is possible to lower child mortality at an accelerated pace over long periods, even from high base rates, when concerted action, sound strategies, adequate resources and resolute political commitment are consistently applied in support of child and maternal survival and human and gender rights.
Levels and trends in child mortality
Low-mortalitycountries*withthehighestannualratesofreduction,1990-2011(excludingcountrieswithtotalpopulationoflessthan500,000)
Several populous middle-income countries have posted rapid declines in under-five mortality in recent decades
FIG. 10
Source:IGM
E2012.
19902011
Deathsper1,000livebirths
72
7518
6015
5816
4915
5116
4916
3713
4114
3512
15
0 20 40 60 80
Turkey
Peru
El Salvador
Brazil
China
Tunisia
Mexico
Romania
Albania
Thailand
*Low-mortalitycountriesarethosewithunder-fivemortalityof10-20deathsper1,000livebirths.
FIG. 11Tencountrieswiththelowestunder-fivemortalityratesin2011(excludingcountrieswithtotalpopulationoflessthan500,000)
The world’s lowest under-five mortality rates are in Singapore, the Nordic countries, small European countries and Japan
Country U5MR in 2011
Source:U
NICE
Fanaly
sisba
sedo
nIGM
E2012.
Singapore 2.6Slovenia 2.8Sweden 2.8Finland 2.9Cyprus 3.1Norway 3.1Luxembourg 3.2Japan 3.4Portugal 3.4Denmark 3.7
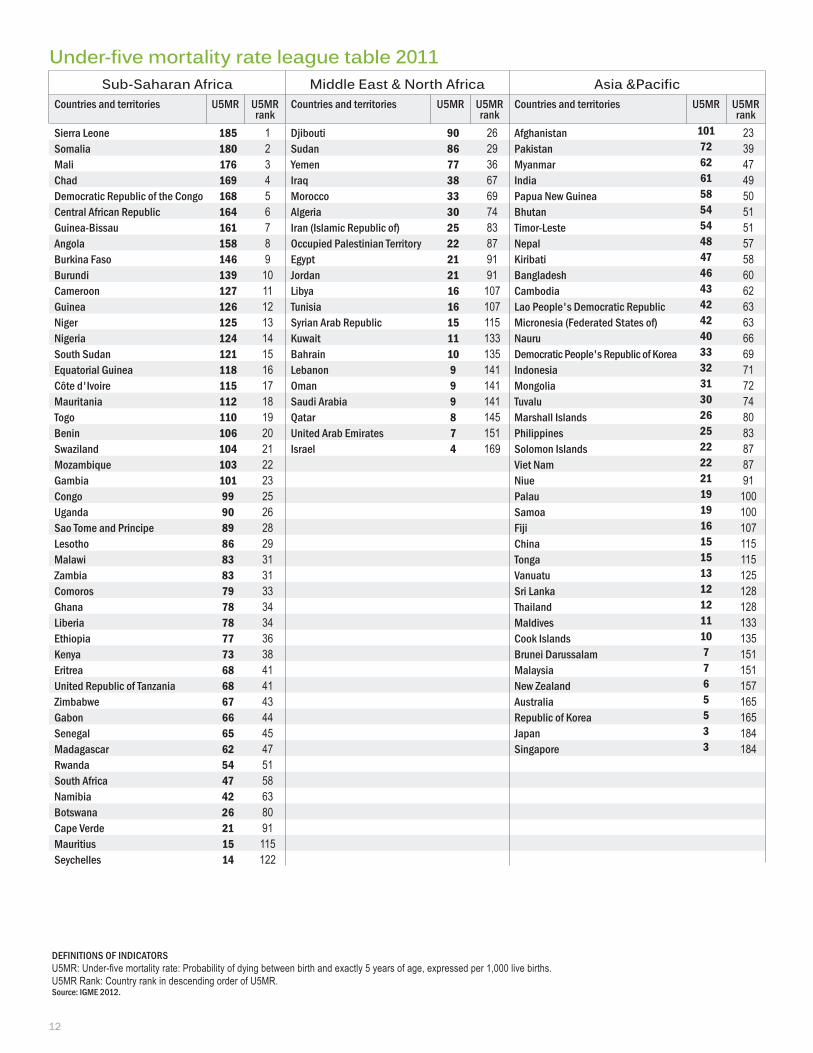
Under-five mortality rate league table 2011Sub-Saharan Africa Middle East & North Africa Asia &Pacific
Countries and territories U5MR U5MR rank
Countries and territories U5MR U5MR rank
Countries and territories U5MR U5MR rank
Sierra Leone 185 1 Djibouti 90 26 Afghanistan 101 23Somalia 180 2 Sudan 86 29 Pakistan 72 39Mali 176 3 Yemen 77 36 Myanmar 62 47Chad 169 4 Iraq 38 67 India 61 49Democratic Republic of the Congo 168 5 Morocco 33 69 Papua New Guinea 58 50Central African Republic 164 6 Algeria 30 74 Bhutan 54 51Guinea-Bissau 161 7 Iran (Islamic Republic of) 25 83 Timor-Leste 54 51Angola 158 8 Occupied Palestinian Territory 22 87 Nepal 48 57Burkina Faso 146 9 Egypt 21 91 Kiribati 47 58Burundi 139 10 Jordan 21 91 Bangladesh 46 60Cameroon 127 11 Libya 16 107 Cambodia 43 62Guinea 126 12 Tunisia 16 107 Lao People's Democratic Republic 42 63Niger 125 13 Syrian Arab Republic 15 115 Micronesia (Federated States of) 42 63Nigeria 124 14 Kuwait 11 133 Nauru 40 66South Sudan 121 15 Bahrain 10 135 Democratic People's Republic of Korea 33 69Equatorial Guinea 118 16 Lebanon 9 141 Indonesia 32 71Côte d'Ivoire 115 17 Oman 9 141 Mongolia 31 72Mauritania 112 18 Saudi Arabia 9 141 Tuvalu 30 74Togo 110 19 Qatar 8 145 Marshall Islands 26 80Benin 106 20 United Arab Emirates 7 151 Philippines 25 83Swaziland 104 21 Israel 4 169 Solomon Islands 22 87Mozambique 103 22 Viet Nam 22 87Gambia 101 23 Niue 21 91Congo 99 25 Palau 19 100Uganda 90 26 Samoa 19 100Sao Tome and Principe 89 28 Fiji 16 107Lesotho 86 29 China 15 115Malawi 83 31 Tonga 15 115Zambia 83 31 Vanuatu 13 125Comoros 79 33 Sri Lanka 12 128Ghana 78 34 Thailand 12 128Liberia 78 34 Maldives 11 133Ethiopia 77 36 Cook Islands 10 135Kenya 73 38 Brunei Darussalam 7 151Eritrea 68 41 Malaysia 7 151United Republic of Tanzania 68 41 New Zealand 6 157Zimbabwe 67 43 Australia 5 165Gabon 66 44 Republic of Korea 5 165Senegal 65 45 Japan 3 184Madagascar 62 47 Singapore 3 184Rwanda 54 51South Africa 47 58Namibia 42 63Botswana 26 80Cape Verde 21 91Mauritius 15 115Seychelles 14 122
DEFINITIONS OF INDICATORSU5MR:Under-fivemortalityrate:Probabilityofdyingbetweenbirthandexactly5yearsofage,expressedper1,000livebirths.U5MRRank:CountryrankindescendingorderofU5MR. Source: IGME 2012.
12
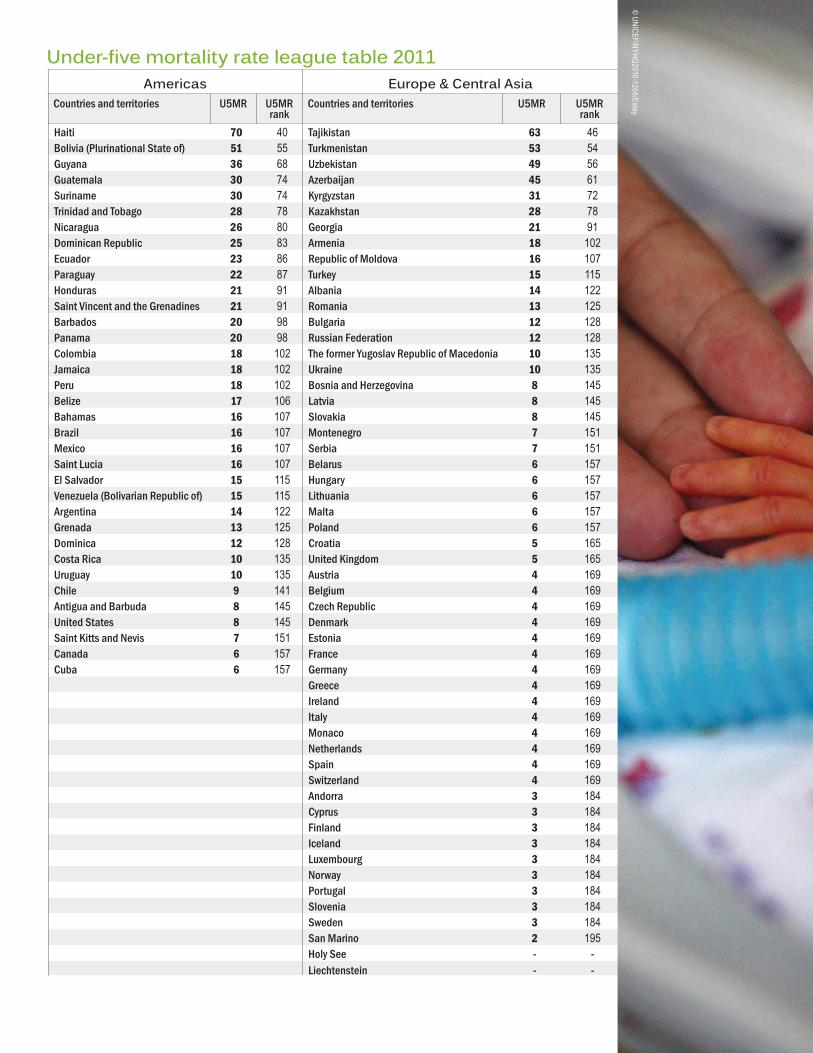
Under-five mortality rate league table 2011Americas Europe & Central Asia
Countries and territories U5MR U5MR rank
Countries and territories U5MR U5MR rank
Haiti 70 40 Tajikistan 63 46Bolivia (Plurinational State of) 51 55 Turkmenistan 53 54Guyana 36 68 Uzbekistan 49 56Guatemala 30 74 Azerbaijan 45 61Suriname 30 74 Kyrgyzstan 31 72Trinidad and Tobago 28 78 Kazakhstan 28 78Nicaragua 26 80 Georgia 21 91Dominican Republic 25 83 Armenia 18 102Ecuador 23 86 Republic of Moldova 16 107Paraguay 22 87 Turkey 15 115Honduras 21 91 Albania 14 122Saint Vincent and the Grenadines 21 91 Romania 13 125Barbados 20 98 Bulgaria 12 128Panama 20 98 Russian Federation 12 128Colombia 18 102 The former Yugoslav Republic of Macedonia 10 135Jamaica 18 102 Ukraine 10 135Peru 18 102 Bosnia and Herzegovina 8 145Belize 17 106 Latvia 8 145Bahamas 16 107 Slovakia 8 145Brazil 16 107 Montenegro 7 151Mexico 16 107 Serbia 7 151Saint Lucia 16 107 Belarus 6 157El Salvador 15 115 Hungary 6 157Venezuela (Bolivarian Republic of) 15 115 Lithuania 6 157Argentina 14 122 Malta 6 157Grenada 13 125 Poland 6 157Dominica 12 128 Croatia 5 165Costa Rica 10 135 United Kingdom 5 165Uruguay 10 135 Austria 4 169Chile 9 141 Belgium 4 169Antigua and Barbuda 8 145 Czech Republic 4 169United States 8 145 Denmark 4 169Saint Kitts and Nevis 7 151 Estonia 4 169Canada 6 157 France 4 169Cuba 6 157 Germany 4 169
Greece 4 169Ireland 4 169Italy 4 169Monaco 4 169Netherlands 4 169Spain 4 169Switzerland 4 169Andorra 3 184Cyprus 3 184Finland 3 184Iceland 3 184Luxembourg 3 184Norway 3 184Portugal 3 184Slovenia 3 184Sweden 3 184San Marino 2 195Holy See - -Liechtenstein - -
©UNICEF/NYHQ2010-1268/Estey
14
Chapter 2: Leading causes of child deaths
©UNICEF/NYHQ2007-1221-ShehzadNoorani
15
Chapter 2: Leading causes of child deaths
FIG. 12Globaldistributionofdeathsamongchildrenunderage5,bycause,2010
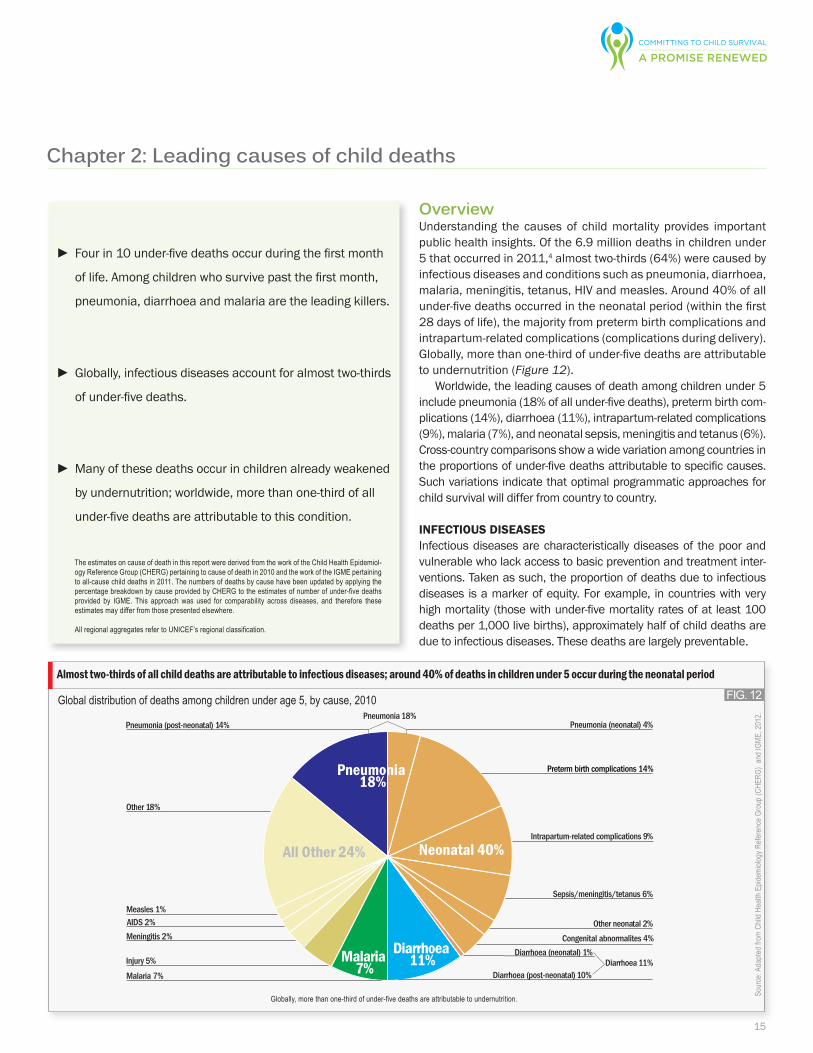
Almost two-thirds of all child deaths are attributable to infectious diseases; around 40% of deaths in children under 5 occur during the neonatal period
Source:A
daptedfrom
ChildHe
althEp
idemiolo
gyReferenceGroup(C
HERG
)andIGME
,2012.
Globally,morethanone-thirdofunder-fivedeathsareattributabletoundernutrition.
OverviewUnderstanding the causes of child mortality provides important public health insights. Of the 6.9 million deaths in children under 5 that occurred in 2011,4 almost two-thirds (64%) were caused by infectious diseases and conditions such as pneumonia, diarrhoea, malaria, meningitis, tetanus, HIV and measles. Around 40% of all under-five deaths occurred in the neonatal period (within the first 28 days of life), the majority from preterm birth complications and intrapartum-related complications (complications during delivery). Globally, more than one-third of under-five deaths are attributable to undernutrition (Figure 12).
Worldwide, the leading causes of death among children under 5 include pneumonia (18% of all under-five deaths), preterm birth com-plications (14%), diarrhoea (11%), intrapartum-related complications (9%), malaria (7%), and neonatal sepsis, meningitis and tetanus (6%). Cross-country comparisons show a wide variation among countries in the proportions of under-five deaths attributable to specific causes. Such variations indicate that optimal programmatic approaches for child survival will differ from country to country.
inFectiouS diSeaSeSInfectious diseases are characteristically diseases of the poor and vulnerable who lack access to basic prevention and treatment inter-ventions. Taken as such, the proportion of deaths due to infectious diseases is a marker of equity. For example, in countries with very high mortality (those with under-five mortality rates of at least 100 deaths per 1,000 live births), approximately half of child deaths are due to infectious diseases. These deaths are largely preventable.
18
► Four in 10 under-five deaths occur during the first month
of life. Among children who survive past the first month,
pneumonia, diarrhoea and malaria are the leading killers.
► Globally, infectious diseases account for almost two-thirds
of under-five deaths.
► Many of these deaths occur in children already weakened
by undernutrition; worldwide, more than one-third of all
under-five deaths are attributable to this condition.
TheestimatesoncauseofdeathinthisreportwerederivedfromtheworkoftheChildHealthEpidemiol-ogyReferenceGroup(CHERG)pertainingtocauseofdeathin2010andtheworkoftheIGMEpertainingtoall-causechilddeathsin2011.ThenumbersofdeathsbycausehavebeenupdatedbyapplyingthepercentagebreakdownbycauseprovidedbyCHERGtotheestimatesofnumberofunder-fivedeathsprovided by IGME. This approach was used for comparability across diseases, and therefore theseestimatesmaydifferfromthosepresentedelsewhere.
AllregionalaggregatesrefertoUNICEF’sregionalclassification.
Pneumonia (post-neonatal) 14%
Injury 5%
Meningitis 2%AIDS 2%Measles 1%
Other 18%
Pneumonia 18%
Neonatal 40%
Diarrhoea 11%Malaria
7%
All Other 24%
Pneumonia 18%
Malaria 7%
Pneumonia (neonatal) 4%
Sepsis/meningitis/tetanus 6%
Congenital abnormalites 4%Other neonatal 2%
Diarrhoea (neonatal) 1%
Diarrhoea (post-neonatal) 10%
Preterm birth complications 14%
Diarrhoea 11%
Intrapartum-related complications 9%
16
Leading causes of child deaths
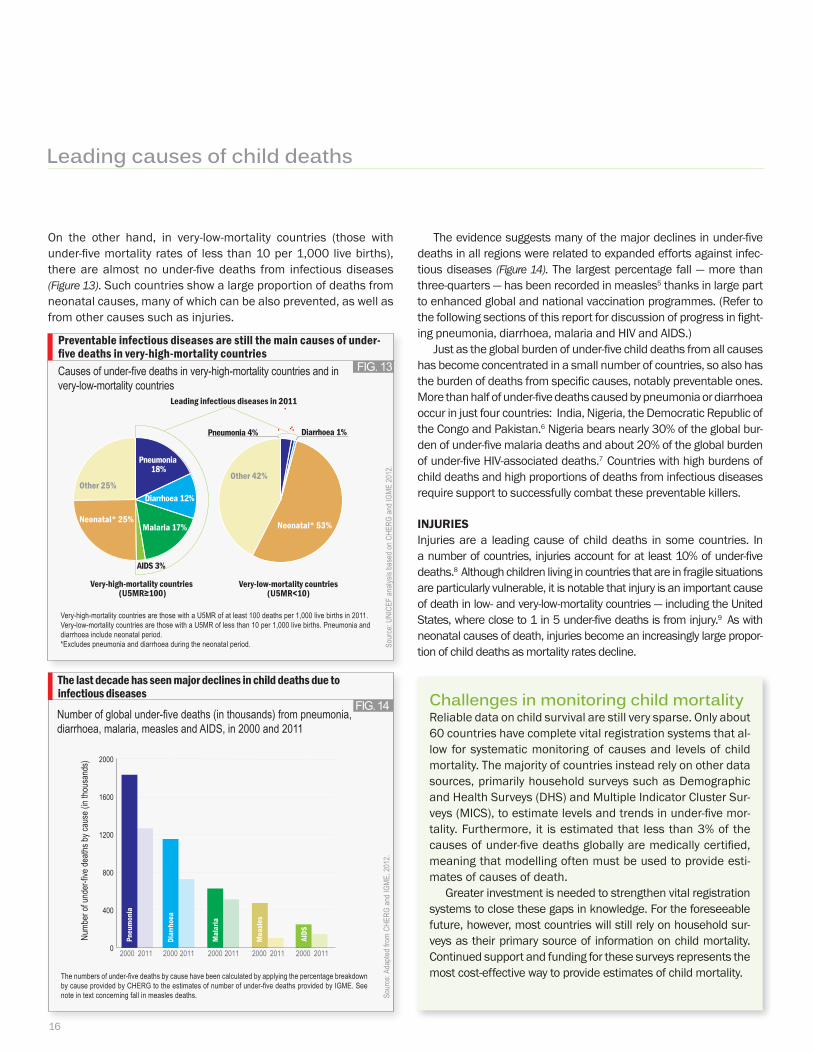
On the other hand, in very-low-mortality countries (those with under-five mortality rates of less than 10 per 1,000 live births), there are almost no under-five deaths from infectious diseases (Figure 13). Such countries show a large proportion of deaths from neonatal causes, many of which can be also prevented, as well as from other causes such as injuries.
The evidence suggests many of the major declines in under-five deaths in all regions were related to expanded efforts against infec-tious diseases (Figure 14). The largest percentage fall — more than three-quarters — has been recorded in measles5 thanks in large part to enhanced global and national vaccination programmes. (Refer to the following sections of this report for discussion of progress in fight-ing pneumonia, diarrhoea, malaria and HIV and AIDS.)
Just as the global burden of under-five child deaths from all causes has become concentrated in a small number of countries, so also has the burden of deaths from specific causes, notably preventable ones. More than half of under-five deaths caused by pneumonia or diarrhoea occur in just four countries: India, Nigeria, the Democratic Republic of the Congo and Pakistan.6 Nigeria bears nearly 30% of the global bur-den of under-five malaria deaths and about 20% of the global burden of under-five HIV-associated deaths.7 Countries with high burdens of child deaths and high proportions of deaths from infectious diseases require support to successfully combat these preventable killers.
injurieSInjuries are a leading cause of child deaths in some countries. In a number of countries, injuries account for at least 10% of under-five deaths.8 Although children living in countries that are in fragile situations are particularly vulnerable, it is notable that injury is an important cause of death in low- and very-low-mortality countries — including the United States, where close to 1 in 5 under-five deaths is from injury.9 As with neonatal causes of death, injuries become an increasingly large propor-tion of child deaths as mortality rates decline.
FIG. 13Causesofunder-fivedeathsinvery-high-mortalitycountriesandinvery-low-mortalitycountries
Preventable infectious diseases are still the main causes of under-five deaths in very-high-mortality countries
Source:U
NICE
Fanaly
sisbasedonCH
ERGandIGME
2012.
Other 25%
Neonatal* 25%
AIDS 3%
Malaria 17%
Diarrhoea 12%
Pneumonia 18%
Neonatal* 53%
Other 42%
Pneumonia 4%
Very-low-mortality countries(U5MR<10)
Diarrhoea 1%
leading infectious diseases in 2011
Very-high-mortalitycountriesarethosewithaU5MRofatleast100deathsper1,000livebirthsin2011.Very-low-mortalitycountriesarethosewithaU5MRoflessthan10per1,000livebirths.Pneumoniaanddiarrhoeaincludeneonatalperiod.*Excludespneumoniaanddiarrhoeaduringtheneonatalperiod.
Challenges in monitoring child mortality Reliable data on child survival are still very sparse. Only about 60 countries have complete vital registration systems that al-low for systematic monitoring of causes and levels of child mortality. The majority of countries instead rely on other data sources, primarily household surveys such as Demographic and Health Surveys (DHS) and Multiple Indicator Cluster Sur-veys (MICS), to estimate levels and trends in under-five mor-tality. Furthermore, it is estimated that less than 3% of the causes of under-five deaths globally are medically certified, meaning that modelling often must be used to provide esti-mates of causes of death.
Greater investment is needed to strengthen vital registration systems to close these gaps in knowledge. For the foreseeable future, however, most countries will still rely on household sur-veys as their primary source of information on child mortality. Continued support and funding for these surveys represents the most cost-effective way to provide estimates of child mortality.
FIG. 14
Numberofglobalunder-fivedeaths(inthousands)frompneumonia,diarrhoea,malaria,measlesandAIDS,in2000and2011
The last decade has seen major declines in child deaths due to infectious diseases
Source:A
daptedfrom
CHE
RGandIG
ME,2012.
Thenumbersofunder-fivedeathsbycausehavebeencalculatedbyapplyingthepercentagebreakdownbycauseprovidedbyCHERGtotheestimatesofnumberofunder-fivedeathsprovidedbyIGME.Seenoteintextconcerningfallinmeaslesdeaths.
0
400
800
1200
1600
2000
Pneu
mon
ia
Diar
rhoe
a
Mal
aria
Mea
sles
AIDS
2000 2011 2000 2011 2000 2011 2000 2011 2000 2011
Numb
erofun
der-five
death
sbyc
ause(in
thousands)
Pneumonia
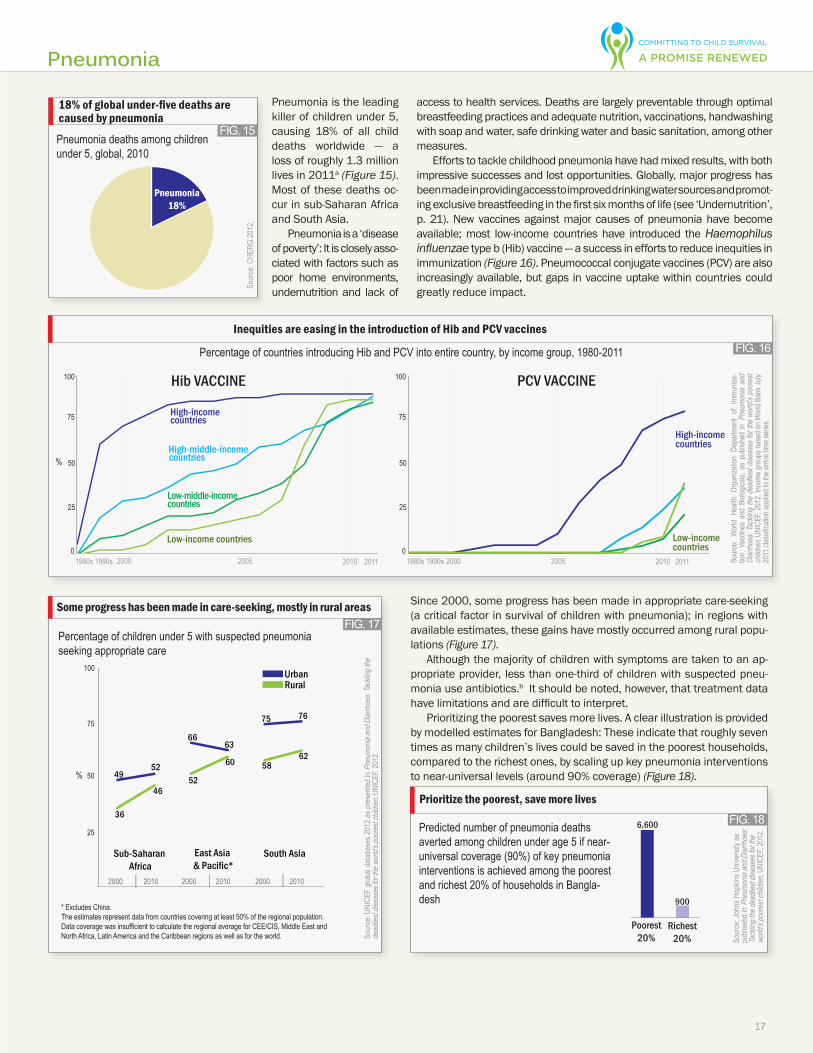
Pneumonia is the leading killer of children under 5, causing 18% of all child deaths worldwide — a loss of roughly 1.3 million lives in 2011a (Figure 15). Most of these deaths oc-cur in sub-Saharan Africa and South Asia.
Pneumonia is a ‘disease of poverty’: It is closely asso-ciated with factors such as poor home environments, undernutrition and lack of
access to health services. Deaths are largely preventable through optimal breastfeeding practices and adequate nutrition, vaccinations, handwashing with soap and water, safe drinking water and basic sanitation, among other measures.
Efforts to tackle childhood pneumonia have had mixed results, with both impressive successes and lost opportunities. Globally, major progress has been made in providing access to improved drinking water sources and promot-ing exclusive breastfeeding in the first six months of life (see ‘Undernutrition’, p. 21). New vaccines against major causes of pneumonia have become available; most low-income countries have introduced the Haemophilus influenzae type b (Hib) vaccine — a success in efforts to reduce inequities in immunization (Figure 16). Pneumococcal conjugate vaccines (PCV) are also increasingly available, but gaps in vaccine uptake within countries could greatly reduce impact.
Since 2000, some progress has been made in appropriate care-seeking (a critical factor in survival of children with pneumonia); in regions with available estimates, these gains have mostly occurred among rural popu-lations (Figure 17).
Although the majority of children with symptoms are taken to an ap-propriate provider, less than one-third of children with suspected pneu-monia use antibiotics.b It should be noted, however, that treatment data have limitations and are difficult to interpret.
Prioritizing the poorest saves more lives. A clear illustration is provided by modelled estimates for Bangladesh: These indicate that roughly seven times as many children’s lives could be saved in the poorest households, compared to the richest ones, by scaling up key pneumonia interventions to near-universal levels (around 90% coverage) (Figure 18).
17
Predictednumberofpneumoniadeathsavertedamongchildrenunderage5ifnear-universalcoverage(90%)ofkeypneumoniainterventionsisachievedamongthepoorestandrichest20%ofhouseholdsinBangla-desh
Prioritize the poorest, save more lives
Source:JohnsHopkin
sUniv
ersitya
spublisehdinPneum
oniaandD
iarrho
ea:
Tacklingthede
adliestdis
easesforthe
wo
rld’spoore
stchildren
,UNICE
F,2012.6,600
900
Poorest20%
Richest20%
FIG. 18
a18
Pneumoniadeathsamongchildrenunder5,global,2010
18% of global under-five deaths are caused by pneumonia
Source:C
HERG
2012.
FIG. 15
Pneumonia18%
FIG. 17Percentageofchildrenunder5withsuspectedpneumoniaseekingappropriatecare
Source:U
NICE
Fglo
baldatabases2012aspresentedinPneum
oniaandD
iarrho
ea:Tacklingthe
deadliestdis
easesforthe
world’s
poore
stchildren
,UNICE
F,2012.
Some progress has been made in care-seeking, mostly in rural areas
*ExcludesChina.Theestimatesrepresentdatafromcountriescoveringatleast50%oftheregionalpopulation.DatacoveragewasinsufficienttocalculatetheregionalaverageforCEE/CIS,MiddleEastandNorthAfrica,LatinAmericaandtheCaribbeanregionsaswellasfortheworld.
36
46 52
60 58 62
4952
6663
75 76
25
50
75
100
2000 2010 2000 2010 2000 2010
Sub-Saharan Africa
East Asia & Pacific*
South Asia
RuralUrban
%
PercentageofcountriesintroducingHibandPCVintoentirecountry,byincomegroup,1980-2011
Inequities are easing in the introduction of Hib and PCV vaccines
Source:World
Health
Organiz
ationD
epartmentof
Immu
niza-
tion,
Vaccine
sandBiolo
gicals
,aspublishedin
Pneum
onia
and
Diarr
hoea:Tacklingth
edeadliestdis
easesfor
theworld’s
poores
tchildren
,UNICE
F,2012.In
come
groupsba
sedo
nWorldBa
nkJu
ly2011classifi
cationa
ppliedtotheen
tiretim
eseries
.
Hib VACCINE PCV VACCINE
FIG. 16
High-income countries
High-middle-income countries
Low-middle-income countries
Low-income countries
1980s1990s 1980s1990s0 0
100 100
75 75
25 25
50 50
2011 2000 2005 2010 2011
High-income countries
Low-income countries
2000 2005 2010
%
Diarrhoea
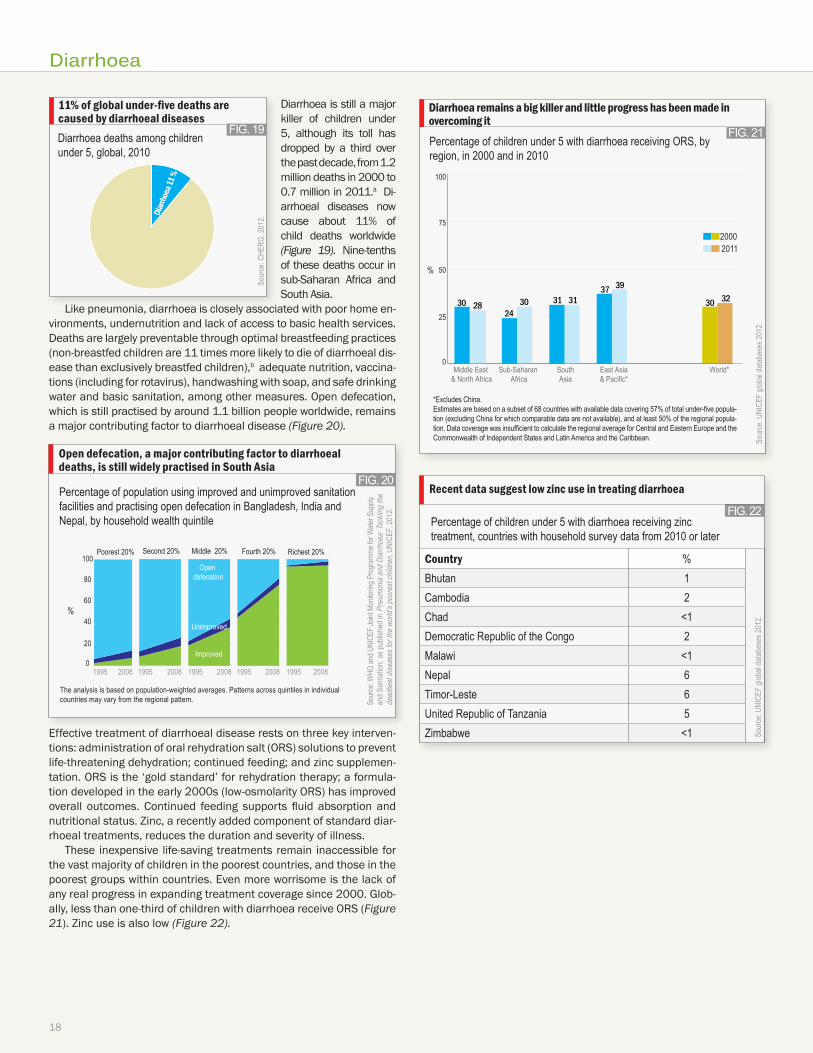
Diarrhoea is still a major killer of children under 5, although its toll has dropped by a third over the past decade, from 1.2 million deaths in 2000 to 0.7 million in 2011.a Di-arrhoeal diseases now cause about 11% of child deaths worldwide (Figure 19). Nine-tenths of these deaths occur in sub-Saharan Africa and South Asia.
Like pneumonia, diarrhoea is closely associated with poor home en-vironments, undernutrition and lack of access to basic health services. Deaths are largely preventable through optimal breastfeeding practices (non-breastfed children are 11 times more likely to die of diarrhoeal dis-ease than exclusively breastfed children),b adequate nutrition, vaccina-tions (including for rotavirus), handwashing with soap, and safe drinking water and basic sanitation, among other measures. Open defecation, which is still practised by around 1.1 billion people worldwide, remains a major contributing factor to diarrhoeal disease (Figure 20).
Effective treatment of diarrhoeal disease rests on three key interven-tions: administration of oral rehydration salt (ORS) solutions to prevent life-threatening dehydration; continued feeding; and zinc supplemen-tation. ORS is the ‘gold standard’ for rehydration therapy; a formula-tion developed in the early 2000s (low-osmolarity ORS) has improved overall outcomes. Continued feeding supports fluid absorption and nutritional status. Zinc, a recently added component of standard diar-rhoeal treatments, reduces the duration and severity of illness.
These inexpensive life-saving treatments remain inaccessible for the vast majority of children in the poorest countries, and those in the poorest groups within countries. Even more worrisome is the lack of any real progress in expanding treatment coverage since 2000. Glob-ally, less than one-third of children with diarrhoea receive ORS (Figure 21). Zinc use is also low (Figure 22).
18
11% of global under-five deaths are caused by diarrhoeal diseases
Source:C
HERG
,2012.
FIG. 19Dia
rrhoe
a 11
Diarrh
oea 1
1 %
Diarrhoeadeathsamongchildrenunder5,global,2010
FIG. 20
Open defecation, a major contributing factor to diarrhoeal deaths, is still widely practised in South Asia
Source:W
HOan
dUNICE
FJointMonitoringP
rogram
meforW
aterS
upply
andSa
nitation
;asp
ublishedinPn
eumo
niaan
dDiarrhoea:Tacklingthe
deadliestdis
easesforthew
orld’sp
oorestchildren,UN
ICEF
,2012.
PercentageofpopulationusingimprovedandunimprovedsanitationfacilitiesandpractisingopendefecationinBangladesh,IndiaandNepal,byhouseholdwealthquintile
Theanalysisisbasedonpopulation-weightedaverages.Patternsacrossquintilesinindividualcountriesmayvaryfromtheregionalpattern.
Opendefecation
Unimproved
Improved
%
Second 20%Poorest20% Middle 20% Fourth20% Richest20%100
80
60
40
20
01995 2008 1995 2008 1995 2008 1995 2008 1995 2008
Diarrhoea remains a big killer and little progress has been made in overcoming it
Source:U
NICE
Fglo
baldatabases2012.
FIG. 21
*ExcludesChina.Estimatesarebasedonasubsetof68countrieswithavailabledatacovering57%oftotalunder-fivepopula-tion(excludingChinaforwhichcomparabledataarenotavailable),andatleast50%oftheregionalpopula-tion.DatacoveragewasinsufficienttocalculatetheregionalaverageforCentralandEasternEuropeandtheCommonwealthofIndependentStatesandLatinAmericaandtheCaribbean.
Percentageofchildrenunder5withdiarrhoeareceivingORS,byregion,in2000andin2010
30 2824
30 31 3137 39
30 32
0
25
50
75
100
World*East Asia&Pacific*
SouthAsia
Sub-SaharanAfrica
Middle East &NorthAfrica
20002011
%
FIG. 22
Recent data suggest low zinc use in treating diarrhoea
Percentageofchildrenunder5withdiarrhoeareceivingzinctreatment,countrieswithhouseholdsurveydatafrom2010orlater
Country %
Source:U
NICE
Fglo
baldatabases2012.
Bhutan 1Cambodia 2Chad <1DemocraticRepublicoftheCongo 2Malawi <1Nepal 6Timor-Leste 6UnitedRepublicofTanzania 5Zimbabwe <1

Malaria is among the big-gest killers of children under 5, accounting for 7% of child deaths world-wide — a loss of roughly 0.5 million lives in 2011a
(Figure 23). Nearly all of these deaths occur in sub-Saharan Africa. Nevertheless, the last decade has seen sub-stantial gains in combat-ing malaria transmission and reducing deaths.
Global financing for malaria control has risen substantially over the past decade, thanks in large part to efforts by the Global Fund to Fight AIDS, Malaria and Tuberculosis; the US President’s Malaria Initiative; and the World Bank Malaria Booster Program.
Today, about half of all African households own at least one in-secticide-treated mosquito net (ITN) — a major improvement over the dismally low availability in 2000. The proportion of children under 5 in Africa that sleep under ITNs has risen from 2% in 2000 to 38% in 2010,b with some countries attaining levels of over 60% (Figure 24). Recent studies confirm that the best way to further increase use of ITNs is simply to provide more of them: Even in households that already own at least one net, children still may not sleep under a net because not enough nets are available for all family members.c
In 2010, the World Health Organization (WHO) instituted a major shift in malaria treatment procedures by recommending diagnostic testing of all suspected cases before starting anti-malarial treatmentd (the previous recommendation had been to presumptively treat all febrile children in malaria-endemic areas). Test-based malaria case management has great potential to improve malaria case detection,
as well as treatment of other causes of fever, such as pneumonia. National health systems are now building up diagnostic capacities, but test use is still low and is unduly concentrated in urban areas (Figure 25). Diagnosis and treatment must prioritize children who are at greatest risk of malaria — often those in rural areas.
Malaria
19
Source:CH
ERG2012.
Malariadeathsamongchildrenunder5,global,2010
7% of global under-five deaths are caused by malaria
ia 7
FIG. 23
Mala
ria 7%
%
FIG. 25Percentageofchildrenunder5withfeverreceivingafingerorheelstickfortesting,Africancountrieswithdata,2008-2010
The use of tests to diagnose malaria is still low, and far lower in many high-risk rural areas
Source:U
NICE
Fglo
baldatabases2012.
Benin
‘09
Nige
ria ‘1
0
Malaw
i‘10
Zimbabw
e‘10-’11
Guine
a-Bi
ssau
‘10
Namibia
‘09
Swaziland‘1
0
Zamb
ia‘10
Rwanda‘10-’11
Madagascar‘08-’09
Chad‘10
Sene
gal ‘1
0-’11
Ugan
da ‘0
9
Sier
ra Le
one ‘
10
South
Sudan‘09
0
10
20
30
40
50
10
36 6 7 7 7
9
12
17 17 17
21
Togo
‘10
18
26 27
14
UrbanTotalRural
Demo
craticRepuclic
ofthe
Congo‘10
FIG. 24Percentageofchildrenunder5sleepingunderaninsecticide-treatedmosquitonet,forcountrieswithhouseholdsurveydatafrom2009orlater
Dramatic increases have been seen in the use of insecticide-treated mosquito nets
Source:U
NICE
Fglo
baldatabases2012.
0
25
50
75
100
50
1
103
17
1
20
2
28
1
29
2
35
0 0
43
11
34
7
36
1
38
8
42
1 1 1
45
3
23
56
3
57
2
64 64
27
70
Mali'06,'10
Niger '00,'10
United Republicof Tanzania '99,'10
Malawi'00,'10
SaoTome and
Principe'00,'09
Zambia '99,'10
Kenya '00,'09
Madagascar '00,'09
Burundi'00,'10
Timor-Leste'02,'10
Democratic Republic
oftheCongo'01,'10
Guinea-Bissau '00,'10
Namibia'07,'09
Uganda '01,'11
Senegal '00,'11
Nigeria '03,'10
Mauritania '04,'10
Djibouti '06,'09
Zimbabwe'06,'09
Chad'00,'10
4746%
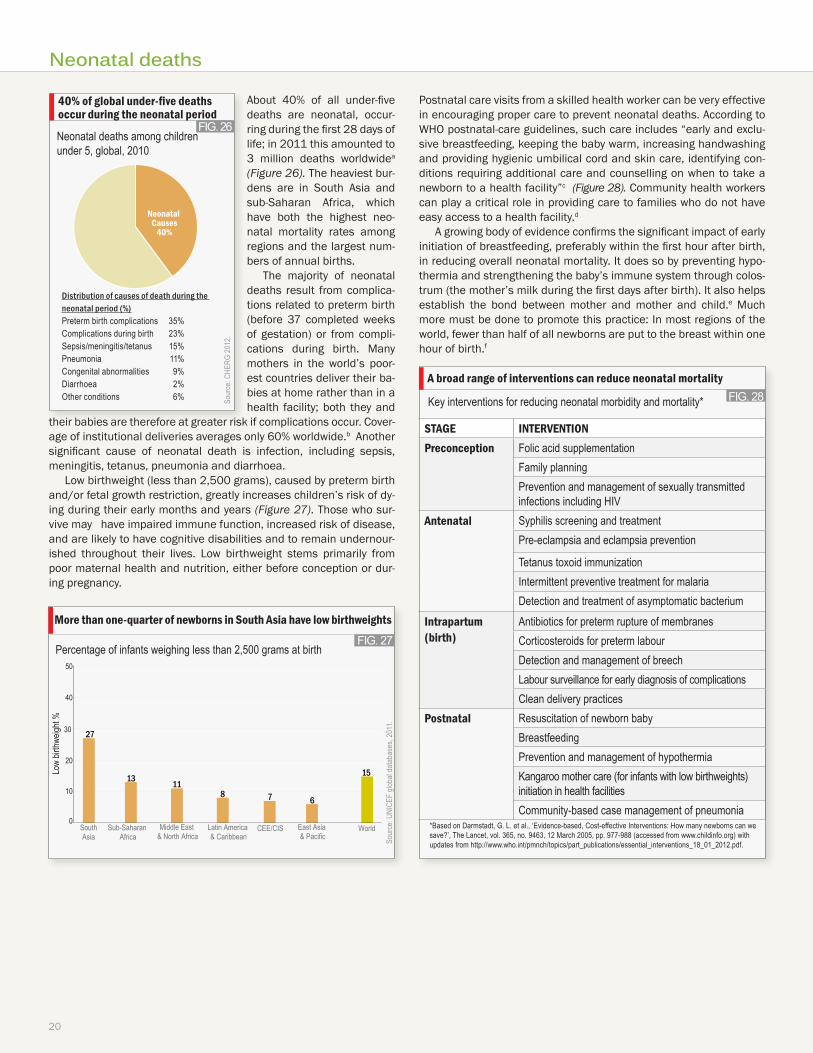
About 40% of all under-five deaths are neonatal, occur-ring during the first 28 days of life; in 2011 this amounted to 3 million deaths worldwidea (Figure 26). The heaviest bur-dens are in South Asia and sub-Saharan Africa, which have both the highest neo-natal mortality rates among regions and the largest num-bers of annual births.
The majority of neonatal deaths result from complica-tions related to preterm birth (before 37 completed weeks of gestation) or from compli-cations during birth. Many mothers in the world’s poor-est countries deliver their ba-bies at home rather than in a health facility; both they and
their babies are therefore at greater risk if complications occur. Cover-age of institutional deliveries averages only 60% worldwide.b Another significant cause of neonatal death is infection, including sepsis, meningitis, tetanus, pneumonia and diarrhoea.
Low birthweight (less than 2,500 grams), caused by preterm birth and/or fetal growth restriction, greatly increases children’s risk of dy-ing during their early months and years (Figure 27). Those who sur-vive may have impaired immune function, increased risk of disease, and are likely to have cognitive disabilities and to remain undernour-ished throughout their lives. Low birthweight stems primarily from poor maternal health and nutrition, either before conception or dur-ing pregnancy.
Postnatal care visits from a skilled health worker can be very effective in encouraging proper care to prevent neonatal deaths. According to WHO postnatal-care guidelines, such care includes “early and exclu-sive breastfeeding, keeping the baby warm, increasing handwashing and providing hygienic umbilical cord and skin care, identifying con-ditions requiring additional care and counselling on when to take a newborn to a health facility”c (Figure 28). Community health workers can play a critical role in providing care to families who do not have easy access to a health facility.d
A growing body of evidence confirms the significant impact of early initiation of breastfeeding, preferably within the first hour after birth, in reducing overall neonatal mortality. It does so by preventing hypo-thermia and strengthening the baby’s immune system through colos-trum (the mother’s milk during the first days after birth). It also helps establish the bond between mother and mother and child.e Much more must be done to promote this practice: In most regions of the world, fewer than half of all newborns are put to the breast within one hour of birth.f
A broad range of interventions can reduce neonatal mortality
STAgE INTERVENTIONPreconception Folicacidsupplementation
FamilyplanningPreventionandmanagementofsexuallytransmittedinfections including HIV
Antenatal SyphilisscreeningandtreatmentPre-eclampsiaandeclampsiaprevention
TetanustoxoidimmunizationIntermittentpreventivetreatmentformalariaDetectionandtreatmentofasymptomaticbacterium
Intrapartum (birth)
AntibioticsforpretermruptureofmembranesCorticosteroidsforpretermlabourDetectionandmanagementofbreechLaboursurveillanceforearlydiagnosisofcomplicationsCleandeliverypractices
Postnatal ResuscitationofnewbornbabyBreastfeedingPreventionandmanagementofhypothermiaKangaroomothercare(forinfantswithlowbirthweights)initiationinhealthfacilitiesCommunity-basedcasemanagementofpneumonia
FIG. 28Keyinterventionsforreducingneonatalmorbidityandmortality*
*BasedonDarmstadt,G.L.etal.,‘Evidence-based,Cost-effectiveInterventions:Howmanynewbornscanwesave?’,TheLancet,vol.365,no.9463,12March2005,pp.977-988(accessedfromwww.childinfo.org)withupdatesfromhttp://www.who.int/pmnch/topics/part_publications/essential_interventions_18_01_2012.pdf.
20
Neonatal deaths
FIG. 26
Neonataldeathsamongchildrenunder5,global,2010
40% of global under-five deaths occur during the neonatal period
Source:C
HERG
2012.
Distribution of causes of death during the neonatal period (%)Pretermbirthcomplications 35%Complicationsduringbirth 23%Sepsis/meningitis/tetanus 15%Pneumonia 11%Congenitalabnormalities 9%Diarrhoea 2%Otherconditions 6%
Diarrhoea 12 Diarrhoea 12Neonatal
causes40%
Percentageofinfantsweighinglessthan2,500gramsatbirth
More than one-quarter of newborns in South Asia have low birthweights
Source:U
NICE
Fglo
baldatabases,2011.
FIG. 27
0
30
10
20
40
50
East Asia &Pacific
CEE/CIS
WorldLatinAmerica
&CaribbeanMiddle East &NorthAfrica
Sub-SaharanAfrica
SouthAsia
27
13 118 7 6
15Lowbirthw
eight%
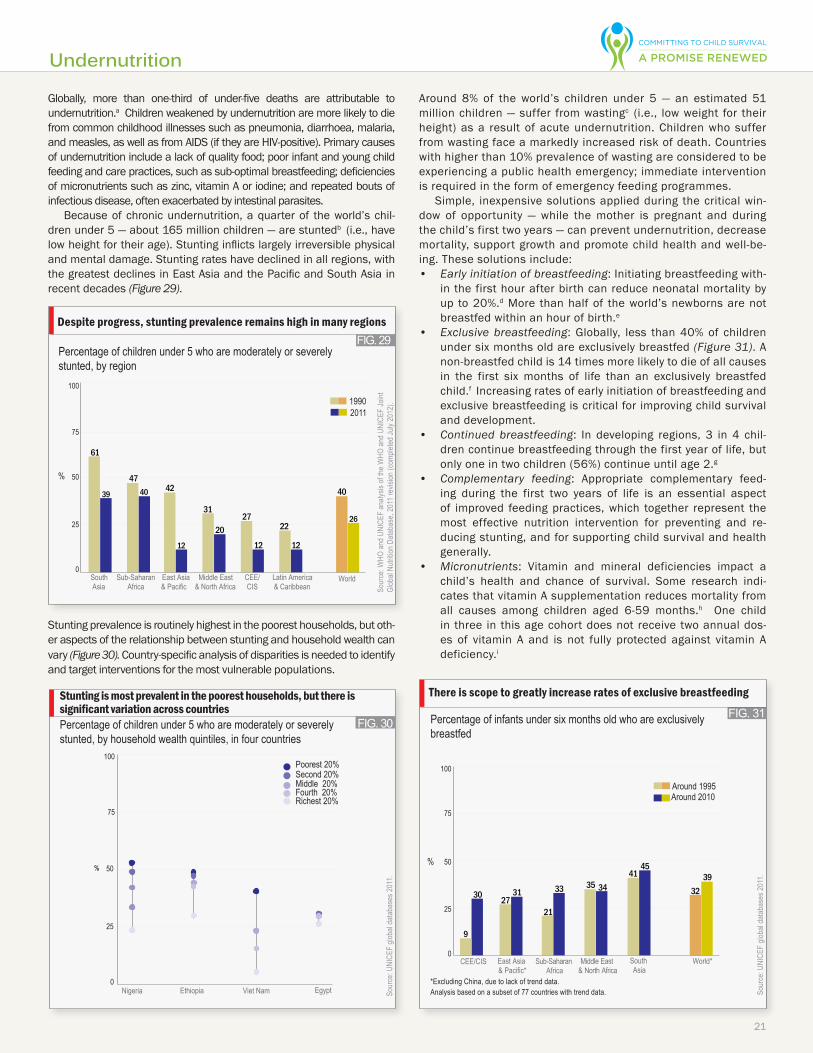
Globally, more than one-third of under-five deaths are attributable to undernutrition.a Children weakened by undernutrition are more likely to die from common childhood illnesses such as pneumonia, diarrhoea, malaria, and measles, as well as from AIDS (if they are HIV-positive). Primary causes of undernutrition include a lack of quality food; poor infant and young child feeding and care practices, such as sub-optimal breastfeeding; deficiencies of micronutrients such as zinc, vitamin A or iodine; and repeated bouts of infectious disease, often exacerbated by intestinal parasites.
Because of chronic undernutrition, a quarter of the world’s chil-dren under 5 — about 165 million children — are stuntedb (i.e., have low height for their age). Stunting inflicts largely irreversible physical and mental damage. Stunting rates have declined in all regions, with the greatest declines in East Asia and the Pacific and South Asia in recent decades (Figure 29).
Stunting prevalence is routinely highest in the poorest households, but oth-er aspects of the relationship between stunting and household wealth can vary (Figure 30). Country-specific analysis of disparities is needed to identify and target interventions for the most vulnerable populations.
Around 8% of the world’s children under 5 — an estimated 51 million children — suffer from wastingc (i.e., low weight for their height) as a result of acute undernutrition. Children who suffer from wasting face a markedly increased risk of death. Countries with higher than 10% prevalence of wasting are considered to be experiencing a public health emergency; immediate intervention is required in the form of emergency feeding programmes.
Simple, inexpensive solutions applied during the critical win-dow of opportunity — while the mother is pregnant and during the child’s first two years — can prevent undernutrition, decrease mortality, support growth and promote child health and well-be-ing. These solutions include:• Early initiation of breastfeeding: Initiating breastfeeding with-
in the first hour after birth can reduce neonatal mortality by up to 20%.d More than half of the world’s newborns are not breastfed within an hour of birth.e
• Exclusive breastfeeding: Globally, less than 40% of children under six months old are exclusively breastfed (Figure 31). A non-breastfed child is 14 times more likely to die of all causes in the first six months of life than an exclusively breastfed child.f Increasing rates of early initiation of breastfeeding and exclusive breastfeeding is critical for improving child survival and development.
• Continued breastfeeding: In developing regions, 3 in 4 chil-dren continue breastfeeding through the first year of life, but only one in two children (56%) continue until age 2.g
• Complementary feeding: Appropriate complementary feed-ing during the first two years of life is an essential aspect of improved feeding practices, which together represent the most effective nutrition intervention for preventing and re-ducing stunting, and for supporting child survival and health generally.
• Micronutrients: Vitamin and mineral deficiencies impact a child’s health and chance of survival. Some research indi-cates that vitamin A supplementation reduces mortality from all causes among children aged 6-59 months.h One child in three in this age cohort does not receive two annual dos-es of vitamin A and is not fully protected against vitamin A deficiency.i
21
Undernutrition
FIG. 30Percentageofchildrenunder5whoaremoderatelyorseverely
stunted,byhouseholdwealthquintiles,infourcountries
Stunting is most prevalent in the poorest households, but there is significant variation across countries
Source:U
NICE
Fglo
baldatabases2011.
Nigeria Ethiopia VietNam Egypt
Poorest20%Second 20%Middle 20%Fourth20%Richest20%
100
50
75
25
0
%
FIG. 31Percentageofinfantsundersixmonthsoldwhoareexclusivelybreastfed
There is scope to greatly increase rates of exclusive breastfeeding
Source:U
NICE
Fglo
baldatabases2011.
*ExcludingChina,duetolackoftrenddata.Analysisbasedonasubsetof77countrieswithtrenddata.
Around 2010Around 1995
9
30 2731
21
33 35 3441
45
3239
0
25
50
75
100
World*SouthAsia
Middle East &NorthAfrica
Sub-Saharan Africa
East Asia &Pacific*
CEE/CIS
%
Despite progress, stunting prevalence remains high in many regions
Percentageofchildrenunder5whoaremoderatelyorseverelystunted,byregion
FIG. 29
Source:W
HOandUNICE
Fanaly
sisoftheW
HOandUNICE
FJoint
GlobalNu
tritionDa
tabase,2011revis
ion(com
pletedJuly2012).
61
39 40 42
31
2027
12 1212
40
26
20111990
22
47
0
25
50
75
100
WorldLatinAmerica&Caribbean
CEE/CIS
Middle East &NorthAfrica
East Asia &Pacific
Sub-SaharanAfrica
South Asia
%
G
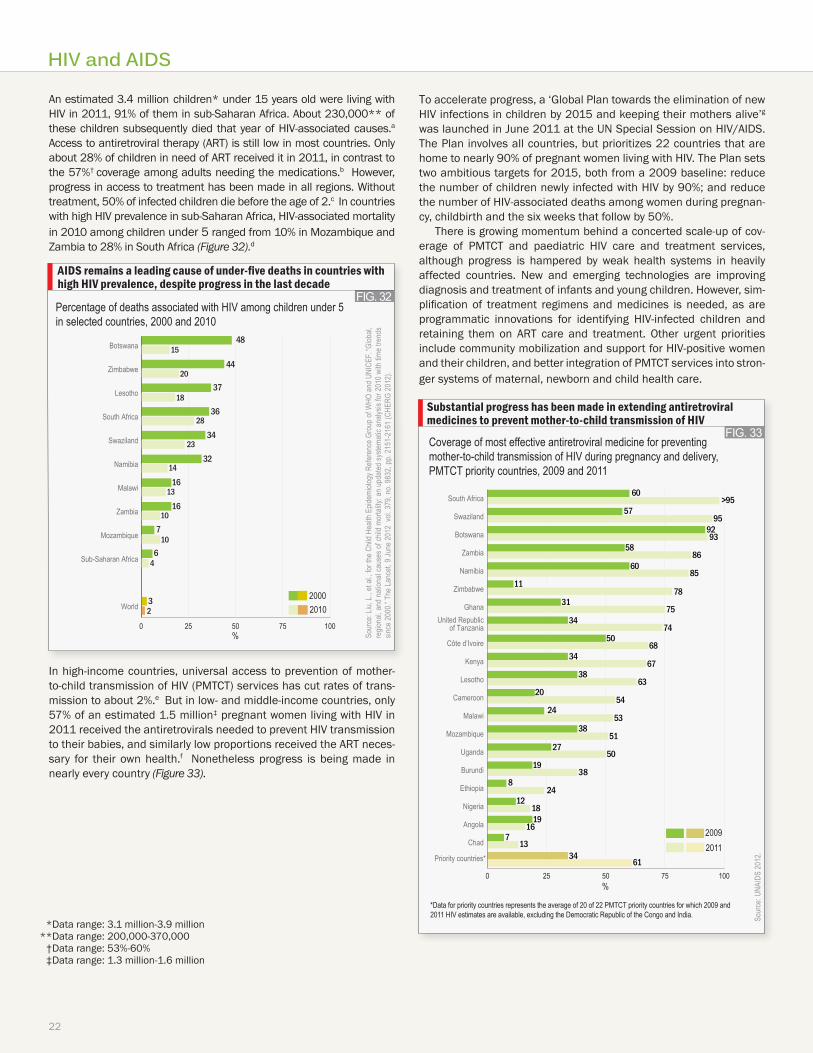
An estimated 3.4 million children* under 15 years old were living with HIV in 2011, 91% of them in sub-Saharan Africa. About 230,000** of these children subsequently died that year of HIV-associated causes.a Access to antiretroviral therapy (ART) is still low in most countries. Only about 28% of children in need of ART received it in 2011, in contrast to the 57%† coverage among adults needing the medications.b However, progress in access to treatment has been made in all regions. Without treatment, 50% of infected children die before the age of 2.c In countries with high HIV prevalence in sub-Saharan Africa, HIV-associated mortality in 2010 among children under 5 ranged from 10% in Mozambique and Zambia to 28% in South Africa (Figure 32).d
In high-income countries, universal access to prevention of mother-to-child transmission of HIV (PMTCT) services has cut rates of trans-mission to about 2%.e But in low- and middle-income countries, only 57% of an estimated 1.5 million‡ pregnant women living with HIV in 2011 received the antiretrovirals needed to prevent HIV transmission to their babies, and similarly low proportions received the ART neces-sary for their own health.f Nonetheless progress is being made in nearly every country (Figure 33).
To accelerate progress, a ‘Global Plan towards the elimination of new HIV infections in children by 2015 and keeping their mothers alive’g was launched in June 2011 at the UN Special Session on HIV/AIDS. The Plan involves all countries, but prioritizes 22 countries that are home to nearly 90% of pregnant women living with HIV. The Plan sets two ambitious targets for 2015, both from a 2009 baseline: reduce the number of children newly infected with HIV by 90%; and reduce the number of HIV-associated deaths among women during pregnan-cy, childbirth and the six weeks that follow by 50%.
There is growing momentum behind a concerted scale-up of cov-erage of PMTCT and paediatric HIV care and treatment services, although progress is hampered by weak health systems in heavily affected countries. New and emerging technologies are improving diagnosis and treatment of infants and young children. However, sim-plification of treatment regimens and medicines is needed, as are programmatic innovations for identifying HIV-infected children and retaining them on ART care and treatment. Other urgent priorities include community mobilization and support for HIV-positive women and their children, and better integration of PMTCT services into stron-ger systems of maternal, newborn and child health care.
22
HIV and AIDS
AIDS remains a leading cause of under-five deaths in countries with high HIV prevalence, despite progress in the last decade
FIG. 32PercentageofdeathsassociatedwithHIVamongchildrenunder5inselectedcountries,2000and2010
Source:Liu,L.,etal.,fortheChildHe
althEp
idemiolo
gyReferenceGroupofW
HOandUNICE
F.“Glob
al,
regio
nal,a
ndnation
alcausesofchildmo
rtality
:anupdatedsyste
maticanalys
isfor2
010withtim
etre
nds
since2000.”T
heLancet,9June2012vo
l.379,no.9832,pp.2151-2161(C
HERG
2012).
3628
34
4420
3718
15
3214
16
1613
10
710
64
32
0 25 50 75 100
World
Sub-SaharanAfrica
Mozambique
Zambia
Malawi
Namibia
Swaziland
SouthAfrica
Lesotho
Zimbabwe
Botswana
20102000
48
%
23FIG. 33
Coverageofmosteffectiveantiretroviralmedicineforpreventingmother-to-childtransmissionofHIVduringpregnancyanddelivery,PMTCTprioritycountries,2009and2011
Substantial progress has been made in extending antiretroviral medicines to prevent mother-to-child transmission of HIV
Source:U
NAIDS2012.
*Dataforprioritycountriesrepresentstheaverageof20of22PMTCTprioritycountriesforwhich2009and2011HIVestimatesareavailable,excludingtheDemocraticRepublicoftheCongoandIndia.
60
5795
9293
5886
60
1178
3175
3474
5068
3467
3863
2054
2453
3851
2750
1938
824
121819
167
1334
61
85
20112009
5
0 25 50 75 100
Chad
Angola
Nigeria
Ethiopia
Burundi
Uganda
Mozambique
Malawi
Cameroon
Lesotho
Kenya
Côted’Ivoire
UnitedRepublicof Tanzania
Ghana
Zimbabwe
Namibia
Zambia
Botswana
Swaziland
SouthAfrica
%
>9
Prioritycountries*
* Data range: 3.1 million-3.9 million ** Data range: 200,000-370,000 † Data range: 53%-60% ‡ Data range: 1.3 million-1.6 million
G
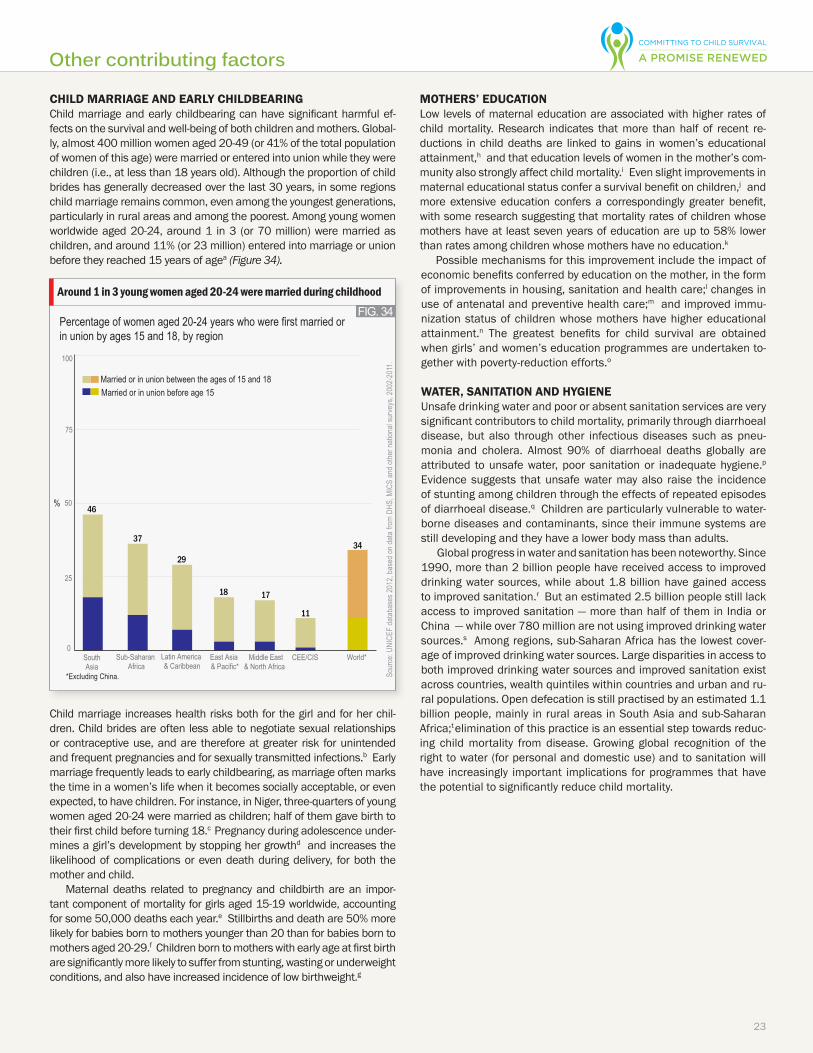
child marriage and early childbearingChild marriage and early childbearing can have significant harmful ef-fects on the survival and well-being of both children and mothers. Global-ly, almost 400 million women aged 20-49 (or 41% of the total population of women of this age) were married or entered into union while they were children (i.e., at less than 18 years old). Although the proportion of child brides has generally decreased over the last 30 years, in some regions child marriage remains common, even among the youngest generations, particularly in rural areas and among the poorest. Among young women worldwide aged 20-24, around 1 in 3 (or 70 million) were married as children, and around 11% (or 23 million) entered into marriage or union before they reached 15 years of agea (Figure 34).
Child marriage increases health risks both for the girl and for her chil-dren. Child brides are often less able to negotiate sexual relationships or contraceptive use, and are therefore at greater risk for unintended and frequent pregnancies and for sexually transmitted infections.b Early marriage frequently leads to early childbearing, as marriage often marks the time in a women’s life when it becomes socially acceptable, or even expected, to have children. For instance, in Niger, three-quarters of young women aged 20-24 were married as children; half of them gave birth to their first child before turning 18.c Pregnancy during adolescence under-mines a girl’s development by stopping her growthd and increases the likelihood of complications or even death during delivery, for both the mother and child.
Maternal deaths related to pregnancy and childbirth are an impor-tant component of mortality for girls aged 15-19 worldwide, accounting for some 50,000 deaths each year.e Stillbirths and death are 50% more likely for babies born to mothers younger than 20 than for babies born to mothers aged 20-29.f Children born to mothers with early age at first birth are significantly more likely to suffer from stunting, wasting or underweight conditions, and also have increased incidence of low birthweight.g
motherS’ educationLow levels of maternal education are associated with higher rates of child mortality. Research indicates that more than half of recent re-ductions in child deaths are linked to gains in women’s educational attainment,h and that education levels of women in the mother’s com-munity also strongly affect child mortality.i Even slight improvements in maternal educational status confer a survival benefit on children,j and more extensive education confers a correspondingly greater benefit, with some research suggesting that mortality rates of children whose mothers have at least seven years of education are up to 58% lower than rates among children whose mothers have no education.k
Possible mechanisms for this improvement include the impact of economic benefits conferred by education on the mother, in the form of improvements in housing, sanitation and health care;l changes in use of antenatal and preventive health care;m and improved immu-nization status of children whose mothers have higher educational attainment.n The greatest benefits for child survival are obtained when girls’ and women’s education programmes are undertaken to-gether with poverty-reduction efforts.o
water, Sanitation and hygieneUnsafe drinking water and poor or absent sanitation services are very significant contributors to child mortality, primarily through diarrhoeal disease, but also through other infectious diseases such as pneu-monia and cholera. Almost 90% of diarrhoeal deaths globally are attributed to unsafe water, poor sanitation or inadequate hygiene.p Evidence suggests that unsafe water may also raise the incidence of stunting among children through the effects of repeated episodes of diarrhoeal disease.q Children are particularly vulnerable to water-borne diseases and contaminants, since their immune systems are still developing and they have a lower body mass than adults.
Global progress in water and sanitation has been noteworthy. Since 1990, more than 2 billion people have received access to improved drinking water sources, while about 1.8 billion have gained access to improved sanitation.r But an estimated 2.5 billion people still lack access to improved sanitation — more than half of them in India or China — while over 780 million are not using improved drinking water sources.s Among regions, sub-Saharan Africa has the lowest cover-age of improved drinking water sources. Large disparities in access to both improved drinking water sources and improved sanitation exist across countries, wealth quintiles within countries and urban and ru-ral populations. Open defecation is still practised by an estimated 1.1 billion people, mainly in rural areas in South Asia and sub-Saharan Africa;t elimination of this practice is an essential step towards reduc-ing child mortality from disease. Growing global recognition of the right to water (for personal and domestic use) and to sanitation will have increasingly important implications for programmes that have the potential to significantly reduce child mortality.
23
Other contributing factors
FIG. 34Percentageofwomenaged20-24yearswhowerefirstmarriedorinunionbyages15and18,byregion
Around 1 in 3 young women aged 20-24 were married during childhood
Source:U
NICE
Fdatabases2
012,basedondatafrom
DHS
,MICSandothern
ation
alsurveys,2002-2011.
*ExcludingChina.
37
29
18 17
11
34
East Asia &Pacific*
CEE/CIS World*LatinAmerica&Caribbean
Middle East &NorthAfrica
Sub-SaharanAfrica
SouthAsia
Marriedorinunionbetweentheagesof15and18Married or in union before age 15
46
0
25
50
75
100
%
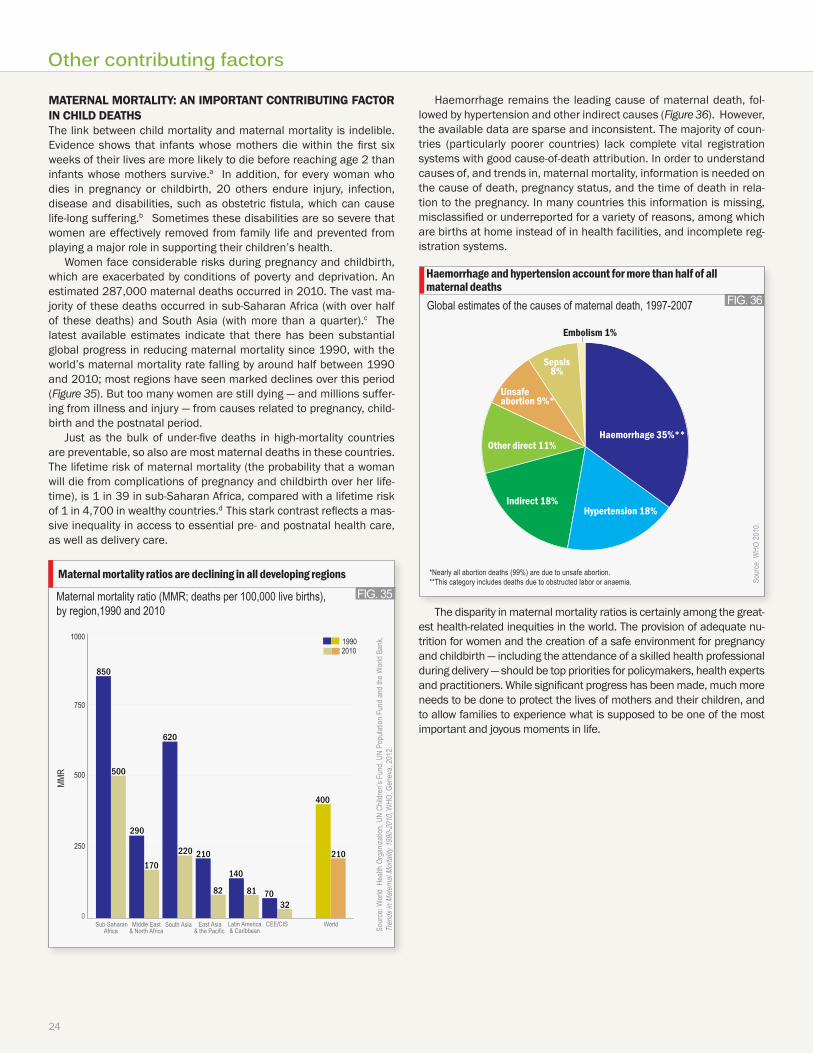
Other contributing factors
24
FIG. 36Globalestimatesofthecausesofmaternaldeath,1997-2007
Haemorrhage and hypertension account for more than half of all maternal deaths
Embolism 1%
Sepsis8%
Unsafe abortion 9%*
Other direct 11%
Indirect 18%Hypertension 18%
Haemorrhage 35%**
*Nearlyallabortiondeaths(99%)areduetounsafeabortion.**Thiscategoryincludesdeathsduetoobstructedlabororanaemia. So
urce:W
HO2010.
maternal mortality: an imPortant contributing Factor in child deathSThe link between child mortality and maternal mortality is indelible. Evidence shows that infants whose mothers die within the first six weeks of their lives are more likely to die before reaching age 2 than infants whose mothers survive.a In addition, for every woman who dies in pregnancy or childbirth, 20 others endure injury, infection, disease and disabilities, such as obstetric fistula, which can cause life-long suffering.b Sometimes these disabilities are so severe that women are effectively removed from family life and prevented from playing a major role in supporting their children’s health.
Women face considerable risks during pregnancy and childbirth, which are exacerbated by conditions of poverty and deprivation. An estimated 287,000 maternal deaths occurred in 2010. The vast ma-jority of these deaths occurred in sub-Saharan Africa (with over half of these deaths) and South Asia (with more than a quarter).c The latest available estimates indicate that there has been substantial global progress in reducing maternal mortality since 1990, with the world’s maternal mortality rate falling by around half between 1990 and 2010; most regions have seen marked declines over this period (Figure 35). But too many women are still dying — and millions suffer-ing from illness and injury — from causes related to pregnancy, child-birth and the postnatal period.
Just as the bulk of under-five deaths in high-mortality countries are preventable, so also are most maternal deaths in these countries. The lifetime risk of maternal mortality (the probability that a woman will die from complications of pregnancy and childbirth over her life-time), is 1 in 39 in sub-Saharan Africa, compared with a lifetime risk of 1 in 4,700 in wealthy countries.d This stark contrast reflects a mas-sive inequality in access to essential pre- and postnatal health care, as well as delivery care.
Haemorrhage remains the leading cause of maternal death, fol-lowed by hypertension and other indirect causes (Figure 36). However, the available data are sparse and inconsistent. The majority of coun-tries (particularly poorer countries) lack complete vital registration systems with good cause-of-death attribution. In order to understand causes of, and trends in, maternal mortality, information is needed on the cause of death, pregnancy status, and the time of death in rela-tion to the pregnancy. In many countries this information is missing, misclassified or underreported for a variety of reasons, among which are births at home instead of in health facilities, and incomplete reg-istration systems.
The disparity in maternal mortality ratios is certainly among the great-est health-related inequities in the world. The provision of adequate nu-trition for women and the creation of a safe environment for pregnancy and childbirth — including the attendance of a skilled health professional during delivery — should be top priorities for policymakers, health experts and practitioners. While significant progress has been made, much more needs to be done to protect the lives of mothers and their children, and to allow families to experience what is supposed to be one of the most important and joyous moments in life.
FIG. 35Maternalmortalityratio(MMR;deathsper100,000livebirths),byregion,1990and2010
Source:W
orldHealthOrganiza
tion,UNCh
ildren’s
Fund,UNPo
pulation
FundandtheWorldBa
nk,
Tren
ds in
Mate
rnal
Morta
lity 19
90-2
010,WHO
,Geneva,2012.
Maternal mortality ratios are declining in all developing regions
20101990
850
500
290
170
620
220 210
82
140
81 7032
400
210
0
250
500
750
1000
WorldCEE/CISLatinAmerica&Caribbean
East Asia &thePacific
SouthAsia Middle East&NorthAfrica
Sub-Saharan Africa
MMR
25
© 2012/Dario Montoya
26
Chapter 3: Getting to ‘20 by 2035’: Strategies for accelerating progress on child survival
©UNICEF/BANA2012-00696/Khan
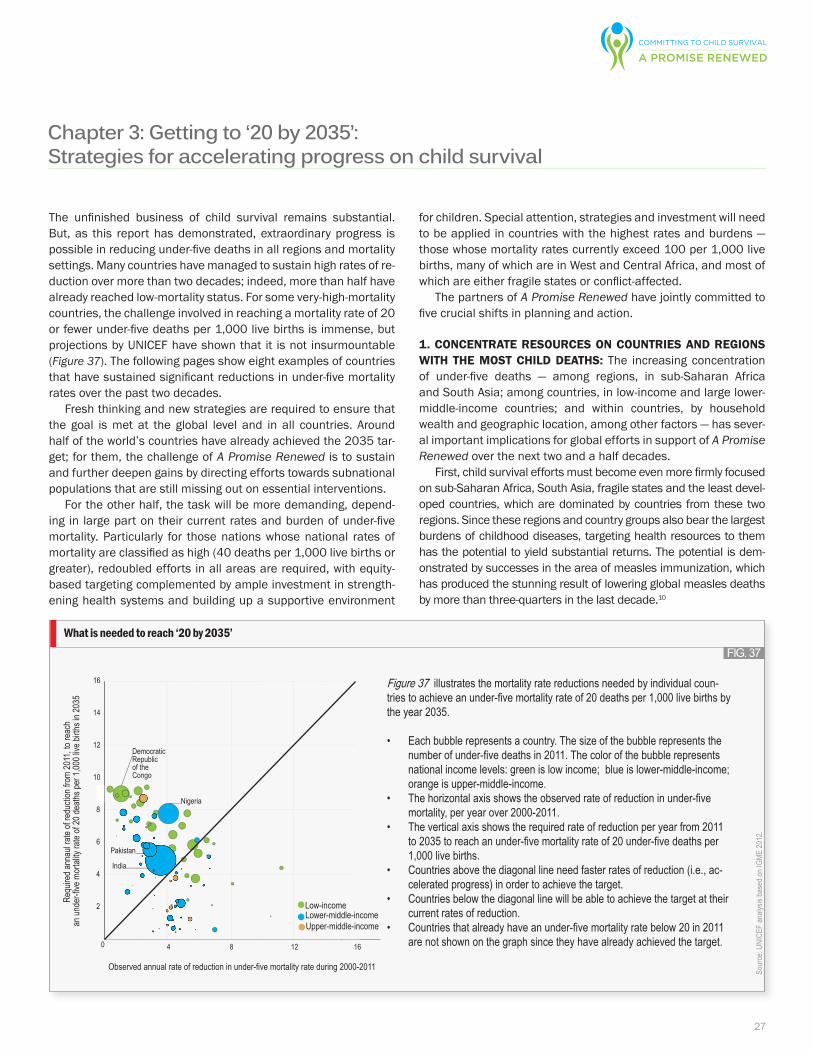
27
Chapter 3: Getting to ‘20 by 2035’: Strategies for accelerating progress on child survival
The unfinished business of child survival remains substantial. But, as this report has demonstrated, extraordinary progress is possible in reducing under-five deaths in all regions and mortality settings. Many countries have managed to sustain high rates of re-duction over more than two decades; indeed, more than half have already reached low-mortality status. For some very-high-mortality countries, the challenge involved in reaching a mortality rate of 20 or fewer under-five deaths per 1,000 live births is immense, but projections by UNICEF have shown that it is not insurmountable (Figure 37). The following pages show eight examples of countries that have sustained significant reductions in under-five mortality rates over the past two decades.
Fresh thinking and new strategies are required to ensure that the goal is met at the global level and in all countries. Around half of the world’s countries have already achieved the 2035 tar-get; for them, the challenge of A Promise Renewed is to sustain and further deepen gains by directing efforts towards subnational populations that are still missing out on essential interventions.
For the other half, the task will be more demanding, depend-ing in large part on their current rates and burden of under-five mortality. Particularly for those nations whose national rates of mortality are classified as high (40 deaths per 1,000 live births or greater), redoubled efforts in all areas are required, with equity-based targeting complemented by ample investment in strength-ening health systems and building up a supportive environment
for children. Special attention, strategies and investment will need to be applied in countries with the highest rates and burdens — those whose mortality rates currently exceed 100 per 1,000 live births, many of which are in West and Central Africa, and most of which are either fragile states or conflict-affected.
The partners of A Promise Renewed have jointly committed to five crucial shifts in planning and action.
1. concentrate reSourceS on countrieS and regionS with the moSt child deathS: The increasing concentration of under-five deaths — among regions, in sub-Saharan Africa and South Asia; among countries, in low-income and large lower- middle-income countries; and within countries, by household wealth and geographic location, among other factors — has sever-al important implications for global efforts in support of A Promise Renewed over the next two and a half decades.
First, child survival efforts must become even more firmly focused on sub-Saharan Africa, South Asia, fragile states and the least devel-oped countries, which are dominated by countries from these two regions. Since these regions and country groups also bear the largest burdens of childhood diseases, targeting health resources to them has the potential to yield substantial returns. The potential is dem-onstrated by successes in the area of measles immunization, which has produced the stunning result of lowering global measles deaths by more than three-quarters in the last decade.10
Chapter 3: Getting to ‘20 by 2035’: Strategies for accelerating progress on child survival
What is needed to reach ‘20 by 2035’
Source:U
NICE
Fanaly
sisbasedonIGME
2012.
Figure 37 illustratesthemortalityratereductionsneededbyindividualcoun-triestoachieveanunder-fivemortalityrateof20deathsper1,000livebirthsbytheyear2035.
• Eachbubblerepresentsacountry.Thesizeofthebubblerepresentsthenumberofunder-fivedeathsin2011.Thecolorofthebubblerepresentsnationalincomelevels:greenislowincome;blueislower-middle-income;orangeisupper-middle-income.
• Thehorizontalaxisshowstheobservedrateofreductioninunder-fivemortality,peryearover2000-2011.
• Theverticalaxisshowstherequiredrateofreductionperyearfrom2011to2035toreachanunder-fivemortalityrateof20under-fivedeathsper1,000livebirths.
• Countriesabovethediagonallineneedfasterratesofreduction(i.e.,ac-celeratedprogress)inordertoachievethetarget.
• Countriesbelowthediagonallinewillbeabletoachievethetargetattheircurrentratesofreduction.
• Countriesthatalreadyhaveanunder-fivemortalityratebelow20in2011arenotshownonthegraphsincetheyhavealreadyachievedthetarget.
FIG. 37
0
2
4
6
8
10
12
14
16
4 8 12 16
Observedannualrateofreductioninunder-fivemortalityrateduring2000-2011
Requireda
nnaulra
teofreductionfrom
2011,to
reach
anun
der-five
mortalityrateof20de
athsp
er1,000live
birthsin2
035
Low-incomeLower-middle-income
DemocraticRepublicoftheCongo
Nigeria
Pakistan
India
Upper-middle-income
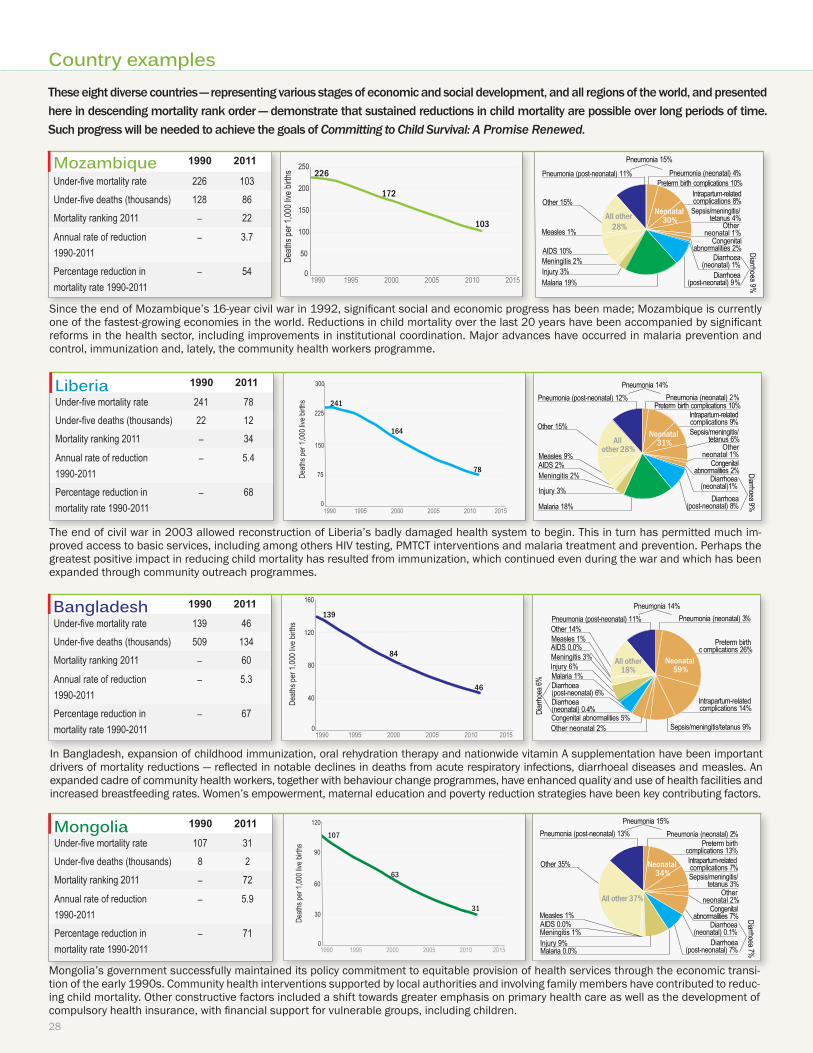
Country examples
Intrapartumrelatedcomplications9%
Sepsis/meningitis/tetanus 9%
Congenital abnormalites5%
Otherneonatal2%Injury 6%Meningitis 3%
Other14%
Pretermbirthcomplications26%
Neonatal 56
Other 23
Pneumonia 14%
Diarrhoea 6%Malaria 1%
AIDS 0%Measles 1%%
Intrapartumrelatedcomplications9%
Sepsis/meningitis/tetanus 9%
Congenital abnormalites5%
Otherneonatal2%Injury 6%Meningitis 3%
Other14%
Pretermbirthcomplications26%
Neonatal 56
Other 23
Pneumonia 14%
Diarrhoea 6%Malaria 1%
AIDS 0%Measles 1%%
Intrapartumrelatedcomplications9%
Sepsis/meningitis/tetanus 9%
Congenital abnormalites5%
Otherneonatal2%Injury 6%Meningitis 3%
Other14%
Pretermbirthcomplications26%
Neonatal 56
Other 23
Pneumonia 14%
Diarrhoea 6%Malaria 1%
AIDS 0%Measles 1%%
Intrapartumrelatedcomplications9%
Sepsis/meningitis/tetanus 9%
Congenital abnormalites5%
Otherneonatal2%Injury 6%Meningitis 3%
Other14%
Pretermbirthcomplications26%
Neonatal 56
Other 23
Pneumonia 14%
Diarrhoea 6%Malaria 1%
AIDS 0%Measles 1%%
Intrapartumrelatedcomplications9%
Sepsis/meningitis/tetanus 9%
Congenital abnormalites5%
Otherneonatal2%Injury 6%Meningitis 3%
Other14%
Pretermbirthcomplications26%
Neonatal 56
Other 23
Pneumonia 14%
Diarrhoea 6%Malaria 1%
AIDS 0%Measles 1%%
Mongolia’s government successfully maintained its policy commitment to equitable provision of health services through the economic transi-tion of the early 1990s. Community health interventions supported by local authorities and involving family members have contributed to reduc-ing child mortality. Other constructive factors included a shift towards greater emphasis on primary health care as well as the development of compulsory health insurance, with financial support for vulnerable groups, including children.
1990 2011
Under-fivemortalityrate 107 31Under-fivedeaths(thousands) 8 2Mortality ranking 2011 – 72
Annual rate of reduction 1990-2011
– 5.9
Percentagereductioninmortalityrate1990-2011
– 71
Mongolia107
63
31
0
30
60
90
120
1990 1995 2000 2005 2010 2015
Death
sper1,000live
births
These eight diverse countries — representing various stages of economic and social development, and all regions of the world, and presented here in descending mortality rank order — demonstrate that sustained reductions in child mortality are possible over long periods of time. Such progress will be needed to achieve the goals of Committing to Child Survival: A Promise Renewed.
28
Since the end of Mozambique’s 16-year civil war in 1992, significant social and economic progress has been made; Mozambique is currently one of the fastest-growing economies in the world. Reductions in child mortality over the last 20 years have been accompanied by significant reforms in the health sector, including improvements in institutional coordination. Major advances have occurred in malaria prevention and control, immunization and, lately, the community health workers programme.
1990 2011
Under-fivemortalityrate 226 103Under-fivedeaths(thousands) 128 86Mortality ranking 2011 – 22
Annual rate of reduction 1990-2011
– 3.7
Percentagereductioninmortalityrate1990-2011
– 54
Mozambique226
172
103
0
50
100
150
200
250
1990 1995 2000 2005 2010 2015De
athsp
er1,000live
births
The end of civil war in 2003 allowed reconstruction of Liberia’s badly damaged health system to begin. This in turn has permitted much im-proved access to basic services, including among others HIV testing, PMTCT interventions and malaria treatment and prevention. Perhaps the greatest positive impact in reducing child mortality has resulted from immunization, which continued even during the war and which has been expanded through community outreach programmes.
1990 2011
Under-fivemortalityrate 241 78Under-fivedeaths(thousands) 22 12Mortality ranking 2011 – 34
Annual rate of reduction 1990-2011
– 5.4
Percentagereductioninmortalityrate1990-2011
– 68
Liberia
241
164
78
0
75
150
225
300
1990 1995 2000 2005 2010 2015
Death
sper1,000live
births
In Bangladesh, expansion of childhood immunization, oral rehydration therapy and nationwide vitamin A supplementation have been important drivers of mortality reductions — reflected in notable declines in deaths from acute respiratory infections, diarrhoeal diseases and measles. An expanded cadre of community health workers, together with behaviour change programmes, have enhanced quality and use of health facilities and increased breastfeeding rates. Women’s empowerment, maternal education and poverty reduction strategies have been key contributing factors.
1990 2011
Under-fivemortalityrate 139 46Under-fivedeaths(thousands) 509 134Mortality ranking 2011 – 60
Annual rate of reduction 1990-2011
– 5.3
Percentagereductioninmortalityrate1990-2011
– 67
Bangladesh 139
84
46
0
40
80
120
160
1990 1995 2000 2005 2010 2015
Death
sper1,000 live
births
Pneumonia15%
Meningitis 2%
Intrapartum-relatedcomplications8%
Sepsis/meningitis/tetanus 4%
Congenitalabnormalities2%
Injury 3%
Other15%
Pretermbirthcomplications10%
Neonatal 30%All other
28%
Pneumonia(neonatal)4%Pneumonia(post-neonatal)11%
Diarrhoea(neonatal)1%
Malaria 19%
AIDS 10%
Measles 1%
Diarrhoea(post-neonatal)9%
Diarrhoea 9%
Other neonatal 1%
Intrapartum-relatedcomplications14%
Sepsis/meningitis/tetanus9%Congenitalabnormalities5%Otherneonatal2%
Injury 6%Meningitis 3%
Other14%Pretermbirth
c omplications26%Neonatal
59%All other
18%
Pneumonia(neonatal)3%Pneumonia(post-neonatal)11%Pneumonia14%
Diarrhoea(neonatal)0.4%
Diarrhoea(post-neonatal)6%
Malaria 1%
AIDS0.0%Measles 1%
Diarrho
ea 6%
Intrapartum-relatedcomplications7%Sepsis/meningitis/
tetanus 3%
Congenitalabnormalities7%
Other neonatal 2%
Injury 9%Meningitis 1%
Other35%
Pretermbirthcomplications13%
Neonatal 34%
All other 37%
Pneumonia(neonatal)2%Pneumonia(post-neonatal)13%Pneumonia15%
Diarrhoea(neonatal)0.1%
Malaria0.0%
AIDS0.0%Measles 1% Diarrhoea 7%
Diarrhoea(post-neonatal)7%
Intrapartum-relatedcomplications9%Sepsis/meningitis/
tetanus 6%
Congenitalabnormalities2%
Otherneonatal 1%
Injury 3%
Meningitis 2%
Other15%
Pretermbirthcomplications10%
Neonatal 31%All
other 28%
Pneumonia(neonatal)2%Pneumonia(post-neonatal)12%Pneumonia14%
Diarrhoea(neonatal)1%
Malaria18%
AIDS 2%Measles 9%
Diarrhoea 9%
Diarrhoea(post-neonatal)8%
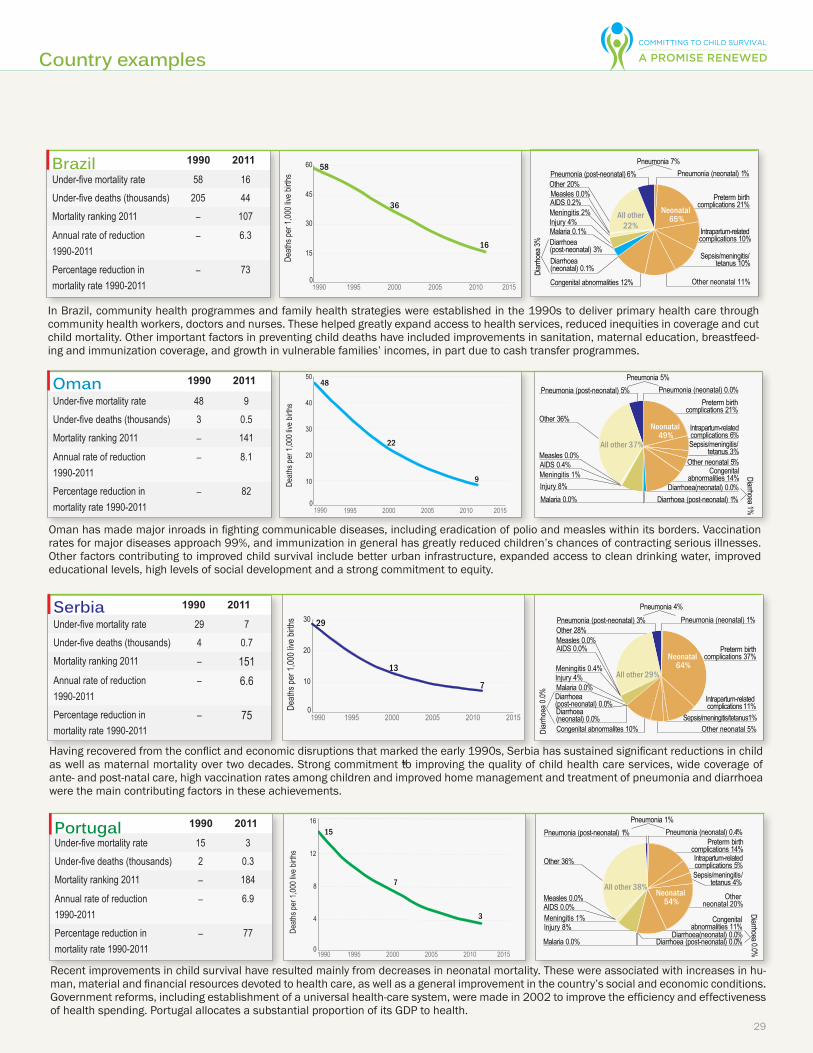
Country examples
Intrapartumrelatedcomplications9%
Sepsis/meningitis/tetanus 9%
Congenital abnormalites5%
Otherneonatal2%Injury 6%Meningitis 3%
Other14%
Pretermbirthcomplications26%
Neonatal 56
Other 23
Pneumonia 14%
Diarrhoea 6%Malaria 1%
AIDS 0%Measles 1%%
Intrapartumrelatedcomplications9%
Sepsis/meningitis/tetanus 9%
Congenital abnormalites5%
Otherneonatal2%Injury 6%Meningitis 3%
Other14%
Pretermbirthcomplications26%
Neonatal 56
Other 23
Pneumonia 14%
Diarrhoea 6%Malaria 1%
AIDS 0%Measles 1%%
Intrapartumrelatedcomplications9%
Sepsis/meningitis/tetanus 9%
Congenital abnormalites5%
Otherneonatal2%Injury 6%Meningitis 3%
Other14%
Pretermbirthcomplications26%
Neonatal 56
Other 23
Pneumonia 14%
Diarrhoea 6%Malaria 1%
AIDS 0%Measles 1%%
Intrapartumrelatedcomplications9%
Sepsis/meningitis/tetanus 9%
Congenital abnormalites5%
Otherneonatal2%Injury 6%Meningitis 3%
Other14%
Pretermbirthcomplications26%
Neonatal 56
Other 23
Pneumonia 14%
Diarrhoea 6%Malaria 1%
AIDS 0%Measles 1%%
Intrapartumrelatedcomplications9%
Sepsis/meningitis/tetanus 9%
Congenital abnormalites5%
Otherneonatal2%Injury 6%Meningitis 3%
Other14%
Pretermbirthcomplications26%
Neonatal 56
Other 23
Pneumonia 14%
Diarrhoea 6%Malaria 1%
AIDS 0%Measles 1%%
Oman has made major inroads in fighting communicable diseases, including eradication of polio and measles within its borders. Vaccination rates for major diseases approach 99%, and immunization in general has greatly reduced children’s chances of contracting serious illnesses. Other factors contributing to improved child survival include better urban infrastructure, expanded access to clean drinking water, improved educational levels, high levels of social development and a strong commitment to equity.
1990 2011
Under-fivemortalityrate 48 9Under-fivedeaths(thousands) 3 0.5Mortality ranking 2011 – 141
Annual rate of reduction 1990-2011
– 8.1
Percentagereductioninmortalityrate1990-2011
– 82
Oman
29
In Brazil, community health programmes and family health strategies were established in the 1990s to deliver primary health care through community health workers, doctors and nurses. These helped greatly expand access to health services, reduced inequities in coverage and cut child mortality. Other important factors in preventing child deaths have included improvements in sanitation, maternal education, breastfeed-ing and immunization coverage, and growth in vulnerable families’ incomes, in part due to cash transfer programmes.
1990 2011
Under-fivemortalityrate 58 16Under-fivedeaths(thousands) 205 44Mortality ranking 2011 – 107
Annual rate of reduction 1990-2011
– 6.3
Percentagereductioninmortalityrate1990-2011
– 73
Brazil 58
36
16
0
15
30
45
60
1990 1995 2000 2005 2010 2015De
athsp
er1,000live
births
48
22
9
0
10
20
30
40
50
1990 1995 2000 2005 2010 2015
Death
sper1,000live
births
Having recovered from the conflict and economic disruptions that marked the early 1990s, Serbia has sustained significant reductions in child as well as maternal mortality over two decades. Strong commitment to improving the quality of child health care services, wide coverage of ante- and post-natal care, high vaccination rates among children and improved home management and treatment of pneumonia and diarrhoea were the main contributing factors in these achievements.
1990 2011
Under-fivemortalityrate 29 7Under-fivedeaths(thousands) 4 0.7Mortality ranking 2011 – 151Annual rate of reduction 1990-2011
– 6.6
Percentagereductioninmortalityrate1990-2011
– 75
Serbia
M
13
7
0
10
20
30
1990 1995 2000 2005 2010 2015
Death
sper1,000 live
births 29
Recent improvements in child survival have resulted mainly from decreases in neonatal mortality. These were associated with increases in hu-man, material and financial resources devoted to health care, as well as a general improvement in the country’s social and economic conditions. Government reforms, including establishment of a universal health-care system, were made in 2002 to improve the efficiency and effectiveness of health spending. Portugal allocates a substantial proportion of its GDP to health.
1990 2011
Under-fivemortalityrate 15 3Under-fivedeaths(thousands) 2 0.3Mortality ranking 2011 – 184
Annual rate of reduction 1990-2011
– 6.9
Percentagereductioninmortalityrate1990-2011
– 77
Portugal 15
7
3
0
4
8
12
16
1990 1995 2000 2005 2010 2015
Death
sper1,000 live
births
Intrapartum-relatedcomplications10%
Sepsis/meningitis/tetanus 10%
Congenitalabnormalities12% Otherneonatal11%
Injury 4%Meningitis 2%
Other20%Pretermbirth
complications21%Neonatal
65%All other 22%
Pneumonia(neonatal)1%Pneumonia(post-neonatal)6%Pneumonia7%
Diarrhoea(neonatal)0.1%
Malaria0.1%
AIDS0.2%Measles0.0%
Diarrho
ea 3%
Diarrhoea(post-neonatal)3%
Intrapartum-relatedcomplications6%Sepsis/meningitis/
tetanus 3%
Congenitalabnormalities14%
Injury8%Meningitis 1%
Other36%
Pretermbirthcomplications21%
Neonatal 49%
All other 37%
Pneumonia(neonatal)0.0%Pneumonia(post-neonatal)5%Pneumonia5%
Diarrhoea(neonatal)0.0%Malaria0.0%
AIDS0.4%Measles0.0%
Diarrhoea(post-neonatal)1%
Diarrhoea 1%
Otherneonatal5%
Intrapartum-relatedcomplications5%Sepsis/meningitis/
tetanus 4%
Congenitalabnormalities11%Injury8%
Meningitis 1%
Other36%
Pretermbirthcomplications14%
Neonatal 54%
All other 38%
Pneumonia(neonatal)0.4%Pneumonia(post-neonatal)1%Pneumonia1%
Diarrhoea(neonatal)0.0%Malaria0.0%
AIDS0.0%Measles0.0%
Diarrhoea(post-neonatal)0.0%
Diarrhoea 0.0%
Other neonatal 20%
Injury 4%Meningitis0.4%
Other28%
Intrapartum-relatedcomplications11%
Congenitalabnormalites10% Otherneonatal5%
Pretermbirthcomplications37%Neonatal
64%All other 29%
Pneumonia(neonatal)1%Pneumonia(post-neonatal)3%Pneumonia4%
Diarrhoea(neonatal)0.0%
Malaria0.0%
AIDS0.0%Measles0.0%
Diar
rhoe
a 0.0%
Diarrhoea(post-neonatal)0.0%
Sepsis/meningitis/tetanus1%
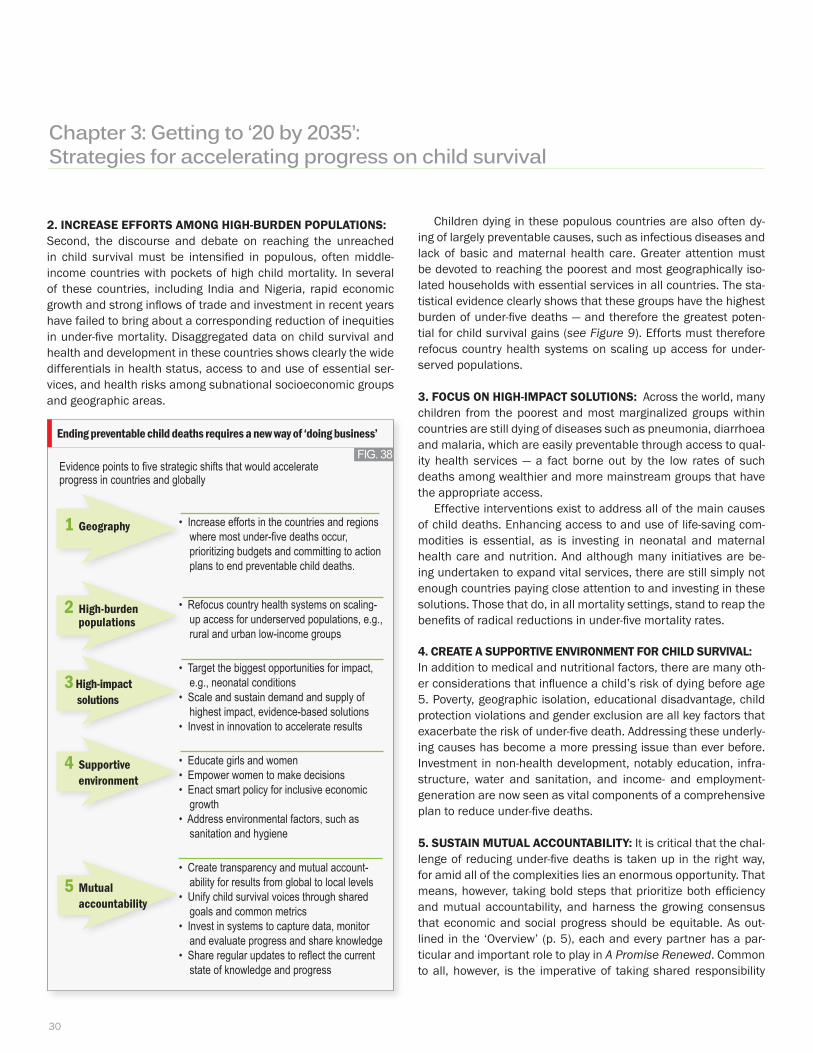
30
Intrapartumrelatedcomplications9%
Sepsis/meningitis/tetanus 9%
Congenital abnormalites5%
Otherneonatal2%Injury 6%Meningitis 3%
Other14%
Pretermbirthcomplications26%
Neonatal 56
Other 23
Pneumonia 14%
Diarrhoea 6%Malaria 1%
AIDS 0%Measles 1%%
Intrapartumrelatedcomplications9%
Sepsis/meningitis/tetanus 9%
Congenital abnormalites5%
Otherneonatal2%Injury 6%Meningitis 3%
Other14%
Pretermbirthcomplications26%
Neonatal 56
Other 23
Pneumonia 14%
Diarrhoea 6%Malaria 1%
AIDS 0%Measles 1%%
2. increaSe eFFortS among high-burden PoPulationS:Second, the discourse and debate on reaching the unreached in child survival must be intensified in populous, often middle-income countries with pockets of high child mortality. In several of these countries, including India and Nigeria, rapid economic growth and strong inflows of trade and investment in recent years have failed to bring about a corresponding reduction of inequities in under-five mortality. Disaggregated data on child survival and health and development in these countries shows clearly the wide differentials in health status, access to and use of essential ser-vices, and health risks among subnational socioeconomic groups and geographic areas.
Children dying in these populous countries are also often dy-ing of largely preventable causes, such as infectious diseases and lack of basic and maternal health care. Greater attention must be devoted to reaching the poorest and most geographically iso-lated households with essential services in all countries. The sta-tistical evidence clearly shows that these groups have the highest burden of under-five deaths — and therefore the greatest poten-tial for child survival gains (see Figure 9). Efforts must therefore refocus country health systems on scaling up access for under-served populations.
3. FocuS on high-imPact SolutionS: Across the world, many children from the poorest and most marginalized groups within countries are still dying of diseases such as pneumonia, diarrhoea and malaria, which are easily preventable through access to qual-ity health services — a fact borne out by the low rates of such deaths among wealthier and more mainstream groups that have the appropriate access.
Effective interventions exist to address all of the main causes of child deaths. Enhancing access to and use of life-saving com-modities is essential, as is investing in neonatal and maternal health care and nutrition. And although many initiatives are be-ing undertaken to expand vital services, there are still simply not enough countries paying close attention to and investing in these solutions. Those that do, in all mortality settings, stand to reap the benefits of radical reductions in under-five mortality rates.
4. create a SuPPortive environment For child Survival:In addition to medical and nutritional factors, there are many oth-er considerations that influence a child’s risk of dying before age 5. Poverty, geographic isolation, educational disadvantage, child protection violations and gender exclusion are all key factors that exacerbate the risk of under-five death. Addressing these underly-ing causes has become a more pressing issue than ever before. Investment in non-health development, notably education, infra-structure, water and sanitation, and income- and employment-generation are now seen as vital components of a comprehensive plan to reduce under-five deaths.
5. SuStain mutual accountability: It is critical that the chal-lenge of reducing under-five deaths is taken up in the right way, for amid all of the complexities lies an enormous opportunity. That means, however, taking bold steps that prioritize both efficiency and mutual accountability, and harness the growing consensus that economic and social progress should be equitable. As out-lined in the ‘Overview’ (p. 5), each and every partner has a par-ticular and important role to play in A Promise Renewed. Common to all, however, is the imperative of taking shared responsibility
Ending preventable child deaths requires a new way of ‘doing business’
FIG. 38Evidencepointstofivestrategicshiftsthatwouldaccelerateprogressincountriesandglobally
1 geography •Increaseeffortsinthecountriesandregionswheremostunder-fivedeathsoccur,prioritizingbudgetsandcommittingtoactionplanstoendpreventablechilddeaths.
2 High-burden populations
•Refocuscountryhealthsystemsonscaling-upaccessforunderservedpopulations,e.g.,ruralandurbanlow-incomegroups
3 High-impact solutions
•Targetthebiggestopportunitiesforimpact,e.g.,neonatalconditions
•Scaleandsustaindemandandsupplyofhighestimpact,evidence-basedsolutions
•Investininnovationtoaccelerateresults
4 Supportive environment
•Educategirlsandwomen•Empowerwomentomakedecisions•Enactsmartpolicyforinclusiveeconomicgrowth
•Addressenvironmentalfactors,suchassanitationandhygiene
5 Mutual accountability
•Createtransparencyandmutualaccount-abilityforresultsfromglobaltolocallevels
•Unifychildsurvivalvoicesthroughsharedgoalsandcommonmetrics
•Investinsystemstocapturedata,monitorandevaluateprogressandshareknowledge
•Shareregularupdatestoreflectthecurrentstateofknowledgeandprogress
Chapter 3: Getting to ‘20 by 2035’: Strategies for accelerating progress on child survival
31
for the goal of radically reducing under-five deaths in the next two decades, and embedding these efforts within their current and future strategies and operations.
Committing to A Promise Renewed will have striking implications for national policies and programmes in many developing countries, and for the work of UN country teams, and will challenge us all to change the way we do business. Meeting this challenge is within our grasp: The analysis presented at the Child Survival Call to Action Fo-rum provides a strong case for proceeding with optimism.
We now face a stark choice: more of the same strategies, with the likelihood of further moderate gains but only a modest narrowing of the gaps; or a refocus on radically reducing child deaths not only to accelerate progress but to contribute to the development of a more just and equitable world — one that is truly fit for all children.
ReferenceschaPter 11 TheUNInter-agencyGroupforChildMortalityEstimation(IGME),LevelsandTrends
inChildMortality:Report2012.UNICEF,NewYork,2012.(Thereference‘IGME2012’referstothisreport.)
2 ForfurtherdetailsonUNICEF'sregionalclassification,pleaserefertoStateoftheWorld'sChildren2012,pp.124-125,http://www.unicef.org/sowc2012/.
3 You,D.,andD.Anthony.“Generation2025:Thecriticalimportanceofunderstandingdemographictrendsforthechildrenofthe21stcentury”.UNICEFOccasionalPaper,no.1,September2012.
chaPter 24 TheestimatesoncauseofdeathinthisreportwerederivedfromtheworkoftheChild
HealthEpidemiologyReferenceGroup(CHERG)pertainingtocauseofdeathin2010andtheworkoftheIGMEpertainingtoall-causechilddeathsin2011.ThenumbersofdeathsbycausehavebeenupdatedbyapplyingthepercentagebreakdownbycauseprovidedbyCHERGtotheestimatesofnumberofunder-fivedeathsprovidedbyUNIGME.Thisapproachwasusedforcomparabilityacrossdiseases,andthereforetheseestimatesmaydifferfromthosepresentedelsewhere.
5 Forcomparabilityacrossdiseases,thisreportpresentsupdatednumbersofunder-fivedeathsbycause,derivedbyapplyingthepercentagebreakdownbycauseprovidedbyCHERG(theChildHealthEpidemiologyReferenceGroupofWHOandUNICEF)(2012)totheestimatesofnumberofunder-fivedeathsprovidedbyUNIGME(2012).Theseestimatesdiffer,therefore,fromthosepresentedin“Assessmentofthe2010globalmeaslesmortalityreductiongoal:resultsfromamodelofsurveillancedata”,byE.Simons,etal.,TheLancet,vol.379,no9832,9June2012,pp.2173-2178.
6 UNICEFreanalysisbasedonCHERG,IGME,2012.UNICEF.PneumoniaandDiar-rhoea:Tacklingthedeadliestdiseasesfortheworld’spoorestchildren.NewYork:UNICEF,2012
7 UNICEFreanalysisbasedonCHERG,IGME,2012.8 Liu,L.,etal.,fortheChildHealthEpidemiologyReferenceGroupofWHOandUNI-
CEF.“Global,regional,andnationalcausesofchildmortality:anupdatedsystematicanalysisfor2010withtimetrendssince2000.”TheLancet,9June2012vol.379,no.9832,pp.2151-2161(CHERG2012).
9 Liu,L.,etal.,fortheChildHealthEpidemiologyReferenceGroupofWHOandUNI-CEF.“Global,regional,andnationalcausesofchildmortality:anupdatedsystematicanalysisfor2010withtimetrendssince2000.”TheLancet,9June2012vol.379,no.9832,pp.2151-2161(CHERG2012).
PNEUMONIAaTheestimatesoncauseofdeathinthisreportwerederivedfromtheworkoftheChild
HealthEpidemiologyReferenceGroup(CHERG)pertainingtocauseofdeathin2010andtheworkoftheIGMEpertainingtoall-causechilddeathsin2011.ThenumbersofdeathsbycausehavebeenupdatedbyapplyingthepercentagebreakdownbycauseprovidedbyCHERGtotheestimatesofnumberofunder-fivedeathsprovidedbyUNIGME.Thisapproachwasusedforcomparabilityacrossdiseases,andthereforetheseestimatesmaydifferfromthosepresentedelsewhere.
bUNICEF,PneumoniaandDiarrhoea:Tacklingthedeadliestdiseasesfortheworld’spoorestchildren.NewYork:UNICEF,2012.
DIARRHOEAaTheestimatesoncauseofdeathinthisreportwerederivedfromtheworkoftheChild
HealthEpidemiologyReferenceGroup(CHERG)pertainingtocauseofdeathin2010andtheworkoftheIGMEpertainingtoall-causechilddeathsin2011.ThenumbersofdeathsbycausehavebeenupdatedbyapplyingthepercentagebreakdownbycauseprovidedbyCHERGtotheestimatesofnumberofunder-fivedeathsprovidedbyUNIGME.Thisapproachwasusedforcomparabilityacrossdiseases,andthereforetheseestimatesmaydifferfromthosepresentedelsewhere.
bBlack,R.,etal.,“Maternalandchildundernutrition:globalandregionalexposuresandhealthconsequences.”TheLancet2008vol.371,no.9608,19January2008,pp.243-260.
MALARIA a TheestimatesoncauseofdeathinthisreportwerederivedfromtheworkoftheChild
HealthEpidemiologyReferenceGroup(CHERG)pertainingtocauseofdeathin2010andtheworkoftheIGMEpertainingtoall-causechilddeathsin2011.ThenumbersofdeathsbycausehavebeenupdatedbyapplyingthepercentagebreakdownbycauseprovidedbyCHERGtotheestimatesofnumberofunder-fivedeathsprovidedbyUNIGME.Thisapproachwasusedforcomparabilityacrossdiseases,andthereforetheseestimatesmaydifferfromthosepresentedelsewhere.
bRollBackMalariaPartnership,Progressandimpactseries,Number7,September2011:Adecadeofpartnershipandresults.Geneva:WHO,2011.
c RollBackMalariaPartnership,Progressandimpactseries,Number7,September2011:Adecadeofpartnershipandresults.Geneva:WHO,2011.
Originalreferences:[i]VandenEng,J.L.,etal.,“Assessingbednetuseandnon-useafterlong-lastinginsecticidalnetdistribution:asimpleframeworktoguideprogrammaticstrate-gies”.MalariaJournal2010,9:133
[ii]EiseleT.P.,etal.,“Assessmentofinsecticide-treatedbednetuseamongchildrenandpregnantwomenacross15countriesusingstandardizednationalsurveys”,Ameri-canJournalofTropicalMedicineandHygienevol.80,no.2,pp.209–214.
dWHO,WorldMalariaReport2011.Geneva:WHO,2011.
NEONATAL DEATHSaTheestimatesoncauseofdeathinthisreportwerederivedfromtheworkoftheChild
HealthEpidemiologyReferenceGroup(CHERG)pertainingtocauseofdeathin2010andtheworkoftheIGMEpertainingtoall-causechilddeathsin2011.ThenumbersofdeathsbycausehavebeenupdatedbyapplyingthepercentagebreakdownbycauseprovidedbyCHERGtotheestimatesofnumberofunder-fivedeathsprovidedbyUNIGME.Thisapproachwasusedforcomparabilityacrossdiseases,andthereforetheseestimatesmaydifferfromthosepresentedelsewhere.
bUNICEFglobaldatabases2012.c FromWHOpostnatalcareguidelines.http://www.who.int/maternal_child_adolescent/
topics/newborn/postnatal_care/en/index.html.dWHO/UNICEF,2009.“Homevisitsforthenewbornchild:Astrategytoimprovechild
survival.”WHO/UNICEFjointstatement.Geneva:WorldHealthOrganization,2009.eTextfromhttp://www.childinfo.org/breastfeeding_challenge.html. Primaryreferences: Edmond,K.,etal.,“DelayedBreastfeedingInitiationIncreasesRiskofNeonatal
Mortality”.Pediatrics,vol.117,no.3,1March2006,pp.e380-e386. Mullany,L.C.,etal.,“BreastfeedingPattern,TimetoInitiationandMortalityRiskAmong
NewbornsinSouthernNepal”.TheJournalofNutrition,vol.138,March2008,pp.599-603. Singh,K.,andP.Srivastava.“TheEffectofColostrumonInfantMortality:Urbanrural
differentials”.HealthandPopulation,vol.15,no.3-4,July-December1992,pp.94-100.f UNICEFglobaldatabases2011.
Chapter 3: Getting to ‘20 by 2035’: Strategies for accelerating progress on child survival
32
References
NUTRITIONaBlack,R.,etal.,“Maternalandchildundernutrition:globalandregionalexposuresandhealth
consequences.”TheLancet2008vol.371,no.9608,19January2008,pp.243-260bWHOandUNICEFanalysisoftheWHOandUNICEFJointGlobalNutritionDatabase,
2011revision(completedJuly2012);UnitedNations,DepartmentofEconomicandSocialAffairs,PopulationDivision(2011),WorldPopulationProspects:The2010Revision,CD-ROMEdition.ThedatapresentedheresupersederelevanthistoricaldatapreviouslypublishedbyWHOandUNICEF.
cWHOandUNICEFanalysisoftheWHOandUNICEFJointGlobalNutritionDatabase,2011revision(completedJuly2012);UnitedNations,DepartmentofEconomicandSocialAffairs,PopulationDivision(2011),WorldPopulationProspects:The2010Revision,CD-ROMEdition.ThedatapresentedheresupersederelevanthistoricaldatapreviouslypublishedbyWHOandUNICEF.
dEdmond,K.,etal.,“DelayedBreastfeedingInitiationIncreasesRiskofNeonatalMortal-ity”.Pediatrics,vol.117,no.3,1March2006,pp.e380-e386.
Mullany,L.C.,etal.,“BreastfeedingPattern,TimetoInitiationandMortalityRiskAmongNewbornsinSouthernNepal”.TheJournalofNutrition,vol.138,March2008,pp.599-603.
eUNICEFglobaldatabases2011,fromMultipleIndicatorClusterSurveys(MICS),Demo-graphicHealthSurveys(DHS)andothernationalsurveys.
f Black,R.etal.,“Maternalandchildundernutrition:globalandregionalexposuresandhealthconsequences.”TheLancetvol.371,no.9608,19January2008,pp.243-260
gUNICEFglobaldatabases2011,fromMultipleIndicatorClusterSurveys(MICS),Demo-graphicHealthSurveys(DHS)andothernationalsurveys.
h InternationalVitaminAConsultativeGroup,“IVACGPolicyStatementonVitaminA,DiarrhoeaandMeasles”.Washington,DC:IVACG,1996.
i UNICEFglobaldatabases2011,fromnationalimmunizationdayandroutinereporting,MultipleIndicatorClusterSurveys(MICS),DemographicHealthSurveys(DHS)andothernationalsurveys.
HIV AND AIDSaUnitedNationsJointProgrammeonHIV/AIDS(UNAIDS),TogetherWeWillEndAIDS.
UNAIDS,2012bUnitedNationsJointProgrammeonHIV/AIDS(UNAIDS),TogetherWeWillEndAIDS.
UNAIDS,2012c Newell,M.-L.,etal.,“MortalityofinfectedanduninfectedinfantsborntoHIV-infected
mothersinAfrica:Apooledanalysis.”TheLancet,vol.364,no.9441,2-4October2004,pp.1236-1243.
dLiu,L.,etal.,fortheChildHealthEpidemiologyReferenceGroupofWHOandUNICEF.“Global,regional,andnationalcausesofchildmortality:anupdatedsystematicanalysisfor2010withtimetrendssince2000.”TheLancet,9June2012vol.379,no.9832,pp.2151-2161.
eWorldHealthOrganization,TakingStock:HIVinchildren.Geneva:WHO,2006,p.1.f UnitedNationsJointProgrammeonHIV/AIDS(UNAIDS).TogetherWeWillEndAIDS.
UNAIDS,2012.gJointUnitedNationsProgrammeonHIV/AIDS(UNAIDS),Countdowntozero.Global
plantowardstheeliminationofnewHIVinfectionsamongchildrenby2015andkeepingtheirmothersalive.Geneva:UNAIDS,2011.http://www.unaids.org/en/media/unaids/contentassets/documents/unaidspublication/2011/20110609_JC2137_Global-Plan-Elimination-HIV-Children_en.pdf.
OTHER CONTRIBUTING FACTORSaTheseestimatesarebasedondatafor109countriesrepresentingaround76%ofthe
worldpopulationofwomen.Theestimateswerecalculatedusingthe2011figuresforthenumberofwomen.TheestimatesdonotincludeChinaanditspopulationsincedataonchildmarriagearenotavailableinUNICEFdatabasesforthiscountry.
bClark,S.,“EarlyMarriageandHIVRiskinSub-SaharanAfrica.”StudiesinFamilyPlan-ningvol.35,no.3(2004),pp.149-60.
c InstitutNationaldelaStatistique(INS)etMacroInternationalInc.2007.EnquêteDé-mographiqueetdeSantéàIndicateursMultiplesduNiger2006.Calverton,Maryland,USA.
dCasanueva,E.,etal.,“Adolescentswithadequatebirthweightnew-bornsdiminishenergyexpenditureandceasegrowth.”Journal of Nutrition,vol.136,no.10,October2006,pp.2498-2501.
Rah,J.H.,etal.,“PregnancyandlactationhindergrowthandnutritionalstatusofadolescentgirlsinruralBangladesh.”Journal of Nutrition,vol.138,no.8,August2008,pp.1505-1511.
eWHO,MortalityEstimatesbyCause,AgeandSexforyear2008,2011.Fromwww.who.int/healthinfo/global_burden_disease/en,(accessedon6August2012).fWHOfactsheet,”MakingPregnancySafer”,WHO/MPS/08.14,2008,availableathttp://www.who.int/maternal_child_adolescent/topics/maternal/adolescent_pregnancy/en/index.html(accessedon22August2012).
g Prakash,R.,etal.,“Earlymarriage,poorreproductivehealthstatusofmotherandchildwell-beinginIndia.”TheJournalofFamilyPlanningandReproductiveHealthCare/FacultyofFamilyPlanning&ReproductiveHealthCare,RoyalCollegeofObstetricians&Gynaecologists,vol.37no.3,May2011,pp.136-145.
h Gakidou,E.,etal.,“Increasededucationalattainmentanditseffectonchildmortalityin175countriesbetween1970and2009:asystematicanalysis”,TheLancet,vol.376,18September2010,pp959-974.
i Kravdal,O.,“ChildMortalityinIndia:ExploringtheCommunity-LevelEffectofEduca-tion.”OsloUniversity,HealthEconomicsResearchProgrammeOnlineWorkingPaperSeries,number2003:4.
j Basu,A.M.,andR.Stephenson,“Lowlevelsofmaternaleducationandtheproximatedeterminantsofchildhoodmortality:alittlelearningisnotadangerousthing.”Social Science and Medicine,vol.60no.9,May2005,pp.2011-2023.
k Hobcraft,J.,“Women’seducation,childwelfareandchildsurvival:areviewoftheevidence.”HealthTransitionReviewvol.3,no.2,Oct.1993,pp.159-175.
l Cleland,J.G.,andJ.K.vanGinneken,“Maternaleducationandchildsurvivalindevel-opingcountries:Thesearchforpathwaysofinfluence.”Social Science and Medicine,vol.27no.12,1988,pp.1357-1368.
mKravdal,O.,“ChildMortalityinIndia:ExploringtheCommunity-LevelEffectofEduca-tion.”OsloUniversity,HealthEconomicsResearchProgrammeOnlineWorkingPaperSeries,number2003:4.
Elo,I.T.,“Utilizationofmaternalhealth-careservicesinPeru:theroleofwomen’seducation.”HealthTransitionReview,vol.2no.1,1992,pp.49-69.
nDesai,S.andS.Alva,“Maternaleducationandchildhealth:isthereastrongcausalrelationship?”Demography,vol.35no.1,1998,pp.71-81.
oHatt,L.E.andH.R.Waters,“DeterminantsofchildmorbidityinLatinAmerica:apooledanalysisofinteractionsbetweenparentaleducationandeconomicstatus.”Social Sci-ence and Medicine,vol.62no.2,pp.375-386.
pUNICEF,PneumoniaandDiarrhoea:Tacklingthedeadliestdiseasesfortheworld’spoorestchildren.NewYork:UNICEF,2012,
qCheckley,W.,etal.,“Effectofwaterandsanitationonchildhoodhealthinapoor Peruvianperi-urbancommunity”,TheLancet,vol.363,10January2004,pp.112-118.
s UNICEFandWorldHealthOrganization,ProgressonDrinkingWaterandSanitation:2012Update.NewYork:UNICEFandWHO,2012.
t UNICEFandWorldHealthOrganization,ProgressonDrinkingWaterandSanitation:2012Update.NewYork:UNICEFandWHO,2012.
MATERNAL MORTALITYaWHORegionalOfficeforAfrica,TheHealthofthePeople:TheAfricanregionalhealth
report,WHOPress,Geneva,2006,p.19. SeealsoUNICEF,TheStateoftheWorld’sChildren2009:MaternalandNewborn
Health.NewYork:UNICEF,2008.bNanda,G.,etal.,AcceleratingProgresstowardsAchievingtheMDGtoImproveMater-
nalHealth:Acollectionofpromisingapproaches.Washington,DC:WorldBank,April2005,p.4.
SeealsoUNICEF,TheStateoftheWorld’sChildren2009:MaternalandNewbornHealth.NewYork:UNICEF,2008.
cWHO,UNICEF,UNFPAandTheWorldBank,Trends in Maternal Mortality 1990-2010.Geneva:WHO,2012.
Seealsohttp://www.childinfo.org/maternal_mortality.htmldWHO,UNICEF,UNFPAandTheWorldBank,Trends in Maternal Mortality 1990-2010.
Geneva:WHO,2012. Seealsohttp://www.childinfo.org/maternal_mortality.html
chaPter 310Forcomparabilityacrossdiseases,thisreportpresentsupdatednumbersofunder-five
deathsbycause,derivedbyapplyingthepercentagebreakdownbycauseprovidedbyCHERG(2012)totheestimatesofnumberofunder-fivedeathsprovidedbyUNIGME(2012).Theseestimatesdiffer,therefore,fromthosepresentedin“Assessmentofthe2010globalmeaslesmortalityreductiongoal:resultsfromamodelofsurveillancedata”,byE.Simons,etal.,TheLancet,vol.379,no9832,9June2012,pp.2173-2178.
33
References
© UNICEF/NYHQ2010-1019/Asselin
Tables: Country and regional estimates of child mortality and causes of under-five deaths
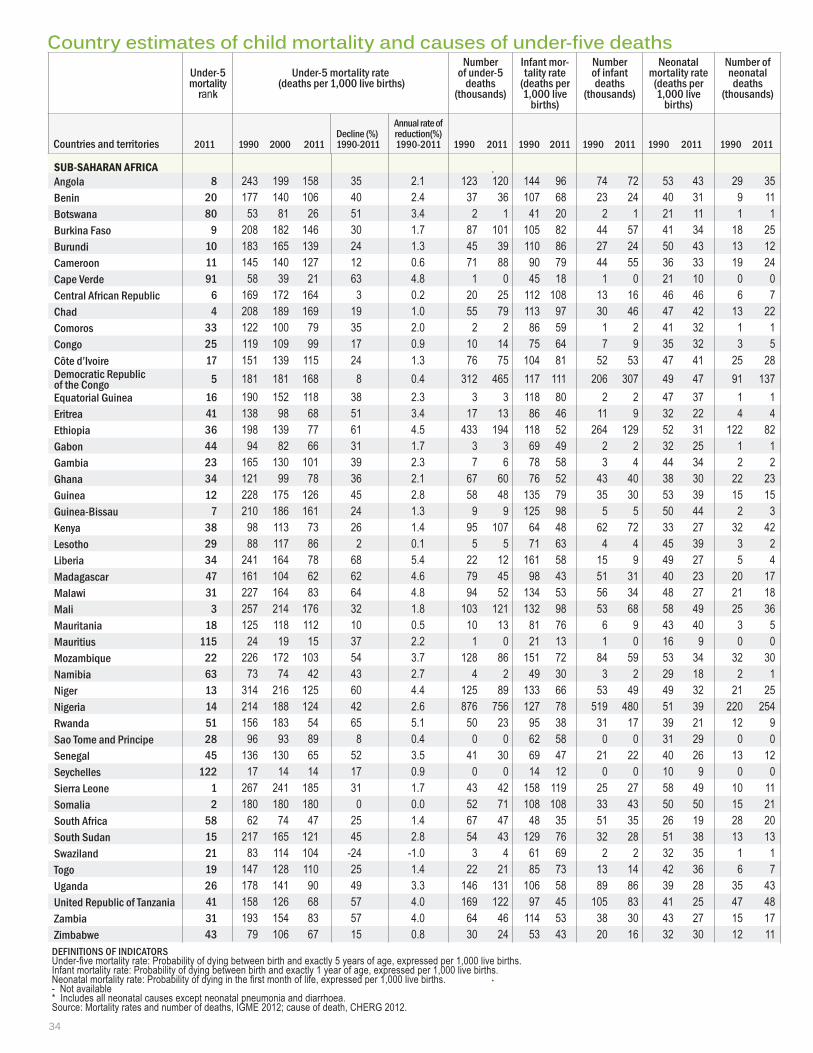
Country estimates of child mortality and causes of under-five deaths
SUb-SAHARAN AfRICAAngola 8 243 199 158 35 2.1 123 120 144 96 74 72 53 43 29 35Benin 20 177 140 106 40 2.4 37 36 107 68 23 24 40 31 9 11Botswana 80 53 81 26 51 3.4 2 1 41 20 2 1 21 11 1 1Burkina Faso 9 208 182 146 30 1.7 87 101 105 82 44 57 41 34 18 25Burundi 10 183 165 139 24 1.3 45 39 110 86 27 24 50 43 13 12Cameroon 11 145 140 127 12 0.6 71 88 90 79 44 55 36 33 19 24Cape Verde 91 58 39 21 63 4.8 1 0 45 18 1 0 21 10 0 0Central African Republic 6 169 172 164 3 0.2 20 25 112 108 13 16 46 46 6 7Chad 4 208 189 169 19 1.0 55 79 113 97 30 46 47 42 13 22Comoros 33 122 100 79 35 2.0 2 2 86 59 1 2 41 32 1 1Congo 25 119 109 99 17 0.9 10 14 75 64 7 9 35 32 3 5Côte d’Ivoire 17 151 139 115 24 1.3 76 75 104 81 52 53 47 41 25 28Democratic Republic of the Congo 5 181 181 168 8 0.4 312 465 117 111 206 307 49 47 91 137Equatorial Guinea 16 190 152 118 38 2.3 3 3 118 80 2 2 47 37 1 1Eritrea 41 138 98 68 51 3.4 17 13 86 46 11 9 32 22 4 4Ethiopia 36 198 139 77 61 4.5 433 194 118 52 264 129 52 31 122 82Gabon 44 94 82 66 31 1.7 3 3 69 49 2 2 32 25 1 1Gambia 23 165 130 101 39 2.3 7 6 78 58 3 4 44 34 2 2Ghana 34 121 99 78 36 2.1 67 60 76 52 43 40 38 30 22 23Guinea 12 228 175 126 45 2.8 58 48 135 79 35 30 53 39 15 15Guinea-Bissau 7 210 186 161 24 1.3 9 9 125 98 5 5 50 44 2 3Kenya 38 98 113 73 26 1.4 95 107 64 48 62 72 33 27 32 42Lesotho 29 88 117 86 2 0.1 5 5 71 63 4 4 45 39 3 2Liberia 34 241 164 78 68 5.4 22 12 161 58 15 9 49 27 5 4Madagascar 47 161 104 62 62 4.6 79 45 98 43 51 31 40 23 20 17Malawi 31 227 164 83 64 4.8 94 52 134 53 56 34 48 27 21 18Mali 3 257 214 176 32 1.8 103 121 132 98 53 68 58 49 25 36Mauritania 18 125 118 112 10 0.5 10 13 81 76 6 9 43 40 3 5Mauritius 115 24 19 15 37 2.2 1 0 21 13 1 0 16 9 0 0Mozambique 22 226 172 103 54 3.7 128 86 151 72 84 59 53 34 32 30Namibia 63 73 74 42 43 2.7 4 2 49 30 3 2 29 18 2 1Niger 13 314 216 125 60 4.4 125 89 133 66 53 49 49 32 21 25Nigeria 14 214 188 124 42 2.6 876 756 127 78 519 480 51 39 220 254Rwanda 51 156 183 54 65 5.1 50 23 95 38 31 17 39 21 12 9Sao Tome and Principe 28 96 93 89 8 0.4 0 0 62 58 0 0 31 29 0 0Senegal 45 136 130 65 52 3.5 41 30 69 47 21 22 40 26 13 12Seychelles 122 17 14 14 17 0.9 0 0 14 12 0 0 10 9 0 0Sierra Leone 1 267 241 185 31 1.7 43 42 158 119 25 27 58 49 10 11Somalia 2 180 180 180 0 0.0 52 71 108 108 33 43 50 50 15 21South Africa 58 62 74 47 25 1.4 67 47 48 35 51 35 26 19 28 20South Sudan 15 217 165 121 45 2.8 54 43 129 76 32 28 51 38 13 13Swaziland 21 83 114 104 -24 -1.0 3 4 61 69 2 2 32 35 1 1Togo 19 147 128 110 25 1.4 22 21 85 73 13 14 42 36 6 7Uganda 26 178 141 90 49 3.3 146 131 106 58 89 86 39 28 35 43United Republic of Tanzania 41 158 126 68 57 4.0 169 122 97 45 105 83 41 25 47 48Zambia 31 193 154 83 57 4.0 64 46 114 53 38 30 43 27 15 17Zimbabwe 43 79 106 67 15 0.8 30 24 53 43 20 16 32 30 12 11
DEFINITIONS OF INDICATORSUnder-fivemortalityrate:Probabilityofdyingbetweenbirthandexactly5yearsofage,expressedper1,000livebirths.Infantmortalityrate:Probabilityofdyingbetweenbirthandexactly1yearofage,expressedper1,000livebirths.Neonatalmortalityrate:Probabilityofdyinginthefirstmonthoflife,expressedper1,000livebirths.-Notavailable *Includesallneonatalcausesexceptneonatalpneumoniaanddiarrhoea.Source:Mortalityratesandnumberofdeaths,IGME2012;causeofdeath,CHERG2012.
34
Under-5 mortality
rank
Under-5 mortality rate
(deaths per 1,000 live births)
Number of under-5
deaths (thousands)
Infant mor-tality rate
(deaths per 1,000 live
births)
Number of infant deaths
(thousands)
Neonatal mortality rate
(deaths per 1,000 live
births)
Number of neonatal
deaths (thousands)
Countries and territories 2011 1990 2000 2011Decline (%) 1990-2011
Annual rate of reduction(%)1990-2011 1990 2011 1990 2011 1990 2011 1990 2011 1990 2011
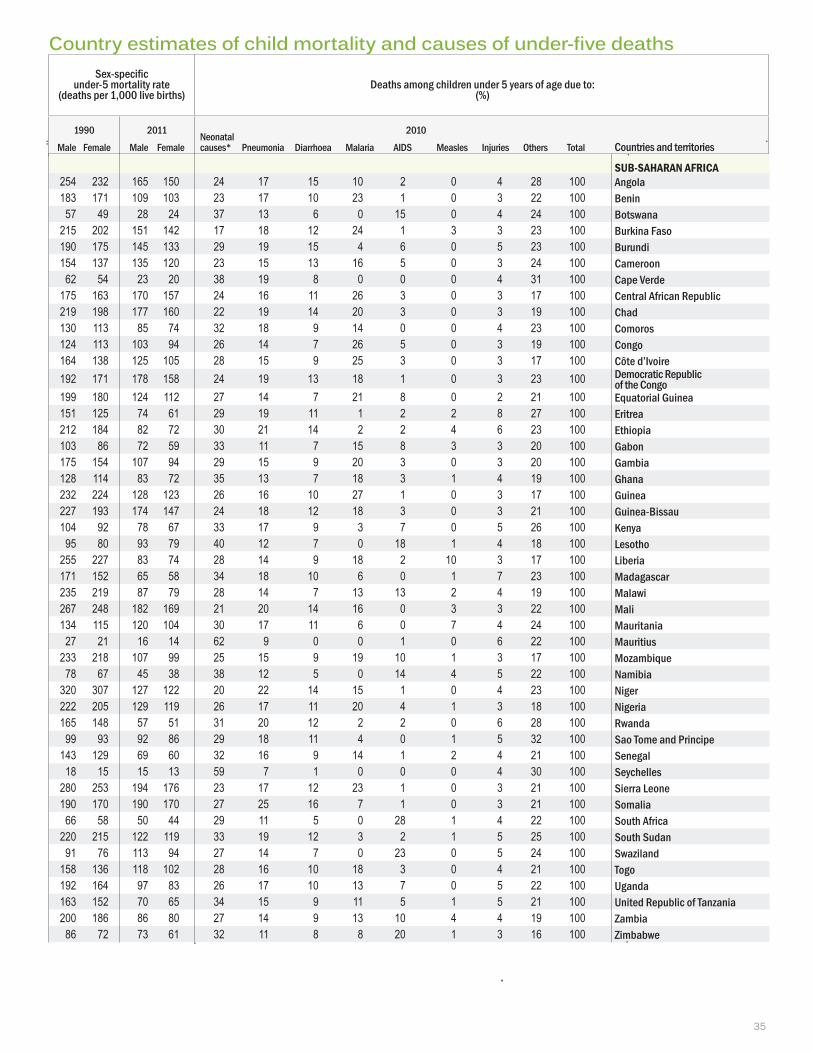
Sex-specific under-5 mortality rate
(deaths per 1,000 live births)
Deaths among children under 5 years of age due to:
(%)
1990
Male Female
2011
Male Female
Neonatal 2010 causes* Pneumonia Diarrhoea Malaria AIDS Measles Injuries Others Total Countries and territories
SUb-SAHARAN AfRICAAngola 8 243 199 158 35 2.1 123 120 144 96 74 72 53 43 29 35Benin 20 177 140 106 40 2.4 37 36 107 68 23 24 40 31 9 11Botswana 80 53 81 26 51 3.4 2 1 41 20 2 1 21 11 1 1Burkina Faso 9 208 182 146 30 1.7 87 101 105 82 44 57 41 34 18 25Burundi 10 183 165 139 24 1.3 45 39 110 86 27 24 50 43 13 12Cameroon 11 145 140 127 12 0.6 71 88 90 79 44 55 36 33 19 24Cape Verde 91 58 39 21 63 4.8 1 0 45 18 1 0 21 10 0 0Central African Republic 6 169 172 164 3 0.2 20 25 112 108 13 16 46 46 6 7Chad 4 208 189 169 19 1.0 55 79 113 97 30 46 47 42 13 22Comoros 33 122 100 79 35 2.0 2 2 86 59 1 2 41 32 1 1Congo 25 119 109 99 17 0.9 10 14 75 64 7 9 35 32 3 5Côte d’Ivoire 17 151 139 115 24 1.3 76 75 104 81 52 53 47 41 25 28Democratic Republic of the Congo 5 181 181 168 8 0.4 312 465 117 111 206 307 49 47 91 137Equatorial Guinea 16 190 152 118 38 2.3 3 3 118 80 2 2 47 37 1 1Eritrea 41 138 98 68 51 3.4 17 13 86 46 11 9 32 22 4 4Ethiopia 36 198 139 77 61 4.5 433 194 118 52 264 129 52 31 122 82Gabon 44 94 82 66 31 1.7 3 3 69 49 2 2 32 25 1 1Gambia 23 165 130 101 39 2.3 7 6 78 58 3 4 44 34 2 2Ghana 34 121 99 78 36 2.1 67 60 76 52 43 40 38 30 22 23Guinea 12 228 175 126 45 2.8 58 48 135 79 35 30 53 39 15 15Guinea-Bissau 7 210 186 161 24 1.3 9 9 125 98 5 5 50 44 2 3Kenya 38 98 113 73 26 1.4 95 107 64 48 62 72 33 27 32 42Lesotho 29 88 117 86 2 0.1 5 5 71 63 4 4 45 39 3 2Liberia 34 241 164 78 68 5.4 22 12 161 58 15 9 49 27 5 4Madagascar 47 161 104 62 62 4.6 79 45 98 43 51 31 40 23 20 17Malawi 31 227 164 83 64 4.8 94 52 134 53 56 34 48 27 21 18Mali 3 257 214 176 32 1.8 103 121 132 98 53 68 58 49 25 36Mauritania 18 125 118 112 10 0.5 10 13 81 76 6 9 43 40 3 5Mauritius 115 24 19 15 37 2.2 1 0 21 13 1 0 16 9 0 0Mozambique 22 226 172 103 54 3.7 128 86 151 72 84 59 53 34 32 30Namibia 63 73 74 42 43 2.7 4 2 49 30 3 2 29 18 2 1Niger 13 314 216 125 60 4.4 125 89 133 66 53 49 49 32 21 25Nigeria 14 214 188 124 42 2.6 876 756 127 78 519 480 51 39 220 254Rwanda 51 156 183 54 65 5.1 50 23 95 38 31 17 39 21 12 9Sao Tome and Principe 28 96 93 89 8 0.4 0 0 62 58 0 0 31 29 0 0Senegal 45 136 130 65 52 3.5 41 30 69 47 21 22 40 26 13 12Seychelles 122 17 14 14 17 0.9 0 0 14 12 0 0 10 9 0 0Sierra Leone 1 267 241 185 31 1.7 43 42 158 119 25 27 58 49 10 11Somalia 2 180 180 180 0 0.0 52 71 108 108 33 43 50 50 15 21South Africa 58 62 74 47 25 1.4 67 47 48 35 51 35 26 19 28 20South Sudan 15 217 165 121 45 2.8 54 43 129 76 32 28 51 38 13 13Swaziland 21 83 114 104 -24 -1.0 3 4 61 69 2 2 32 35 1 1Togo 19 147 128 110 25 1.4 22 21 85 73 13 14 42 36 6 7Uganda 26 178 141 90 49 3.3 146 131 106 58 89 86 39 28 35 43United Republic of Tanzania 41 158 126 68 57 4.0 169 122 97 45 105 83 41 25 47 48Zambia 31 193 154 83 57 4.0 64 46 114 53 38 30 43 27 15 17Zimbabwe 43 79 106 67 15 0.8 30 24 53 43 20 16 32 30 12 11
SUb-SAHARAN AfRICA254 232 165 150 24 17 15 10 2 0 4 28 100 Angola183 171 109 103 23 17 10 23 1 0 3 22 100 Benin
57 49 28 24 37 13 6 0 15 0 4 24 100 Botswana215 202 151 142 17 18 12 24 1 3 3 23 100 Burkina Faso190 175 145 133 29 19 15 4 6 0 5 23 100 Burundi154 137 135 120 23 15 13 16 5 0 3 24 100 Cameroon
62 54 23 20 38 19 8 0 0 0 4 31 100 Cape Verde175 163 170 157 24 16 11 26 3 0 3 17 100 Central African Republic219 198 177 160 22 19 14 20 3 0 3 19 100 Chad130 113 85 74 32 18 9 14 0 0 4 23 100 Comoros124 113 103 94 26 14 7 26 5 0 3 19 100 Congo164 138 125 105 28 15 9 25 3 0 3 17 100 Côte d’Ivoire192 171 178 158 24 19 13 18 1 0 3 23 100 Democratic Republic
of the Congo199 180 124 112 27 14 7 21 8 0 2 21 100 Equatorial Guinea151 125 74 61 29 19 11 1 2 2 8 27 100 Eritrea212 184 82 72 30 21 14 2 2 4 6 23 100 Ethiopia103 86 72 59 33 11 7 15 8 3 3 20 100 Gabon175 154 107 94 29 15 9 20 3 0 3 20 100 Gambia128 114 83 72 35 13 7 18 3 1 4 19 100 Ghana232 224 128 123 26 16 10 27 1 0 3 17 100 Guinea227 193 174 147 24 18 12 18 3 0 3 21 100 Guinea-Bissau104 92 78 67 33 17 9 3 7 0 5 26 100 Kenya
95 80 93 79 40 12 7 0 18 1 4 18 100 Lesotho255 227 83 74 28 14 9 18 2 10 3 17 100 Liberia171 152 65 58 34 18 10 6 0 1 7 23 100 Madagascar235 219 87 79 28 14 7 13 13 2 4 19 100 Malawi267 248 182 169 21 20 14 16 0 3 3 22 100 Mali134 115 120 104 30 17 11 6 0 7 4 24 100 Mauritania
27 21 16 14 62 9 0 0 1 0 6 22 100 Mauritius233 218 107 99 25 15 9 19 10 1 3 17 100 Mozambique78 67 45 38 38 12 5 0 14 4 5 22 100 Namibia
320 307 127 122 20 22 14 15 1 0 4 23 100 Niger222 205 129 119 26 17 11 20 4 1 3 18 100 Nigeria165 148 57 51 31 20 12 2 2 0 6 28 100 Rwanda
99 93 92 86 29 18 11 4 0 1 5 32 100 Sao Tome and Principe143 129 69 60 32 16 9 14 1 2 4 21 100 Senegal18 15 15 13 59 7 1 0 0 0 4 30 100 Seychelles280 253 194 176 23 17 12 23 1 0 3 21 100 Sierra Leone190 170 190 170 27 25 16 7 1 0 3 21 100 Somalia
66 58 50 44 29 11 5 0 28 1 4 22 100 South Africa220 215 122 119 33 19 12 3 2 1 5 25 100 South Sudan
91 76 113 94 27 14 7 0 23 0 5 24 100 Swaziland158 136 118 102 28 16 10 18 3 0 4 21 100 Togo192 164 97 83 26 17 10 13 7 0 5 22 100 Uganda163 152 70 65 34 15 9 11 5 1 5 21 100 United Republic of Tanzania200 186 86 80 27 14 9 13 10 4 4 19 100 Zambia86 72 73 61 32 11 8 8 20 1 3 16 100 Zimbabwe
35
Country estimates of child mortality and causes of under-five deaths
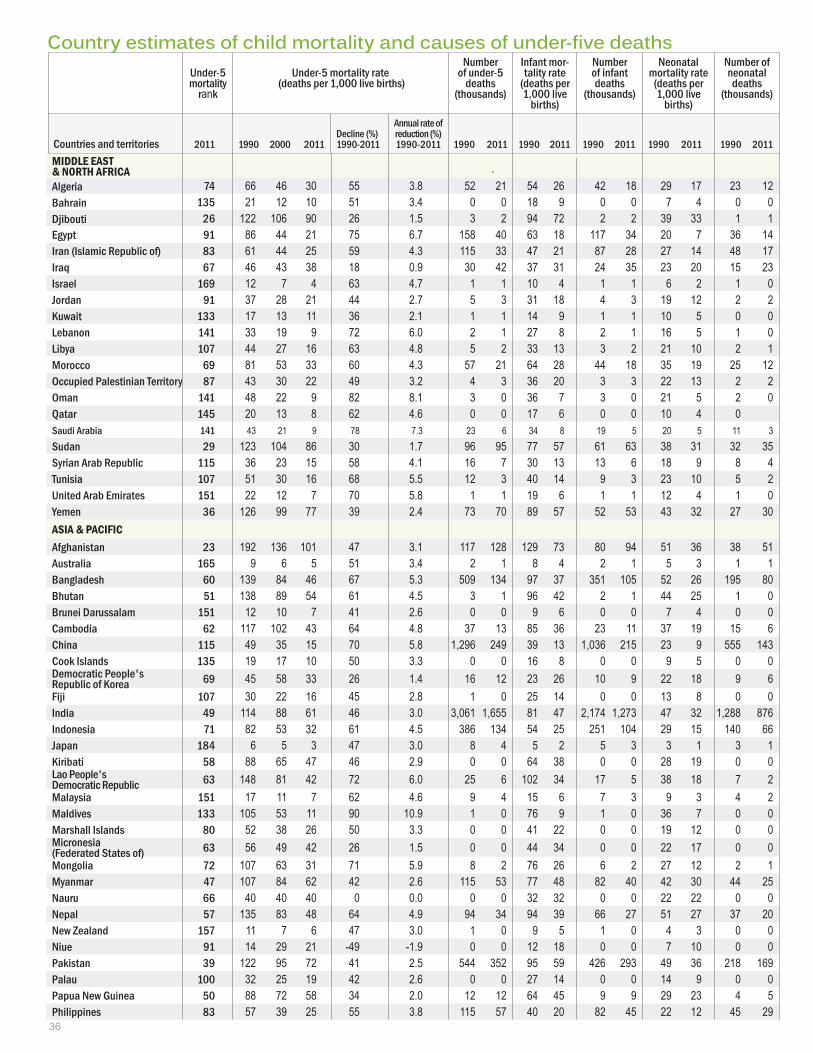
MIDDlE EAST & North AfricAAlgeria 74 66 46 30 55 3.8 52 21 54 26 42 18 29 17 23 12Bahrain 135 21 12 10 51 3.4 0 0 18 9 0 0 7 4 0 0Djibouti 26 122 106 90 26 1.5 3 2 94 72 2 2 39 33 1 1Egypt 91 86 44 21 75 6.7 158 40 63 18 117 34 20 7 36 14Iran (Islamic Republic of) 83 61 44 25 59 4.3 115 33 47 21 87 28 27 14 48 17Iraq 67 46 43 38 18 0.9 30 42 37 31 24 35 23 20 15 23Israel 169 12 7 4 63 4.7 1 1 10 4 1 1 6 2 1 0Jordan 91 37 28 21 44 2.7 5 3 31 18 4 3 19 12 2 2Kuwait 133 17 13 11 36 2.1 1 1 14 9 1 1 10 5 0 0Lebanon 141 33 19 9 72 6.0 2 1 27 8 2 1 16 5 1 0Libya 107 44 27 16 63 4.8 5 2 33 13 3 2 21 10 2 1Morocco 69 81 53 33 60 4.3 57 21 64 28 44 18 35 19 25 12Occupied Palestinian Territory 87 43 30 22 49 3.2 4 3 36 20 3 3 22 13 2 2Oman 141 48 22 9 82 8.1 3 0 36 7 3 0 21 5 2 0Qatar 145 20 13 8 62 4.6 0 0 17 6 0 0 10 4 0Saudi Arabia 141 43 21 9 78 7.3 23 6 34 8 19 5 20 5 11 3Sudan 29 123 104 86 30 1.7 96 95 77 57 61 63 38 31 32 35Syrian Arab Republic 115 36 23 15 58 4.1 16 7 30 13 13 6 18 9 8 4Tunisia 107 51 30 16 68 5.5 12 3 40 14 9 3 23 10 5 2United Arab Emirates 151 22 12 7 70 5.8 1 1 19 6 1 1 12 4 1 0Yemen 36 126 99 77 39 2.4 73 70 89 57 52 53 43 32 27 30ASIA & PACIfICAfghanistan 23 192 136 101 47 3.1 117 128 129 73 80 94 51 36 38 51Australia 165 9 6 5 51 3.4 2 1 8 4 2 1 5 3 1 1Bangladesh 60 139 84 46 67 5.3 509 134 97 37 351 105 52 26 195 80Bhutan 51 138 89 54 61 4.5 3 1 96 42 2 1 44 25 1 0Brunei Darussalam 151 12 10 7 41 2.6 0 0 9 6 0 0 7 4 0 0Cambodia 62 117 102 43 64 4.8 37 13 85 36 23 11 37 19 15 6China 115 49 35 15 70 5.8 1,296 249 39 13 1,036 215 23 9 555 143Cook Islands 135 19 17 10 50 3.3 0 0 16 8 0 0 9 5 0 0Democratic People's Republic of Korea 69 45 58 33 26 1.4 16 12 23 26 10 9 22 18 9 6Fiji 107 30 22 16 45 2.8 1 0 25 14 0 0 13 8 0 0India 49 114 88 61 46 3.0 3,061 1,655 81 47 2,174 1,273 47 32 1,288 876Indonesia 71 82 53 32 61 4.5 386 134 54 25 251 104 29 15 140 66Japan 184 6 5 3 47 3.0 8 4 5 2 5 3 3 1 3 1Kiribati 58 88 65 47 46 2.9 0 0 64 38 0 0 28 19 0 0Lao People's Democratic Republic 63 148 81 42 72 6.0 25 6 102 34 17 5 38 18 7 2Malaysia 151 17 11 7 62 4.6 9 4 15 6 7 3 9 3 4 2Maldives 133 105 53 11 90 10.9 1 0 76 9 1 0 36 7 0 0Marshall Islands 80 52 38 26 50 3.3 0 0 41 22 0 0 19 12 0 0Micronesia (Federated States of) 63 56 49 42 26 1.5 0 0 44 34 0 0 22 17 0 0Mongolia 72 107 63 31 71 5.9 8 2 76 26 6 2 27 12 2 1Myanmar 47 107 84 62 42 2.6 115 53 77 48 82 40 42 30 44 25Nauru 66 40 40 40 0 0.0 0 0 32 32 0 0 22 22 0 0Nepal 57 135 83 48 64 4.9 94 34 94 39 66 27 51 27 37 20New Zealand 157 11 7 6 47 3.0 1 0 9 5 1 0 4 3 0 0Niue 91 14 29 21 -49 -1.9 0 0 12 18 0 0 7 10 0 0Pakistan 39 122 95 72 41 2.5 544 352 95 59 426 293 49 36 218 169Palau 100 32 25 19 42 2.6 0 0 27 14 0 0 14 9 0 0Papua New Guinea 50 88 72 58 34 2.0 12 12 64 45 9 9 29 23 4 5Philippines 83 57 39 25 55 3.8 115 57 40 20 82 45 22 12 45 29
36
Under-5 mortality
rank
Under-5 mortality rate
(deaths per 1,000 live births)
Number of under-5
deaths (thousands)
Infant mor-tality rate
(deaths per 1,000 live
births)
Number of infant deaths
(thousands)
Neonatal mortality rate
(deaths per 1,000 live
births)
Number of neonatal
deaths (thousands)
Countries and territories 2011 1990 2000 2011Decline (%) 1990-2011
Annual rate of reduction (%)1990-2011 1990 2011 1990 2011 1990 2011 1990 2011 1990 2011
Country estimates of child mortality and causes of under-five deaths
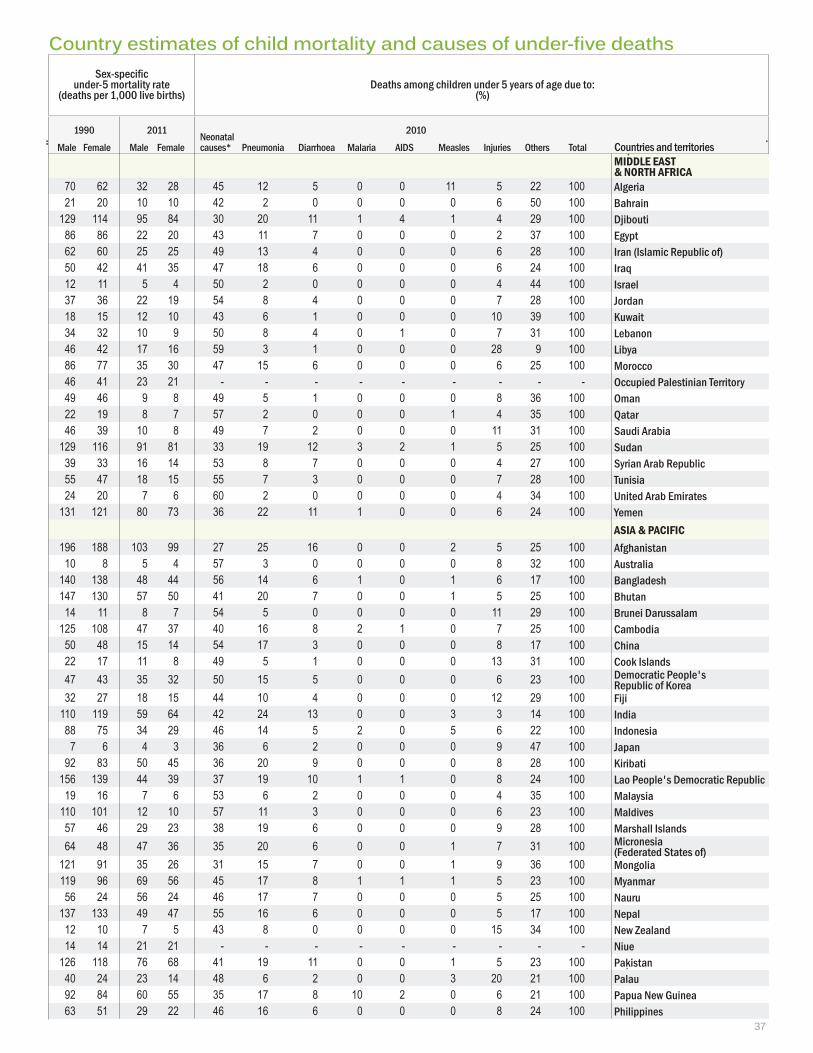
Sex-specific under-5 mortality rate
(deaths per 1,000 live births)
Deaths among children under 5 years of age due to:
(%)
1990
Male Female
2011
Male Female
Neonatal 2010 causes* Pneumonia Diarrhoea Malaria AIDS Measles Injuries Others Total Countries and territories
MIDDlE EAST & North AfricAAlgeria 74 66 46 30 55 3.8 52 21 54 26 42 18 29 17 23 12Bahrain 135 21 12 10 51 3.4 0 0 18 9 0 0 7 4 0 0Djibouti 26 122 106 90 26 1.5 3 2 94 72 2 2 39 33 1 1Egypt 91 86 44 21 75 6.7 158 40 63 18 117 34 20 7 36 14Iran (Islamic Republic of) 83 61 44 25 59 4.3 115 33 47 21 87 28 27 14 48 17Iraq 67 46 43 38 18 0.9 30 42 37 31 24 35 23 20 15 23Israel 169 12 7 4 63 4.7 1 1 10 4 1 1 6 2 1 0Jordan 91 37 28 21 44 2.7 5 3 31 18 4 3 19 12 2 2Kuwait 133 17 13 11 36 2.1 1 1 14 9 1 1 10 5 0 0Lebanon 141 33 19 9 72 6.0 2 1 27 8 2 1 16 5 1 0Libya 107 44 27 16 63 4.8 5 2 33 13 3 2 21 10 2 1Morocco 69 81 53 33 60 4.3 57 21 64 28 44 18 35 19 25 12Occupied Palestinian Territory 87 43 30 22 49 3.2 4 3 36 20 3 3 22 13 2 2Oman 141 48 22 9 82 8.1 3 0 36 7 3 0 21 5 2 0Qatar 145 20 13 8 62 4.6 0 0 17 6 0 0 10 4 0Saudi Arabia 141 43 21 9 78 7.3 23 6 34 8 19 5 20 5 11 3Sudan 29 123 104 86 30 1.7 96 95 77 57 61 63 38 31 32 35Syrian Arab Republic 115 36 23 15 58 4.1 16 7 30 13 13 6 18 9 8 4Tunisia 107 51 30 16 68 5.5 12 3 40 14 9 3 23 10 5 2United Arab Emirates 151 22 12 7 70 5.8 1 1 19 6 1 1 12 4 1 0Yemen 36 126 99 77 39 2.4 73 70 89 57 52 53 43 32 27 30ASIA & PACIfICAfghanistan 23 192 136 101 47 3.1 117 128 129 73 80 94 51 36 38 51Australia 165 9 6 5 51 3.4 2 1 8 4 2 1 5 3 1 1Bangladesh 60 139 84 46 67 5.3 509 134 97 37 351 105 52 26 195 80Bhutan 51 138 89 54 61 4.5 3 1 96 42 2 1 44 25 1 0Brunei Darussalam 151 12 10 7 41 2.6 0 0 9 6 0 0 7 4 0 0Cambodia 62 117 102 43 64 4.8 37 13 85 36 23 11 37 19 15 6China 115 49 35 15 70 5.8 1,296 249 39 13 1,036 215 23 9 555 143Cook Islands 135 19 17 10 50 3.3 0 0 16 8 0 0 9 5 0 0Democratic People's Republic of Korea 69 45 58 33 26 1.4 16 12 23 26 10 9 22 18 9 6Fiji 107 30 22 16 45 2.8 1 0 25 14 0 0 13 8 0 0India 49 114 88 61 46 3.0 3,061 1,655 81 47 2,174 1,273 47 32 1,288 876Indonesia 71 82 53 32 61 4.5 386 134 54 25 251 104 29 15 140 66Japan 184 6 5 3 47 3.0 8 4 5 2 5 3 3 1 3 1Kiribati 58 88 65 47 46 2.9 0 0 64 38 0 0 28 19 0 0Lao People's Democratic Republic 63 148 81 42 72 6.0 25 6 102 34 17 5 38 18 7 2Malaysia 151 17 11 7 62 4.6 9 4 15 6 7 3 9 3 4 2Maldives 133 105 53 11 90 10.9 1 0 76 9 1 0 36 7 0 0Marshall Islands 80 52 38 26 50 3.3 0 0 41 22 0 0 19 12 0 0Micronesia (Federated States of) 63 56 49 42 26 1.5 0 0 44 34 0 0 22 17 0 0Mongolia 72 107 63 31 71 5.9 8 2 76 26 6 2 27 12 2 1Myanmar 47 107 84 62 42 2.6 115 53 77 48 82 40 42 30 44 25Nauru 66 40 40 40 0 0.0 0 0 32 32 0 0 22 22 0 0Nepal 57 135 83 48 64 4.9 94 34 94 39 66 27 51 27 37 20New Zealand 157 11 7 6 47 3.0 1 0 9 5 1 0 4 3 0 0Niue 91 14 29 21 -49 -1.9 0 0 12 18 0 0 7 10 0 0Pakistan 39 122 95 72 41 2.5 544 352 95 59 426 293 49 36 218 169Palau 100 32 25 19 42 2.6 0 0 27 14 0 0 14 9 0 0Papua New Guinea 50 88 72 58 34 2.0 12 12 64 45 9 9 29 23 4 5Philippines 83 57 39 25 55 3.8 115 57 40 20 82 45 22 12 45 29
MIDDlE EAST & North AfricA
70 62 32 28 45 12 5 0 0 11 5 22 100 Algeria21 20 10 10 42 2 0 0 0 0 6 50 100 Bahrain
129 114 95 84 30 20 11 1 4 1 4 29 100 Djibouti86 86 22 20 43 11 7 0 0 0 2 37 100 Egypt62 60 25 25 49 13 4 0 0 0 6 28 100 Iran (Islamic Republic of)50 42 41 35 47 18 6 0 0 0 6 24 100 Iraq12 11 5 4 50 2 0 0 0 0 4 44 100 Israel37 36 22 19 54 8 4 0 0 0 7 28 100 Jordan18 15 12 10 43 6 1 0 0 0 10 39 100 Kuwait34 32 10 9 50 8 4 0 1 0 7 31 100 Lebanon46 42 17 16 59 3 1 0 0 0 28 9 100 Libya86 77 35 30 47 15 6 0 0 0 6 25 100 Morocco46 41 23 21 - - - - - - - - - Occupied Palestinian Territory49 46 9 8 49 5 1 0 0 0 8 36 100 Oman22 19 8 7 57 2 0 0 0 1 4 35 100 Qatar46 39 10 8 49 7 2 0 0 0 11 31 100 Saudi Arabia
129 116 91 81 33 19 12 3 2 1 5 25 100 Sudan39 33 16 14 53 8 7 0 0 0 4 27 100 Syrian Arab Republic55 47 18 15 55 7 3 0 0 0 7 28 100 Tunisia24 20 7 6 60 2 0 0 0 0 4 34 100 United Arab Emirates
131 121 80 73 36 22 11 1 0 0 6 24 100 YemenASIA & PACIfIC
196 188 103 99 27 25 16 0 0 2 5 25 100 Afghanistan10 8 5 4 57 3 0 0 0 0 8 32 100 Australia
140 138 48 44 56 14 6 1 0 1 6 17 100 Bangladesh147 130 57 50 41 20 7 0 0 1 5 25 100 Bhutan
14 11 8 7 54 5 0 0 0 0 11 29 100 Brunei Darussalam125 108 47 37 40 16 8 2 1 0 7 25 100 Cambodia
50 48 15 14 54 17 3 0 0 0 8 17 100 China22 17 11 8 49 5 1 0 0 0 13 31 100 Cook Islands47 43 35 32 50 15 5 0 0 0 6 23 100 Democratic People's
Republic of Korea32 27 18 15 44 10 4 0 0 0 12 29 100 Fiji
110 119 59 64 42 24 13 0 0 3 3 14 100 India88 75 34 29 46 14 5 2 0 5 6 22 100 Indonesia
7 6 4 3 36 6 2 0 0 0 9 47 100 Japan92 83 50 45 36 20 9 0 0 0 8 28 100 Kiribati
156 139 44 39 37 19 10 1 1 0 8 24 100 Lao People's Democratic Republic19 16 7 6 53 6 2 0 0 0 4 35 100 Malaysia
110 101 12 10 57 11 3 0 0 0 6 23 100 Maldives57 46 29 23 38 19 6 0 0 0 9 28 100 Marshall Islands64 48 47 36 35 20 6 0 0 1 7 31 100 Micronesia
(Federated States of)121 91 35 26 31 15 7 0 0 1 9 36 100 Mongolia119 96 69 56 45 17 8 1 1 1 5 23 100 Myanmar56 24 56 24 46 17 7 0 0 0 5 25 100 Nauru
137 133 49 47 55 16 6 0 0 0 5 17 100 Nepal12 10 7 5 43 8 0 0 0 0 15 34 100 New Zealand14 14 21 21 - - - - - - - - - Niue
126 118 76 68 41 19 11 0 0 1 5 23 100 Pakistan40 24 23 14 48 6 2 0 0 3 20 21 100 Palau92 84 60 55 35 17 8 10 2 0 6 21 100 Papua New Guinea63 51 29 22 46 16 6 0 0 0 8 24 100 Philippines
37
Country estimates of child mortality and causes of under-five deaths
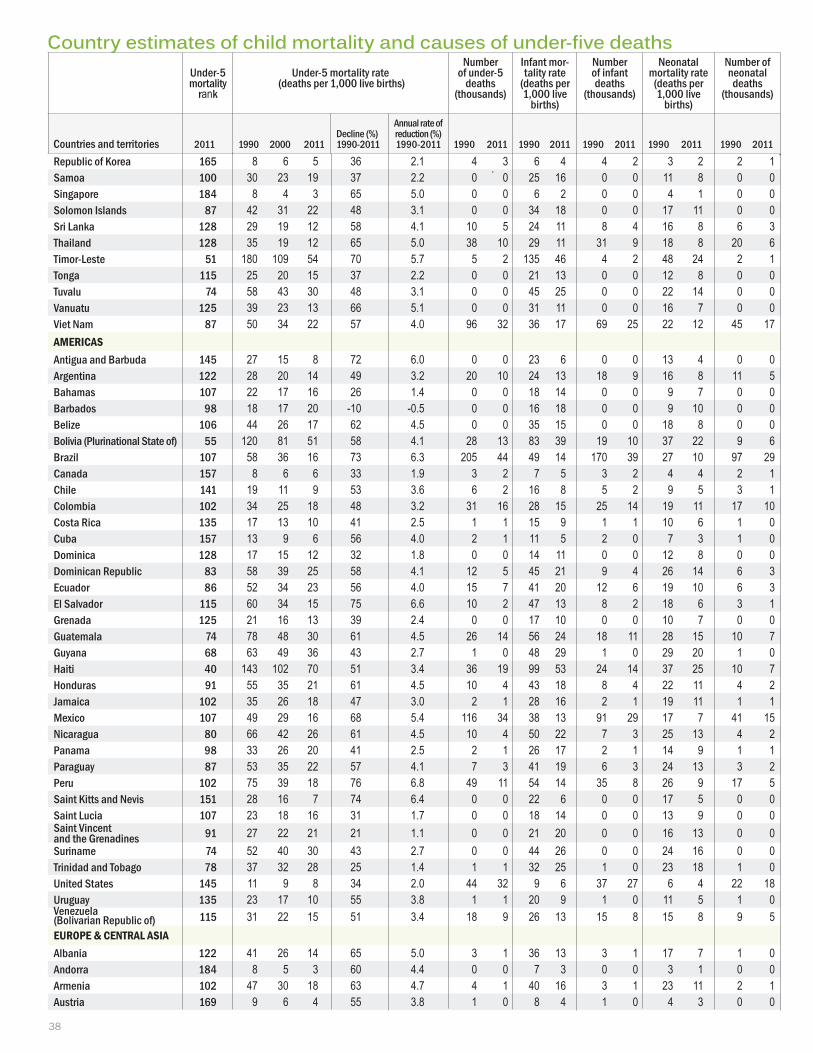
Republic of Korea 165 8 6 5 36 2.1 4 3 6 4 4 2 3 2 2 1Samoa 100 30 23 19 37 2.2 0 0 25 16 0 0 11 8 0 0Singapore 184 8 4 3 65 5.0 0 0 6 2 0 0 4 1 0 0Solomon Islands 87 42 31 22 48 3.1 0 0 34 18 0 0 17 11 0 0Sri Lanka 128 29 19 12 58 4.1 10 5 24 11 8 4 16 8 6 3Thailand 128 35 19 12 65 5.0 38 10 29 11 31 9 18 8 20 6Timor-Leste 51 180 109 54 70 5.7 5 2 135 46 4 2 48 24 2 1Tonga 115 25 20 15 37 2.2 0 0 21 13 0 0 12 8 0 0Tuvalu 74 58 43 30 48 3.1 0 0 45 25 0 0 22 14 0 0Vanuatu 125 39 23 13 66 5.1 0 0 31 11 0 0 16 7 0 0Viet Nam 87 50 34 22 57 4.0 96 32 36 17 69 25 22 12 45 17AMERICASAntigua and Barbuda 145 27 15 8 72 6.0 0 0 23 6 0 0 13 4 0 0Argentina 122 28 20 14 49 3.2 20 10 24 13 18 9 16 8 11 5Bahamas 107 22 17 16 26 1.4 0 0 18 14 0 0 9 7 0 0Barbados 98 18 17 20 -10 -0.5 0 0 16 18 0 0 9 10 0 0Belize 106 44 26 17 62 4.5 0 0 35 15 0 0 18 8 0 0Bolivia (Plurinational State of) 55 120 81 51 58 4.1 28 13 83 39 19 10 37 22 9 6Brazil 107 58 36 16 73 6.3 205 44 49 14 170 39 27 10 97 29Canada 157 8 6 6 33 1.9 3 2 7 5 3 2 4 4 2 1Chile 141 19 11 9 53 3.6 6 2 16 8 5 2 9 5 3 1Colombia 102 34 25 18 48 3.2 31 16 28 15 25 14 19 11 17 10Costa Rica 135 17 13 10 41 2.5 1 1 15 9 1 1 10 6 1 0Cuba 157 13 9 6 56 4.0 2 1 11 5 2 0 7 3 1 0Dominica 128 17 15 12 32 1.8 0 0 14 11 0 0 12 8 0 0Dominican Republic 83 58 39 25 58 4.1 12 5 45 21 9 4 26 14 6 3Ecuador 86 52 34 23 56 4.0 15 7 41 20 12 6 19 10 6 3El Salvador 115 60 34 15 75 6.6 10 2 47 13 8 2 18 6 3 1Grenada 125 21 16 13 39 2.4 0 0 17 10 0 0 10 7 0 0Guatemala 74 78 48 30 61 4.5 26 14 56 24 18 11 28 15 10 7Guyana 68 63 49 36 43 2.7 1 0 48 29 1 0 29 20 1 0Haiti 40 143 102 70 51 3.4 36 19 99 53 24 14 37 25 10 7Honduras 91 55 35 21 61 4.5 10 4 43 18 8 4 22 11 4 2Jamaica 102 35 26 18 47 3.0 2 1 28 16 2 1 19 11 1 1Mexico 107 49 29 16 68 5.4 116 34 38 13 91 29 17 7 41 15Nicaragua 80 66 42 26 61 4.5 10 4 50 22 7 3 25 13 4 2Panama 98 33 26 20 41 2.5 2 1 26 17 2 1 14 9 1 1Paraguay 87 53 35 22 57 4.1 7 3 41 19 6 3 24 13 3 2Peru 102 75 39 18 76 6.8 49 11 54 14 35 8 26 9 17 5Saint Kitts and Nevis 151 28 16 7 74 6.4 0 0 22 6 0 0 17 5 0 0Saint Lucia 107 23 18 16 31 1.7 0 0 18 14 0 0 13 9 0 0Saint Vincent and the Grenadines 91 27 22 21 21 1.1 0 0 21 20 0 0 16 13 0 0Suriname 74 52 40 30 43 2.7 0 0 44 26 0 0 24 16 0 0Trinidad and Tobago 78 37 32 28 25 1.4 1 1 32 25 1 0 23 18 1 0United States 145 11 9 8 34 2.0 44 32 9 6 37 27 6 4 22 18Uruguay 135 23 17 10 55 3.8 1 1 20 9 1 0 11 5 1 0Venezuela (Bolivarian Republic of) 115 31 22 15 51 3.4 18 9 26 13 15 8 15 8 9 5EUROPE & CENTRAl ASIA Albania 122 41 26 14 65 5.0 3 1 36 13 3 1 17 7 1 0Andorra 184 8 5 3 60 4.4 0 0 7 3 0 0 3 1 0 0Armenia 102 47 30 18 63 4.7 4 1 40 16 3 1 23 11 2 1Austria 169 9 6 4 55 3.8 1 0 8 4 1 0 4 3 0 0
38
Under-5 mortality
rank
Under-5 mortality rate
(deaths per 1,000 live births)
Number of under-5
deaths (thousands)
Infant mor-tality rate
(deaths per 1,000 live
births)
Number of infant deaths
(thousands)
Neonatal mortality rate
(deaths per 1,000 live
births)
Number of neonatal
deaths (thousands)
Countries and territories 2011 1990 2000 2011Decline (%) 1990-2011
Annual rate of reduction (%)1990-2011 1990 2011 1990 2011 1990 2011 1990 2011 1990 2011
Country estimates of child mortality and causes of under-five deaths
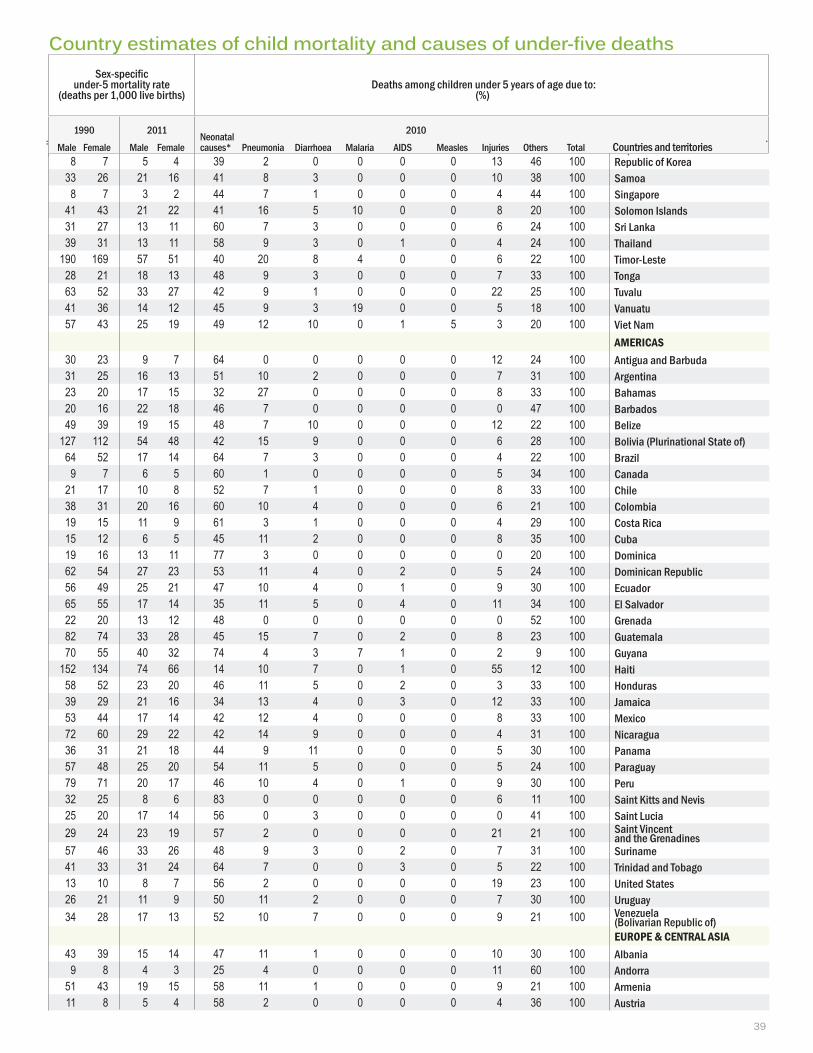
Sex-specific under-5 mortality rate
(deaths per 1,000 live births)
Deaths among children under 5 years of age due to:
(%)
1990
Male Female
2011
Male Female
Neonatal 2010 causes* Pneumonia Diarrhoea Malaria AIDS Measles Injuries Others Total Countries and territories
Republic of Korea 165 8 6 5 36 2.1 4 3 6 4 4 2 3 2 2 1Samoa 100 30 23 19 37 2.2 0 0 25 16 0 0 11 8 0 0Singapore 184 8 4 3 65 5.0 0 0 6 2 0 0 4 1 0 0Solomon Islands 87 42 31 22 48 3.1 0 0 34 18 0 0 17 11 0 0Sri Lanka 128 29 19 12 58 4.1 10 5 24 11 8 4 16 8 6 3Thailand 128 35 19 12 65 5.0 38 10 29 11 31 9 18 8 20 6Timor-Leste 51 180 109 54 70 5.7 5 2 135 46 4 2 48 24 2 1Tonga 115 25 20 15 37 2.2 0 0 21 13 0 0 12 8 0 0Tuvalu 74 58 43 30 48 3.1 0 0 45 25 0 0 22 14 0 0Vanuatu 125 39 23 13 66 5.1 0 0 31 11 0 0 16 7 0 0Viet Nam 87 50 34 22 57 4.0 96 32 36 17 69 25 22 12 45 17AMERICASAntigua and Barbuda 145 27 15 8 72 6.0 0 0 23 6 0 0 13 4 0 0Argentina 122 28 20 14 49 3.2 20 10 24 13 18 9 16 8 11 5Bahamas 107 22 17 16 26 1.4 0 0 18 14 0 0 9 7 0 0Barbados 98 18 17 20 -10 -0.5 0 0 16 18 0 0 9 10 0 0Belize 106 44 26 17 62 4.5 0 0 35 15 0 0 18 8 0 0Bolivia (Plurinational State of) 55 120 81 51 58 4.1 28 13 83 39 19 10 37 22 9 6Brazil 107 58 36 16 73 6.3 205 44 49 14 170 39 27 10 97 29Canada 157 8 6 6 33 1.9 3 2 7 5 3 2 4 4 2 1Chile 141 19 11 9 53 3.6 6 2 16 8 5 2 9 5 3 1Colombia 102 34 25 18 48 3.2 31 16 28 15 25 14 19 11 17 10Costa Rica 135 17 13 10 41 2.5 1 1 15 9 1 1 10 6 1 0Cuba 157 13 9 6 56 4.0 2 1 11 5 2 0 7 3 1 0Dominica 128 17 15 12 32 1.8 0 0 14 11 0 0 12 8 0 0Dominican Republic 83 58 39 25 58 4.1 12 5 45 21 9 4 26 14 6 3Ecuador 86 52 34 23 56 4.0 15 7 41 20 12 6 19 10 6 3El Salvador 115 60 34 15 75 6.6 10 2 47 13 8 2 18 6 3 1Grenada 125 21 16 13 39 2.4 0 0 17 10 0 0 10 7 0 0Guatemala 74 78 48 30 61 4.5 26 14 56 24 18 11 28 15 10 7Guyana 68 63 49 36 43 2.7 1 0 48 29 1 0 29 20 1 0Haiti 40 143 102 70 51 3.4 36 19 99 53 24 14 37 25 10 7Honduras 91 55 35 21 61 4.5 10 4 43 18 8 4 22 11 4 2Jamaica 102 35 26 18 47 3.0 2 1 28 16 2 1 19 11 1 1Mexico 107 49 29 16 68 5.4 116 34 38 13 91 29 17 7 41 15Nicaragua 80 66 42 26 61 4.5 10 4 50 22 7 3 25 13 4 2Panama 98 33 26 20 41 2.5 2 1 26 17 2 1 14 9 1 1Paraguay 87 53 35 22 57 4.1 7 3 41 19 6 3 24 13 3 2Peru 102 75 39 18 76 6.8 49 11 54 14 35 8 26 9 17 5Saint Kitts and Nevis 151 28 16 7 74 6.4 0 0 22 6 0 0 17 5 0 0Saint Lucia 107 23 18 16 31 1.7 0 0 18 14 0 0 13 9 0 0Saint Vincent and the Grenadines 91 27 22 21 21 1.1 0 0 21 20 0 0 16 13 0 0Suriname 74 52 40 30 43 2.7 0 0 44 26 0 0 24 16 0 0Trinidad and Tobago 78 37 32 28 25 1.4 1 1 32 25 1 0 23 18 1 0United States 145 11 9 8 34 2.0 44 32 9 6 37 27 6 4 22 18Uruguay 135 23 17 10 55 3.8 1 1 20 9 1 0 11 5 1 0Venezuela (Bolivarian Republic of) 115 31 22 15 51 3.4 18 9 26 13 15 8 15 8 9 5EUROPE & CENTRAl ASIA Albania 122 41 26 14 65 5.0 3 1 36 13 3 1 17 7 1 0Andorra 184 8 5 3 60 4.4 0 0 7 3 0 0 3 1 0 0Armenia 102 47 30 18 63 4.7 4 1 40 16 3 1 23 11 2 1Austria 169 9 6 4 55 3.8 1 0 8 4 1 0 4 3 0 0
8 7 5 4 39 2 0 0 0 0 13 46 100 Republic of Korea33 26 21 16 41 8 3 0 0 0 10 38 100 Samoa8 7 3 2 44 7 1 0 0 0 4 44 100 Singapore
41 43 21 22 41 16 5 10 0 0 8 20 100 Solomon Islands31 27 13 11 60 7 3 0 0 0 6 24 100 Sri Lanka39 31 13 11 58 9 3 0 1 0 4 24 100 Thailand
190 169 57 51 40 20 8 4 0 0 6 22 100 Timor-Leste28 21 18 13 48 9 3 0 0 0 7 33 100 Tonga63 52 33 27 42 9 1 0 0 0 22 25 100 Tuvalu41 36 14 12 45 9 3 19 0 0 5 18 100 Vanuatu57 43 25 19 49 12 10 0 1 5 3 20 100 Viet Nam
AMERICAS30 23 9 7 64 0 0 0 0 0 12 24 100 Antigua and Barbuda31 25 16 13 51 10 2 0 0 0 7 31 100 Argentina23 20 17 15 32 27 0 0 0 0 8 33 100 Bahamas20 16 22 18 46 7 0 0 0 0 0 47 100 Barbados49 39 19 15 48 7 10 0 0 0 12 22 100 Belize
127 112 54 48 42 15 9 0 0 0 6 28 100 Bolivia (Plurinational State of)64 52 17 14 64 7 3 0 0 0 4 22 100 Brazil
9 7 6 5 60 1 0 0 0 0 5 34 100 Canada21 17 10 8 52 7 1 0 0 0 8 33 100 Chile38 31 20 16 60 10 4 0 0 0 6 21 100 Colombia19 15 11 9 61 3 1 0 0 0 4 29 100 Costa Rica15 12 6 5 45 11 2 0 0 0 8 35 100 Cuba19 16 13 11 77 3 0 0 0 0 0 20 100 Dominica62 54 27 23 53 11 4 0 2 0 5 24 100 Dominican Republic56 49 25 21 47 10 4 0 1 0 9 30 100 Ecuador65 55 17 14 35 11 5 0 4 0 11 34 100 El Salvador22 20 13 12 48 0 0 0 0 0 0 52 100 Grenada82 74 33 28 45 15 7 0 2 0 8 23 100 Guatemala70 55 40 32 74 4 3 7 1 0 2 9 100 Guyana
152 134 74 66 14 10 7 0 1 0 55 12 100 Haiti58 52 23 20 46 11 5 0 2 0 3 33 100 Honduras39 29 21 16 34 13 4 0 3 0 12 33 100 Jamaica53 44 17 14 42 12 4 0 0 0 8 33 100 Mexico72 60 29 22 42 14 9 0 0 0 4 31 100 Nicaragua36 31 21 18 44 9 11 0 0 0 5 30 100 Panama57 48 25 20 54 11 5 0 0 0 5 24 100 Paraguay79 71 20 17 46 10 4 0 1 0 9 30 100 Peru32 25 8 6 83 0 0 0 0 0 6 11 100 Saint Kitts and Nevis25 20 17 14 56 0 3 0 0 0 0 41 100 Saint Lucia29 24 23 19 57 2 0 0 0 0 21 21 100 Saint Vincent
and the Grenadines57 46 33 26 48 9 3 0 2 0 7 31 100 Suriname41 33 31 24 64 7 0 0 3 0 5 22 100 Trinidad and Tobago13 10 8 7 56 2 0 0 0 0 19 23 100 United States26 21 11 9 50 11 2 0 0 0 7 30 100 Uruguay34 28 17 13 52 10 7 0 0 0 9 21 100 Venezuela
(Bolivarian Republic of)EUROPE & CENTRAl ASIA
43 39 15 14 47 11 1 0 0 0 10 30 100 Albania9 8 4 3 25 4 0 0 0 0 11 60 100 Andorra
51 43 19 15 58 11 1 0 0 0 9 21 100 Armenia11 8 5 4 58 2 0 0 0 0 4 36 100 Austria
39
Country estimates of child mortality and causes of under-five deaths
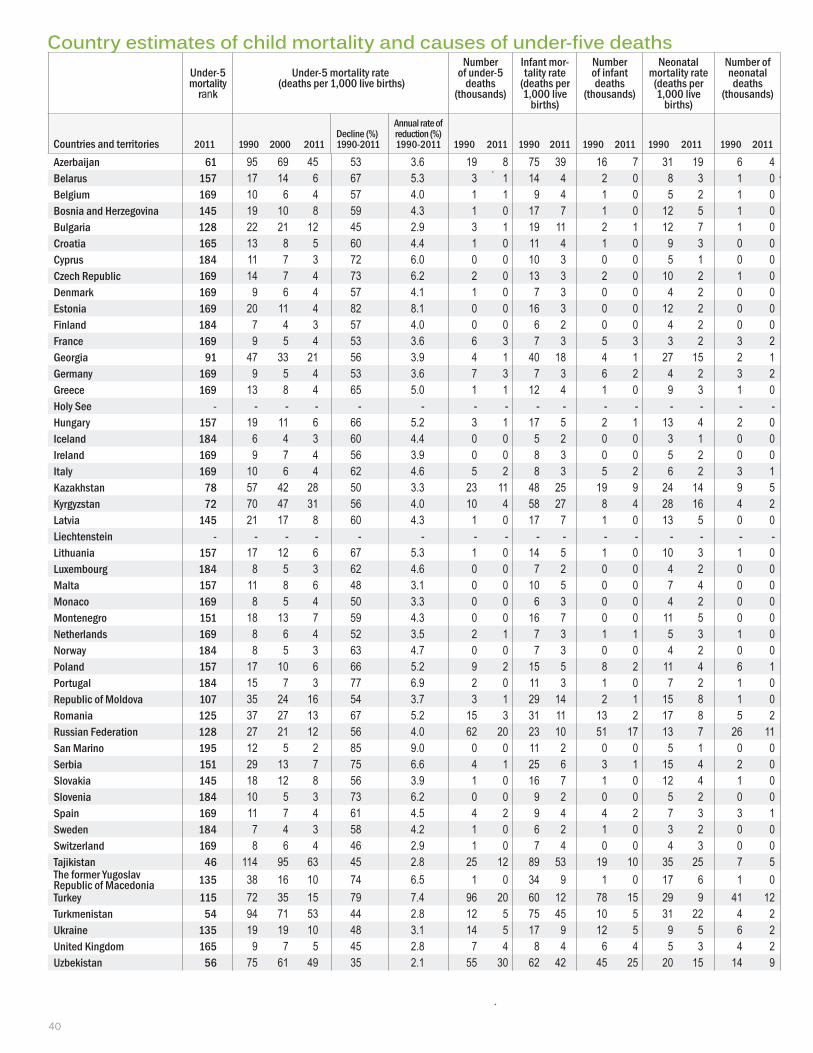
Under-5 mortality
rank
Under-5 mortality rate
(deaths per 1,000 live births)
Number of under-5
deaths (thousands)
Infant mor-tality rate
(deaths per 1,000 live
births)
Number of infant deaths
(thousands)
Neonatal mortality rate
(deaths per 1,000 live
births)
Number of neonatal
deaths (thousands)
Countries and territories 2011 1990 2000 2011Decline (%) 1990-2011
Annual rate of reduction (%)1990-2011 1990 2011 1990 2011 1990 2011 1990 2011 1990 2011
Azerbaijan 61 95 69 45 53 3.6 19 8 75 39 16 7 31 19 6 4Belarus 157 17 14 6 67 5.3 3 1 14 4 2 0 8 3 1 0Belgium 169 10 6 4 57 4.0 1 1 9 4 1 0 5 2 1 0Bosnia and Herzegovina 145 19 10 8 59 4.3 1 0 17 7 1 0 12 5 1 0Bulgaria 128 22 21 12 45 2.9 3 1 19 11 2 1 12 7 1 0Croatia 165 13 8 5 60 4.4 1 0 11 4 1 0 9 3 0 0Cyprus 184 11 7 3 72 6.0 0 0 10 3 0 0 5 1 0 0Czech Republic 169 14 7 4 73 6.2 2 0 13 3 2 0 10 2 1 0Denmark 169 9 6 4 57 4.1 1 0 7 3 0 0 4 2 0 0Estonia 169 20 11 4 82 8.1 0 0 16 3 0 0 12 2 0 0Finland 184 7 4 3 57 4.0 0 0 6 2 0 0 4 2 0 0France 169 9 5 4 53 3.6 6 3 7 3 5 3 3 2 3 2Georgia 91 47 33 21 56 3.9 4 1 40 18 4 1 27 15 2 1Germany 169 9 5 4 53 3.6 7 3 7 3 6 2 4 2 3 2Greece 169 13 8 4 65 5.0 1 1 12 4 1 0 9 3 1 0Holy See - - - - - - - - - - - - - - - -Hungary 157 19 11 6 66 5.2 3 1 17 5 2 1 13 4 2 0Iceland 184 6 4 3 60 4.4 0 0 5 2 0 0 3 1 0 0Ireland 169 9 7 4 56 3.9 0 0 8 3 0 0 5 2 0 0Italy 169 10 6 4 62 4.6 5 2 8 3 5 2 6 2 3 1Kazakhstan 78 57 42 28 50 3.3 23 11 48 25 19 9 24 14 9 5Kyrgyzstan 72 70 47 31 56 4.0 10 4 58 27 8 4 28 16 4 2Latvia 145 21 17 8 60 4.3 1 0 17 7 1 0 13 5 0 0Liechtenstein - - - - - - - - - - - - - - - -Lithuania 157 17 12 6 67 5.3 1 0 14 5 1 0 10 3 1 0Luxembourg 184 8 5 3 62 4.6 0 0 7 2 0 0 4 2 0 0Malta 157 11 8 6 48 3.1 0 0 10 5 0 0 7 4 0 0Monaco 169 8 5 4 50 3.3 0 0 6 3 0 0 4 2 0 0Montenegro 151 18 13 7 59 4.3 0 0 16 7 0 0 11 5 0 0Netherlands 169 8 6 4 52 3.5 2 1 7 3 1 1 5 3 1 0Norway 184 8 5 3 63 4.7 0 0 7 3 0 0 4 2 0 0Poland 157 17 10 6 66 5.2 9 2 15 5 8 2 11 4 6 1Portugal 184 15 7 3 77 6.9 2 0 11 3 1 0 7 2 1 0Republic of Moldova 107 35 24 16 54 3.7 3 1 29 14 2 1 15 8 1 0Romania 125 37 27 13 67 5.2 15 3 31 11 13 2 17 8 5 2Russian Federation 128 27 21 12 56 4.0 62 20 23 10 51 17 13 7 26 11San Marino 195 12 5 2 85 9.0 0 0 11 2 0 0 5 1 0 0Serbia 151 29 13 7 75 6.6 4 1 25 6 3 1 15 4 2 0Slovakia 145 18 12 8 56 3.9 1 0 16 7 1 0 12 4 1 0Slovenia 184 10 5 3 73 6.2 0 0 9 2 0 0 5 2 0 0Spain 169 11 7 4 61 4.5 4 2 9 4 4 2 7 3 3 1Sweden 184 7 4 3 58 4.2 1 0 6 2 1 0 3 2 0 0Switzerland 169 8 6 4 46 2.9 1 0 7 4 0 0 4 3 0 0Tajikistan 46 114 95 63 45 2.8 25 12 89 53 19 10 35 25 7 5The former Yugoslav Republic of Macedonia 135 38 16 10 74 6.5 1 0 34 9 1 0 17 6 1 0Turkey 115 72 35 15 79 7.4 96 20 60 12 78 15 29 9 41 12Turkmenistan 54 94 71 53 44 2.8 12 5 75 45 10 5 31 22 4 2Ukraine 135 19 19 10 48 3.1 14 5 17 9 12 5 9 5 6 2United Kingdom 165 9 7 5 45 2.8 7 4 8 4 6 4 5 3 4 2Uzbekistan 56 75 61 49 35 2.1 55 30 62 42 45 25 20 15 14 9
40
Country estimates of child mortality and causes of under-five deaths
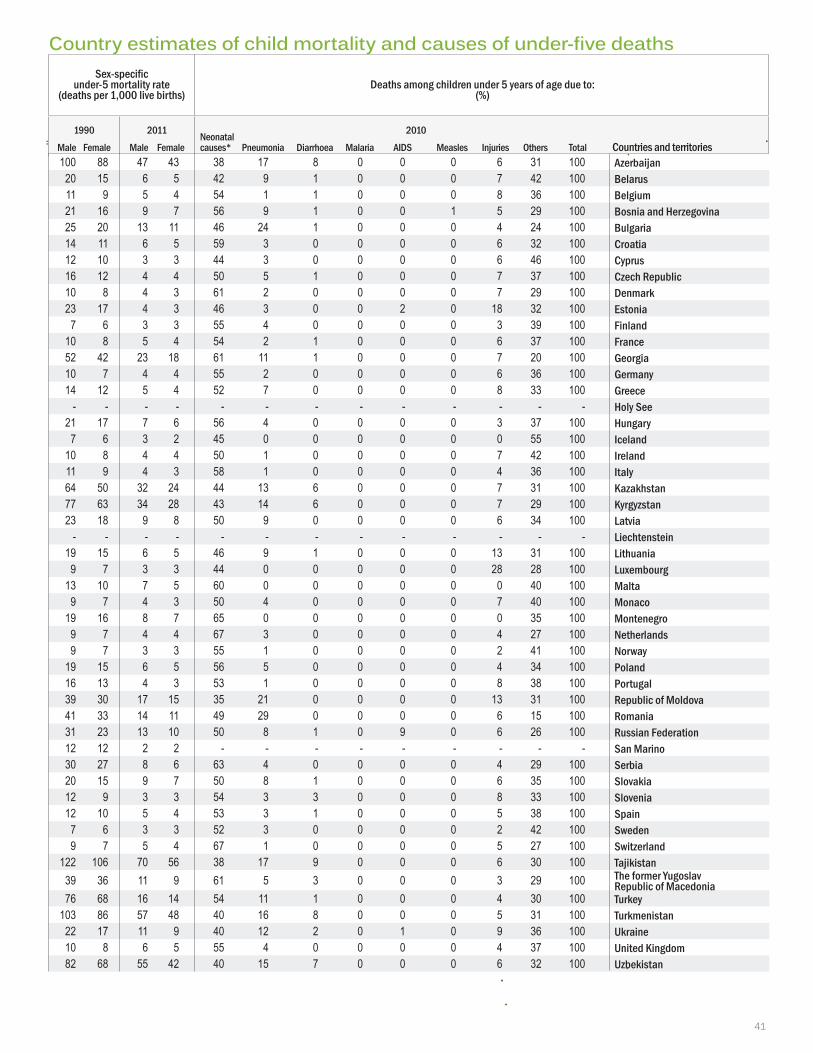
Sex-specific under-5 mortality rate
(deaths per 1,000 live births)
Deaths among children under 5 years of age due to:
(%)
1990
Male Female
2011
Male Female
Neonatal 2010 causes* Pneumonia Diarrhoea Malaria AIDS Measles Injuries Others Total Countries and territories
Azerbaijan 61 95 69 45 53 3.6 19 8 75 39 16 7 31 19 6 4Belarus 157 17 14 6 67 5.3 3 1 14 4 2 0 8 3 1 0Belgium 169 10 6 4 57 4.0 1 1 9 4 1 0 5 2 1 0Bosnia and Herzegovina 145 19 10 8 59 4.3 1 0 17 7 1 0 12 5 1 0Bulgaria 128 22 21 12 45 2.9 3 1 19 11 2 1 12 7 1 0Croatia 165 13 8 5 60 4.4 1 0 11 4 1 0 9 3 0 0Cyprus 184 11 7 3 72 6.0 0 0 10 3 0 0 5 1 0 0Czech Republic 169 14 7 4 73 6.2 2 0 13 3 2 0 10 2 1 0Denmark 169 9 6 4 57 4.1 1 0 7 3 0 0 4 2 0 0Estonia 169 20 11 4 82 8.1 0 0 16 3 0 0 12 2 0 0Finland 184 7 4 3 57 4.0 0 0 6 2 0 0 4 2 0 0France 169 9 5 4 53 3.6 6 3 7 3 5 3 3 2 3 2Georgia 91 47 33 21 56 3.9 4 1 40 18 4 1 27 15 2 1Germany 169 9 5 4 53 3.6 7 3 7 3 6 2 4 2 3 2Greece 169 13 8 4 65 5.0 1 1 12 4 1 0 9 3 1 0Holy See - - - - - - - - - - - - - - - -Hungary 157 19 11 6 66 5.2 3 1 17 5 2 1 13 4 2 0Iceland 184 6 4 3 60 4.4 0 0 5 2 0 0 3 1 0 0Ireland 169 9 7 4 56 3.9 0 0 8 3 0 0 5 2 0 0Italy 169 10 6 4 62 4.6 5 2 8 3 5 2 6 2 3 1Kazakhstan 78 57 42 28 50 3.3 23 11 48 25 19 9 24 14 9 5Kyrgyzstan 72 70 47 31 56 4.0 10 4 58 27 8 4 28 16 4 2Latvia 145 21 17 8 60 4.3 1 0 17 7 1 0 13 5 0 0Liechtenstein - - - - - - - - - - - - - - - -Lithuania 157 17 12 6 67 5.3 1 0 14 5 1 0 10 3 1 0Luxembourg 184 8 5 3 62 4.6 0 0 7 2 0 0 4 2 0 0Malta 157 11 8 6 48 3.1 0 0 10 5 0 0 7 4 0 0Monaco 169 8 5 4 50 3.3 0 0 6 3 0 0 4 2 0 0Montenegro 151 18 13 7 59 4.3 0 0 16 7 0 0 11 5 0 0Netherlands 169 8 6 4 52 3.5 2 1 7 3 1 1 5 3 1 0Norway 184 8 5 3 63 4.7 0 0 7 3 0 0 4 2 0 0Poland 157 17 10 6 66 5.2 9 2 15 5 8 2 11 4 6 1Portugal 184 15 7 3 77 6.9 2 0 11 3 1 0 7 2 1 0Republic of Moldova 107 35 24 16 54 3.7 3 1 29 14 2 1 15 8 1 0Romania 125 37 27 13 67 5.2 15 3 31 11 13 2 17 8 5 2Russian Federation 128 27 21 12 56 4.0 62 20 23 10 51 17 13 7 26 11San Marino 195 12 5 2 85 9.0 0 0 11 2 0 0 5 1 0 0Serbia 151 29 13 7 75 6.6 4 1 25 6 3 1 15 4 2 0Slovakia 145 18 12 8 56 3.9 1 0 16 7 1 0 12 4 1 0Slovenia 184 10 5 3 73 6.2 0 0 9 2 0 0 5 2 0 0Spain 169 11 7 4 61 4.5 4 2 9 4 4 2 7 3 3 1Sweden 184 7 4 3 58 4.2 1 0 6 2 1 0 3 2 0 0Switzerland 169 8 6 4 46 2.9 1 0 7 4 0 0 4 3 0 0Tajikistan 46 114 95 63 45 2.8 25 12 89 53 19 10 35 25 7 5The former Yugoslav Republic of Macedonia 135 38 16 10 74 6.5 1 0 34 9 1 0 17 6 1 0Turkey 115 72 35 15 79 7.4 96 20 60 12 78 15 29 9 41 12Turkmenistan 54 94 71 53 44 2.8 12 5 75 45 10 5 31 22 4 2Ukraine 135 19 19 10 48 3.1 14 5 17 9 12 5 9 5 6 2United Kingdom 165 9 7 5 45 2.8 7 4 8 4 6 4 5 3 4 2Uzbekistan 56 75 61 49 35 2.1 55 30 62 42 45 25 20 15 14 9
100 88 47 43 38 17 8 0 0 0 6 31 100 Azerbaijan20 15 6 5 42 9 1 0 0 0 7 42 100 Belarus11 9 5 4 54 1 1 0 0 0 8 36 100 Belgium21 16 9 7 56 9 1 0 0 1 5 29 100 Bosnia and Herzegovina25 20 13 11 46 24 1 0 0 0 4 24 100 Bulgaria14 11 6 5 59 3 0 0 0 0 6 32 100 Croatia12 10 3 3 44 3 0 0 0 0 6 46 100 Cyprus16 12 4 4 50 5 1 0 0 0 7 37 100 Czech Republic10 8 4 3 61 2 0 0 0 0 7 29 100 Denmark23 17 4 3 46 3 0 0 2 0 18 32 100 Estonia
7 6 3 3 55 4 0 0 0 0 3 39 100 Finland10 8 5 4 54 2 1 0 0 0 6 37 100 France52 42 23 18 61 11 1 0 0 0 7 20 100 Georgia10 7 4 4 55 2 0 0 0 0 6 36 100 Germany14 12 5 4 52 7 0 0 0 0 8 33 100 Greece
- - - - - - - - - - - - - Holy See21 17 7 6 56 4 0 0 0 0 3 37 100 Hungary
7 6 3 2 45 0 0 0 0 0 0 55 100 Iceland10 8 4 4 50 1 0 0 0 0 7 42 100 Ireland11 9 4 3 58 1 0 0 0 0 4 36 100 Italy64 50 32 24 44 13 6 0 0 0 7 31 100 Kazakhstan77 63 34 28 43 14 6 0 0 0 7 29 100 Kyrgyzstan23 18 9 8 50 9 0 0 0 0 6 34 100 Latvia
- - - - - - - - - - - - - Liechtenstein19 15 6 5 46 9 1 0 0 0 13 31 100 Lithuania
9 7 3 3 44 0 0 0 0 0 28 28 100 Luxembourg13 10 7 5 60 0 0 0 0 0 0 40 100 Malta
9 7 4 3 50 4 0 0 0 0 7 40 100 Monaco19 16 8 7 65 0 0 0 0 0 0 35 100 Montenegro
9 7 4 4 67 3 0 0 0 0 4 27 100 Netherlands9 7 3 3 55 1 0 0 0 0 2 41 100 Norway
19 15 6 5 56 5 0 0 0 0 4 34 100 Poland16 13 4 3 53 1 0 0 0 0 8 38 100 Portugal39 30 17 15 35 21 0 0 0 0 13 31 100 Republic of Moldova41 33 14 11 49 29 0 0 0 0 6 15 100 Romania31 23 13 10 50 8 1 0 9 0 6 26 100 Russian Federation12 12 2 2 - - - - - - - - - San Marino30 27 8 6 63 4 0 0 0 0 4 29 100 Serbia20 15 9 7 50 8 1 0 0 0 6 35 100 Slovakia12 9 3 3 54 3 3 0 0 0 8 33 100 Slovenia12 10 5 4 53 3 1 0 0 0 5 38 100 Spain
7 6 3 3 52 3 0 0 0 0 2 42 100 Sweden9 7 5 4 67 1 0 0 0 0 5 27 100 Switzerland
122 106 70 56 38 17 9 0 0 0 6 30 100 Tajikistan39 36 11 9 61 5 3 0 0 0 3 29 100 The former Yugoslav
Republic of Macedonia76 68 16 14 54 11 1 0 0 0 4 30 100 Turkey
103 86 57 48 40 16 8 0 0 0 5 31 100 Turkmenistan22 17 11 9 40 12 2 0 1 0 9 36 100 Ukraine10 8 6 5 55 4 0 0 0 0 4 37 100 United Kingdom82 68 55 42 40 15 7 0 0 0 6 32 100 Uzbekistan
41
Country estimates of child mortality and causes of under-five deaths
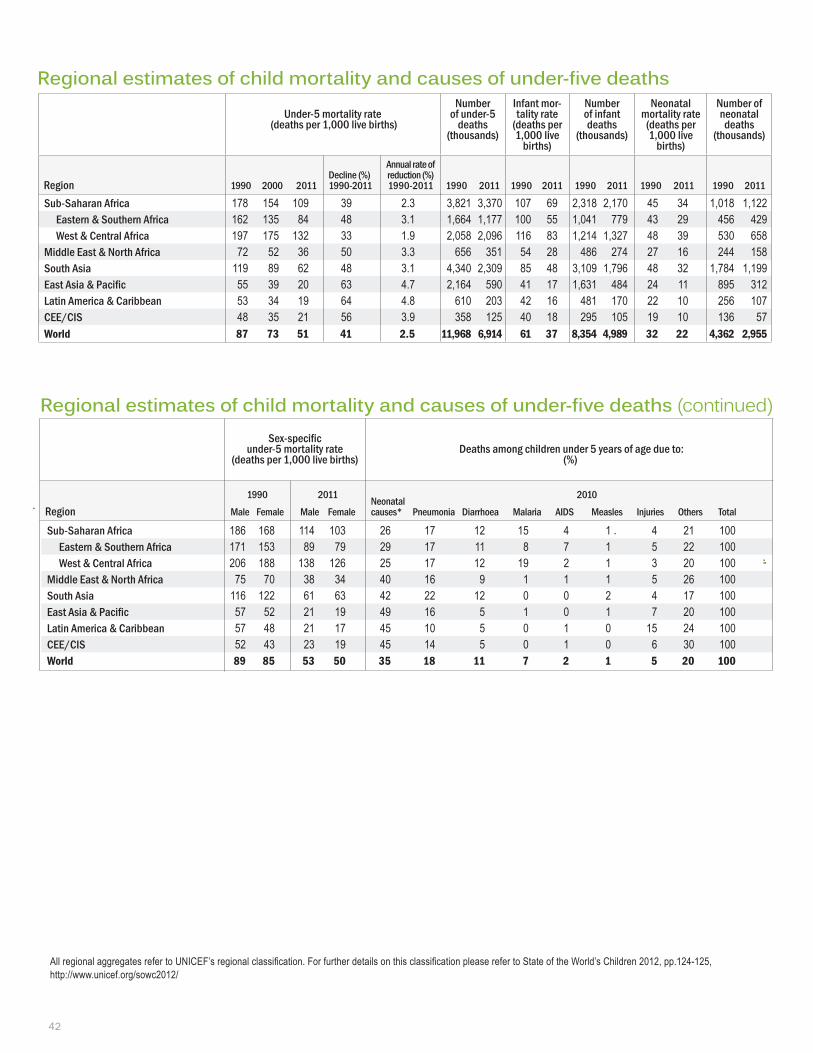
42
AllregionalaggregatesrefertoUNICEF’sregionalclassification.ForfurtherdetailsonthisclassificationpleaserefertoStateoftheWorld’sChildren2012,pp.124-125,http://www.unicef.org/sowc2012/
Regional estimates of child mortality and causes of under-five deaths
Regional estimates of child mortality and causes of under-five deaths (continued)Sex-specific
under-5 mortality rate (deaths per 1,000 live births)
Deaths among children under 5 years of age due to:
(%)
Region1990
Male Female
2011
Male Female
Neonatal 2010 causes* Pneumonia Diarrhoea Malaria AIDS Measles Injuries Others Total
Sub-Saharan Africa 186 168 114 103 26 17 12 15 4 1 4 21 100 Eastern & Southern Africa 171 153 89 79 29 17 11 8 7 1 5 22 100 West & Central Africa 206 188 138 126 25 17 12 19 2 1 3 20 100Middle East & North Africa 75 70 38 34 40 16 9 1 1 1 5 26 100South Asia 116 122 61 63 42 22 12 0 0 2 4 17 100East Asia & Pacific 57 52 21 19 49 16 5 1 0 1 7 20 100Latin America & Caribbean 57 48 21 17 45 10 5 0 1 0 15 24 100CEE/CIS 52 43 23 19 45 14 5 0 1 0 6 30 100World 89 85 53 50 35 18 11 7 2 1 5 20 100
Under-5 mortality rate
(deaths per 1,000 live births)
Number of under-5
deaths (thousands)
Infant mor-tality rate
(deaths per 1,000 live
births)
Number of infant deaths
(thousands)
Neonatal mortality rate
(deaths per 1,000 live
births)
Number of neonatal
deaths (thousands)
Region 1990 2000 2011Decline (%) 1990-2011
Annual rate of reduction (%)1990-2011 1990 2011 1990 2011 1990 2011 1990 2011 1990 2011
Sub-Saharan Africa 178 154 109 39 2.3 3,821 3,370 107 69 2,318 2,170 45 34 1,018 1,122 Eastern & Southern Africa 162 135 84 48 3.1 1,664 1,177 100 55 1,041 779 43 29 456 429 West & Central Africa 197 175 132 33 1.9 2,058 2,096 116 83 1,214 1,327 48 39 530 658Middle East & North Africa 72 52 36 50 3.3 656 351 54 28 486 274 27 16 244 158South Asia 119 89 62 48 3.1 4,340 2,309 85 48 3,109 1,796 48 32 1,784 1,199East Asia & Pacific 55 39 20 63 4.7 2,164 590 41 17 1,631 484 24 11 895 312Latin America & Caribbean 53 34 19 64 4.8 610 203 42 16 481 170 22 10 256 107CEE/CIS 48 35 21 56 3.9 358 125 40 18 295 105 19 10 136 57World 87 73 51 41 2.5 11,968 6,914 61 37 8,354 4,989 32 22 4,362 2,955
©UNICEF/NYHQ2011-1681/Pirozzi
Under-5 mortality rate
(deaths per 1,000 live births)
Number of under-5
deaths (thousands)
Infant mor-tality rate
(deaths per 1,000 live
births)
Number of infant deaths
(thousands)
Neonatal mortality rate
(deaths per 1,000 live
births)
Number of neonatal
deaths (thousands)
Region 1990 2000 2011Decline (%) 1990-2011
Annual rate of reduction (%)1990-2011 1990 2011 1990 2011 1990 2011 1990 2011 1990 2011
Sub-Saharan Africa 178 154 109 39 2.3 3,821 3,370 107 69 2,318 2,170 45 34 1,018 1,122 Eastern & Southern Africa 162 135 84 48 3.1 1,664 1,177 100 55 1,041 779 43 29 456 429 West & Central Africa 197 175 132 33 1.9 2,058 2,096 116 83 1,214 1,327 48 39 530 658Middle East & North Africa 72 52 36 50 3.3 656 351 54 28 486 274 27 16 244 158South Asia 119 89 62 48 3.1 4,340 2,309 85 48 3,109 1,796 48 32 1,784 1,199East Asia & Pacific 55 39 20 63 4.7 2,164 590 41 17 1,631 484 24 11 895 312Latin America & Caribbean 53 34 19 64 4.8 610 203 42 16 481 170 22 10 256 107CEE/CIS 48 35 21 56 3.9 358 125 40 18 295 105 19 10 136 57World 87 73 51 41 2.5 11,968 6,914 61 37 8,354 4,989 32 22 4,362 2,955
Published by UNICEFUnited Nations Children’s Fund3 UN PlazaNew York, NY 10017www.unicef.org
6465597892809
ISBN 978-92-806-4655-9
ISBN: 978-92-806-4655-9
For the online edition,scan this QR code or go towww.apromiserenewed.org
© United Nations Children’s Fund (UNICEF)September 2012