subject industrial facility design. group members h.hammad ali 11-ie-32 s.hammad shah 11-ie-21...
TRANSCRIPT

SUBJECT
Industrial facility design

GROUP MEMBERS
• H.Hammad Ali 11-IE-32• S.Hammad shah 11-IE-21• Hammad Hassan 11-IE-41

Introduction
• Facility Planning: The process of identifying the needs of facility users in order to create a project design that meets those needs.

Facility plan Process
• Facility planning process for manufacturing and assemble the products.
Define the ProductSpecify the required Manufacturing Determine the interrelationshipDetermine the space requirementsGenerate the alternative FPEvaluate the FPImplement the FPMaintain and adapt the FPUpdate the products

Alternative Facility Plan• Facilities can be broadly defined as buildings where people,
material, and machines .... Evaluate alternative facilities plans (alternative locations and alternative).
• Before the alternative facility plan answered the some questions.
What is to be produced?How are the products to be produced?When are the products to be produced?How much each product to be produced?How long the products to be produced?Where are the products to be produced?

Global Sourcing
• A procurement strategy in which a business seeks to find the most cost efficient location for manufacturing a product even if the location is in a foreign country.
• Examples An Automobile Industry An toy Industry Textile Industry

PP&S DesignProduct Design Process Design Schedule Design

Product Design
Both the DeterminationDecision and Upper level management

Dynamic Product EnvironmentIn Which it is not possible to accurately specify the products
to be produced in a given facility.
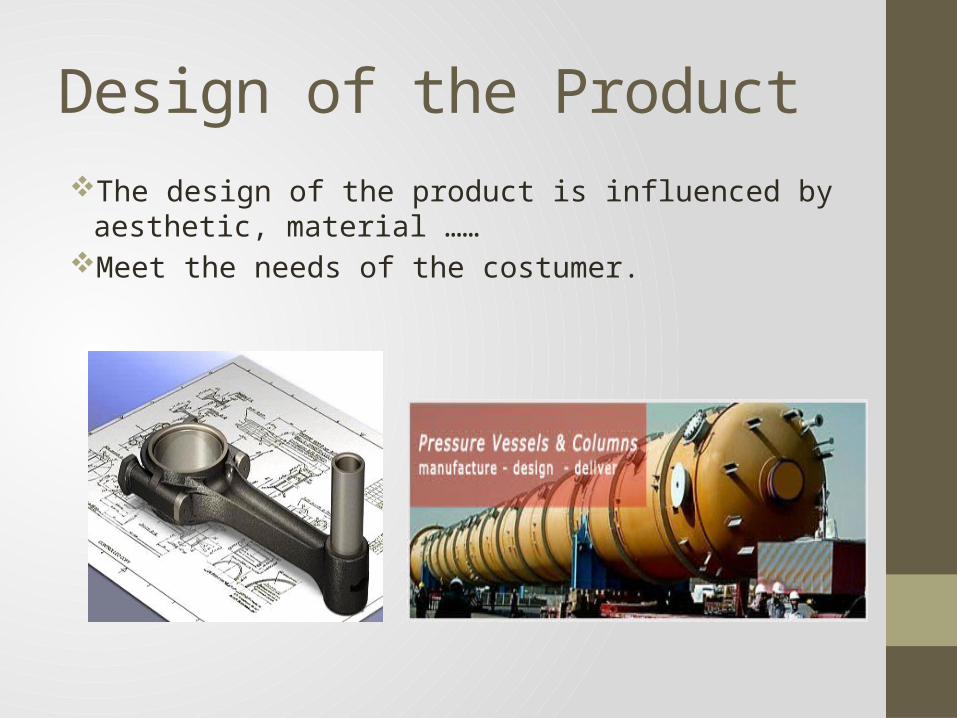
Design of the ProductThe design of the product is influenced by aesthetic, material
……Meet the needs of the costumer.

Quality Function DeploymentOrganized planning approach To identify customer needs To translate needs of product charactaristics,product design
and tolerance requirements.

BenchmarkingWhat the Competition is doing to satisfy the customer needs.Exceeds customer expectations

Exploded Assembly DrawingAn exploded view drawing is a diagram, picture or technical
drawing of an object, that shows the relationship or order of assembly of various parts.
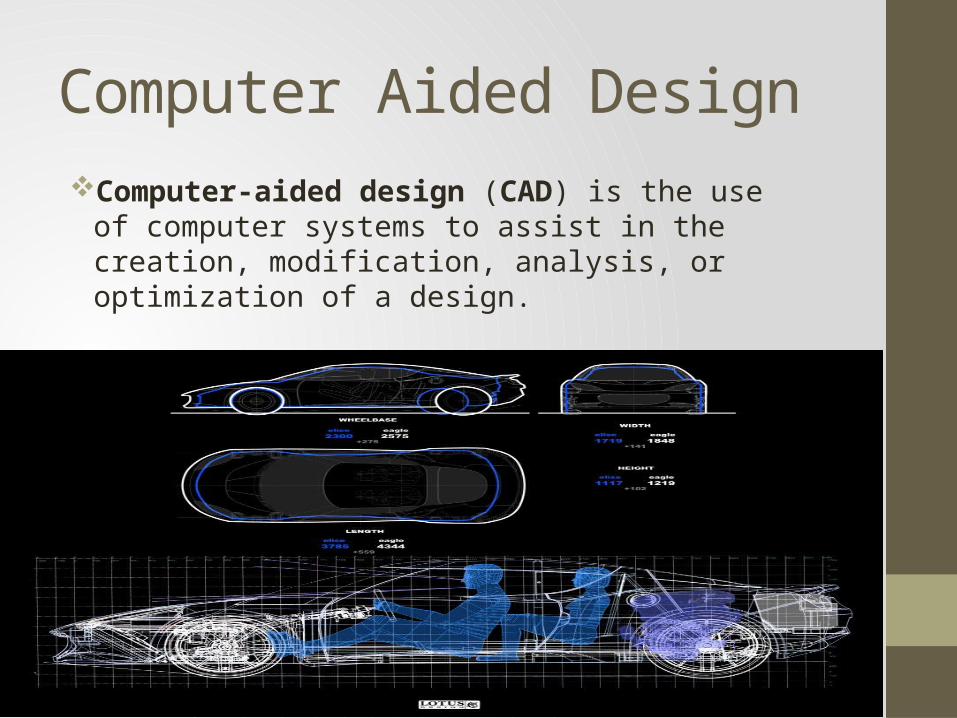
Computer Aided DesignComputer-aided design (CAD) is the use of computer systems
to assist in the creation, modification, analysis, or optimization of a design.

Concurrent Engineering To improve relationship b/w the function of the component or
product and its cost.Concurrent engineering provides a simultaneous
consideration in the design face of cycle factor such as product, function, material, design, manufacturing and quality.

Example #2.1
• Calculating the production requirements for a serial process with three operations
• A product has a market estimate of 97000 Requires three processing steps (drilling, milling, turning ) having defective estimates.
• D1=0.04• D2=0.01• D3=0.03• Find the Inputs?• Using Formula • Ok=Ik-dk

Process design
Process design
How product is produced?
Manufacture or Buy?
Equipment?
Time required?

Steps in process design• Identify required process• Selecting the required process• Sequencing the required process

Identifying required process• Determine the scope of facility. • Downsize large facilities.• Make or buy decision should take input from: - Finance, marketing, industrial engineering, process,
purchasing, HR and others.

• List the items that needs to buy or manufacture on a bill of material.

• While making a bill of materials, in addition to make-or-buy decision, parts list atleast include the following- Part number- Part names- Number of parts per product- Drawing references

Selecting the required process
• Make-or-buy decisions are based on- previous experiences- related requirements- available equipments- production rates

Bill of material for an Air flow regulator

Process Identification:
• It consists of description of what is to be accomplished, what is to be manufactured, part drawings describing each component, quantities to be produced.
Computer aided process planning:• Can be used to automate the manual process planning.

Types of CAPP:
Variant
• Standard process plans for each part and stored within computer. It is less expensive and easy.
Generative
• Process plans are generated automatically for new components without requiring existing plans.

Steps in process selection:
• Define elemental operations• Identify alternative processes for each operation• Analyze alternative processes• Standardize process• Evaluate alternative process• Select process

Sequencing the required process
Assembly chart:• Document the method of assembling the product.
• The easiest method to construct is to begin with completed product and to trace disassembly back to its basic components.
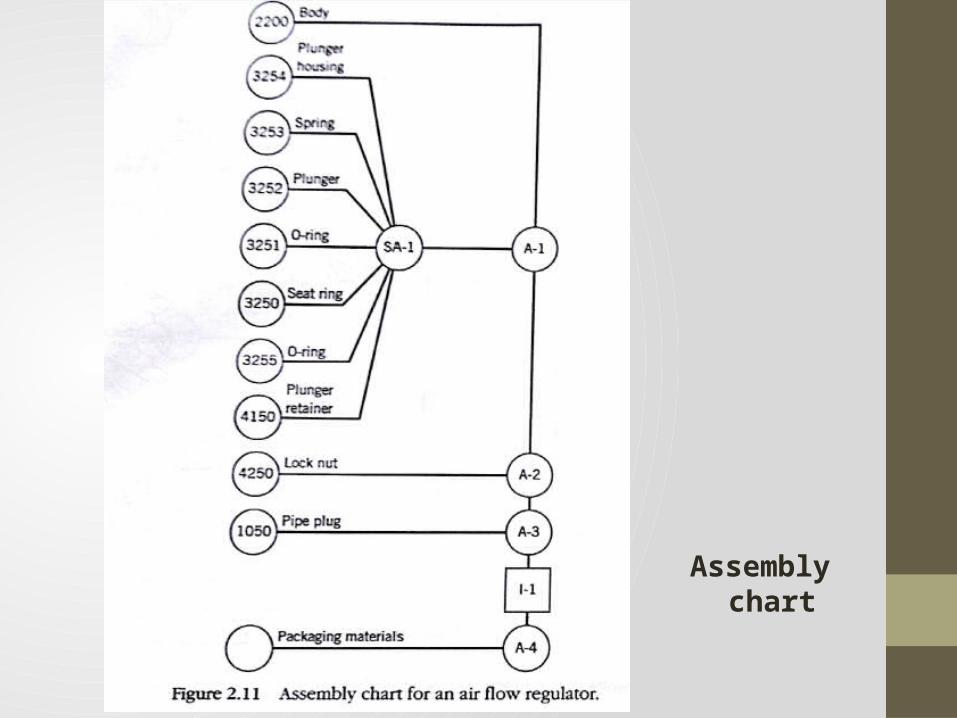
Assembly chart

Operations Chart
• To construct, begin with the upper right side of chart with components as first assembly operations.
• It can be complemented with transportation, storages and delays.
• It gives an overview of the flow within the facility.


Precedence diagram
• Operation chart as a special case of more general graphical model is called precedence diagram.
• It establishes the precedence relationships that must be maintained in manufacturing and assembling a product.

Group technology
• GT refers to grouping part into families, and then making design decisions.
• It is based on part shapes, sizes, material type and characteristics.

Schedule design
How long production
will continue?
When to produce
?
How much to
produce?

• Schedule design decision impacts on- machine selection- number of machines- number of employees- space requirements- storage equipment- material handling equipment etc

Marketing information• It determines how long the production will continue.• It is the information regarding the dynamic value of a
demand of product.

Pareto analysis• Pareto, observed that 85% wealth of the world is held by 15%
of the people.
• It is depicted in volume-variety chart.

• It suggests that facility plan should consist of mass production for the 15% of high volume items.

Process Requirements
Specifications of Process requirements typically occurs in three phases,• 1st Phase : Determines quantity that must be produced• 2nd Phase : Machine requirement• 3rd phase : combines the operation requirements to
overall machine requirements

Calculations of Production Requirements• Let dk represents the percentage of defects produced in kth
operation• Ok Desired output without defects• Ik production Input
Ok = Ik – DefectivesDefective Parts = Ik × dk
Ok = Ik – dkIk = Ik(1-dk)


Facilities Design
• Once the product, process & schedule design decisions have been made the facility planner needs to organize the information and generate and evaluate layout, handling, storage and unit load design alternatives.

7 management & planning tools are used in facility planning
1. Affinity Diagram2. Interrelationship Digraph3. Tree Diagram4. Matrix Diagram5. Contingency diagram6. Activity Network Diagram7. Prioritization Matrix

1. Affinity Diagram
• Gather verbal data & organize it in groups

Affinity Diagram

2. Interrelationship Digraph• Interrelationship digraph is used to map the logical links
among related items,• And try to identify which item impact other the most.

Interrelation Digraph
Form Product Families
Assign Families to manufacturing Cell
Keep receiving & shipping close to
Production
Assign Raw material to their
point of use

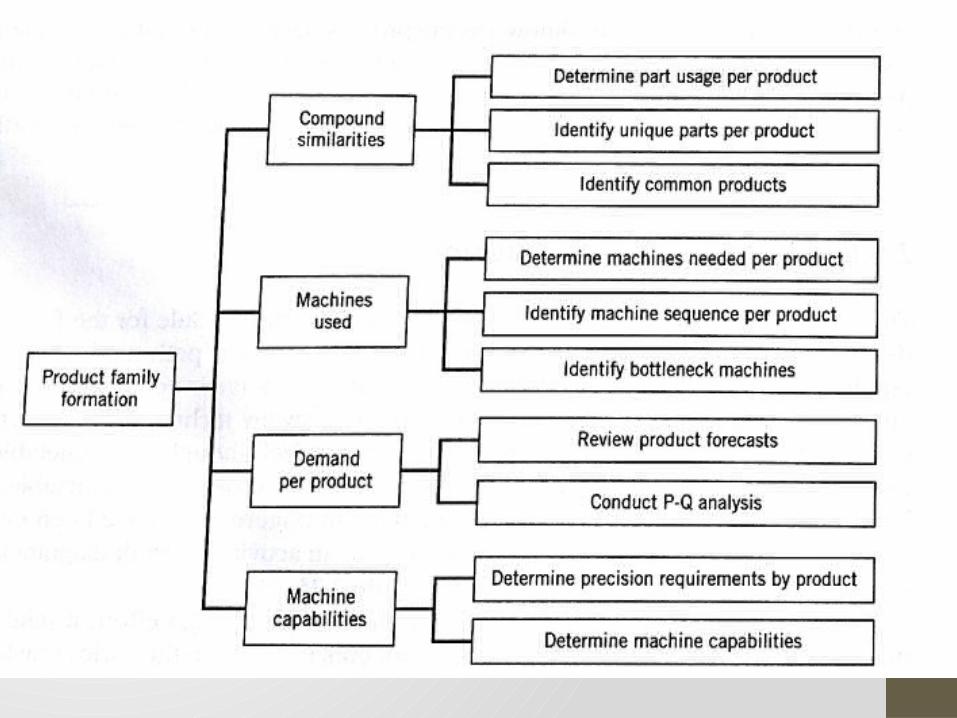
3. Tree Diagram
• The tree diagram is used to map the increasing detail the action that need to be accomplished in order to achieve the objective.

4. Matrix Diagram• It organizes information such as characteristics, functions and
tasks into set of items to be compared.• This tool provides visibility to key contacts to specific issues
and help to identify individuals who are assigned to too many teams.

Matrix DiagramTeam / Participants
Joe Mary Jerry Anna Linda Daisy Jack
Part Usage Team P C P L P
Machine use team L C P
Demand Forecast Team
P C L
L=Team LeaderC=Team CoordinatorP=Team Participant

Contingency Diagram• Also Known as process decision program chart.• It maps conceivable events & contingencies that might occur
during Implementation.• It’s useful when project consists of Unfamiliar tasks.

Conti
ngen
cy D
iagr
am

6. Activity Network Diagram• Used to develop a work schedule for the facilities design.• CPM (Critical Path Method)• Gantt Chart • PERT (Program evaluation & Review Technique)


Prioritization Matrix
In Facility Design it is important to consider:• Layout characteristics• Material Handling Requirements• Unit load Implied• Storage strategies• Over all Building Impact
