sub-ppb no detection by a cavity enhanced absorption · pdf filesub-ppb nox detection by a...
TRANSCRIPT
Sub-ppb NOx detection by a cavity enhanced absorption spectroscopy system with blue and infrared diode lasers
Z. Bielecki1, M. Leszczynski2, K. Holz2, L. Marona2, J. Mikolajczyk1, M. Nowakowski1, P. Perlin2, B. Rutecka1, T. Stacewicz3 & J. Wojtas1 1Military University of Technology, Poland 2Institute High Pressure Physics Unipress, Poland 3Warsaw University, Poland
Abstract
This paper presents opportunities of application of cavity enhanced absorption spectroscopy (CEAS) in nitrogen oxide (NOx) detection. The CEAS technique is based on the off-axis arrangement of an optical cavity. In this system, an absorbing gas concentration is determined by measurement of the decay time of a light pulse trapped in an optical cavity. Measurements are not sensitive to laser power fluctuation or photodetector sensitivity fluctuation. In this configuration, the setup includes the resonance optical cavity, build with spherical mirrors of high reflectance. Pulsed lasers are used as the light sources. NOx detection is carried out in the blue and far infrared range. The signal is registered with a newly developed low noise photoreceiver. The features of the designed system show that it is possible to build a portable trace gases sensor. Its sensitivity could be comparable with that of chemical detectors. Such a system has several advantages: relatively low price, small size and weight, low power consumption, and the possibility of the detection of other gases. Keywords: CEAS, NOx sensor.
1 Introduction
Cavity ringdown spectroscopy (CRDS) is a high-sensitivity absorption-measurement technique [1–4]. It is based on measurement of the changes in the
Computational Methods and Experimental Measurements XIV 203
© 2009 WIT PressWIT Transactions on Modelling and Simulation, Vol 48, www.witpress.com, ISSN 1743-355X (on-line) doi:10.2495/CMEM090191
relaxation time of a high-finesse optical cavity. The changes depend on the absorbance of the species filling the cavity. In CRDS, intensity measurements are replaced with time measurements, and hence this method is not sensitive to laser intensity fluctuation. This technique is based on the phenomenon of light trapping inside an optical cavity composed of two mirrors characterized by the high reflectivity coefficient (R > 0,99995%). In this method, a pulse of the laser light is injected into an optical cavity (resonator) equipped with spherical and high reflectance mirrors (Figure 1). The pulse yields to multiple reflections in the resonator. After each reflection, a part of the laser light leaves a resonator because of lack of 100% mirrors reflectivity. The part of light leaving the cavity is registered with a photoreceiver. The amplitude of the optical signal decreases exponentially.
Figure 1: Idea of the CRDS technique.
The speed of the decay intensity of the pulse of the laser light is dependent on the mirrors reflectivity coefficient R, the resonator length L, and extinction, which consists of absorption and scattering of light in the absorber filling the cavity. Therefore, by measuring the resonator quality, determination of the extinction coefficient is possible [2]. The resonator quality can be determined with measurement of the radiation decay time constant τ
αL]+R)c[(
L=τ
1, (1)
where c is the light speed [3]. The decay time τ is measured once when the cavity is empty ( = 0), and then when the cavity is filled with the absorber ( > 0). By comparison of the decay times for these two cases, and assuming that the absorption dominates, value of the absorber concentration N can be found
0
111
ττcσ=N , (2)
where σ is the absorption cross section, τ0, τ are the time constants of the exponential decay of the output signal for the empty resonator and for the resonator filled with the absorber, respectively [4]. Assuming that the relative precision of τ determination is
0
0
τ
ττ=X
, (3)
204 Computational Methods and Experimental Measurements XIV
© 2009 WIT PressWIT Transactions on Modelling and Simulation, Vol 48, www.witpress.com, ISSN 1743-355X (on-line)
the detectable concentration limit NL is given by
0L cσσ
X=N . (4)
High sensitivity of the absorption measurement is achieved due to increasing the effective optical path length up to several kilometers in a very small volume of the optical cavity. Pulsed or AM-modulated cw lasers are used. However, in order to avoid multimode excitation of the cavity (and multiexponential changes of registered light) CRDS setup requires spatial mode filtering and matching of the laser light with the resonator. In order to much the laser wavelength to the mirror reflectivity spectrum and to avoid broadband pulses of fluorescence from the laser a spectral filtering must be applied. This demand causes some disadvantages. The optical system becomes complicated and requires rigorous vibration isolation as well as temperature stability to operate with high sensitivity. These limitations pose engineering challenges for field deployment. Subsequently, several modifications of CRDS have been developed [5–7]. One of them is cavity enhanced absorption spectroscopy (CEAS). It is based on off-axis arrangement of the laser and optical cavity. The light is repeatedly reflected by the mirrors, like in CRDS technique, but the light spots on mirror surfaces are spatially separated. It fills the whole volume of the cavity. Avoiding the spots overlapping eliminates the light interference and allows one to eliminate the sharp resonances of the cavity. Consequently the smooth and broad absorption spectrum might be observed. In practical implementation, the off-axis design in CEAS technique additionally eliminates optical feedback from the cavity to the laser, reduces the sensitivity to vibration. It is especially important when in the CEAS setup the diode lasers are used. However, some instabilities in the light source intensity may decrease the signal-to-noise ratio. In this work we report of an off-axis CEAS-based sensors applied to NO2, NO and N2O measurement. Such sensors are ideal for field measurements because of its advantages. Furthermore, simplicity of CEAS setup causes the costs reduction.
2 Analysis of NOx absorption
The described method is based on measurements of absorption changes of optical radiation. The changes are caused by existence of trace amount of the detected substances in the air. For this reason, both the familiarity with characteristic absorption spectrum of the substances and proper selection of diagnostic radiation source are very important. The research and experimental works were focused on detection of nitrogen dioxide so far. Note that the maximum of the absorption spectrum of nitrogen dioxide is in the range of 400–450 nm. There are no absorption interferences from other gases or other vapors normally existing in the air in the mentioned spectral range. For this reason, it could be assumed that the intensity changes of registered radiation
Computational Methods and Experimental Measurements XIV 205
© 2009 WIT PressWIT Transactions on Modelling and Simulation, Vol 48, www.witpress.com, ISSN 1743-355X (on-line)
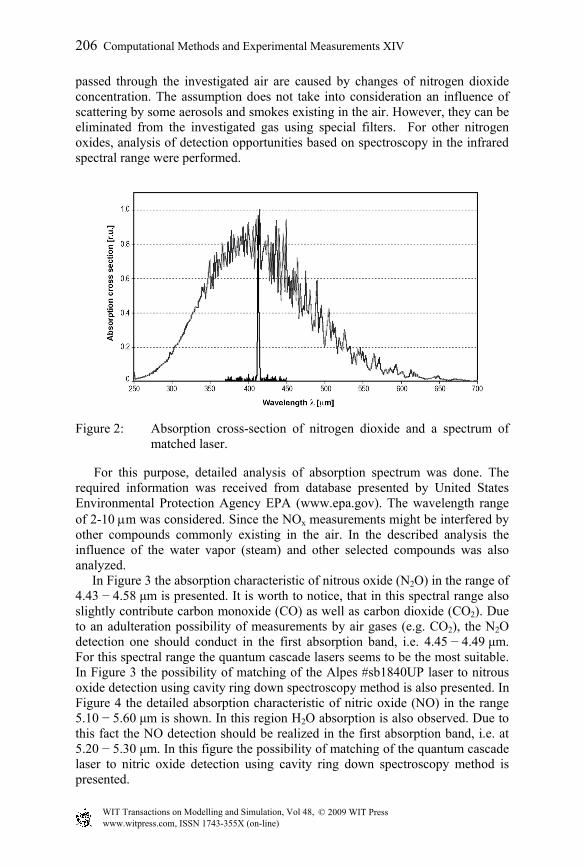
passed through the investigated air are caused by changes of nitrogen dioxide concentration. The assumption does not take into consideration an influence of scattering by some aerosols and smokes existing in the air. However, they can be eliminated from the investigated gas using special filters. For other nitrogen oxides, analysis of detection opportunities based on spectroscopy in the infrared spectral range were performed.
Figure 2: Absorption cross-section of nitrogen dioxide and a spectrum of matched laser.
For this purpose, detailed analysis of absorption spectrum was done. The required information was received from database presented by United States Environmental Protection Agency EPA (www.epa.gov). The wavelength range of 2-10 m was considered. Since the NOx measurements might be interfered by other compounds commonly existing in the air. In the described analysis the influence of the water vapor (steam) and other selected compounds was also analyzed. In Figure 3 the absorption characteristic of nitrous oxide (N2O) in the range of 4.43 − 4.58 μm is presented. It is worth to notice, that in this spectral range also slightly contribute carbon monoxide (CO) as well as carbon dioxide (CO2). Due to an adulteration possibility of measurements by air gases (e.g. CO2), the N2O detection one should conduct in the first absorption band, i.e. 4.45 − 4.49 μm. For this spectral range the quantum cascade lasers seems to be the most suitable. In Figure 3 the possibility of matching of the Alpes #sb1840UP laser to nitrous oxide detection using cavity ring down spectroscopy method is also presented. In Figure 4 the detailed absorption characteristic of nitric oxide (NO) in the range 5.10 − 5.60 μm is shown. In this region H2O absorption is also observed. Due to this fact the NO detection should be realized in the first absorption band, i.e. at 5.20 − 5.30 μm. In this figure the possibility of matching of the quantum cascade laser to nitric oxide detection using cavity ring down spectroscopy method is presented.
206 Computational Methods and Experimental Measurements XIV
© 2009 WIT PressWIT Transactions on Modelling and Simulation, Vol 48, www.witpress.com, ISSN 1743-355X (on-line)
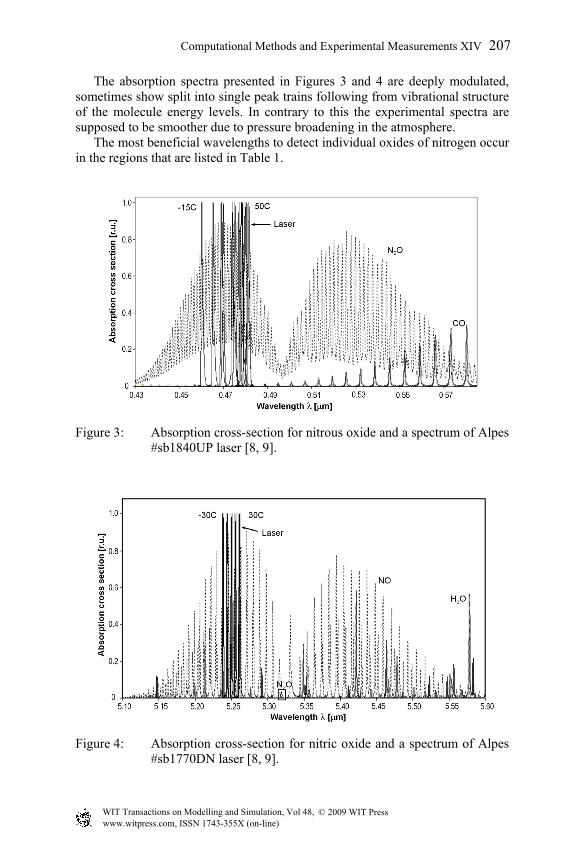
The absorption spectra presented in Figures 3 and 4 are deeply modulated, sometimes show split into single peak trains following from vibrational structure of the molecule energy levels. In contrary to this the experimental spectra are supposed to be smoother due to pressure broadening in the atmosphere. The most beneficial wavelengths to detect individual oxides of nitrogen occur in the regions that are listed in Table 1.
Figure 3: Absorption cross-section for nitrous oxide and a spectrum of Alpes #sb1840UP laser [8, 9].
Figure 4: Absorption cross-section for nitric oxide and a spectrum of Alpes #sb1770DN laser [8, 9].
Computational Methods and Experimental Measurements XIV 207
© 2009 WIT PressWIT Transactions on Modelling and Simulation, Vol 48, www.witpress.com, ISSN 1743-355X (on-line)
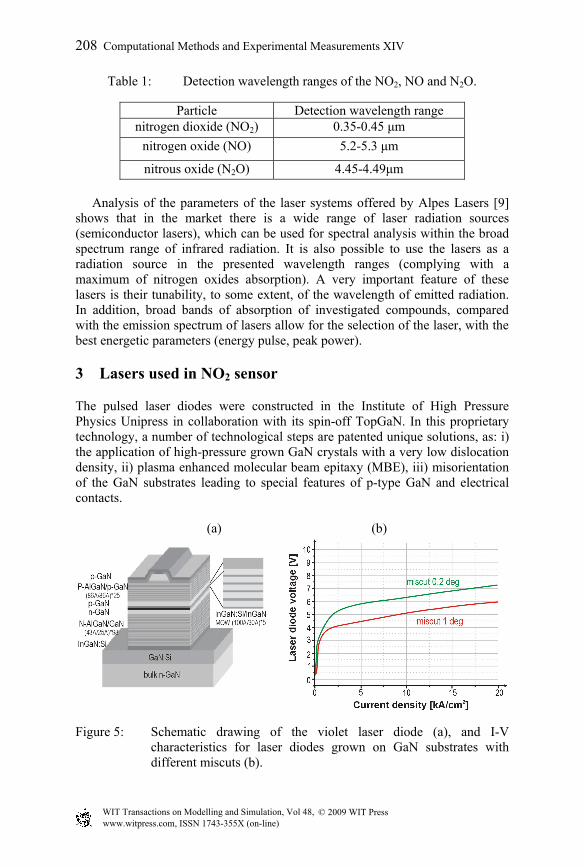
Table 1: Detection wavelength ranges of the NO2, NO and N2O.
Particle Detection wavelength range nitrogen dioxide (NO2) 0.35-0.45 μm
nitrogen oxide (NO) 5.2-5.3 μm
nitrous oxide (N2O) 4.45-4.49μm
Analysis of the parameters of the laser systems offered by Alpes Lasers [9] shows that in the market there is a wide range of laser radiation sources (semiconductor lasers), which can be used for spectral analysis within the broad spectrum range of infrared radiation. It is also possible to use the lasers as a radiation source in the presented wavelength ranges (complying with a maximum of nitrogen oxides absorption). A very important feature of these lasers is their tunability, to some extent, of the wavelength of emitted radiation. In addition, broad bands of absorption of investigated compounds, compared with the emission spectrum of lasers allow for the selection of the laser, with the best energetic parameters (energy pulse, peak power).
3 Lasers used in NO2 sensor
The pulsed laser diodes were constructed in the Institute of High Pressure Physics Unipress in collaboration with its spin-off TopGaN. In this proprietary technology, a number of technological steps are patented unique solutions, as: i) the application of high-pressure grown GaN crystals with a very low dislocation density, ii) plasma enhanced molecular beam epitaxy (MBE), iii) misorientation of the GaN substrates leading to special features of p-type GaN and electrical contacts.
(a) (b)
Figure 5: Schematic drawing of the violet laser diode (a), and I-V characteristics for laser diodes grown on GaN substrates with different miscuts (b).
208 Computational Methods and Experimental Measurements XIV
© 2009 WIT PressWIT Transactions on Modelling and Simulation, Vol 48, www.witpress.com, ISSN 1743-355X (on-line)
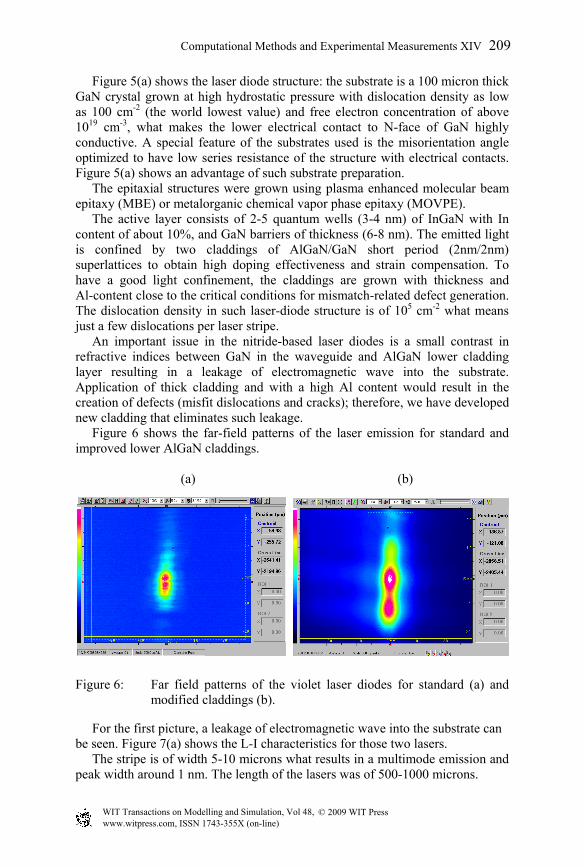
Figure 5(a) shows the laser diode structure: the substrate is a 100 micron thick GaN crystal grown at high hydrostatic pressure with dislocation density as low as 100 cm-2 (the world lowest value) and free electron concentration of above 1019 cm-3, what makes the lower electrical contact to N-face of GaN highly conductive. A special feature of the substrates used is the misorientation angle optimized to have low series resistance of the structure with electrical contacts. Figure 5(a) shows an advantage of such substrate preparation. The epitaxial structures were grown using plasma enhanced molecular beam epitaxy (MBE) or metalorganic chemical vapor phase epitaxy (MOVPE). The active layer consists of 2-5 quantum wells (3-4 nm) of InGaN with In content of about 10%, and GaN barriers of thickness (6-8 nm). The emitted light is confined by two claddings of AlGaN/GaN short period (2nm/2nm) superlattices to obtain high doping effectiveness and strain compensation. To have a good light confinement, the claddings are grown with thickness and Al-content close to the critical conditions for mismatch-related defect generation. The dislocation density in such laser-diode structure is of 105 cm-2 what means just a few dislocations per laser stripe. An important issue in the nitride-based laser diodes is a small contrast in refractive indices between GaN in the waveguide and AlGaN lower cladding layer resulting in a leakage of electromagnetic wave into the substrate. Application of thick cladding and with a high Al content would result in the creation of defects (misfit dislocations and cracks); therefore, we have developed new cladding that eliminates such leakage. Figure 6 shows the far-field patterns of the laser emission for standard and improved lower AlGaN claddings.
(a) (b)
Figure 6: Far field patterns of the violet laser diodes for standard (a) and modified claddings (b).
For the first picture, a leakage of electromagnetic wave into the substrate can be seen. Figure 7(a) shows the L-I characteristics for those two lasers. The stripe is of width 5-10 microns what results in a multimode emission and peak width around 1 nm. The length of the lasers was of 500-1000 microns.
Computational Methods and Experimental Measurements XIV 209
© 2009 WIT PressWIT Transactions on Modelling and Simulation, Vol 48, www.witpress.com, ISSN 1743-355X (on-line)
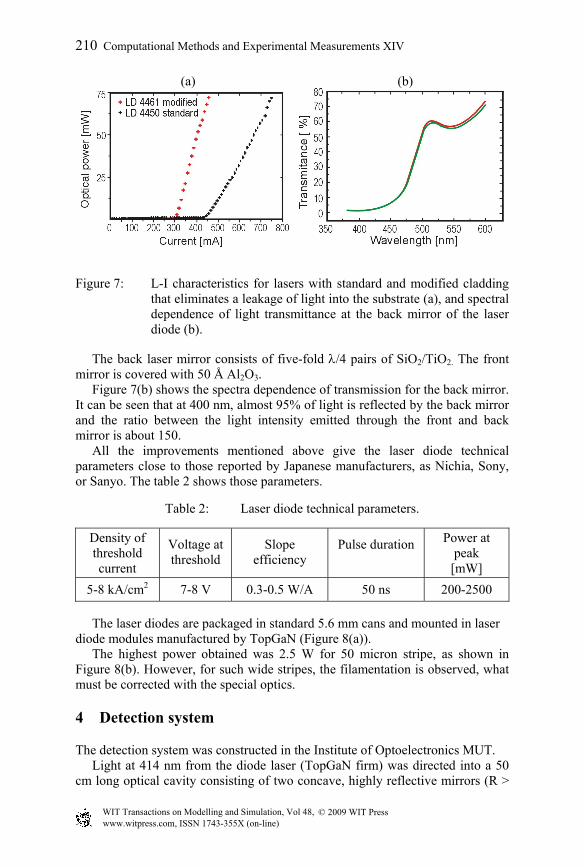
(a) (b)
Figure 7: L-I characteristics for lasers with standard and modified cladding that eliminates a leakage of light into the substrate (a), and spectral dependence of light transmittance at the back mirror of the laser diode (b).
The back laser mirror consists of five-fold /4 pairs of SiO2/TiO2. The front mirror is covered with 50 Å Al2O3. Figure 7(b) shows the spectra dependence of transmission for the back mirror. It can be seen that at 400 nm, almost 95% of light is reflected by the back mirror and the ratio between the light intensity emitted through the front and back mirror is about 150. All the improvements mentioned above give the laser diode technical parameters close to those reported by Japanese manufacturers, as Nichia, Sony, or Sanyo. The table 2 shows those parameters.
Table 2: Laser diode technical parameters.
Density of threshold current
Voltage at threshold
Slope efficiency
Pulse duration Power at peak
[mW]
5-8 kA/cm2 7-8 V 0.3-0.5 W/A 50 ns 200-2500
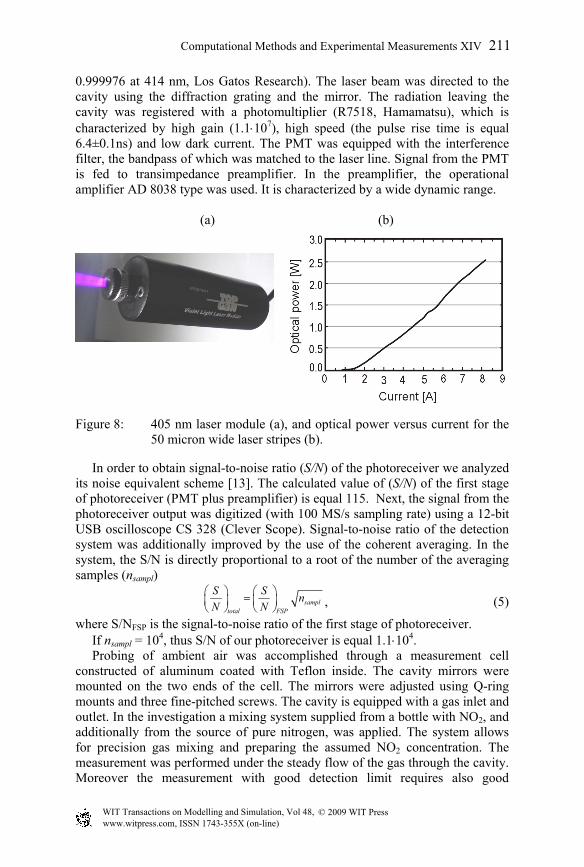
The laser diodes are packaged in standard 5.6 mm cans and mounted in laser diode modules manufactured by TopGaN (Figure 8(a)). The highest power obtained was 2.5 W for 50 micron stripe, as shown in Figure 8(b). However, for such wide stripes, the filamentation is observed, what must be corrected with the special optics.
4 Detection system
The detection system was constructed in the Institute of Optoelectronics MUT. Light at 414 nm from the diode laser (TopGaN firm) was directed into a 50 cm long optical cavity consisting of two concave, highly reflective mirrors (R >
210 Computational Methods and Experimental Measurements XIV
© 2009 WIT PressWIT Transactions on Modelling and Simulation, Vol 48, www.witpress.com, ISSN 1743-355X (on-line)
0.999976 at 414 nm, Los Gatos Research). The laser beam was directed to the cavity using the diffraction grating and the mirror. The radiation leaving the cavity was registered with a photomultiplier (R7518, Hamamatsu), which is characterized by high gain (1.1107), high speed (the pulse rise time is equal 6.4±0.1ns) and low dark current. The PMT was equipped with the interference filter, the bandpass of which was matched to the laser line. Signal from the PMT is fed to transimpedance preamplifier. In the preamplifier, the operational amplifier AD 8038 type was used. It is characterized by a wide dynamic range.
(a) (b)
Figure 8: 405 nm laser module (a), and optical power versus current for the 50 micron wide laser stripes (b).
In order to obtain signal-to-noise ratio (S/N) of the photoreceiver we analyzed its noise equivalent scheme [13]. The calculated value of (S/N) of the first stage of photoreceiver (PMT plus preamplifier) is equal 115. Next, the signal from the photoreceiver output was digitized (with 100 MS/s sampling rate) using a 12-bit USB oscilloscope CS 328 (Clever Scope). Signal-to-noise ratio of the detection system was additionally improved by the use of the coherent averaging. In the system, the S/N is directly proportional to a root of the number of the averaging samples (nsampl)
sampltotal FSP
S Sn
N N , (5)
where S/NFSP is the signal-to-noise ratio of the first stage of photoreceiver. If nsampl = 104, thus S/N of our photoreceiver is equal 1.1104. Probing of ambient air was accomplished through a measurement cell constructed of aluminum coated with Teflon inside. The cavity mirrors were mounted on the two ends of the cell. The mirrors were adjusted using Q-ring mounts and three fine-pitched screws. The cavity is equipped with a gas inlet and outlet. In the investigation a mixing system supplied from a bottle with NO2, and additionally from the source of pure nitrogen, was applied. The system allows for precision gas mixing and preparing the assumed NO2 concentration. The measurement was performed under the steady flow of the gas through the cavity. Moreover the measurement with good detection limit requires also good
Computational Methods and Experimental Measurements XIV 211
© 2009 WIT PressWIT Transactions on Modelling and Simulation, Vol 48, www.witpress.com, ISSN 1743-355X (on-line)
filtration of the investigated air. This is necessary in order to avoid the light scattering in the aerosol particles as well as the dust deposition on the mirrors surfaces.
5 Experimental results
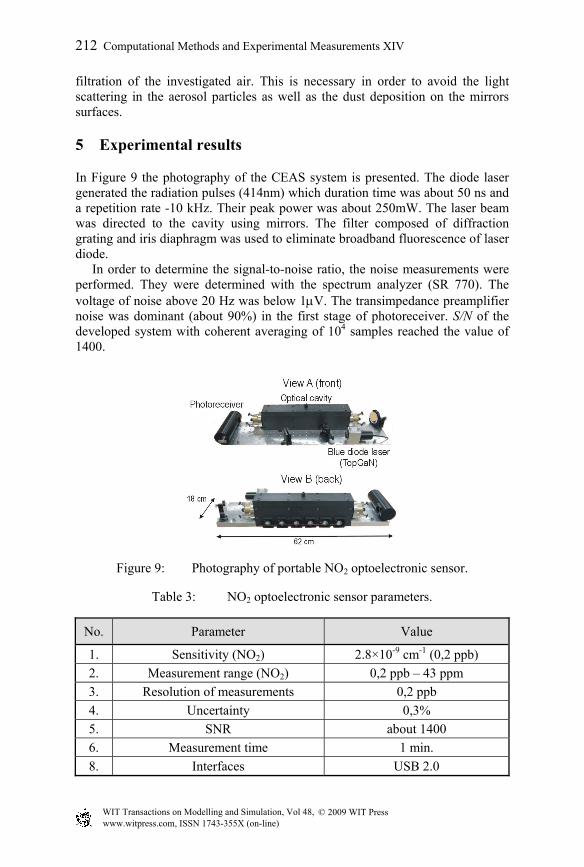
In Figure 9 the photography of the CEAS system is presented. The diode laser generated the radiation pulses (414nm) which duration time was about 50 ns and a repetition rate -10 kHz. Their peak power was about 250mW. The laser beam was directed to the cavity using mirrors. The filter composed of diffraction grating and iris diaphragm was used to eliminate broadband fluorescence of laser diode. In order to determine the signal-to-noise ratio, the noise measurements were performed. They were determined with the spectrum analyzer (SR 770). The voltage of noise above 20 Hz was below 1V. The transimpedance preamplifier noise was dominant (about 90%) in the first stage of photoreceiver. S/N of the developed system with coherent averaging of 104 samples reached the value of 1400.
Figure 9: Photography of portable NO2 optoelectronic sensor.
Table 3: NO2 optoelectronic sensor parameters.
No. Parameter Value
1. Sensitivity (NO2) 2.8×10⁻⁹ cm-1 (0,2 ppb)
2. Measurement range (NO2) 0,2 ppb – 43 ppm
3. Resolution of measurements 0,2 ppb
4. Uncertainty 0,3%
5. SNR about 1400
6. Measurement time 1 min.
8. Interfaces USB 2.0
212 Computational Methods and Experimental Measurements XIV
© 2009 WIT PressWIT Transactions on Modelling and Simulation, Vol 48, www.witpress.com, ISSN 1743-355X (on-line)
The software controlling the data acquisition was developed using LabVIEW 7.1. The software provides possibility of the signal decay time and concentration of the NO2 was determination. The main sensor parameters are presented in the Table 3. Thanks to the first stage of the photoreceiver optimization and coherent averaging of the measured signal, the detection limit achieves the value of 2.810-9cm-1. Therefore measurements of 0.2 ppb NO2 concentration with uncertainty of 0.3% are available. Detailed analyses are given in our earlier works [10-14].
6 Future work
Sensors based on optical-absorption spectroscopy determine the presence of chemical vapors by comparing light-absorption spectra from multiple air samples. The spectra can be measured remotely with lidar or passive spectrometers, or in air samples drawn into optical cavities or other chambers. The spectra of analytes and interferentes are fit to the measured spectrum of each air sample to determine the best fitting concentration combination. A sample is determined to contain a given analyte when the fit yields a concentration that is statistically greater than ambient. The sensitivity and selectivity of a sensor are therefore determined by the ability to separate spectral differences due to the analyte concentration from spectral differences due to instrument noise or fluctuation in ambient conditions. Choosing analyte spectral features with the best combination of absorption strength and spectral uniqueness is therefore key to sensor performance. Progress of CEAS sensors construction is strictly dependent on new radiation sources investigations and optical systems and photoreceivers. Elaboration of new quantum cascade lasers and hetero-system detectors provide possibility of the new generation CEAS sensors developing.
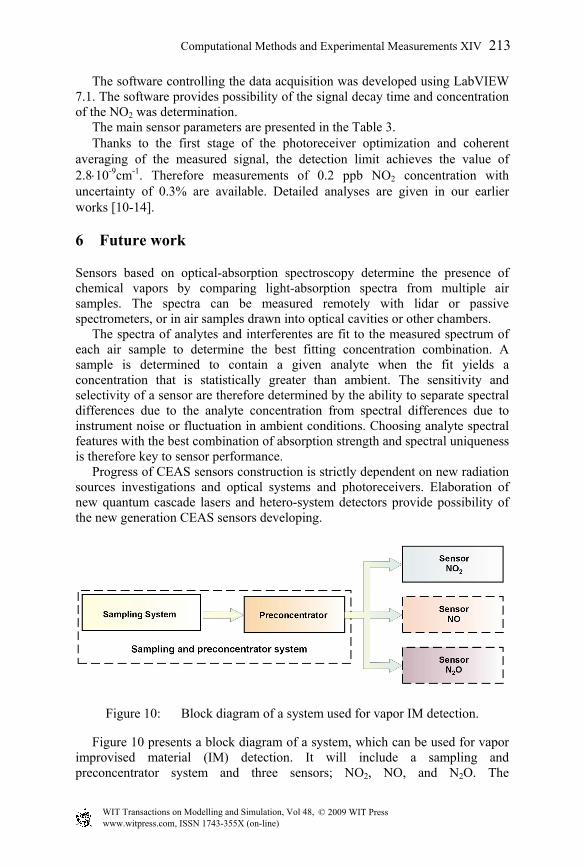
Figure 10: Block diagram of a system used for vapor IM detection.
Figure 10 presents a block diagram of a system, which can be used for vapor improvised material (IM) detection. It will include a sampling and preconcentrator system and three sensors; NO2, NO, and N2O. The
Computational Methods and Experimental Measurements XIV 213
© 2009 WIT PressWIT Transactions on Modelling and Simulation, Vol 48, www.witpress.com, ISSN 1743-355X (on-line)
preconcentrator will adsorb of an explosive molecules from an inlet supply of air flowing at a high rate and relatively large volume. Then the adsorbing medium will be heated quickly to desorb the explosive material on NO2, NO and N2O, which will be directed into sensors. The NO2 sensor was analyzed earlier. In the NO and N2O sensors we would like to use quantum cascade lasers Alpes Lasers firm, and detection system with a polish detector, Vigo System S.A. [15]. An active element of a detector is a multilayer Hg1-xCdxTe heterostructure, optimized for radiation detection at the wavelength of about 5 µm. The element of a photodetector is mounted at three-stage thermoelectric cooler situated in a hermetic housing. This cooler ensures receiving the work in temperature of a detector, of about 200 K at the ambient temperature of 20oC.
7 Conclusions
In the paper, a portable NOx optoelectronic sensor was described. In the sensor CEAS technique was applied. It is one of the most sensitive laser spectroscopy methods. Thanks to the theoretical analysis, the main parameters of the optical cavity, the signal processing system, and in particular the signal-to-noise ratio, the signal processing system was developed. This system ensures registration of low level signals, and the decay time measurements with the uncertainty below 0.3%. The system consists of PMT, low noise transimpedance preamplifier, and 12-bit digital signal processing circuit. Moreover coherent averaging technique was applied. The features of the designed sensor show that it is possible to build a portable NOx sensor with the sensitivity of subppb. Such a kind of system has several advantages such as: relatively low price, small size and weight, and possibility of detection of other gases.
References
[1] OKeefe A., D.A. Deacon, “Cavity ringdown optical spectrometer for absorption measurements using pulsed laser sources”, Rev. Sci. Instrum., Vol. 59, No. 12, 2544-2551, 1988.
[2] Engeln R., G. Berden, R. Peeters, G. Meier, “Cavity enhanced absorption and cavity enhanced magnetic rotation spectroscopy”, Review Of Scientific Instruments, Vol. 69, No. 11, 3763 – 3769, 1998.
[3] Kasyutich V.L., C.E. Canosa-Mas, C. Pfrang, S. Vaughan, R.P. Wayne, “Off-axis continuous – wave cavity-enhanced absorption spectroscopy of narrow-band and broadband absorbers using red diode lasers”, Appl. Phys. B, Vol. 75, 755-761, 2002.
[4] Merienne M.F., A Jenouvrier, B. Coquart, “The NO2 absorption spectrum. I: absorption cross-sections at ambient temperature in the 300-500 nm region”, J. Atmos. Chem., Vol. 20, No. 3, 281-297, 1995.
[5] Andriew C., Papino R., Ultrasensitive surface spectroscopy with a miniature optical resonator. Phys. Rev. Letters, Vol. 83, No 15, 1999.
[6] Andriew C., Papino R., Evanescent wave cavity ring-down spectroscopy for ultra-sensitive chemical detection, SPIE, Vol. 3535, 1998.
214 Computational Methods and Experimental Measurements XIV
© 2009 WIT PressWIT Transactions on Modelling and Simulation, Vol 48, www.witpress.com, ISSN 1743-355X (on-line)
[7] Nicola J. van Leeuwen, J. C. Diettrich, and A.C. Wilson. Periodically Locked Continuous-Wave cavity ring-down spectroscopy, Appl. Opt. Vol. 42, pp.3670-3677, 2003.
[8] http://www.epa.gov/ttn/emc/ftir/aedcdat1.html [9] http://www.alpeslasers.ch/lasers-on-stock/index.html [10] J. Wojtas, A. Czyżewski, T. Stacewicz, Z. Bielecki. Sensitive detection of
NO2 with cavity enhanced spectroscopy. Optica Applicata, vol. 36, No 4, pp. 461-467 (2006),
[11] Czyżewski, J. Wojtas, T. Stacewicz, Z. Bielecki, M. Nowakowski. Study of optoelectronic NO2 detector using cavity enhanced spectroscopy. Proc. SPIE. Optics and Optoelectronics. Optical sensor. 6585-68 (2007),
[12] J. Wojtas, T. Stacewicz, Z. Bielecki, A. Czyżewski, M. Nowakowski. NO2 monitoring setup applying cavity enhanced absorption spectroscopy. The International Conference on Computer as a Tool, EUROCON 2007, Warsaw, September 9-12. Conference Proceedings, pp. 1205-1207 (2007).
[13] J. Wojtas, Z. Bielecki. Signal processing system in the cavity enhanced spectroscopy. Opto-Electron. Rev. 16, No 4, pp. 44-51, 2008.
[14] J. Wojtas, Z. Bielecki, J. Mikołajczyk, M. Nowakowski. Signal processing system in portable NO2 optoelectronic sensor. 6-8 May. Sensor+Test 2008 Proceedings, Nurnberg, Germany pp. 105-108 (2008).
[15] www.vigo.com.pl
Computational Methods and Experimental Measurements XIV 215
© 2009 WIT PressWIT Transactions on Modelling and Simulation, Vol 48, www.witpress.com, ISSN 1743-355X (on-line)