study report on_turnover_of_employees
TRANSCRIPT

CHAPTER - I
1.1 INTRODUCTION
LABOUR TURNOVER
Definition
Labour turnover is concerned with movements of individuals into jobs
(hiring) and out of jobs (separations) over a particular period.
Labour turnover is the sum of job turnover, which relates to the expansion
and contraction of establishments or firms, and the movement of workers into and
out of ongoing jobs in establishments or firms. Workers leave firms and firms hire
other workers to replace them, regardless of whether the firm itself is growing or
declining.
Labour turnover is an important parameter indicating the over all health of
any industry or an establishment in terms of wages, industrial relations, working
conditions and other welfare facilities provided by the employers to the workers.
Higher rate of Labour Turnover indicates lack of stability in the labour force,
which in turn, may not be considered to be conducive to the productivity of labour.
For higher productivity of labour, it is essential that labour force remains stable
over a period of time. Labour Turnover measures the extent of change in the work
force due to accession (total number of workers added to employment) or
separation (severance of employment at the instance of workers or employers)
during a particular period of time.
Statistics relating to the rate of accession and separation in respect of
directly employed regular workers, their average number in employment and the
1

percentage of factories reporting labour turnover during the year 2000 have been
presented.
Labour Turnover in States
State-wise labour turnover among directly employed regular workers is
presented in Table 3.1.1. It may be seen from the Table that at all India level, the
rate of accession during the year 2000 was 12.68 percent, whereas overall
separation over the same period was 15.14 percent. Thus, there was 2.46 percent
more separation than accession during the year, indicating, thereby, a decrease in
overall employment during the year.
The lowest and highest rates of accession during the year 2000 at State
level are observed to be 1.23 percent in Jharkhand and 32.18 percent in Uttar
Pradesh, respectively. Similarly, the lowest and highest rates of separation during
the year were observed in Tripura at 3.00 percent and Andaman & Nicobar Islands
at 37.81 percent, respectively.
Labour Turnover in Industries
Industry-wise labour turnover among directly employed regular workers
during the year 2000 is given in Table 3.1.2. The highest rate of accession at 85.56
percent was recorded in the industry group ‘014-Agricultural and animal
husbandry service activities, except veterinary activities’, whereas, the lowest rate
of accession at 1.62 percent was recorded in the industry group ‘353–Manufacture
of aircraft and space craft’.
Highest rate of Separation was also recorded in the industry group ‘014-
Agricultural and animal husbandry service activities, except veterinary activities’
at 91.77 percent. On the other hand, the lowest rate of separation was reported in
2

the industry group '232-Manufacture of refined petroleum products' at 3.87
percent.
Dealing with labour turnover
Areas commonly in need of attention may include:
recruitment and selection
induction and training
pay and grading
communication and consultation
management and supervision
disciplinary and grievance procedures
working conditions
employee involvement.
The costs of replacing and retaining staff
The main costs of high rates of labour turnover are
replacement costs (i.e. recruiting and interviewing new employees)
transition costs (including induction programmes and training
costs)
indirect costs (possible involving a loss of customer service whilst
new workers are trained and gain relevant work experience).
As any other thing the labour turnover has its advantages and
disadvantages. The labour turnover has a large list of disadvantages, and where
there is a large rate of this affect it results in a serious sign of unstability that is
caused by employees leaving their jobs maybe because of lack of job satisfaction
or bad management. Due to this result the company management must stop and
think seriously what is happening and what can be done to improve. Another
3

disadvantage is when the employees leave and have to be replaced by others, to
recruit new staff and give the necessary training may be very costly to the
company because the production will decreased during this time. This may result
as an unaccounted expense. Another disadvantage is the bad image of the
company because when there is a lot of labour turnover there will be less people
who will apply within the company.
Some advantages of labour turnover are that unwanted employees who are
not doing their job well or do not fit for post, the firm can dismiss them because if
the targets are not reached the company does not need inefficient employees. With
this labour turnover the company will start with enthusiastic employees who are
willing to do their job well and can increase production. From previous labour
turnover the management can learn from these experiences and so can do and take
actions to improve the standards of the firm.
Benefits of labour turnover
Labour turnover does not just create costs. Some level of labour turnover is
important to bring new ideas, skills and enthusiasm to the labour force.
A "natural" level of labour turnover can be a way in which a business can
slowly reduce its workforce without having to resort to redundancies (this is often
referred to as "natural wastage".
4

1.2 INTRODUCTION OF THE PROJECT
Finding out the turnover of employees in the manufacturing industries with
reference to LUCAS TVS Padi, is the theme of the project.
About the automobile industries:
A well developed transport network indicates a well developed economy.
For rapid development a well-developed and well-knit transportation system is
essential. As India's transport network is developing at a fast pace, Automobile
Industry is growing too. Also, the industry has strong backward and forward
linkages and hence provides employment to a large section of the population. Thus
the role of Automobile Industry cannot be overlooked in Indian Economy. All
kinds of vehicles are produced by the Automobile Industry. It includes the
manufacture of trucks, buses, passenger cars, defense vehicles, two-wheelers, etc.
The industry can be broadly divided into the Car manufacturing, two-wheeler
manufacturing and heavy vehicle manufacturing units.
High labour turnover is costly, lowers productivity and morale and tends to
get worse if not dealt with.
What is labour turnover?
Labour turnover is the total movement of employees in and out of an
organisation. However, the term is commonly used to refer only to 'wastage' or the
number of employees leaving.
5

Patterns of labour turnover
The biggest proportion of leavers tends to be among those who have
recently joined an organisation. Longer serving employees are more likely to stay,
mainly because they become used to the work and the organization and have an
established relationship with those around them.
Establishing the reasons for labour turnover
The causes of labour turnover are more likely to be brought directly to
management's attention where there is effective consultation with employee
representatives. The views of individuals should also be obtained by asking
existing employees what they like and dislike about the job and asking leavers
why they are leaving. This may be done systematically through the use of opinion
surveys, questionnaires and exit interviews.
6

1.2.1 NEED OF THE STUDY
Measuring labour turnover
To analyze the date collected and finding suggestions to improve the
weakness.
To be eye opener for everyone in LUCAS TVS as follows:
For LUCAS TVS management
To drive a future plan of action regarding to reduce attrition.
To find the scale of labour turnover and the reasons
comprising of it.
For LUCASTVS employees:
Concern for self-improvement in order to reduce attrition.
Commitment to work and regular work attendance.
For Researchers:
To gain an insight about employees problems and its future
trends.
The study also includes probable combat measures.
7

1.2.2 OBJECTIVES OF THE STUDY
Primary objective:
1. To find out the labour turnover rate
Secondary objectives:
To find out whether employees are satisfied with their job.
To analyze the prevailing working condition which influence turnover.
To analyze the various personal factors of the employees which influence
turnover rate
To study how the mode of conveyance is responsible for turnover
To suggest various remedial measures to control attrition rate.
8

1.2.3 SCOPE OF THE STUDY
The researcher has made an elaborate study to find out the reason for
absenteeism authorized leave facilities, attendance incentives, & other labour
welfare facilities which are being provided by the organization under study. The
researcher, at the outset has made an in-depth study to analyze the causes for the
“absenteeism” in spite of leave facilities offered by the organization. Moreover the
study had revealed certain major internal and external (family related) causes,
which are responsible for attrition. Further the researcher has suggested certain
recommendation if they implement, it will help the organization to overcome
frequent ‘absence’ by employee atleast in the future.
9

CHAPTER - II
2. COMPANY PROFILE
2.1 INCEPTION
About the Company….
Lucas - TVS was set up in 1961 as a joint venture of Lucas Industries plc.,
UK and T V Sundaram Iyengar & Sons (TVS), India, to manufacture Automotive
Electrical Systems. One of the top ten automotive component suppliers in the
world, Lucas Varity was formed by the merger of the Lucas Industries of the UK
and the Varity Corporation of the US in September 1996. The company designs,
manufactures and supplies advanced technology systems, products and services to
the world's automotive, after market, diesel engine and aerospace industries.
The combination of these two well-known groups has resulted in the
establishment of a vibrant company, which has had a successful track record of
sustained growth over the last three decades.TVS is one of India's twenty large
industrial houses with twenty-five manufacturing companies and a turnover in
excess of US$ 1.3 billion. The turnover of Lucas-TVS and its divisions is US$ 233
million during 2003-2004.
Incorporating the strengths of Lucas UK and the
TVS Group, Lucas TVS has emerged as one of the
foremost leaders in the automotive industry today.
Lucas TVS reaches out to all segments of the
automotive industry such as passenger cars,
commercial vehicles, tractors, jeeps, two-wheelers
and off-highway vehicles as well as for stationary
and marine applications. With the automobile
Mannur site
10
industry in India currently undergoing phenomenal changes, Lucas-TVS, with its
excellent facilities, is fully equipped to meet the challenges of tomorrow.The TVS
Group, with a turnover of over one billion dollars, is the largest manufacturer of
automotive components in India. The group produces auto electricals, diesel fuel
injection systems, braking systems, automotive wheels and axle fasteners, powder metal
components, radiator caps, two wheelers and computer peripherals. Backed by five
service and distribution companies with an extensive network across the country, the
group has the largest distribution network for automotive products in India.
About the QUALITY ASSURANCE….
"Lucas TVS is committed to achieving ever increasing levels of customer
satisfaction through continuous improvements to the quality of the products and
services. It will be the company's endeavour to increase customer trust and
confidence in the label 'Made in Lucas TVS'."
Quality is no longer an option but a basic requirement in today's world. At
Lucas TVS, quality in inbuilt in every phase of manufacture. The company's
quality assurance measures stand on the foundation of a solid belief - that quality
11

begins and ends with the customer. This commitment forms the backbone of its
approach to Quality Assurance.
Lucas TVS has adopted a prevention-oriented quality policy though
ingrained with the traditional ideas of quality control. Everyone from the highest
levels of the organisation to the lowest practice quality control both as an
individual and as a team.
An effective Quality Control System has resulted in the recognition of the
company's outstanding achievements in the various fields. Lucas-TVS was
awarded the ISO 9001 certified by BVQI in December 1993. The company
reached a further milestone when it recently received a certificate of recognition
from BVQI for QS 9000 for Auto Electricals.
WELFARE SERVICES PROVIDED LUCAS TVS:
Services
Canteen
Medical center
Issue of welfare items
Reimbursement
Birthday presentation
Long service awards
Family relief fund
Insurance of marriage gift
Special occasion or function
Incentive for family planning
Redressal – employee grievances
Procedure-accident report
Education awards
Suggestion scheme
Loans, advances and allowance
12

Medical
Marriage
Education
Housing
Issue of cycle advance
Medical insurance scheme
Personal accident coverage
Retirement benefit
Industrial accident
Sickness benefit
About the People….
Human resource is an asset never disclosed in a company's balance sheet.
At Lucas-TVS, employees are considered partners in progress. Trust and
confidence in their abilities are an important part of the Lucas-TVS philosophy.
Employee participation takes place at almost every level of the organisation.
Lucas-TVS recognises that in a fast changing world, constant updating of
knowledge is vital. Thus its management style sets great store by employee
involvement and actively encourages participation and commitment. The company
strives to optimise HRD contribution to the its growth.
Small Group Activity (SGA) has become a
vibrant force with about 85 groups functioning
continuously with one group meeting every week
to present its achievements. The Suggestion
Scheme has evoked tremendous response since
its initiation in 1973.
13
To hone the skills of its employees, the company operates a well-equipped
training centre, which features a multi skill workshop, a product knowledge centre,
CNC training and computer facilities. Individual skills are fine tuned through
specialised courses, both within the country and abroad.
About the Customers…
CUSTOMERINTERNATIONAL COLLABORATOR
Cars
Maruti Udyog Suzuki, Japan
Hindustan Motors Isuzu, Japan. Mitsubishi, Japan
TATA Engineering and Locomotive Company
General Motors, India General Motors, USA
Ford India Ford, UK
Daewoo Motors Co., India Daewoo, Korea
Ind Auto Fiat, Italy
Hyundai Motors, India Hyundai Motors, Korea
Light Commercial Vehicles
TATA Engineering & Locomotive Company
Bajaj Tempo Daimler Benz, Germany
Mahindra & Mahindra Peugeot, France
Mahindra Nissan Nissan, Japan
Swaraj Mazda Mazda, Japan
Eicher Motors Mitsubishi, Japan
Heavy commercial vehicles
TATA Engineering & Locomotive Company
Daimler Benz, Germany. Cummins, USA
Ashok Leyland Iveco, Italy. Hino, Japan
Tractors
Mahindra & MahindraInternational Harvestor Corporation, UK
14

Tractors and Farm Equipments (TAFE) Massey Ferguson, UK
Escorts Ursus, Poland. Ford, UK
HMT Zetor, Czechoslovakia
Eicher Tractors Good Earth, Germany
Punjab Tractors
Gujarat Tractors Zetor, Czechoslovakia
L&T Tractors Johndeer, USA
Greaves Tractors Same, Italy
Earth Moving Equipment
Hindustan Motors Caterpillar, USA
Bharat Earth Movers Ltd.(BEML) Komatsu, Japan
Stationary / Marine Engines, Gensets
Cummins India Cummins, USA
Tata Cummins Cummins, USA
Simpsons Perkins, USA
Ruston and Hornsby Ruston & Hornsby, UK
Kirloskar Oil Engines
Greaves Lombardini, Italy
Ashok Leyland BLMC, UK
EXPORT CUSTOMERS COUNTRY
Helwan Diesel Engg Company Egypt
Lucas Electrical, UK UK
Delco Remy USA
Prestolite Electric Ltd USA
After Market USA / UK
2.2 TYPE OF INDUSTRY
15

India Automobile Industry
Following India's growing openness, the arrival of new and existing
models, easy availability of finance at relatively low rate of interest and price
discounts offered by the dealers and manufacturers all have stirred the demand for
vehicles and a strong growth of the Indian automobile industry.
The data obtained from ministry of commerce and industry, shows high
growth obtained since 2001- 02 in automobile production continuing in the first
three quarters of the 2004-05. Annual growth was 16.0 per cent in April-
December, 2004; the growth rate in 2003-04 was 15.1 per cent The automobile
industry grew at a compound annual growth rate (CAGR) of 22 per cent between
1992 and 1997. With investment exceeding Rs. 50,000 crore, the turnover of the
automobile industry exceeded Rs. 59,518 crore in 2002-03. Including turnover of
the auto-component sector, the automotive industry's turnover, which was above
Rs. 84,000 crore in 2002-03, is estimated to have exceeded Rs.1,00,000 crore
( USD 22. 74 billion) in 2003-04.
Automobile Dealers Network in India. In terms of Car dealer networks and
authorized service stations, Maruti leads the pack with Dealer networks and
workshops across the country. The other leading automobile manufactures are also
trying to cope up and are opening their service stations and dealer workshops in all
the metros and major cities of the country. Dealers offer varying kind of discount
of finances who in tern pass it on to the customers in the form of reduced interest
rates.
16

Major Manufacturers of Automobiles in India
01. Maruti Udyog Ltd.
02. General Motors India
03. Ford India Ltd.
04. Eicher Motors
05. Bajaj Auto
06. Daewoo Motors India
07. Hero Motors
08. Hindustan Motors
09. Hyundai Motor India Ltd.
10. Royal Enfield Motors
11. Telco
12. TVS Motors
13. DC Designs
14. Swaraj Mazda Ltd
17

2.3 BRANCHES/NETWORK
LUCAS-TVS has branches at:
AUTO ELECTRICAL PLANT-Padi, Chennai.
AUTO ELECTRICAL PLANT-Rewaru, Chennai.
AUTO ELECTRICAL PLANT-Pondicherry
2.4 PRODUCT/SERVICES
18

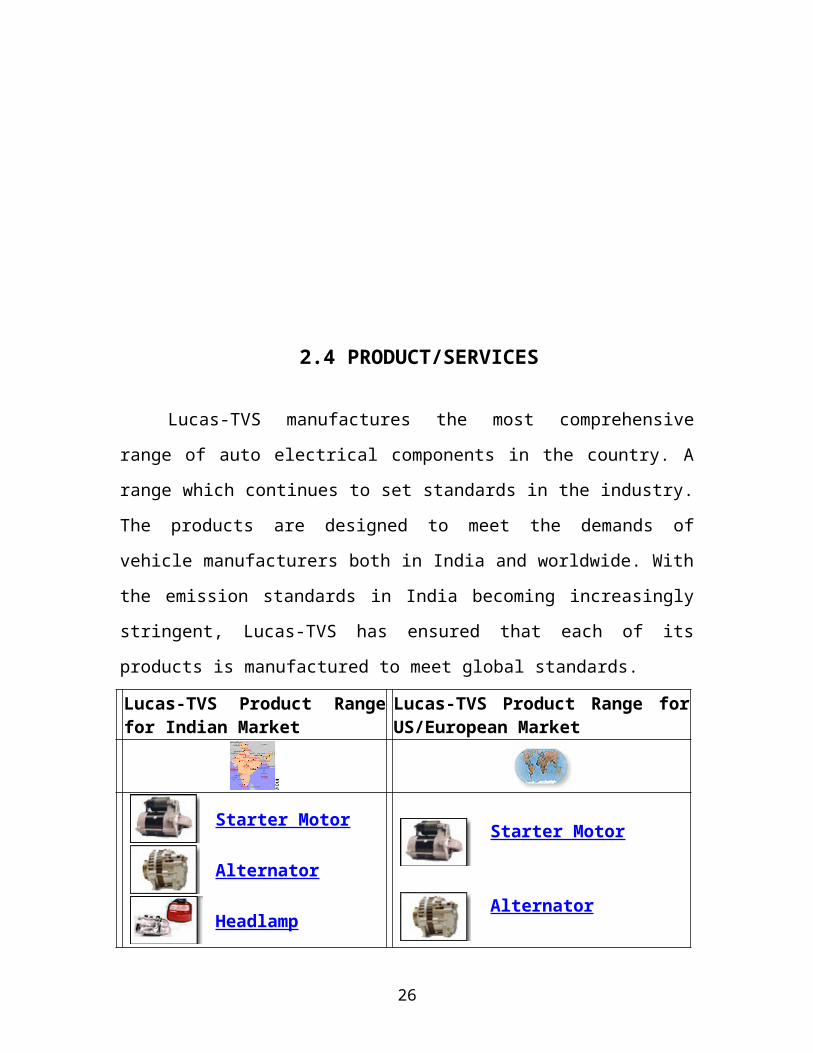
Lucas-TVS manufactures the most comprehensive range of auto electrical
components in the country. A range which continues to set standards in the
industry. The products are designed to meet the demands of vehicle manufacturers
both in India and worldwide. With the emission standards in India becoming
increasingly stringent, Lucas-TVS has ensured that each of its products is
manufactured to meet global standards.
Lucas-TVS Product Range for Indian Market
Lucas-TVS Product Range for US/European Market
Starter Motor
Alternator
Headlamp
Small MotorWiper MotorBlower MotorFan Motor
Dynamo Regulator
Dynamo
Ignition Coil
Distributor
Diesel fuel injection
Starter Motor
Alternator
Small Motor14W Wiper MotorWindShield Wiper Motor (GM Range)LRW Products
Dynamo Regulator
Dynamo
Auto ElectricalsTelco VehiclesAshok Leyland VehiclesSuzuki Vehicles
About the Clients…
COMPANY PRODUCTS
19

Manufacturing companies
Axles India Ltd. Automotive axles
Brakes India Ltd. Hydraulic brakes & clutch actuation systems
India Nippon Electricals Ltd.
Magnetos, Two/Three wheeler ignition systems
Lakshmi Auto Components Ltd.
Engine/transmission components
Lucas-TVS Ltd.Auto electricals/Diesel fuel injection equipment
TVS Srichakra Ltd. Automotive tyres
Sundaram Brake Linings Ltd.
Brake linings & clutch facings
Sundaram Clayton Ltd. Air brakes
Sundaram Fasteners Ltd. High tensile fasteners, cold extruded products, sintered components, intelligent systems, radiator caps
Sundaram Textiles Ltd. Yarn
Turbo Energy Ltd. Turbo chargers
TVS Interconnect Systems Limited.
Electronic connectors
TVS Electronics Ltd. Computer peripherals
TVS Sewing Needles Ltd. Sewing needles
TVS Motor Company Limited.
Two wheelers
TVS Cherry Limited.
Precision miniature, sub-miniature, selector switches, hall effect sensors, key switches and advanced performance/special purpose keyboards.
Wheels India Ltd. Automotive wheels
Distribution companies
India Motor Parts & Accessories Ltd.
Distributors of automotive components
20

Lucas Indian Service Ltd. Distributors of auto electrical and auto components, Fuel Injection Equipment, LISPART & Batteries.
T V Sundaram Iyengar & Sons Ltd.
Distributors of passenger cars, commercial vehicles, automotive spare parts
Other companies
Southern Roadways Ltd. Freight services
Sunco Machines Ltd. Precure tyre retreading equipment
Sundaram Industries Ltd. Tyre retreading, coach building, rubber components
DEMING AWARD FOR LUCAS-TVS
21

Chennai, 9 October 2004: Lucas-TVS, a TVS group company, has bagged
the prestigious Deming Application Award for the year 2004. This was announced
by the Deming Prize Committee of Japanese Union of Scientists and Engineers
(JUSE).
Lucas-TVS, with manufacturing facilities at Padi (Chennai), Pondicherry
and Rewari (Haryana), is the first and the only Auto Electrical Company from
India to receive this coveted award. The award ceremony will be held on 9th
November 2004 at Tokyo, Japan.
Lucas-TVS launched the Japanese Total Quality Management (TQM)
movement during 1998. TQM is a vehicle to continuously improve all the
Management Processes with Customer Focus in terms of Quality, Cost, Delivery
and Service and the process motivates teamwork among all employees, promotes
total employee involvement in achieving the company’s objectives.
Lucas-TVS is the largest manufacturer of Auto Electricals in India catering
to all segments of Auto Industry, which includes Cars, Utility Vehicles,
Commercial Vehicles, Tractors and Two wheelers. The core competence of the
company is its capability to design and develop products to the new variants and
vehicles with its in house R&D facilities.
22
The company is a pioneer in launching various manufacturing systems to
respond to the customer requirements and brought in many change programmes
and other contemporary practices. Its focus on customer, continuous improvement
and employee involvement has always been commendable. Lucas-TVS is a TS
16949 and ISO 14001 certified company.
The Deming Certification process is rather stringent and involves audits in
two stages by an independent team from Japan. The initial process begins with the
company submitting that it be considered for the award. The company’s various
TQM processes were subjected to diagnostic audit during December 2003. The
final audit was held on 19th and 20th August 2004 by JUSE, which is an apex
organisation for awarding Deming Application Prize and it was confirmed on 6 th
October 2004 that Lucas-TVS has won the Deming Application Prize for the year
2004.
23

2.5. MARKET SHARE
Lucas Indian Service, a subsidiary of Lucas-TVS was established in 1930
and is primarily engaged in sales and service of auto electricals and fuel injection
equipment manufactured by Lucas-TVS. It additionally handles several other
manufacturer's products of a wide variety. With four regional offices located in the
metros and 22 branches covering every major state in the country, it also
manufactures a few products in its factory.
The company's extensive distribution network comprising over 2000 outlets
spans the entire length and breadth of the country. Further, in its efforts to become
a leading auto-ancillary distribution house, Lucas Indian Service is continuously
on the look out for tie-ups with reputed companies for marketing their products.
Its unique strength lies in its network of branches and a host of service
dealers developed over the last six and half decades. To support Lucas-TVS FIE
Division, the company is in the process of setting up a network of service dealers,
whose workshops will measure up to international standards.
24

2.6 FUTURE PLANS
Automobile industries in India is currently under going phenomenal
changes with so many new fuel efficient vehicles being launched and old vehicles
being improved and reequipped to compete with the new comers. LUCAS-TVS
with its excellent facilities fro product development, quality assurance, training
and manufacturing is fully equipped to meet\ the challenges of tomorrow.
CHAPTER - III
LITERATURE REVIEW
25
“Employee turnover” as a term is widely used in business circles. Although
several studies have been conducted on this topic, most of the researchers focus on
the causes of employee turnover but little has been done on the examining the
sources of employee turnover, effects and advising various strategies which can be
used by managers in various organizations to ensure that there is employee
continuity in their organizations to enhance organizational competitiveness. This
paper examines the sources of employee turnover, effects and forwards some
strategies on how to minimize employee turnover in organizations.
INTRODUCTION
Organizations invest a lot on their employees in terms of induction and
training, developing, and retaining them in their organization. Therefore, managers
at all costs must minimize employee’s turnover. Although, there is no standard
framework for understanding the employees turnover process as whole, a wide
range of factors have been found useful in interpreting employee turnover.
Therefore, there is need to develop a fuller understanding of the employee
turnover, more especially, the sources- what determines employee turnover,
effects and strategies that managers can put in place minimize turnover. With
globalization which is heightening competition, organizations must continue to
develop tangible products and provide services which are based on strategies
created by employees. These employees are extremely crucial to the organization
since their value to the organization is essentially intangible and not easily
replicated. Therefore, managers must recognize that employees as major
contributors to the efficient achievement of the organization’s success. Managers
should control employee turnover for the benefit of the organization success. The
literature on employee turnover is divided into three groupings: sources of
employee turnover, effects of turnover and the strategies to minimize turnover.
26

Definition
Employees’ turnover is a much studied phenomenon But there is no
standard reason why people leave organization. Employee turnover is the rotation
of workers around the labour market; between firms, jobs and occupations; and
between the states of employment and unemployment. The term “turnover” is
defined as: the ratio of the number of organizational members who have left
during the period being considered divided by the average number of people in
that organization during the period. Frequently, managers refer to turnover as the
entire process associated with filling a vacancy: Each time a position is vacated,
either voluntarily or involuntarily, a new employee must be hired and trained. This
replacement cycle is known as turnover. This term is also often utilized in efforts
to measure relationships of employees in an organization as they leave, regardless
of reason.
“Unfolding model” of voluntary turnover represents a divergence from
traditional thinking focusing more on the decisional aspect of employee turnover,
in other words, showing instances of voluntary turnover as decisions to quit.
Indeed, the model is based on a theory of decision making. The image theory
describes the process of how individuals process information during decision
making. The underlying premise of the model is that people leave organizations
after they have analyzed the reasons for quitting. Baech argues that individuals
seldom have the cognitive resources to systematically evaluate all incoming
information, so individuals instead of simply and quickly compare incoming
information to more heuristic-type decision making alternatives.
Sources of employee turnover
Job related factors
27

Most researchers have attempted to answer the question of what determines
people's intention to quit by investigating possible antecedents of employees’
intentions to quit. To date, there has been little consistency in findings, which is
partly due to the diversity of employed included by the researchers and the lack of
consistency in their findings.
Therefore, there are several reasons why people quit from one organization
to another or why people leave organization. The experience of job related stress
(job stress), the range factors that lead to job related stress (stressors), lack of
commitment in the organization; and job dissatisfaction make employees to quit.
This clearly indicates that these are individual decisions which make one to quit.
They are other factors like personal agency refers to concepts such as a sense of
powerlessness, locus of control and personal control. Locus control refers to the
extent to which people believe that the external factors such as chance and
powerful others are in control of the events which influence their lives. argue that
employees quit from organization due economic reasons. Using economic model
they showed that people quit from organization due to economic reasons and these
can be used to predict the labour turnover in the market. Good local labour market
conditions improve organizational stability. Large organizations can provide
employees with better chances for advancement and higher wages and hence
ensure organizational attachment. Trevor (2001) argues that local unemployment
rates interact with job satisfaction to predict turnover in the market. Role stressors
also lead to employees’ turnover. Role ambiguity refers to the difference between
what people expect of us on the job and what we feel we should do. This causes
uncertainty about what our role should be. It can be a result of misunderstanding
what is expected, how to meet the expectations, or the employee thinking the job
should be different. Insufficient information on how to perform the job adequately,
unclear expectations of peers and supervisors, ambiguity of performance
evaluation methods, extensive job pressures, and lack of consensus on job
28

functions or duties may cause employees to feel less involved and less satisfied
with their jobs and careers, less committed to their organizations, and eventually
display a propensity to leave the organization. If roles of employees are not clearly
spelled out by management/ supervisors, this would accelerate the degree of
employees quitting their jobs due to lack of role clarity.
Voluntarily vs. involuntary turnover
There are some factors that are, in part, beyond the control of management,
such as the death or incapacity of a member of staff. Other factors have been
classed as involuntary turnover in the past such as the need to provide care for
children or aged relatives. Today such factors should not be seen as involuntary
turnover as both government regulation and company policies create the chance
for such staff to come back to work, or to continue to work on a more flexible
basis.
Organizational factors
Organizational instability has been shown to have a high degree of high
turnover. Indications are that employees are more likely to stay when there is a
predictable work environment and vice versa. In organizations where there was a
high level of inefficiency there was also a high level of staff turnover. Therefore,
in situations where organizations are not stable employees tend to quit and look
for stable organizations because with stable organizations they would be able to
predict their career advancement. The imposition of a quantitative approach to
managing the employees led to disenchantment of staff and hence it leads to
labour turnover. Therefore management should not use quantitative approach in
managing its employees. Adopting a cost oriented approach to employment costs
increases labour turnover. All these approaches should be avoided if managers
29

want to minimize employee turnover an increase organizational competitiveness in
this environment of globalization. Employees have a strong need to be informed.
Organization with strong communication systems enjoyed lower turnover of staff.
Employees feel comfortable to stay longer, in positions where they are involved in
some level of the decision-making process. That is employees should fully
understand about issues that affect their working atmosphere. But in the absence
openness’ in sharing information, employee empowerment the chances of
continuity of employees are minimal. Costly et al. (1987) points out that a high
labour turnover may mean poor personnel policies, poor recruitment policies, poor
supervisory practices, poor grievance procedures, or lack of motivation.
All these factors contribute to high employee turnover in the sense that
there is no proper management practices and policies on personnel matters hence
employees are not recruited scientifically, promotions of employees are not based
on spelled out policies, no grievance procedures in place and thus employees
decides to quit noted that pay and pay-related variables have a modest effect on
turnover. Their analysis also included studies that examined the relationship
between pay, a person’s performance and turnover. They concluded that when
high performers are insufficiently rewarded, they quit. If jobs provide adequate
financial incentives the more likely employees remain with organization and vice
versa. There are also other factors which make employees to quit from
organizations and these are poor hiring practices, managerial style, lack of
recognition, lack of competitive compensation system in the organisation and toxic
workplace environment.
Effects of employee turnover
30

Employee turnover is expensive from the view of the organization.
Voluntary quits which represents an exodus of human capital investment from
organizations and the subsequent replacement process entails manifold costs to the
organizations. These replacement costs include for example, search of the external
labour market for a possible substitute, selection between competing substitutes,
induction of the chosen substitute, and formal and informal training of the
substitute until he or she attains performance levels equivalent to the individual
who quit. Addition to these replacement costs, output would be affected to some
extend or output would be maintained at the cost of overtime payment. The reason
so much attention has been paid to the issue of turnover is because turnover has
some significant effects on organizations. Many researchers argue that high
turnover rates might have negative effects on the profitability of organizations if
not managed properly. Turnover has many hidden or invisible costs and these
invisible costs are result of incoming employees, co-workers closely associated
with incoming employees, co-workers closely associated with departing
employees and position being filled while vacant. And all these affect the
profitability of the organization. On the other hand turnover affects on customer
service and satisfaction. This clearly demonstrates that turnover affects the
profitability of the organization and if it’s not managed properly it would have the
negative effect on the profit. Research estimates indicate that hiring and training a
replacement worker for a lost employee costs approximately 50 percent of the
worker’s annual salary– but the costs do not stop there. Each time an employee
leaves the firm, we presume that productivity drops due to the learning curve
involved in understanding the job and the organization. Therefore, if employee
turnover is not managed properly it would affect the organization adversely in
terms of personnel costs and in the long run it would affect its liquidity position.
However, voluntary turnover incurs significant cost, both in terms of direct costs
(replacement, recruitment and selection, temporary staff, management time), and
also (and perhaps more significantly) in terms of indirect costs (morale, pressure
31

on remaining staff, costs of learning, product/service quality, organisational
memory) and the loss of social capital.
Strategies to minimize employee turnover
Strategies on how to minimize employee turnover, confronted with
problems of employee turnover, management has several policy options viz.
changing (or improving existing) policies towards recruitment, selection,
induction, training, job design and wage payment. Policy choice, however, must
be appropriate to the precise diagnosis of the problem. Employee turnover
attributable to poor selection procedures, for example, is unlikely to improve were
the policy modification to focus exclusively on the induction process. Equally,
employee turnover attributable to wage rates which produce earnings that are not
competitive with other firms in the local labour market is unlikely to decrease
were the policy adjustment merely to enhance the organization’s provision of on-
the job training opportunities. Given that there is increase in direct and indirect
costs of labour turnover, therefore, management are frequently exhorted to identify
the reasons why people leave organization’s so that appropriate action is taken by
the management. Extensive research has shown that the following categories of
human capital management factors provides a core set of measures that senior
management can use to increase the effectiveness of their investment in people
and improve overall corporate performance of business. Employee engagement,
the organization’s capacity to engage, retain, and optimize the value of its
employees hinges on how well jobs are designed, how employees'time is used, and
the commitment and support that is shown to employees by the management
would motivate employees to stay in organization’s.
Knowledge accessibility, the extent of the organisation’s
“collaborativeness” and its capacity for making knowledge and ideas widely
32

available to employees, would make employees to stay in the organisation.
Sharing of information should be made at all levels of management. This
accessibility of information would lead to strong performance from the employees
and creating strong corporate culture. Therefore; information accessibility would
make employees feel. That they are appreciated for their effort and chances of
leaving the organisation are minimal. Workforce optimization, the organisation’s
success in optimizing the performance of the employees by establishing essential
processes for getting work done, providing good working conditions, establishing
accountability and making good hiring choices would retain employees in their
organisation. The importance of gaining better understanding of the factors related
to recruitment, motivation and retention of employees is further underscored by
rising personnel costs and high rates of employee turnover. With increased
competitiveness on globalizations, managers in many organizations are
experiencing greater pressure from top management to improve recruitment,
selection, training, and retention of good employees and in the long run would
encourage employees to stay in organisations.
Job involvement describes an individual’s ego involvement with work and
indicates the extent to which an individual identifies psychologically with his/her
job. Involvement in terms of internalizing values about the goodness or the
importance of work made employees not to quit their jobs and these involvements
are related to task characteristics. Workers who have a greater variety of tasks tend
stay in the job. Task characteristics have been found to be potential determinants
of turnover among employees. These include the five core job characteristics: skill
variety, which refers to the opportunity to utilize a variety of valued skills and
talents on the job; task identity, or the extent to which a job requires completion of
a whole and identifiable piece of work - that is, doing a job from beginning to end,
with visible results; task significance, which reflects the extent to which the job
has a substantial impact on the lives or work of other people, whether within or
33

outside the organisation; job autonomy, or the extent to which the job provides
freedom, independence, and discretion in scheduling work and determining
procedures that the job provides; and job feedback, which refers to the extent to
which the job provides information about the effectiveness of one’s performance.
Involvement would influence job satisfaction and increase organizational
commitment of the employees. Employees who are more involved in their jobs are
more satisfied with their jobs and more committed to their organization Job
involvement has also been found to be negatively related to turnover intentions.
Job satisfaction, career satisfaction, and organisational commitment reflect a
positive attitude towards the organization, thus having a direct influence on
employee turnover intentions. Job satisfaction, job involvement and organisational
commitment are considered to be related but distinguishable attitudes. Satisfaction
represents an affective response to specific aspects of the job or career and denotes
the pleasurable or positive emotional state resulting from an appraisal of one’s job
or career. Organisational commitment is an affective response to the whole
organisation and the degree of attachment or loyalty employees feel towards the
organisation. Job involvement represents the extent to which employees are
absorbed in or preoccupied with their jobs and the extent to which an individual
identifies with his/her job.The degree of commitment and loyalty can be achieved
if management they enrich the jobs, empower and compensate employees
properly.
Empowerment of employees could help to enhance the continuity of
employees in organisations. Empowered employees where managers supervise
more people than in a traditional hierarchy and delegate more decisions to their
subordinates. Managers act like coaches and help employees solve problems.
Employees, he concludes, have increased responsibility. Superiors empowering
subordinates by delegating responsibilities to them leads to subordinates who are
more satisfied with their leaders and consider them to be fair and in turn to
34

perform up to the superior’s expectations. All these makes employees to be
committed to the organization and chances of quitting are minimal.
Conclusions
Therefore, if the above strategies are taken into account the business would
be able to survive in a dynamic environment by treating their employees as one of
their assets which needs a lot of attention. Employees are the backbone of any
business success and therefore, they need to be motivated and maintained in
organisation at all cost to aid the organisation to be globally competitive in terms
of providing quality products and services to the society. And in the long-run the
returns on investments on the employees would be achieved. Management should
encourage job redesign-task autonomy, task significance and task identity, open
book management, empowerment of employees, recruitment and selection must be
done scientifically with the objective of retaining employees. Managers should
examine the sources of employee turnover and recommend the best approach to
fill the gap of the source, so that they can be in a position to retain employees in
their organisation to enhance their competitiveness in the this world of
globalization. Managers must understand that employees in their organizations
must be treated as the most liquid assets of the organization which would make the
organisation to withstand the waves of globalization. This asset needs to be
monitored with due care, otherwise their organizations would cease to exist.
Employees should be given challenging work and all managers should be hired on
the basis of know how by following laid down procedures of the organization and
this would make organisation to have competent managers at all levels of
management and hence good supervision. Pay and pay-related variables have a
great effect on employee turnover. Management must compensate employees
adequately. They should pay employees based on their performance and in
addition they should given employees incentives like individual bonus, lump sum
35

bonus, sharing of profits and other benefits. Hence, if these are put in place they
would minimize employee turnover.
CHAPTER - IV
4.1 RESEARCH METHODOLOGY
36

RESEARCH DESIGN:
“ A Research Design is purely and simply the framework or plan for the study
that guides the collection of the data.”
Fundamental to the study of any formal research project is sound research
design.
A good research design has the following characteristics namely
1. Problem definition
2. Specific methods of data collection and analysis
3. Time required for research project
4. Estimate of expenses to be incurred
Types of Research Design:
1. Exploratory Research Design
2. Descriptive Research Design
3. Casual or Experimental Research Designing
In this study, the researcher has adopted Descriptive Research Design.
Descriptive Research Design:
A Descriptive Research Design is the one that simply describes something
such as demographic characteristics of certain people who use something.
The descriptive study we typically concern with determining frequently
with which something occurs or how two variables vary together. This study is
37

typically guided by an initial hypothesis. A descriptive study requires a clear
specifications of who, what, when, where, why and how aspects of the research.
Period of study: Period of study is 45days.
TOTAL POPULATION:
The total universe or population is the specific group of people, firm,
conditions, etc., which form the pivotal point of research
Therefore, the total population (employees) of the company is 3500.
SAMPLING PROCEDURE:
Convenience sampling:
The methodology adopted in this study is convenience sampling. As the
name implies, the sample is selected because they are convenient to the researcher.
A convenience sample is used when you simply stop anybody in the street
who is prepared to stop, or when you wander round a business, a shop, a
restaurant, a theatre or whatever, asking people you meet whether they will answer
your questions.
SAMPLING UNIT
A survey is conducted in LUCAS-TVS, PADI, CHENNAI.
SAMPLE SIZE:
The sample size for the survey is 100.
38

DATA COLLECTION:
In this present study both primary and secondary data are used.
DATA: Raw facts are referred to as data.
TYPES OF DATA:
There are two types of data
Primary data
Secondary data
Primary data:
Primary data is information obtained from original sources by the
researcher. A structured questionnaire was prepared to collect relevant primary
data.
QUESTIONNAIRE METHOD:
The questionnaire is a sheet or sheets of paper containing questions
relating to certain specific aspect, regarding which the researcher collects the data.
The questionnaire is given to the respondent to be filled up. Sometimes,
questionnaire is also in the form of files generated through computer. This is
usually called as soft copy of questionnaire.
A questionnaire consists of a number of questions printed or typed in a
definite order on a form or set of forms. The questionnaire is mailed to
39

respondents who are expected to read and understand the question itself. The
respondents have to answer the questions on their own. In order to make the
questionnaire effective and to ensure the quality to the replies received, a
researcher should pay attention to the question to the question sequence in
preparing the questionnaire.
Secondary data:
Data, which are collected already and published or unpublished. Such a
source is used to save the time and cost in compiling the data relating to the past.
There are several methods under which the secondary data has been collected.
They are
Books
Journal
Websites
ANALYSIS:
The collected data were analyzed by applying percentage method, chi-
square test.
40

4.2 LIMITATIONS OF THE STUDY
The study has been conducted with the particular reference to employees of
LUCAS TVS at Padi Branch.
Sample size was limited as the workers were to be interviewed while at
work.
The time duration for the study was less.
The findings of the study cannot be applicable to any other organization
i.e., as the study was carried out at LUCAS TVS at Padi. The findings and
suggestions are confined only to this organization.
Some of the answers given by the respondents may be based.
4.3 STATISTICAL TOOLS FOR ANALYSIS
41

Percentage analysis:
Percentage analysis can be calculated as follows:
First the frequency (i.e) no. of responses is noted in a tabular form, then the
percentage is calculated by dividing the frequency by total number of respondents
multiplied by 100. Then the values are noted in column as valid percent.
Statistical tools:
This collected data has been subjected to analysis by using appropriate tool.
1. Chi-square test:
The objective of the chi-square test is to determine whether real or significant
different exist among the various group. Chi-square test involves compared of
expected frequency (Ei) with observed frequency. To determine whether the
different between the two in greater than which might occur by chance. There are
five steps in using chi-square test.
a) The different between each observed frequency and each Expected
Frequency.
b) The differences are squared.
c) Each squared different is divided by it least expected frequency.
d) Their quotient are added together to obtain the computed chi-square values.
e) This computed value is compared to the tabulated chi-square.
If the computed chi-square value is greater than the tabulated chi-square
value at the predetermined level of significance and degree of free, the hypothesis
rejected. On the other hand if calculated chi-square value is less than the tabulated
value, the hypothesis is accepted.
The formula is
=[ (Oi-Ei)-0.5]^2
42
CHAPTER - V
DATA ANALYSIS AND INTERPRETATION
TABLE No. 1
YEARS OF EXPERIENCE ATTAINED IN THE COMPANY
Particulars No.of respondents Percentage
<1yr 6 6
1-3 yrs 24 24
3-6 yrs 2 2
6-9 yrs 68 68
>9 yrs 0 0
TOTAL 100 100
INFERENCE:
The years of experience of workers for 6-9 years is 68% and for 1-3 years is 24%.
43

CHART No. 1
0
10
20
30
40
50
60
70
Years of experience attained in the company
<1 year
1-3 years
3-6 years
6-9 years
>9 years
<1 yr 1-3yrs 3-6yrs 6-9yrs >9yrs
INFERENCE:
The years of experience of workers for 6-9 years is 68% and for 1-3 years is 24%.
44

TABLE No. 2
THE FACTOR THAT TRIGGERED TO LEAVE THE COMPANY
Particulars No.of respondents Percentage
Personal 20 20
Benefits-salary, incentives 18 18
Less growth opportunity 38 38
Attitude of supervisors 6 6
Health 18 18
TOTAL 100 100
INFERENCE:
The factors that triggered to leave the company for 38% of the respondents
is of less growth opportunities and 20% of the respondents think its Personal and
18% of workers responded as Benefits-Salary, Incentives and Health.
45
CHART No.2
INFERENCE:
The factors that triggered to leave the company for 38% of the respondents
is of less growth opportunities and 20% of the respondents think its Personal and
18% of workers responded as Benefits-Salary, Incentives and Health.
0
5
10
15
20
25
30
35
40
The factor that triggered to leave the company
Personal
Benefits-salary,incentivesLess growthopportunitiesAttitude ofsupervisorsHealth
personal benefits-salary
incentives
less growth
opportuni
attitude of supervisors
health
46

TABLE No. 3
OVERALL OPINION OF EMPLOYEES ABOUT THE ORIENTATION PROCESS
Particulars No.of respondents Percentage
Excellent 2 2
Very Good 26 26
Good 48 48
Fair 24 24
Poor 0 0
TOTAL 100 100
INFERENCE:
About the orientation process conducted 48% of the respondents believe
that there is a good orientation and 26% employees say that very good whereas
24% of the respondents say that its fair.
47

CHART No. 3
0
10
20
30
40
50
Orientation process
Excellent
Very Good
Good
Fair
Poor
excellent verygood good fair poor
INFERENCE:
About the orientation process conducted 48% of the respondents believe
that there is a good orientation and 26% employees say that very good whereas
24% of the respondents say that its fair.
48

TABLE No. 4
OPINION OF EMPLOYEES ABOUT THEIR TREATMENT IN THE COMPANY
Particulars No.of respondents Percentage
Excellent 2 2
Very Good 20 20
Good 48 48
Fair 30 30
Poor 0 0
TOTAL 100 100
INFERENCE:
About the treatment in the company 48% of the employees say that they are
treated good and 30% of the employees say that they are treated fairly and 20% of
the employees say that they are treated very good.
CHART No. 4
49

0
510
152025
3035
4045
50
Treating employees Fairly
Excellent
Very good
Good
Fair
Poor
excellent very good
good fair poor
INFERENCE:
About the treatment in the company 48% of the employees say that they are
treated good and 30% of the employees say that they are treated fairly and 20% of
the employees say that they are treated very good.
50

TABLE No. 5
OVERALL MORALE OF EMPLOYEES
Particulars No.of respondents Percentage
Excellent 0 0
Very good 22 22
Good 68 68
Fair 10 10
Poor 0 0
TOTAL 100 100
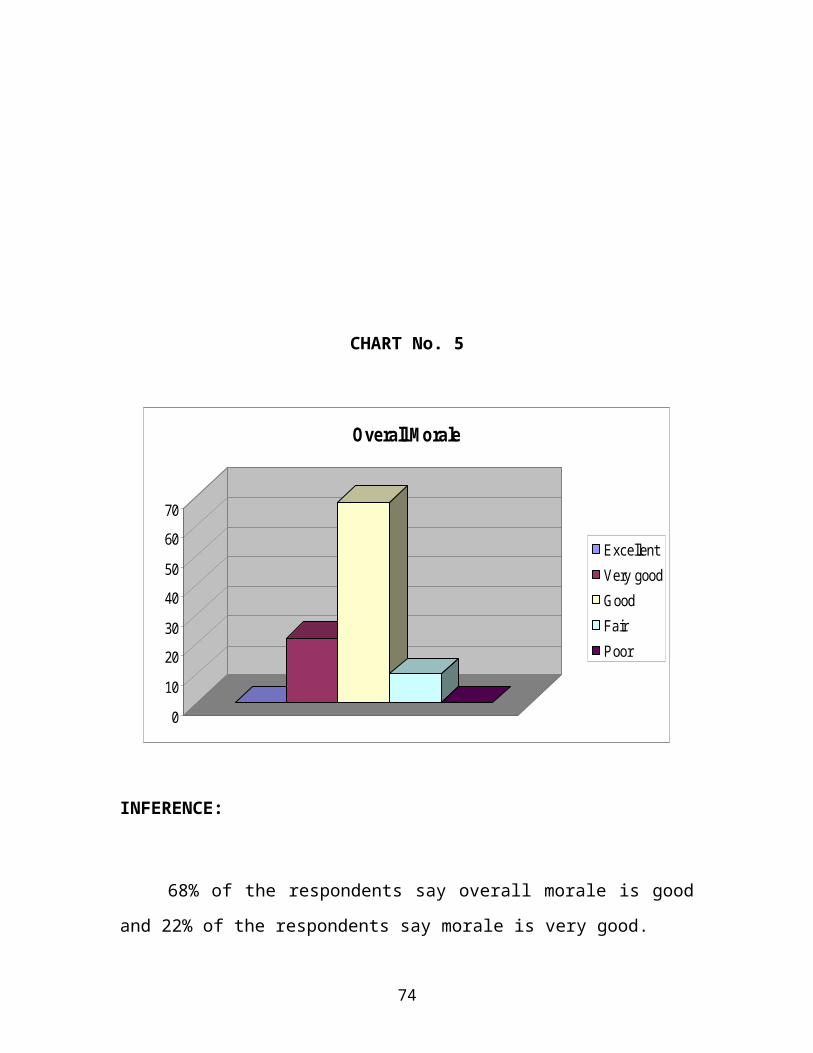
INFERENCE:
68% of the respondents say overall morale is good and 22% of the
respondents say morale is very good.
51

CHART No. 5
0
10
20
30
40
50
60
70
Overall Morale
Excellent
Very good
Good
Fair
Poor
excellent very good good fair poor
INFERENCE:
68% of the respondents say overall morale is good and 22% of the
respondents say morale is very good.
52

TABLE No. 6
SATISFACTION REGARDING FOOD FACILITIES PROVIDED IN THE COMPANY
Particulars No.of respondents Percentage
Highly satisfied 58 58
Satisfied 32 32
Neither satisfied nor dissatisfied 7 7
dissatisfied 3 3
Highly dissatisfied 0 0
TOTAL 100 100
INFERENCE:
Among the food facilities provided 58% of respondents are highly satisfied
with food facilities and 7% of respondents are neither satisfied nor dissatisfied
with food facilities.
CHART No. 6
53

0
10
20
30
40
50
60
Satisfied with food facilities Provided in the company
Highly Satisfied
Satisfied
Neither satisfied nordissatisfied
Dissatisfied
Highly dissatisfied
highly satisf ied satisf ied neutral dissatisf ied highly dissatisf ied
INFERENCE:
Among the food facilities provided 58% of respondents are highly satisfied
with food facilities and 7% of respondents are neither satisfied nor dissatisfied
with food facilities.
54

TABLE No. 7
EMPLOYEES LIKES WHICH IS LEAST ABOUT THE COMPANY
Particulars No.of respondents Percentage
Shifts 26 26
Salary 34 34
Attitude of supervisors 30 30
Management 10 10
TOTAL 100 100
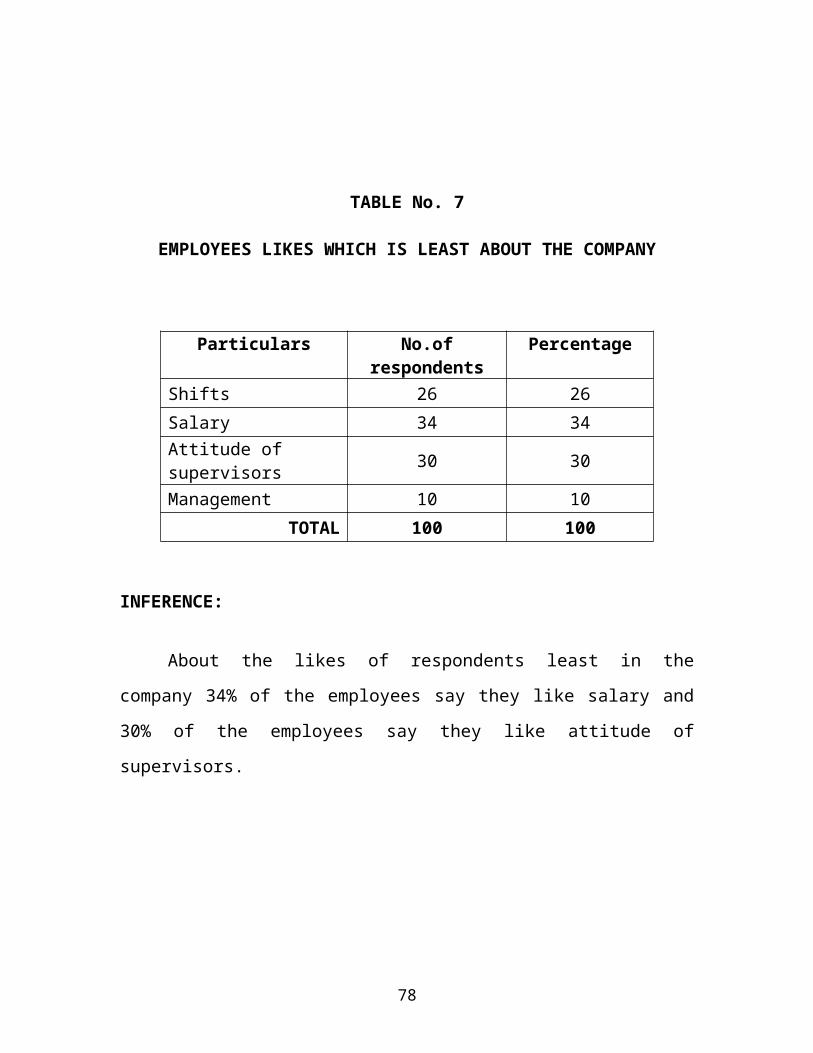
INFERENCE:
About the likes of respondents least in the company 34% of the employees
say they like salary and 30% of the employees say they like attitude of supervisors.
CHART No. 7
55

0
5
10
15
20
25
30
35
Like least about the company
Shifts
Salary
Attitude ofsupervisors
Management
shifts salary managementattitude of
supervisors
INFERENCE:
About the likes of respondents least in the company 34% of the employees
say they like salary and 30% of the employees say they like attitude of supervisors.
TABLE No. 8
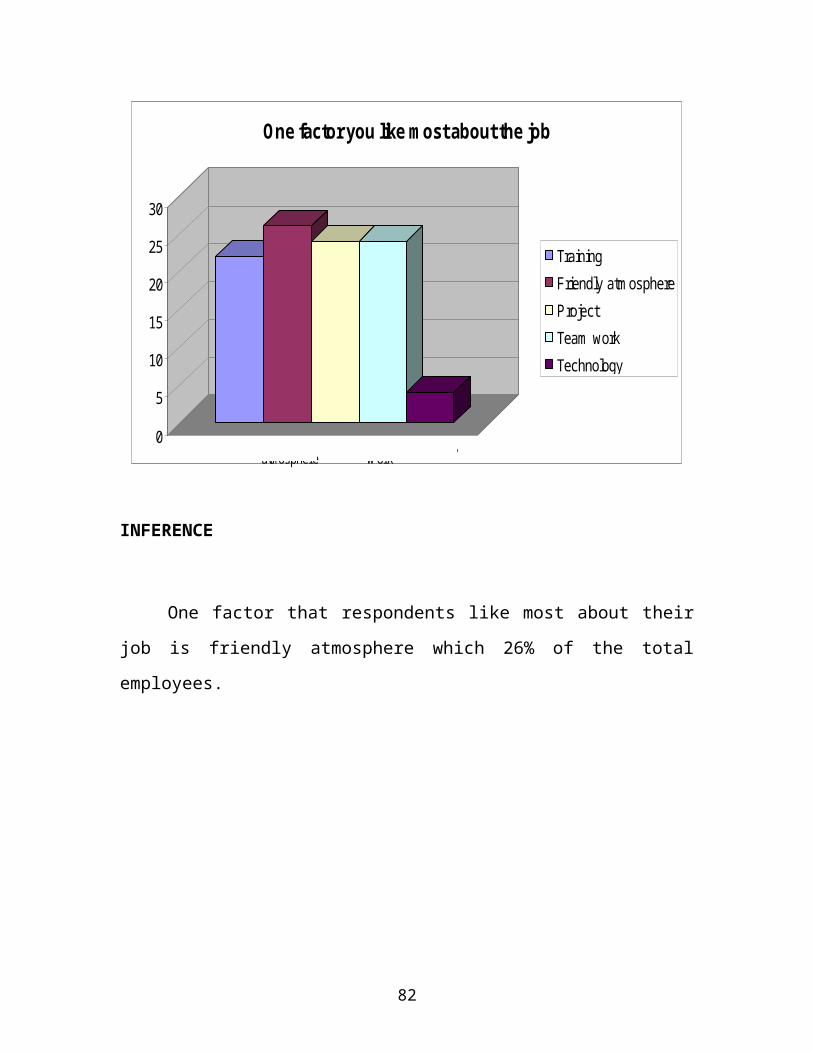
ONE FACTOR THAT EMPLOYEES LIKE MOST ABOUT THEIR JOB
56

Particulars No.of respondents Percentage
Training 22 22
Friendly Atmosphere 26 26
Project 24 24
Team Work 24 24
Technology 4 4
TOTAL 100 100
INFERENCE
One factor that respondents like most about their job is friendly atmosphere
which 26% of the total employees.
CHART No. 8
57

0
5
10
15
20
25
30
One factor you like most about the job
Training
Friendly atmosphere
Project
Team work
Technology
training project technologyfriendly
atmosphereteam w ork
INFERENCE
One factor that respondents like most about their job is friendly atmosphere
which 26% of the total employees.
TABLE No. 9
58

ONE FACTOR THAT EMPLOYEES LIKE LEAST ABOUT THEIR JOB
Particulars No.f respondents Percentage
Salary 14 14
Attitude 10 10
Stress 48 48
Employee Care 14 14
Growth Opportunities
14 14
TOTAL 100 100
INFERENCE:
One factor that employees like least about their job is stress and
respondents for that is 48%.
CHART No. 9
59

0
10
20
30
40
50
One factor that you like least about the job
Salary
Attitude
Stress
Employee care
Growth opportunities
salary attitude stressemployee
caregrow th
opportunities
INFERENCE:
One factor that employees like least about their job is stress and
respondents for that is 48%.
TABLE No. 10
60

OPINION OF EMPLOYEES REGARDING MEDICAL FACILITIES PROVIDED BY THE ORGANIZATION INCASE OF MINOR INJURIES
Particulars No.f respondents Percentage
Yes 72 72
No 28 28
TOTAL 100 100
INFERENCE:
Among the total respondents 72% of them say that proper medical facilities
provided by the company for injuries and 28% of the respondents say that proper
medical facilities are not provided by the company.
CHART No. 10
61

0
20
40
60
80
Whether medical facilities are provided by the organization incase of minor injuries
yes
no
YES NO
INFERENCE:
Among the total respondents 72% of them say that proper medical facilities
provided by the company for injuries and 28% of the respondents say that proper
medical facilities are not provided by the company.
TABLE No. 11
62

OPINION ABOUT EMPLOYEES WORK PRESSURE LEVEL
Particulars No.f respondents Percentage
Heavy 28 28
Achievable 36 36
Normal 36 36
TOTAL 100 100
INFERENCE:
Among the total respondents work pressure level is achievable and normal
and 36% of respondents agree to it and 28% of the respondents feel that work
pressure is heavy.
CHART No. 11
63

0
5
10
15
20
25
30
35
40
Opinion about work pressure level
heavy
achievable
normal
heavy achievable normal
INFERENCE:
Among the total respondents work pressure level is achievable and normal
and 36% of respondents agree to it and 28% of the respondents feel that work
pressure is heavy.
TABLE No. 12
64

OPINION OF EMPLOYEES ABOUT ATTRITION REGARDING SHIFT BASIS
Particulars No.of respondents Percentage
First Shift 34 34
Second Shift 66 66
TOTAL 100 100
INFERENCE:
Among the total respondents 34% of them say attrition is because of first
shift and 66% of the respondents say it is because of second shift.
CHART No. 12
65

0
10
20
30
40
50
60
70
Is the attrition is mostly because of the shift basis
First Shift
Second Shift
first shift second shift
INFERENCE:
Among the total respondents 34% of them say attrition is because of first
shift and 66% of the respondents say it is because of second shift.
TABLE No. 13
66

OPINION ABOUT EMPLOYEES WAGE RELATED TO WORK
Particulars No.of respondents Percentage
More than enough 0 0
Sufficient 62 62
Insufficient 38 38
TOTAL 100 100
INFERENCE:
62% of the respondents among the total say that wage related to work is
sufficient and 38% of them say that wage related to work is insufficient
CHART No. 13
67

0
10
20
30
40
50
60
70
Opinion about your wage related to work
More than enough
Sufficient
In sufficient
more than enough sufficient insuff icient
INFERENCE:
62% of the respondents among the total say that wage related to work is
sufficient and 38% of them say that wage related to work is insufficient
68

TABLE No. 14
OPINION OF EMPLOYEES ABOUT THE ATTENDANCE INCENTIVES
Particulars No.of respondents Percentage
Yes 78 78
No 22 22
TOTAL 100 100
INFERENCE:
78% of the total respondents say that attendance incentives is provided by
the organization and 22% of the respondents say that it is not provided.
CHART No. 14
69

0
20
40
60
80
Whether attendence incentives is provided by the organization
yes
no
YES NO
INFERENCE:
78% of the total respondents say that attendance incentives is provided by
the organization and 22% of the respondents say that it is not provided.
TABLE No. 15
70

OPINION OF EMPLOYEES ABOUT ATTRITION DUE TO HEAVY WORKLOAD
Particulars No.of respondents Percentage
Strongly Agree 22 22
Agree 52 52
Neutral 24 24
Disagree 2 2
Strongly Disagree 0 0
TOTAL 100 100
INFERENCE:
Attrition occurs due to heavy workload and 52% of the total respondents
agree to that and 24% of the respondents say that it is neutral
CHART No. 15
71

0
10
20
30
40
50
60
Do you agree that the attrition occurs due to heavy workload
Strongly Agree
Agree
Neutral
Dissagree
Strongly Dissagree
strongly agree agree neutral dissagree
strongly disagree
INFERENCE:
Attrition occurs due to heavy workload and 52% of the total respondents
agree to that and 24% of the respondents say that it is neutral
TABLE No. 16
72

THE RELATIONSHIP BETWEEN EMPLOYER AND EMPLOYEES WILL REDUCE ATTRITION.
Particulars No.of respondents Percentage
Strongly Agree 30 30
Agree 52 52
Neutral 16 16
Disagree 2 2
Strongly Disagree 0 0
TOTAL 100 100
INFERENCE:
Among the total respondents 52% of them agree that the relationship
between employer and employee will reduce attrition and 30% of the respondents
strongly agree that the relationship between employer and employee will reduce
attrition.
CHART No. 16
73
0
10
20
30
40
50
60
The relationship between employer and employee will reduce attrition
Strongly agree
Agree
Neutral
Disagree
Strongly disagree
strongly agree
agree neutral disagreeStrongly
dissagree
INFERENCE:
Among the total respondents 52% of them agree that the relationship
between employer and employee will reduce attrition and 30% of the respondents
strongly agree that the relationship between employer and employee will reduce
attrition.
TABLE No. 17
MOST LIKE ABOUT THE COMPANY
74

FACTORS STRONGLY AGREE
AGREE NEUTRAL DISSAGREE STRONGLY AGREE
Gained Knowledge, Technology, Networking
0 42 54 4 0
The Work/ Open culture was best
4 40 52 4 0
The Employee care was excellent
0 66 34 0 0
Strongly Agree : 5Agree : 4Neutral : 3Dissagree : 2Strongly Dissagree : 1
CALCULATION:Gained Knowledge, Technology, Networking=(0*5) + (42*4) + (54*3) + (4*2) + (0*1)/100 = 3.38
The work/ Open culture was best=(4*5) + (40*4) + (52*3) + (4*2) + (0*1)/100 = 3.44
The Employee care was excellent=(0*5) + (66*4) + (34*3) + (0*2) + (0*1)/100 = 3.66
INFERENCE:
Majority of employees feel that employee care was excellent.
TABLE No. 18
SUPERVISOR CARE TOWARDS EMPLOYEES
75

FACTOR ALWAYS USUALLY SELDOM NEVERListened to suggestions
6 54 45 0
Treated you fairly
0 64 36 0
Gave performance feedback
6 58 32 4
Coached Trained and developed you
2 58 38 2
ALWAYS : 4USUALLY : 3SELDOM : 2NEVER : 1
CALCULATION:Listened to suggestions=(6*4) + (54*3) + (45*2) + (0*1)/100 = 2.76
Treated you Fairly=(0*4) + (64*3) + (36*2) + (0*1)/100 = 2.64
Gave performance feedback=(6*4) + (58*3) + (32*2) + (4*1)/100 = 2.66
Coached , Trained and developed you=(2*4) + (58*3) + (38*2) + (2*1)/100 = 2.6
INFERENCE
Majority of employees suggestions were taken into considerations by the supervisors.
CHI SQUARE TEST
TABLE No. 19
76

RELATIONSHIP BETWEEN EMPLOYER AND EMPLOYEE ATTRITION WITH RESPECT TO WORK EXPERIENCE
Null Hypothesis(H0):
There is no significant difference between employer and employee attrition
with respect to work Experience.
Alternate Hypothesis(H1):
There is significant difference between employer and employee attrition
with respect to work Experience.
PARTICULARS STRONGLY AGREE
AGREE NEUTRAL DISSAGREE STRONGLY DISSAGREE
TOTAL
<1YEAR 4 2 0 0 0 61-3 22 32 12 2 0 683-6 4 14 6 0 0 246-9 0 2 0 0 0 2>9 YEARS 0 0 0 0 0 0
TOTAL 30 50 18 2 0 100
S.NO Oi Ei (Oi-Ei)^2/Ei
1. 4 1.8 2.6882. 2 3 0.3333. 22 20.4 0.1254. 32 34 0.1175. 12 12.24 0.0046. 2 1.36 0.3017. 4 7.2 1.4228. 14 12 0.3339. 6 4.32 0.65310. 2 1 1
6.976
77
Degree of Freedom = 16;
Level of significance is at 5% ;
Calculated value of X = 6.976
Table Value X = 26.296
Calculated value < Table value
Hence Null Hypothesis is accepted.
INFERENCE:
There is no significant difference between employer and employee attrition
with respect to work experience
CHAPTER - VI
6.1.1FINDINGS
78

After the detailed study, the collected information and data was analyzed. A
lot of valuable findings were found common towards at LUCAS TVS are as
explained below.:
68% of the respondents are having 6-9 years experience and 24% of
respondents are having 1-3 years experience
38% of the respondents prefer less growth opportunity and 20% of the
respondents triggered Personal reasons and only 18% of respondents
triggered Benefits- salary, Incentives and health to leave the company.
48% of the respondents believe that the orientation process in the
organization is good and 26% of respondents says very good and 24%
respondents says fair.
48% of the respondents are treated good and 30% of the employees treated
fairly and 20% of the employees are treated very good.
68% of the respondents say that the overall morale is good.
58% of the respondents are highly satisfied with food facilities provided
and 7% of respondents neither satisfied nor dissatisfied and no respondent
is highly dissatisfied with this.
34% of the employees least like the salary and 30% of the employees least
like their attitude of superiors and 26% of the employees with their shift
pattern and only 10% of the respondents least like about their management.
One factor that most like about the job is friendly atmosphere and the
respondents are 26%.
79

48% of the respondents least like stress in their job.
72% of the respondents say that proper medical facilities are provided by
the organization incase of minor injuries where only 28% of the
respondents says that medical facilities are not provided.
Feel that work pressure is heavy.
Yes the attrition because of the shift basis and 66% of attrition because of
second shift and 34% of attrition because of first shift.
62% of them say that wage related to work is sufficient and 38% of them
say that wage related to work is insufficient.
78% of the respondents say that attentence incentives is provided by the
organization where only 22% of the respondents say it is not provided.
52% of the employees agree that the attrition occurs due to heavy workload
and 24% of the respondents say that it is neutral.
52% of the respondents agree with the relationship between employer and
employees will reduce attrition.
80

6.2 SUGGESTIONS AND RECOMMENDATIONS
An overview of the study carried out to analyze a set of characteristics that
describe organizations. The following suggestions, which can avoid attrition in the
organization, are as follows:
Transport facilities can be provided.
Work pressure can be reduced to make employees to feel
comfortable in their work.
The relationship between employer and employee should be
more so that we can reduce the attrition level in the
organization.
Work load to the employees should be reduced.
Stress in the work should be reduced.
81
6.3 CONCLUSION
In the contemporary corporate world, success of an organization comes
from its people and it is irrespective of the nature of their job. Labour Turnover
analysis is one of the factors that help the organization to achieve this success.
LUCAS TVS is one among the organizations which give atmost importance
to is people. LUCAS TVS values its human resources much more than anything,
Despite such efforts, the study indicates that for a few aspects regarding the topic
there should be a change. These findings do not hold back the labour turnover
employees prevailing in the organization. On the other hand the changes if
implemented will definitely lift up the existing position.
82

6.4 SCOPE FOR FURTHER RESEARCH
This study can act as a base for any researcher who would like to carry a
research in Labour turnover analysis. Very few dimensions have been analysed in
this study due to limited time frame. There are more dimensions like participative
management, safety, security, etc. to be analysed and this is a clear indication that
there is a great scope for further research. Moreover, present employee’s
perception is subject to variation over a period of time. This study though relevant
now may not be applicable after a period of time.
83

BIBLIOGRAPHY
Books referred:
C.R Kothari,(2002), “Research Methodology”, Vishwa Prakashan.
Gupta and Gupta,(2001), “Practical statistics” , Oscar Publications
LUCAS TVS company manuals
Websites browsed:
http://www.academicjournals.org/ajbm
http://www.lucas-tvs.com
http://www.economywatch.com
84