study on the interaction of nd3+ with human serum albumin at molecular level
TRANSCRIPT

Study on the Interaction of Nd3+
with Human Serum Albumin at Molecular
Level
Dong Yuan,a,b Zhong-Lan Shen,c Ru-Tao Liu,a,* Pei-Hai Weib and Can-Zhu Gaoa
aShandong Key Laboratory of Water Pollution Control and Resource Reuse, School of Environmental Science
and Engineering, Shandong University, China -America CRC for Environment & Health, Shandong Province,
Jinan 250100, P. R. ChinabDepartment of Chemistry and Chemical Engineering, Qilu Normal University, Shandong Province,
Jinan 250013, P. R. ChinacShandong Supervision and Inspection Institute for Product Quality, Shandong Province,
Jinan 250100, P. R. China
Received January 27, 2011; Accepted April 11, 2011; Published Online April 20, 2011
Neodymium is applied widely in agriculture to improve crop nutrition and incidentally in fertilizers,
yet little is known of its effect on the biological function of human serum albumin (HSA). The interaction
of Nd3+ to HSA has been investigated mainly by fluorescence spectra, UV–vis absorption spectra and cir-
cular dichroism (CD) under simulative physiological conditions. Fluorescence data revealed that the
quenching mechanism of HSA by Nd3+ was a static quenching process and the binding constant is 5.71 ×
104 L mol-1 and the number of binding sites is 1 at 292 K. The thermodynamic parameters (�H0 = -20.79 kJ
mol-1, �G0 = -26.58 kJ mol-1, and �S0 = 19.85 J mol-1 K-1) indicate that electrostatic effect between the pro-
tein and Nd3+ is the main binding force. The distance r = 2.91 nm between donor (HSA) and acceptor
(Nd3+) was obtained according to Förster’s nonradiative energy transfer. In addition, UV–vis, CD and syn-
chronous fluorescence results showed that the addition of Nd3+ changed the conformation of HSA.
Keywords: Neodymium; Human serum albumin; Fluorescence spectra; UV–vis absorption spectra.
INTRODUCTION
Neodymium is the second most abundant of the rare-
earth elements and is found in minerals that include all
lanthanide minerals, such as monazite and bastnasite. Sci-
entists have done considerable research on the application
of Neodymium to improve crop production.1,2 The benefi-
cial effects may be due to the stimulatory effects of Nd3+ on
nutrient uptake by plants or the increased synthesis of chlo-
rophyll in the plant.3 As a result, Neodymium is now
widely used in increasing quantities by Chinese agricultur-
ists.1,2,4,5 While a good deal of research has been done on
the improved nutrition of crops after application of Neo-
dymium, much less attention has been paid to interaction of
Neodymium to organisms. As Neodymium level of expo-
sure increased, a corresponding increase of Neodymium
occurred in the tissues.6 The effect of Neodymium on dis-
tributions and accumulations in various tissues, especially
in the liver, lung, bone and kidney of people and animals
has been reported,6-10 but few papers have focused on the
interactions of Neodymium with serum albumin through
multi-spectroscopic techniques.
Human serum albumin (HSA), the most abundant
protein in blood plasma,11,12 is involved in the transport of a
variety of endogenous and exogenous ligands such as
drugs and chemical contaminants.13,14 Transportation, dis-
tribution, and physiological and toxicological actions of
chemical contaminants in vivo are closely related to their
binding with proteins, and the binding of the contaminants
with active sites of the proteins can change their structure
and function and cause toxic effects.15-18 Therefore, the
studies on the interaction between the ligands and HSA
have been an important research field in chemistry, life
sciences and clinical medicine.
In this paper, we use fluorescence, UV-vis absorption
and CD spectra to explore the interactions between Nd3+
and HSA under simulative physiological conditions, and
determine their binding constants, binding sites, the dis-
tance, and the impact on the conformational structures of
568 Journal of the Chinese Chemical Society, 2011, 58, 568-574
* Corresponding author. Tel/Fax: (+86)-531-88364868; E-mail: [email protected]

HSA. This report provides a new approach to explore the
biological interaction of Neodymium on the functional
macrobiomolecular level.
EXPERIMENTAL
Reagents
HSA (Sigma) was dissolved in ultrapure water to
form a 2.0 × 10⁻⁵ mol L-1 solution, then preserved at 0~4 °C
and diluted as required. NdCl3 is acquired from Shanghai
TianQi Chemical Co., Ltd (China). It is the source of Nd3+
and [Nd3+] ranges from 1.0 × 10⁻⁵ mol L-1 to 1.0 × 10⁻⁴ mol
L-1. Physiological buffer (Tris-saline buffer) was 0.1 mol
L-1 Tris-HCl with 0.1 mol L-1 NaCl, pH 7.4.
The other common chemicals were obtained from
commercial sources. Ultrapure water was used throughout.
Apparatus
Fluorescence spectra were recorded on an F-4600
Spectrofluorimeter (Hitachi, Japan) equipped with a xenon
lamp light source and 1.0 cm quartz cells. The absorption
spectra were collected at room temperature on a UV-2450
Spectrophotometer (Shimadzu, Kyoto, Japan) in 1.0 cm
quartz cells. Circular dichroism (CD) spectra were mea-
sured by a J-810 Spectropolarimeter (Jasco, Tokyo, Japan)
at room temperature under constant nitrogen flush. The pH
was measured with a pHs-3C acidometer (Shanghai Peng-
shun Scientific Instrument Co., Ltd.).
Methods
For the fluorescence measurement, 0.5 mL physio-
logical buffer (0.1 mol L-1, pH 7.4), 0.5 mL HSA (1.0 × 10⁻⁵
mol L-1) and various amounts of Nd3+ solution were added
to a 5.0 mL colorimetric tube in sequence, then diluted with
ultrapure water to 5.0 mL and incubated for 30 min to
equilibrate the system. The equilibrated solution was trans-
ferred into the quartz cells for detection. The correspond-
ing fluorescence emission spectra were recorded from 290
to 500 nm using an excitation wave length of 280 nm. The
excitation and emission slit widths were set at 5 nm. Scan
speed was 1200 nm/min. PMT (Photo Multiplier Tube)
voltage was 400 V.
The synchronous fluorescence spectra were obtained
through simultaneous scanning of the excitation (�ex = 280
nm) and emission monochromators while maintaining a
constant wavelength interval between them (��, 15 nm and
60 nm). The excitation and emission slit widths were set at
5 nm. Scan speed was 1200 nm/min. PMT voltage was
fixed at 400 V.
To measure the UV–vis absorption spectra, 1.0 mL
physiological buffer (0.1 mol L-1, pH 7.4), 2.0 mL HSA
(1.0 × 10⁻⁵ mol L-1) and various amounts of Nd3+ solution
were added to 10 mL colorimetric tubes in sequence, then
diluted with ultrapure water to the mark. After 30 min, the
equilibrated solution was poured into the quartz cells and
the spectrum was recorded in the range of 200-300 nm.
CD measurements of HSA in the presence and ab-
sence of Nd3+ were made over the range of 190-260 nm at a
scan rate of 200 nm/min.
RESULTS AND DISCUSSION
The influence of Nd3+
on HSA structure evaluated by
fluorescence spectra
HSA has three intrinsic fluorophores: tryptophan, ty-
rosine and phenylalanine.19 Because the quantum yield of
phenylalanine is very low and the fluorescence of tyrosine
is almost totally quenched, the intrinsic fluorescence of
HSA is almost entirely due to tryptophan (Trp-214).20,21 By
analyzing the fluorescence spectrum, we can obtain infor-
mation about the interactions between HSA and Nd3+ such
as the quenching mechanism, binding constant and binding
sites.
We measured the fluorescence emission spectra of
HSA at a series of concentrations of Nd3+ in 0.01 mol L-1
physiological buffer (pH 7.4) by fixing the excitation
wavelength at 280 nm (Fig. 1). The fluorescence intensity
Interaction of Nd3+ with Bovine Serum Albumin J. Chin. Chem. Soc., Vol. 58, No. 4, 2011 569
Fig. 1. The influence of Nd3+ on the fluorescence emis-
sion spectra of HSA. The inset shows the fluo-
rescence intensities of the peak vs the Nd3+ con-
centration. Conditions: HSA 1.0 × 10⁻⁶ mol L-1;
Nd3+: (a) 0, (b) 1.0 × 10⁻⁶, (c) 2.0 × 10⁻⁶, (d) 4.0
× 10-6, (e) 6.0 × 10⁻⁶, (f) 1.0 × 10⁻⁵ mol L-1; pH
7.4, T = 292 K, �ex = 280 nm.
of HSA at the emission peak decreased regularly and the
maximum emission wavelength underwent a blue shift
from 336.2 nm to 331.8 nm when Nd3+ were added. This
suggests that interactions occur between HSA and Nd3+.
The influence of Nd3+
on HSA structure evaluated by
UV-vis absorption spectra
UV-vis absorption spectroscopy technique can be
used to explore the structural changes of protein and to in-
vestigate protein-ligand complex formation. HSA has two
main absorption bands. One is located in the range of 200-
220 nm, which is the skeleton absorption peak, and the
other is in the range of 260-300 nm, which is the absorption
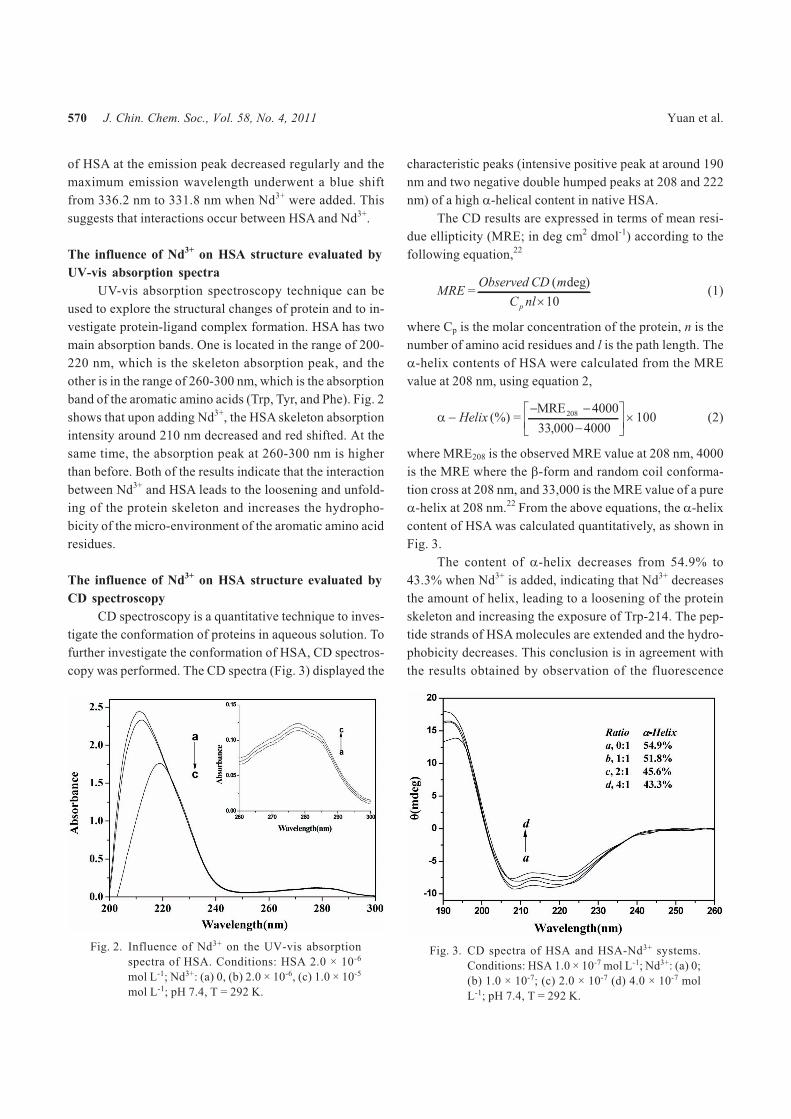
band of the aromatic amino acids (Trp, Tyr, and Phe). Fig. 2
shows that upon adding Nd3+, the HSA skeleton absorption
intensity around 210 nm decreased and red shifted. At the
same time, the absorption peak at 260-300 nm is higher
than before. Both of the results indicate that the interaction
between Nd3+ and HSA leads to the loosening and unfold-
ing of the protein skeleton and increases the hydropho-
bicity of the micro-environment of the aromatic amino acid
residues.
The influence of Nd3+
on HSA structure evaluated by
CD spectroscopy
CD spectroscopy is a quantitative technique to inves-
tigate the conformation of proteins in aqueous solution. To
further investigate the conformation of HSA, CD spectros-
copy was performed. The CD spectra (Fig. 3) displayed the
characteristic peaks (intensive positive peak at around 190
nm and two negative double humped peaks at 208 and 222
nm) of a high �-helical content in native HSA.
The CD results are expressed in terms of mean resi-
due ellipticity (MRE; in deg cm2 dmol-1) according to the
following equation,22
MRE =Observed CD m
C nlp
( deg)
� 10(1)
where Cp is the molar concentration of the protein, n is the
number of amino acid residues and l is the path length. The
�-helix contents of HSA were calculated from the MRE
value at 208 nm, using equation 2,
� � Helix (%) =� �
��
��
�MRE
2084000
33 000 4000,� 100 (2)
where MRE208 is the observed MRE value at 208 nm, 4000
is the MRE where the �-form and random coil conforma-
tion cross at 208 nm, and 33,000 is the MRE value of a pure
�-helix at 208 nm.22 From the above equations, the �-helix
content of HSA was calculated quantitatively, as shown in
Fig. 3.
The content of �-helix decreases from 54.9% to
43.3% when Nd3+ is added, indicating that Nd3+ decreases
the amount of helix, leading to a loosening of the protein
skeleton and increasing the exposure of Trp-214. The pep-
tide strands of HSA molecules are extended and the hydro-
phobicity decreases. This conclusion is in agreement with
the results obtained by observation of the fluorescence
570 J. Chin. Chem. Soc., Vol. 58, No. 4, 2011 Yuan et al.
Fig. 2. Influence of Nd3+ on the UV-vis absorption
spectra of HSA. Conditions: HSA 2.0 × 10⁻⁶
mol L-1; Nd3+: (a) 0, (b) 2.0 × 10⁻⁶, (c) 1.0 × 10⁻⁵
mol L-1; pH 7.4, T = 292 K.
Fig. 3. CD spectra of HSA and HSA-Nd3+ systems.
Conditions: HSA 1.0 × 10⁻⁷ mol L-1; Nd3+: (a) 0;
(b) 1.0 × 10⁻⁷; (c) 2.0 × 10⁻⁷ (d) 4.0 × 10⁻⁷ mol
L-1; pH 7.4, T = 292 K.

spectroscopy and UV-vis absorption spectra.
The influence of Nd3+
on HSA structure evaluated by
Synchronous fluorescence spectroscopy
The synchronous fluorescence spectroscopy can give
information about the molecular environment in the vicin-
ity of the chromospheres. When the wavelength intervals
(��) were stabilized at 15 and 60 nm, the synchronous fluo-
rescence gives the characteristic information of tyrosine
residues and tryptophan residue, respectively.
The synchronous fluorescence spectra of HSA with
various amounts of Nd3+ in Fig. 4(A) show that the emis-
sion peaks do not shift over the investigated concentration
range, which indicates that Nd3+ has little effect on the
microenvironment of the tyrosine residues in HSA. In Fig.
4(B), the emission maximum of the tryptophan residue
shows a slight blue shift (from 277.8 to 276.0 nm), which
indicates that the conformation of HSA was changed such
that the polarity around Trp-214 decreased and the hydro-
phobicity was increased.
The fluorescence quenching mechanism
Fluorescence quenching mechanisms are usually
classified into dynamic quenching and static quenching.
For dynamic quenching, as the temperature of the system
rises, the effective collision times between molecules, the
energy transfer efficiency, and the fluorescence quenching
constants of substances will all increase. For static quench-
ing, increased temperature reduces the stability of the com-
plex formed, resulting in a reduced quenching constant.23
If the fluorescence quenching is dynamic quenching
caused by inter-molecular collisions, it should follow the
well-known Stern–Volmer equation:
F
F
0 = 1 + K Qsv [ ]= 1 + kq 0[ ]Q (3)
where, F0 and F are the steady-state fluorescence intensities
in the absence and presence of quencher (Nd3+), respec-
tively; kq is the quenching rate constant of the biological
macromolecule; 0 is the fluorescence lifetime of the sys-
tem in the absence of quencher; Ksv is the Stern–Volmer
quenching constant;23 and [Q] is the concentration of Nd3+.
Fluorescence intensity data were analyzed by plotting
F0/F versus [Q] at 292 K and 302 K (Fig. 5), and Ksv of the
two systems were calculated as 1.393 × 10⁵ L mol-1 and
1.106 × 10⁵ L mol-1. The Stern–Volmer quenching constant
Ksv is inversely correlated with temperature. So we prelimi-
narily conclude that this quenching process is static quench-
Interaction of Nd3+ with Bovine Serum Albumin J. Chin. Chem. Soc., Vol. 58, No. 4, 2011 571
Fig. 4. Synchronous fluorescence spectra of HSA: (A)
�� = 15 nm; (B) �� = 60 nm. Conditions: HSA:
1 × 10⁻⁶ mol L-1; Nd3+: (a) 0, (b) 1.0 × 10⁻⁶, (c)
2.0 × 10⁻⁶, (d) 4.0 × 10⁻⁶, (e) 6.0 × 10⁻⁶, (f) 1.0 ×
10-5mol L-1; pH 7.4, T = 292 K.Fig. 5. Stern–Volmer plots of Nd3+ interactions with
HSA at 292 K and 302 K.

ing.
The fluorescence lifetime of the biopolymer is 10-8 s.
Using 10-8 s as the lifetime, kq at 292 K and 302 K were cal-
culated to be 1.393 × 10¹³ L mol-1 s-1 and 1.106 × 10¹³ L
mol-1 s-1, respectively. Because the maximum scatter colli-
sion quenching constant of various quenchers with bio-
polymers is usually 2.0 × 10¹⁰ L mol-1 s-1, apparently, the
quenching rate constants, kq, at 292 K and 302 K are far
greater than the maximum scatter collision quenching con-
stant. This result again indicates that the quenching mecha-
nism of the reaction between HSA and Nd3+ belongs to
static quenching.
Binding constant and the number of binding site
For a static quenching interaction, the experimental
data can be processed using the following formula:24
log( )F F
F
0�
= log K a + n log[Q] (4)
where F0, F and [Q] are the same as in equation (3), n is the
number of binding sites, and Ka is the binding constant. Ac-
cording to a plot of log(F0-F)/F versus log[Q] (Fig. 6) the
binding constant at 292 K is 5.71 × 10⁴ L mol-1 and the
number of binding sites is 0.92. At 302 K, the binding con-
stant is 4.30 × 10⁴ L mol-1 and the number of binding sites is
0.91.
The interaction forces between Nd3+
and HSA
The acting forces between small organicmolecules
and biomolecules include hydrogen bonds, van der Waals
interactions, electrostatic forces, and hydrophobic interac-
tion forces. If the temperature changes little, the reaction
enthalpy change (�H0) is regarded as a constant. The inter-
action parameters can be calculated on the basis of the van’t
Hoff equation:
ln( )
( )
K
K
a
a
2
1
�
���
�
��� =
1 1
1 2T T
��
���
�
���
�H
R
0�
���
�
��� (5)
and thermodynamic equations:
�G 0 = �H 0 � T�S 0 = �RT ln K (6)
where (Ka)1 and (Ka)2 are the binding constants (analogous
to Ka in Eq. (4)) at T1 and T2, and R is the universal gas con-
stant. �G0 and �S0 are the free-energy change and the en-
tropy change of the binding reaction, respectively.25
If �H0 �0, �S0 > 0, the main force is hydrophobic in-
teraction; if �H0 < 0, �S0 > 0, the main force is electro-
static; if �H0 < 0, �S0 < 0, van der Waals and hydrogen
bond interactions play major roles in the reaction.26 The
calculated thermodynamic parameters and Ka values for
the binding interaction between Nd3+ and HSA are listed in
Table 1. �H0 = -20.79 kJ mol-1 and �S0 = 19.85 J mol-1 K-1,
which indicate that the electrostatic effect plays the major
role during their interaction. Since �G0 is also less than 0,
the interaction between Nd3+ and HSA is spontaneous.
Energy transfer between Nd3+
and HSA
In order to investigate the mechanism of interaction
between Nd3+ and HSA, Förster’s nonradiative energy
transfer theory was adopted. The efficiency of energy trans-
fer can be used to evaluate the distance between a ligand
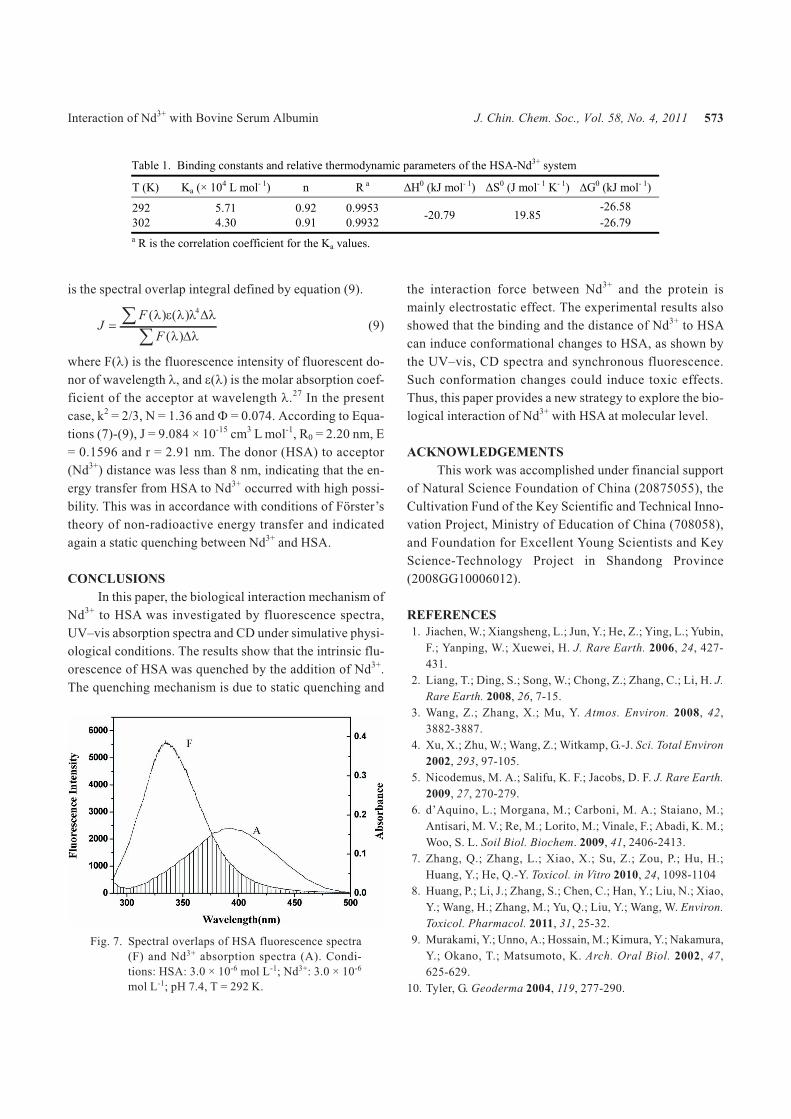
and the tryptophan residues in a protein. The overlap of the
UV-vis absorption spectra of Nd3+ with the fluorescence
emission spectra of HSA is shown in Fig. 7. According the
energy transfer theory, the efficiency of energy transfer E,
the critical distance for 50% energy transfer R0 and the ac-
tual distance of separation r can be calculated from the fol-
lowing equations (7)-(9).
EF
F� �1
0
=R
R r
0
6
0
6 6�(7)
R0
6 � 8.79 � 10-25k N J2 4� � (8)
where k2 is the orientation factor, � is the fluorescence
quantum yield of the donor and N is the refractive index of
the medium intervening between the donor and acceptor. J
572 J. Chin. Chem. Soc., Vol. 58, No. 4, 2011 Yuan et al.
Fig. 6. Double-reciprocal curve of the fluorescence in-
tensity at 292 K and 302 K.
is the spectral overlap integral defined by equation (9).
J �F
F
( ) ( )
( )
� � � � �
� �
4�
��
�(9)
where F(�) is the fluorescence intensity of fluorescent do-
nor of wavelength �, and �(�) is the molar absorption coef-
ficient of the acceptor at wavelength �.27 In the present
case, k2 = 2/3, N = 1.36 and � = 0.074. According to Equa-
tions (7)-(9), J = 9.084 × 10⁻¹⁵ cm3 L mol-1, R0 = 2.20 nm, E
= 0.1596 and r = 2.91 nm. The donor (HSA) to acceptor
(Nd3+) distance was less than 8 nm, indicating that the en-
ergy transfer from HSA to Nd3+ occurred with high possi-
bility. This was in accordance with conditions of Förster’s
theory of non-radioactive energy transfer and indicated
again a static quenching between Nd3+ and HSA.
CONCLUSIONS
In this paper, the biological interaction mechanism of
Nd3+ to HSA was investigated by fluorescence spectra,
UV–vis absorption spectra and CD under simulative physi-
ological conditions. The results show that the intrinsic flu-
orescence of HSA was quenched by the addition of Nd3+.
The quenching mechanism is due to static quenching and
the interaction force between Nd3+ and the protein is
mainly electrostatic effect. The experimental results also
showed that the binding and the distance of Nd3+ to HSA
can induce conformational changes to HSA, as shown by
the UV–vis, CD spectra and synchronous fluorescence.
Such conformation changes could induce toxic effects.
Thus, this paper provides a new strategy to explore the bio-
logical interaction of Nd3+ with HSA at molecular level.
ACKNOWLEDGEMENTS
This work was accomplished under financial support
of Natural Science Foundation of China (20875055), the
Cultivation Fund of the Key Scientific and Technical Inno-
vation Project, Ministry of Education of China (708058),
and Foundation for Excellent Young Scientists and Key
Science-Technology Project in Shandong Province
(2008GG10006012).
REFERENCES
1. Jiachen, W.; Xiangsheng, L.; Jun, Y.; He, Z.; Ying, L.; Yubin,
F.; Yanping, W.; Xuewei, H. J. Rare Earth. 2006, 24, 427-
431.
2. Liang, T.; Ding, S.; Song, W.; Chong, Z.; Zhang, C.; Li, H. J.
Rare Earth. 2008, 26, 7-15.
3. Wang, Z.; Zhang, X.; Mu, Y. Atmos. Environ. 2008, 42,
3882-3887.
4. Xu, X.; Zhu, W.; Wang, Z.; Witkamp, G.-J. Sci. Total Environ
2002, 293, 97-105.
5. Nicodemus, M. A.; Salifu, K. F.; Jacobs, D. F. J. Rare Earth.
2009, 27, 270-279.
6. d’Aquino, L.; Morgana, M.; Carboni, M. A.; Staiano, M.;
Antisari, M. V.; Re, M.; Lorito, M.; Vinale, F.; Abadi, K. M.;
Woo, S. L. Soil Biol. Biochem. 2009, 41, 2406-2413.
7. Zhang, Q.; Zhang, L.; Xiao, X.; Su, Z.; Zou, P.; Hu, H.;
Huang, Y.; He, Q.-Y. Toxicol. in Vitro 2010, 24, 1098-1104
8. Huang, P.; Li, J.; Zhang, S.; Chen, C.; Han, Y.; Liu, N.; Xiao,
Y.; Wang, H.; Zhang, M.; Yu, Q.; Liu, Y.; Wang, W. Environ.
Toxicol. Pharmacol. 2011, 31, 25-32.
9. Murakami, Y.; Unno, A.; Hossain, M.; Kimura, Y.; Nakamura,
Y.; Okano, T.; Matsumoto, K. Arch. Oral Biol. 2002, 47,
625-629.
10. Tyler, G. Geoderma 2004, 119, 277-290.
Interaction of Nd3+ with Bovine Serum Albumin J. Chin. Chem. Soc., Vol. 58, No. 4, 2011 573
Fig. 7. Spectral overlaps of HSA fluorescence spectra
(F) and Nd3+ absorption spectra (A). Condi-
tions: HSA: 3.0 × 10⁻⁶ mol L-1; Nd3+: 3.0 × 10⁻⁶
mol L-1; pH 7.4, T = 292 K.
Table 1. Binding constants and relative thermodynamic parameters of the HSA-Nd3+ system
T (K) Ka (× 104 L mol- 1) n R a �H0 (kJ mol- 1) ÄS0 (J mol- 1 K- 1) �G0 (kJ mol- 1)
292 5.71 0.92 0.9953 -26.58
302 4.30 0.91 0.9932-20.79 19.85
-26.79
a R is the correlation coefficient for the Ka values.

11. Tayeh, N.; Rungassamy, T.; Albani, J. R. J. Pharm. Biomed.
Anal. 2009, 50, 107-116.
12. Kathiravan, A.; Anandan, S.; Renganathan, R. Colloids
Surf., A 2009, 333, 91-95.
13. Bian, Q.; Liu, J.; Tian, J.; Hu, Z. Int. J. Biol. Macromol.
2004, 34, 275-279.
14. Bordbar, A.-K.; Taheri-Kafrani, A. Colloids Surf., B 2007,
55, 84-89.
15. Cheng, F.-Q.; Wang, Y.-P.; Li, Z.-P.; Dong, C. Spectrochim.
Acta, Part A 2006, 65, 1144-1147.
16. Cui, F.; Wang, J.; Cui, Y.; Li, J.; Yao, X.; Lu, Y.; Fan, J. J.
Lumin. 2007, 127, 409-415.
17. Daneshgar, P.; Moosavi-Movahedi, A. A.; Norouzi, P.;
Ganjali, M. R.; Madadkar-Sobhani, A.; Saboury, A. A. Int. J.
Biol. Macromol. 2009, 45, 129-134.
18. Hamdani, S.; Joly, D.; Carpentier, R.; Tajmir-Riahi, H. A. J.
Mol. Struct. 2009, 936, 80-86.
19. Zhang, Y.; Dong, L.; Li, J.; Chen, X. Talanta 2008, 76,
246-253.
20. Silva, D.; Cortez, C. M.; Louro, S. R. W. Spectrochim. Acta,
Part A 2004, 60, 1215-1223.
21. Liu, Y.; Xie, M.-X.; Jiang, M.; Wang, Y.-D. Spectrochim.
Acta, Part A 2005, 61, 2245-2251.
22. Ibrahim, N.; Ibrahim, H.; Kim, S.; Nallet, J.-P.; Nepveu, F.
Biomacromolecules 2011, 11, 3341-3351
23. Bai, H. X.; Liu, X. H.; Yang, F.; Yang, X. R. J. Chin. Chem.
Soc. 2009, 56, 696-702
24. Gelamo, E. L.; Tabak, M. Spectrochim. Acta, Part A 2000,
56, 2255-2271.
25. Cui, F.-L.; Wang, J.-L.; Cui, Y.-R.; Li, J.-P. Anal. Chim. Acta
2006, 571, 175-183.
26. Zhang, Y.-Z.; Zhou, B.; Zhang, X.-P.; Huang, P.; Li, C.-H.;
Liu, Y. J. Hazard. Mater. 2009, 163, 1345-1352.
27. Yuan, J.-L.; lv, Z.; Liu, Z.-G.; Hu, Z.; Zou, G.-L. J. Photo-
chem. Photobiol., A 2007, 191, 104-113.
574 J. Chin. Chem. Soc., Vol. 58, No. 4, 2011 Yuan et al.