osmotic pressures of aqueous bovine serum albumin solutions at
TRANSCRIPT

Ž .Fluid Phase Equilibria 155 1999 139–154
Osmotic pressures of aqueous bovine serum albumin solutions at highionic strength
Jianzhong Wu, John M. Prausnitz )
Department of Chemical Engineering, UniÕersity of California, Berkeley, USAChemical Sciences DiÕision, Lawrence Berkeley National Laboratory, Berkeley, CA 94720, USA
Received 14 July 1998; accepted 2 October 1998
Abstract
wUsing osmometers similar to those described by Vilker et al. V.L. Vilker, C.K. Colton, K.A. Smith, J.Ž . x wColloid and Interface Sci. 79 1981 548–566 and Amos et al. D.A. Amos, C.J. Radke, S. Lynn, J. Phys.
Ž . x Ž .Chem. B 102 1998 2739–2753 , osmotic pressures of aqueous bovine serum albumin BSA solutions wereŽ . Ž .measured at three pH 4.5, 5.4, 7.4 and at different sodium chloride concentrations from 1 to 5 M .
Experimental data were compared with results calculated from two van der Waals-type models using a potentialof mean force including hard-sphere and double-layer repulsions, and van der Waals attraction. In both models,the Carnahan–Starling equation of state represents the contribution of the hard-sphere repulsion to the osmoticpressure. Van der Waals attraction and double-layer repulsion are represented by their contributions to the
Ž .osmotic second virial coefficient in the first model, or in the second, to the random-phase-approximation RPA .Although both models give a semi-quantitative description of the osmotic pressures of BSA solutions at variousconditions, the first model represents the data slightly better than the second, using the same number ofadjustable parameters. Further improvement of modeling requires a more accurate potential of mean force forprotein molecules in salt solution. q 1999 Elsevier Science B.V. All rights reserved.
Keywords: Osmotic pressure; Proteins; RPA theory
1. Introduction
Industrial-scale production of biological products often requires a selective, non-denaturing purifi-cation method. Salt-induced precipitation has been successfully applied for separating proteins in
w xdownstream processing 1,2 . For efficient design of a protein separation process, good understanding
) Corresponding author.
0378-3812r99r$ - see front matter q 1999 Elsevier Science B.V. All rights reserved.Ž .PII: S0378-3812 98 00435-X

( )J. Wu, J.M. PrausnitzrFluid Phase Equilibria 155 1999 139–154140
of the phase behavior of proteins in aqueous electrolyte solutions is helpful. A reliable molecularthermodynamic model for this purpose relies on an accurate potential of mean force between proteinmolecules at various solution conditions. However, current understanding is limited to how proteinsinteract in aqueous electrolyte solutions, not only because of the complicated molecular structure ofproteins, but also because of the complex many-body effects of small ions and water molecules.
Interactions between proteins in an aqueous solution can be indirectly measured by light-scatteringŽ .low-angle laser light scattering and dynamic light scattering , by osmotic-pressure, and by hydrody-
Ž . w xnamic methods diffusion, sedimentation and viscosity 3–8 . In this work, we are interested inosmotic-pressure measurement. Osmotic-pressure data at low protein concentrations can be used todetermine the protein molecular weight and the second virial coefficient that is closely related to thepotential of mean force; at high protein concentrations, osmotic-pressure data may provide valuableinformation to test the theoretical models for describing the properties of aqueous protein solutions.
ŽTwo disadvantages of osmometry are poor accuracy at very low protein concentrations where.low-angle light scattering is better and slow data acquisition.
This work discusses construction and use of two identical membrane osmometers similar to thosew x w xreported by Vilker et al. 9 , and by Amos et al. 10 . Our osmometers were tested by repeating some
Ž .of Vilker’s osmotic-pressure results for aqueous Bovine Serum Albumin BSA solutions at lowsodium chloride concentration. Osmotic pressures of BSA solutions at high sodium chloride concen-
Ž .trations were measured at three pH 4.5, 5.4 and 7.4 . High salt-concentration conditions are ofinterest because they are used in industrial protein-separation processes. Previously publishedosmotic-pressure measurements of BSA solutions were restricted to low salt concentrations; thesodium chloride concentrations in this work range from 1.0 to 5.0 M. Sodium chloride is used becauseinteractions between salt ions and protein molecules are relatively easy to interpret.
The experimental results were compared with those calculated from two van der Waals typemodels for protein solutions. In each model, the potential of mean force between protein molecules inan electrolyte solution contains contributions from hard-sphere repulsion, dispersion and electrostaticinteractions. The last two contributions are approximated using the Derjaguin–Landau–Verwey–
Ž . w xOverbeek DLVO theory 11 . The Carnahan–Starling equation of state is used to calculate thew xcontribution of hard-sphere repulsive interaction to the osmotic pressure 12 . In the first model, the
DLVO potential is used through its contribution to the osmotic second virial coefficient. The secondŽ .model uses the random-phase-approximation theory RPA as discussed, for example, by Vlachy et al.
w x13 . Both models provide a semi-quantitative description of the osmotic pressure of BSA solutions atlow salt concentrations but not at high salt and protein concentrations. At these conditions, whenelectrostatic shielding is high, it appears that the potential of mean force should be more repulsivethan that given by the DLVO theory. As a result, both models underpredict the osmotic pressure athigh salt and protein concentrations.
2. Membrane osmometer
Fig. 1 shows schematically the experimental apparatus for osmotic-pressure measurements. ExceptŽ .for some slight differences in the osmometer cells size, o-ring structure, and discharge channels , this
w xapparatus is almost the same as that used by Amos et al. 10 . The osmometer cell consists of two

( )J. Wu, J.M. PrausnitzrFluid Phase Equilibria 155 1999 139–154 141
Fig. 1. Schematic diagram of the osmometer system.
Fig. 2. Osmotic pressure of BSA aqueous saline solution at pHs7.4 and 0.15 M sodium chloride concentration.

( )J. Wu, J.M. PrausnitzrFluid Phase Equilibria 155 1999 139–154142
chambers separated by a membrane permeable to solvent molecules and small ions but impermeableto proteins. One chamber contains a protein solution and the other contains a protein-free solvent, i.e.,a solution of salt and buffer ions. External pressure is applied to the protein side such that, atequilibrium, no net mass transfer occurs between the two chambers. The applied pressure is controlled
Ž .by one of the two precision pressure regulators, one for low-pressures -1000 mm H O and the2
other for higher pressures. The osmotic pressure, equal to the applied external pressure at equilibrium,is read either from a home-made water manometer or from a high-precision pressure gauge.Resolution of the volume change in the capillaries is about 0.002 ml. The osmometer is keptisothermal by immersion in a water bath controlled at 25"0.18C. External pressure was supplied bya high-pressure nitrogen tank. In Appendix A, Figs. 10–12 describe the osmometer and its acces-sories. Attainment of equilibrium may require several days for high protein concentrations. Toaccelerate data acquisition, two identical osmometer systems were constructed.
The reliability of both osmometers was tested by measuring some osmotic pressure of BSAsolutions at pHs7.4 and 0.15 M sodium chloride concentration. The same solution condition has
w xbeen used by Vilker et al. 9 to measure the osmotic pressure of BSA solutions. Because theirmeasurements were in the relatively high concentration range, Vilker’s empirical correlation was usedto test our measurements. Fig. 2 shows the comparison between our measured results and thosecalculated from Vilker’s empirical correlation at the same solution conditions. The agreement is goodfor both osmometers.
3. Experimental procedure
3.1. Materials
Ž . Ž .Bovine Serum Albumin BSA )98% albumin, heat-shock fraction was purchased from SigmaŽ .St. Louis, MO and stored at about 58C. Analytical-grade monobasic and dibasic sodium phosphates,
Ž .sodium hydroxide pellets, hydrochloric acid 0.1 N and crystal sodium chloride were purchased fromŽ . Ž .Aldrich Milwaukee, WI . Sodium azide was from Eastman Kodak Rochester, NY . All chemicals
were used as received and all solutions were prepared using deionized water. Cellulose membranesŽ .with 10,000 molecular-weight cut-off were purchased from Millipore Bedford, MA . The molecular
weight of BSA is 66,000.
3.2. Procedures
Sodium chloride aqueous solutions of 1.0, 3.0 and 5.0 M in Naq at pHs7.4, 5.4 and 4.5 wereprepared using 0.1 N mono-basicrdibasic sodium phosphate buffer solution and crystal sodium
Ž .chloride. All solutions contained sodium azide 0.020 grl as an anti-bacterial agent. High-concentra-Ž .tion BSA-stock solutions about 100 grl were prepared by dissolving albumin crystals in a given
sodium chloride solution. Each stock solution was then diluted to about 20, 40, 60 and 80% of itsoriginal protein concentration with the corresponding sodium chloride-buffer solution. pH wasmeasured using a Sargent–Welch Model 8400 IonrpH meter with a Fisher Scientific Model SN13-620-286 electrode. The final solution pH was adjusted to the desired value by addition ofnon-buffered aqueous solution of 0.1 N sodium hydroxide or hydrochloric acid. Vigorous vortex

( )J. Wu, J.M. PrausnitzrFluid Phase Equilibria 155 1999 139–154 143
mixing was applied during acidrbase addition process to prevent local protein denaturation. Theslight difference in Naq concentration induced by pH adjustment was neglected. All solutions werekept at 58C overnight before osmotic-pressure measurement.
The regenerated cellulose membrane was soaked in deionized water for 1–2 h and then in thedesired sodium chloride-buffer solution overnight before use. The osmometer cell was assembled by
Žsandwiching the pre-prepared membrane between two Plexiglas chambers. The solvent i.e., aqueous.sodium chloride and buffer solution was injected into both chambers using syringes, and the
osmometer was set in the water bath overnight before osmotic-pressure measurement. Cell leakageand zero-point error were prevented by checking the solvent level at each capillary.
Before each measurement, both solution and solvent chambers of the osmometer were flushed byinjecting and removing excess amount of desired solvent; the solution chamber was rinsed two orthree times with the sample solution. The protein solution and the solvent were then simultaneouslyinjected into the corresponding chambers to the liquid levels in both capillaries reaching about 2r3 of
Table 1Measured osmotic pressures P for solutions of BSA in aqueous sodium chloride
C s1.0 Ms
pH 7.4 pH 4.5
Ž . Ž . Ž . Ž .C grl P mm H O C grl P mm H Op 2 p 2
19.5 85 12.2 3044.6 224 25.5 6155.8 282 38.6 11484.5 515 44.3 157
101.1 731 61.7 240
C s3.0 Ms
pH 7.4 pH 5.4
15 50 34.5 9325 89 55.2 17538.4 143 73.5 29550.3 202 89.8 393.565.3 275 93.5 405
122.8 692
C s5.0 Ms
pH 7.4 pH 5.4
33.4 127 30.1 6768.9 283 49.5 100
100.1 435 58.9 154133.5 615 77.3 240150 892 99.1 430
Ž .C smolar concentration of salt sodium chloride .sŽ .C smass concentration of protein BSA .p
1 mm H Os9.80 Pa.2

( )J. Wu, J.M. PrausnitzrFluid Phase Equilibria 155 1999 139–154144
their full length. Pressure was applied gradually to the solution side such that there was no net massflow between the two chambers. Equilibrium was attained when there was no liquid-level change inboth capillaries for about 3 h at a given applied pressure. At the conclusion of each measurement,solvent and solution samples were taken simultaneously using different syringes while the solutionwas still under pressure. The protein concentrations in both chambers were measured using aShimadzu Model UV-160 spectrophotometer. Concentration measurement on the solvent side wasconducted to monitor the working status of the membrane osmometer because leakage couldoccasionally occur due to inappropriate assembling of the osmometer. The extinction coefficient forBSA at 278 nm is 0.66 in aqueous solutions, that is assumed to be independent of pH and salt
w xconcentration 8 .
4. Experimental results
Table 1 shows the measured osmotic pressures of BSA solutions at different pH and saltconcentrations. To display the trend of measured osmotic pressure as a function of pH, Fig. 3 shows
Ž .reduced osmotic pressure osmotic pressurerprotein concentration versus concentration for pHs7.4and 4.5 in 1 M sodium chloride solution. Because of higher protein charge as discussed in the nextparagraph, the osmotic pressure at pHs7.4 is much higher than that at pHs4.5 at proteinconcentrations less than 60 grl.
w xAccording to Vilker et al. 9 , the BSA charge numbers in 0.15 M sodium chloride aqueoussolution are y20.4, y9.1 and q4.5 at pH 7.5, 5.4 and 4.5, respectively. We realize that the proteincharge may depend on salt concentration. Because this dependence can only be found by potentio-metric titration, We assume that protein charge numbers are independent of salt concentration in thiswork. This assumption will not change the qualitative feature of our results. At pHs4.5, attractive
Ž .Fig. 3. Reduced osmotic pressure P rC vs. BSA concentration at 258C in 1 M sodium chloride solution at pH 7.4 and 4.5pŽ .Lines are to guide the eye .
( )J. Wu, J.M. PrausnitzrFluid Phase Equilibria 155 1999 139–154 145
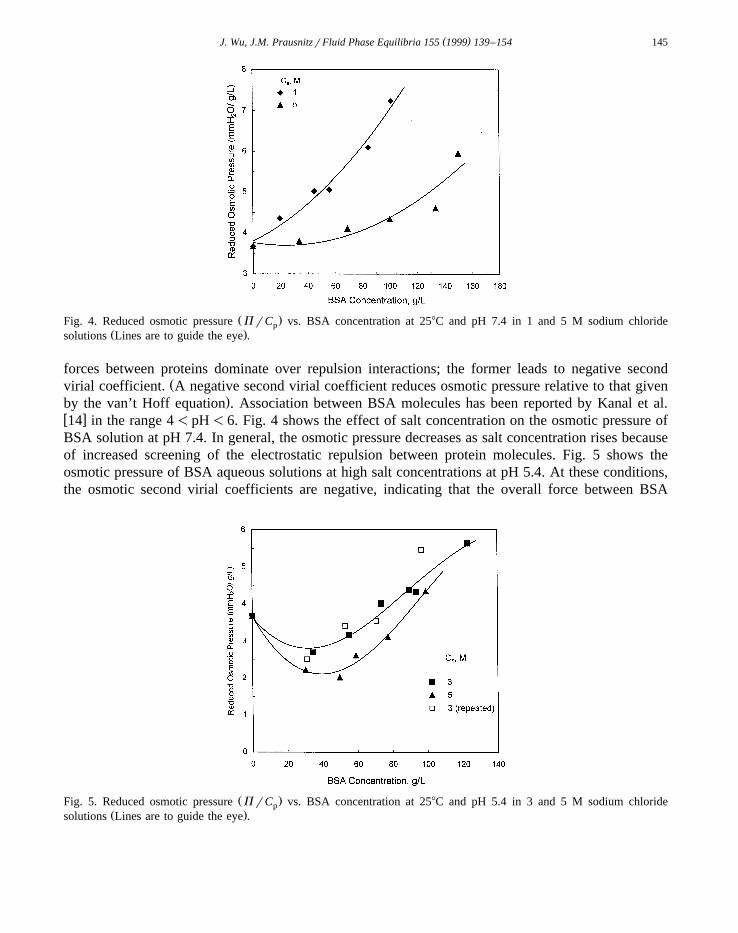
Ž .Fig. 4. Reduced osmotic pressure P rC vs. BSA concentration at 258C and pH 7.4 in 1 and 5 M sodium chloridepŽ .solutions Lines are to guide the eye .
forces between proteins dominate over repulsion interactions; the former leads to negative secondŽvirial coefficient. A negative second virial coefficient reduces osmotic pressure relative to that given
.by the van’t Hoff equation . Association between BSA molecules has been reported by Kanal et al.w x14 in the range 4-pH-6. Fig. 4 shows the effect of salt concentration on the osmotic pressure ofBSA solution at pH 7.4. In general, the osmotic pressure decreases as salt concentration rises becauseof increased screening of the electrostatic repulsion between protein molecules. Fig. 5 shows theosmotic pressure of BSA aqueous solutions at high salt concentrations at pH 5.4. At these conditions,the osmotic second virial coefficients are negative, indicating that the overall force between BSA
Ž .Fig. 5. Reduced osmotic pressure P rC vs. BSA concentration at 258C and pH 5.4 in 3 and 5 M sodium chloridepŽ .solutions Lines are to guide the eye .

( )J. Wu, J.M. PrausnitzrFluid Phase Equilibria 155 1999 139–154146
Table 2Molecular parameters obtained from data regression
Ž .HrkT d nm
B model 0.31 0.012RPA model 2.48 0.005
HsHamaker constant.d sempirical parameter reflecting minimum surface-to-surface distance.
molecules is attractive. As expected, because screening declines with falling ionic strength, theinteraction between proteins is more repulsive at lower salt concentrations.
5. Theoretical analysis of osmotic-pressure data
5.1. Potential of mean force between proteins in aqueous electrolyte solutions
To represent the osmotic pressure of BSA solutions at different pH and salt concentrations, weassume that proteins in solution can be represented by charged hard spheres of diameter s immersedin an aqueous solvent containing salt ions. The total potential of mean force between protein
hsŽ .molecules includes contributions from hard-sphere repulsion W r , from dispersion attractiondisŽ . dlŽ . w xW r , and from double-layer electrostatic repulsive interaction, W r 11 ,
W total r sW hs r qW dis r qW dl r 1Ž . Ž . Ž . Ž . Ž .where r is center-to-center distance between two protein molecules. The last two terms are known as
Ž . DLVOŽ .the Derjaguin–Landau–Verwey–Overbeek DLVO potential, W r .
Fig. 6. Calculated and measured osmotic pressures of BSA solutions at C s5 M. Solid lines are calculated from the Bs
model; the dashed lines are from RPA theory.

( )J. Wu, J.M. PrausnitzrFluid Phase Equilibria 155 1999 139–154 147
w xThe dispersion potential between two spherical molecules is given by 15
H s 2 s 2 r 2 ys 2disW r sy q 2 ln r)s . 2Ž . Ž .2 2 2 2ž /12 r ys r r
Ž .where H is the Hamaker constant of proteins in water. Because Eq. 2 diverges when two proteinmolecules are in contact, we assume that there is a minimum distance between two protein surfaces,denoted as d . A possible interpretation of d is to regard it as the average diameter of atoms on theprotein surface. However, because d is obtained by adjusting experimental osmotic-pressure data toour calculations, it is essentially an empirical fitting parameter. The strength of dispersion interactionis sensitive to the minimum surface-to-surface distance.
dlŽ .The double-layer repulsive interaction W r is approximated by
z 2e2 eyk Ž rys .pdlW r s , 3Ž . Ž .24p´ ´ r 1qksr2Ž .0
where z is protein charge, e is the charge of an electron, ´ is the dielectric constant of water and ´p 0
is the permittivity constant. k is the Debye screening parameter related to the small-ion concentrationr , valence z and temperature T byi i
r e2z 2i i2k s , 4Ž .Ý
´ ´ kT0i
Ž .where k is the Boltzmann constant. Here subscript i refers to all small ions. Eq. 3 is derived usingw xthe linear approximation of the Poisson–Boltzmann equation 11 .
Fig. 7. Calculated and measured osmotic pressures of BSA solutions at C s3 M and pHs7.4, 5.4. Notation is similar tos
that in Fig. 6.

( )J. Wu, J.M. PrausnitzrFluid Phase Equilibria 155 1999 139–154148
Fig. 8. Calculated and measured osmotic pressures of BSA solutions at C s1 M. Notation is similar to that in Fig. 6.s
5.2. Van der Waals-type equations of state for protein solutions
We use two van der Waals type equations of state to correlate experimental osmotic-pressure dataw xof BSA solutions measured in this work and those reported by Vilker et al. 9 . Both equations contain
w xthe Carnahan–Starling equation of state to take into account short-range repulsive interactions 12 . In
Fig. 9. Calculated and measured osmotic pressures of BSA solutions at C s0.15 M. Notation is similar to that in Fig. 6.sŽ .Experimental data from Vilker et al. 1981 .
( )J. Wu, J.M. PrausnitzrFluid Phase Equilibria 155 1999 139–154 149
the first model, the DLVO potential is considered through its contribution to the perturbation part ofthe second virial coefficient, denoted by B. The osmotic compressibility factor Z is given by,
2 31r2P 2 1qhqh yh2 2Zs s z r r2 qr yr q qBr 5Ž .Ž .½ 5p p s s p3
r kT r 1yhŽ .p p
where P is osmotic pressure; r is the number density of protein; h is packing fraction,pŽ . 3hs pr6 r s ; r is the number density of salt in the ‘solvent’ side. Because the volume of thep s
solvent side is large compared to that of the protein side, r is identical to the original number densitys
of salt. The perturbation part of the second virial coefficient B is given by
DLVO` W rŽ .
2Bs2p 1yexp y r d r . 6Ž .H ½ 5kTsqd
Ž .The first term in Eq. 5 comes from the ideal Donnan effect for a 1:1 electrolyte solution. It takesw xinto account the uneven distribution of small ions between the two chambers of the osmometer 9 .
When the McMillan–Mayer theory is applied to calculate the osmotic pressure of protein solutions orother solutions of charged solutes, consideration must be given to the difference in ‘solvents’; i.e., the
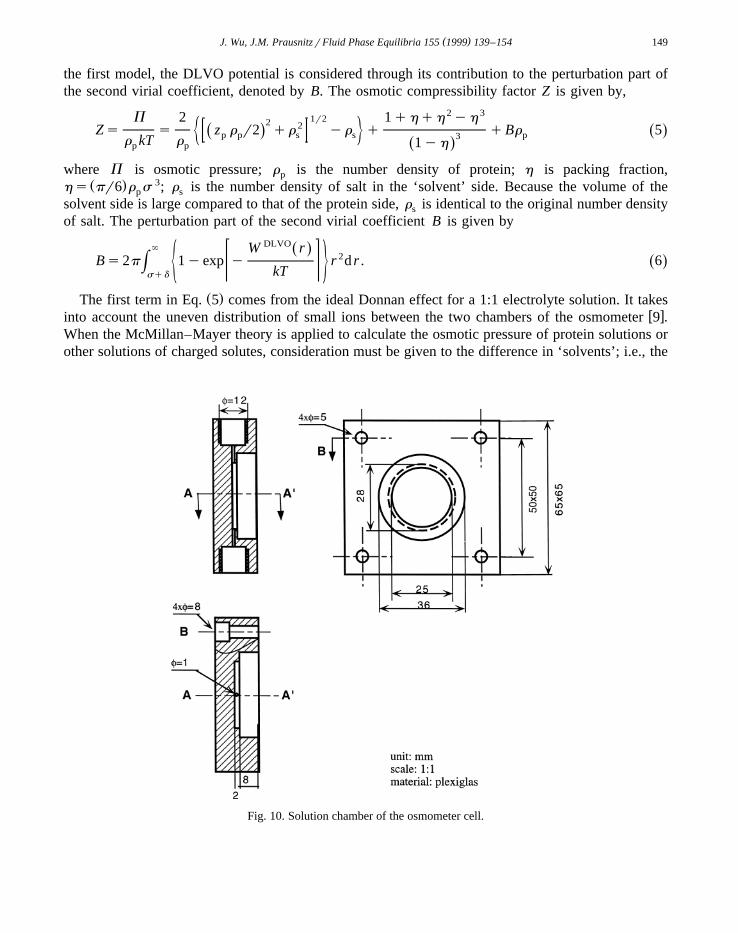
Fig. 10. Solution chamber of the osmometer cell.

( )J. Wu, J.M. PrausnitzrFluid Phase Equilibria 155 1999 139–154150
Ž .‘solvent’ in this case, a salt solution on the protein side of the osmometer is slightly different fromthat on the other side because of Donnan equilibrium. For the solutions considered here, the ideal
ŽDonnan effect provides a simple first-order correction due to the difference in solvents. Anotherapproach to calculate the osmotic pressure of a protein solution containing electrolytes is to consider
w x.explicitly interactions between proteins and small ions, as discussed by Amos et al. 10 . ForŽ .convenience, we call Eq. 5 the B model.
Ž .An alternate way to include the DLVO potential is to use the random-phase approximation RPAŽ w x.See, for example, 13 that gives the equation of state
2 31r2P 2 1qhqh yh U2 12Zs s z r r2 qr yr q qr P 7Ž .Ž .½ 5p p s s p3
r kT r 2kT1yhŽ .p p
` w disŽ . dlŽ .x 2where U s4pH W r qW r r d r. The RPA is a perturbation theory that approximates the1 sqd
direct correlation function of the solution by that of the reference system. U is analogous to constant1
a in the van der Waals equation of state with dimensions of energy=volume.
Fig. 11. Solvent chamber of the osmometer cell.

( )J. Wu, J.M. PrausnitzrFluid Phase Equilibria 155 1999 139–154 151
Ž .At high salt concentrations or at low protein charge, the ideal Donnan-effect term in Eq. 5 or Eq.Ž .7 is negligible because the ‘solvents’ in both chambers of the osmometer are essentially identical.However, this term can be significant for the osmotic pressure of highly charged proteins in dilute saltsolutions. For example, at pHs7.4 and C s0.15 M, it accounts for about 20% of the total osmotics
pressure for the protein concentrations studied here.In both models, molecular parameters d and H are assumed independent of solution pH, protein
concentration and salt concentration. These parameters are obtained by regression of experimentalw xosmotic-pressure data measured in this work and those reported by Vilker et al. 9 . The BSA
Ž . Ž . w xdiameter ss6.26 nm and charge numbers valence at various pH are also from Vilker et al. 9 .Table 2 gives the two adjustable parameters for both models. The Hamaker constants obtained fromthe two models do not agree due to different approximations introduced in each model.
Figs. 6–9 compare experimental osmotic pressures for BSA solutions with calculated results usingthe van der Waals type equations of state. The experimental data for C s0.15 M are from Vilker ets
w xal. 9 . In Figs. 6 and 7, the effect of charge on interaction between proteins is very small because ofŽ .high ionic strength 5 and 3 M, respectively . The slight crossing of data for pHs7.4 and 5.4 should
be attributed to experimental uncertainties. While both models can semi-quantitatively describe theosmotic pressure of BSA solutions, the B model is slightly better than the RPA model. Both modelspredict osmotic pressures that are too small at high protein concentrations, perhaps because the DLVOtheory is based on the linear approximation of the Poisson–Boltzmann equation; this approximationgives less repulsion when compared with the correct interaction potential between macroions at small
w xseparations 16 . At pH 4.5 and 5.4, deviations at low protein concentrations may be related toassociation of proteins.
Fig. 12. Accessories of the osmometer cell.

( )J. Wu, J.M. PrausnitzrFluid Phase Equilibria 155 1999 139–154152
To represent the data, we have tried using other, more sophisticated models including thew xBarker–Henderson perturbation theory with the macro-compressibility approximation 17 and the
w xPercus–Yevick solution of the sticky hard-sphere model 18 . Regrettably, these models do notimprove agreement with experiment. It appears that the main weakness of the two van der Waalsmodels follows from the over-simplified potential of mean force used here for proteins in electrolytesolutions. Progress in understanding the properties of saline protein solutions is not likely to comefrom more sophisticated statistical mechanics but from an improved potential of mean force.
6. Conclusions
Two membrane-osmometer systems have been constructed for protein solutions at low and highprotein concentrations. The reliability of these systems was tested by measuring the osmotic pressureof BSA solutions at pHs7.4 and 0.15 M sodium chloride concentration; good agreement with
w xVilker’s data 9 was obtained. Although the osmometers described here are inexpensive and easy tooperate, osmotic-pressure measurements are time consuming, especially at high protein concentra-tions.
New and previously published osmotic data show the effects of pH and salt concentration on theosmotic pressures of BSA solutions. The osmotic pressure falls as protein charge decreases or as saltconcentration increases. The experimental data can be semi-quantitatively interpreted using either asecond-virial-coefficient model, or a model based on RPA theory. However, neither model issuccessful at high salt concentrations. For more accurate description of the properties of proteinsolutions, we require a better potential of mean force. Toward meeting that requirement, molecular-simulation studies are in progress.
7. List of symbols
a van der Waals’ parameterB perturbation part of the osmotic second virial coefficientC concentratione electron chargeH Hamaker constantk Boltzmann constantr center-to-center distanceT temperatureU RPA energy parameterW potential of mean forceZ osmotic compressibility factorz protein charge
Greek lettersP osmotic pressured minimum distance between two protein surfaces

( )J. Wu, J.M. PrausnitzrFluid Phase Equilibria 155 1999 139–154 153
´ dielectric constant´ permittivity constant0
h packing fractionk Debye screening parameterr number densitys hard-sphere diameter
SubscriptsŽ .p protein BSA
Ž .s salt NaCl
Superscriptsdis dispersion interactiondl double-layer interactionDLVO DLVO potentialhs hard-sphere interactiontotal total potential of mean force
Acknowledgements
We are grateful to Ms. Amos for showing her apparatus, and to Ms. Lam for assistance withexperimental measurements. This work was supported by the Director, Office of Energy Research,Office of Basic Energy Sciences, Chemical Sciences Division of the U.S. Department of Energyunder Contract No. DE-AC03-76SF00098.
Appendix A. Detailed diagrams of a membrane osmometer
Details of the osmometer are given in Figs. 10–12.
References
w x1 P.A. Belter, E.L. Cussler, W.S. Hu, Bioseparations: Downstream Processing Operations, Wiley, New York, 1988.w x Ž .2 F. Rothstein, in: R.G. Harrison Eds. , Protein Purification Process Engineering, Marcel Dekker, New York, 1994.w x Ž .3 R.A. Curtis, J.M. Prausnitz, H.W. Blanch, Biotech. Bioeng. 57 1998 11–21.w x Ž .4 D.E. Kuehner, C. Heyer, C. Ramsch, U.M. Fornefeld, H.W. Blanch, J.M. Prausnitz, Biophys. J. 73 1997 3211–3224.¨w x Ž .5 G. Scatchard, A.C. Batchelder, A. Brown, J. Am. Chem. Soc. 68 1946 2320–2329.w x6 C. Tanford, Physical Chemistry of Macromolecules, Wiley, New York, 1961.w x Ž .7 D.S. Adair, in: P. Alexander, R.J. Block Eds. , Analytical Methods of Protein Chemistry, Pergamon, Oxford, 1961, pp.
23–56.w x8 C.A. Haynes, Separation of Protein Mixtures by Extraction: Statistical – Mechanical Models of Aqueous Solutions
Containing Polymers, Salts, and Globular Proteins, Ph.D. Thesis, University of California, Berkeley, 1992.w x Ž .9 V.L. Vilker, C.K. Colton, K.A. Smith, J. Colloid and Interface Sci. 79 1981 548–566.
w x Ž .10 D.A. Amos, C.J. Radke, S. Lynn, J. Phys. Chem. B 102 1998 2739–2753.w x11 P.C. Hiemenz, R. Rajagopalan, Principles of Colloid and Surface Chemistry, Marcel Dekker, New York, 1997.
( )J. Wu, J.M. PrausnitzrFluid Phase Equilibria 155 1999 139–154154
w x Ž .12 N.F. Carnahan, K.E. Starling, J. Chem. Phys. 51 1969 635–636.w x Ž .13 V. Vlachy, H.W. Blanch, J.M. Prausnitz, AIChE J. 39 1993 215–223.w x Ž .14 K.M. Kanal, G.D. Fullerton, I.L. Cameron, Biophysical J. 66 1994 160–163.w x15 W.B. Russel, D.A. Saville, W.R. Schowalter, Colloidal Dispersions, Cambridge University Press, New York, 1989.w x16 J. Israelachvili, Intermolecular and Surface Forces, Academic Press, New York, 1991.w x17 D.A. McQuarrie, Statistical Mechanics, Harper and Row publishers, New York, 1976.w x Ž .18 R.J. Baxter, J. Chem. Phys. 49 1968 2770–2774.