study on quantitative sewage blowing-off and real-time sewage...
TRANSCRIPT

Research ArticleStudy on Quantitative Sewage Blowing-Off and Real-Time SewageLevel Detection of Submarine Storage Tank
Kai Yang ,1,2 Yide Liao ,1 Xubing Chen,1 and Xiaodong Yang1
1School of Mechanical and Electrical Engineering, Wuhan Institute of Technology, Wuhan 430205, China2School of Physics and Mechanical & Electrical Engineering, Hubei University of Education, Wuhan 430205, China
Correspondence should be addressed to Yide Liao; [email protected]
Received 7 May 2019; Accepted 18 July 2019; Published 10 September 2019
Academic Editor: Antonio Lazaro
Copyright © 2019 Kai Yang et al. This is an open access article distributed under the Creative Commons Attribution License, whichpermits unrestricted use, distribution, and reproduction in any medium, provided the original work is properly cited.
Aiming at the problems of huge exhaust noise and air bubbles caused by sewage blowing-off at an inappropriate time for asubmarine ST, a sewage level detection system is designed, which can detect in real-time the sewage level using a weighingsensor to achieve quantitative sewage blowing-off. Therefore, the theoretical analysis of the sewage blowing-off is carried out,and the process of the sewage blowing-off is simulated by a VOF model of Fluent. From the simulation, the gas-liquid volumedistribution diagram, the volume curve of the sewage, and the flow rate curve of the outlet sewage are obtained. Furthermore,the installation and detection method of the weighing sensor are described in detail. Finally, an experimental test system forsimulating the sewage blowing-off is established, and an ultrasonic liquid level sensor, capacitance level sensor, and weighingsensor are tested. By comparing the effects of the three sensors, the result shows that the weighing sensor is the most effectivefor real-time sewage level detection during the process of sewage blowing-off and can effectively reduce the exhaust noise of thesewage blowing-off system.
1. Introduction
The storage tank (ST) is one of the necessary living facilitiesof a submarine, which is used to store solid-liquid mixed sew-age mainly consisting of human excreta and seawater. Due tothe limited volume of the ST, about 150 L, the sewage needsto be blown off frequently by high-pressure air. Influencedby the variation of the seawater pressure and the differentsolid-liquid mixing ratios, the time of sewage blowing-off isunstable. However, the existing sewage blowing-off systemcannot detect the sewage level in real-time, which results ina large number of bubbles and a huge exhaust noise whenthe sewage is completely blown off.
The research on a submarine high-pressure air blowing-off system mainly focuses on the hovering system. By con-trolling the water level of the hovering ballast tank, the ballasttank mass can be quickly adjusted, and the depth and thepitch angle of a submarine can be controlled [1, 2]. Zhanget al. studied the process used in a high-pressure airblowing-off ballast tank based on a VOF two-phase flow
model [3]. Liu et al. designed a small scale model experimentof a high-pressure air blowing-off ballast tank and obtainedthe drainage performance and key performance parameters[4]. The control approach of a variable ballast system andthe fuzzy logic control system can make a ballast tank auto-matically fill up or empty itself of seawater as desired [5–7].Liu et al. and Zhao et al. proposed a novel type of waterhydraulic variable ballast system to improve control perfor-mance and reduce energy consumption when adjusting theballast water [8, 9]. Xiang et al. summarized the designsand analytical processes of adaptive fuzzy control and fuzzyPID control as well as the trends of the future for fuzzy logicin the field of underwater vehicles [10]. Blowing-off equip-ment suitable for hovering systems has also been designedby researchers [11]. Xia et al. designed an extra-high-pressure pneumatic blowing valve with a differential pressurecontrol for an emergency blowing-off ballast tank [12]. Yanget al. designed an extra-high-pressure pneumatic blowingvalve and established a mathematical model for the valvebased on a real gas state equation [13]. Compared with the
HindawiJournal of SensorsVolume 2019, Article ID 4891761, 7 pageshttps://doi.org/10.1155/2019/4891761
hovering system, the sewage blowing-off system is smaller insize and its internal medium is more complex, so it is moredifficult to detect the liquid level in real time.
In this paper, a sewage blowing-off system using aweighing sensor to detect the sewage level in real time isproposed, which realizes the quantitative sewage blowing-off and effectively reduces the exhaust noise of a sewageblowing-off system.
2. Analysis and Simulation of the SewageBlowing-Off Model
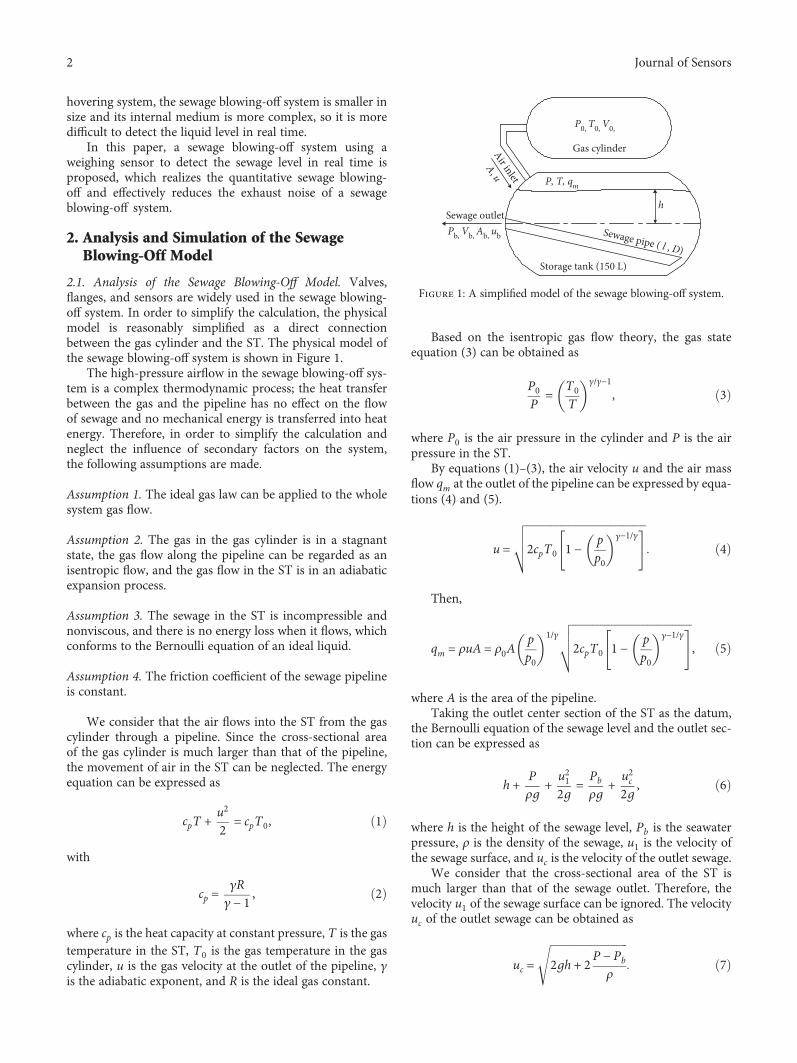
2.1. Analysis of the Sewage Blowing-Off Model. Valves,flanges, and sensors are widely used in the sewage blowing-off system. In order to simplify the calculation, the physicalmodel is reasonably simplified as a direct connectionbetween the gas cylinder and the ST. The physical model ofthe sewage blowing-off system is shown in Figure 1.
The high-pressure airflow in the sewage blowing-off sys-tem is a complex thermodynamic process; the heat transferbetween the gas and the pipeline has no effect on the flowof sewage and no mechanical energy is transferred into heatenergy. Therefore, in order to simplify the calculation andneglect the influence of secondary factors on the system,the following assumptions are made.
Assumption 1. The ideal gas law can be applied to the wholesystem gas flow.
Assumption 2. The gas in the gas cylinder is in a stagnantstate, the gas flow along the pipeline can be regarded as anisentropic flow, and the gas flow in the ST is in an adiabaticexpansion process.
Assumption 3. The sewage in the ST is incompressible andnonviscous, and there is no energy loss when it flows, whichconforms to the Bernoulli equation of an ideal liquid.
Assumption 4. The friction coefficient of the sewage pipelineis constant.
We consider that the air flows into the ST from the gascylinder through a pipeline. Since the cross-sectional areaof the gas cylinder is much larger than that of the pipeline,the movement of air in the ST can be neglected. The energyequation can be expressed as
cpT + u2
2 = cpT0, 1
with
cp =γRγ − 1 , 2
where cp is the heat capacity at constant pressure, T is the gastemperature in the ST, T0 is the gas temperature in the gascylinder, u is the gas velocity at the outlet of the pipeline, γis the adiabatic exponent, and R is the ideal gas constant.
Based on the isentropic gas flow theory, the gas stateequation (3) can be obtained as
P0P
= T0T
γ/γ−1, 3
where P0 is the air pressure in the cylinder and P is the airpressure in the ST.
By equations (1)–(3), the air velocity u and the air massflow qm at the outlet of the pipeline can be expressed by equa-tions (4) and (5).
u = 2cpT0 1 − pp0
γ−1/γ4
Then,
qm = ρuA = ρ0App0
1/γ2cpT0 1 − p
p0
γ−1/γ, 5
where A is the area of the pipeline.Taking the outlet center section of the ST as the datum,
the Bernoulli equation of the sewage level and the outlet sec-tion can be expressed as
h + Pρg
+ u212g = Pb
ρg+ u2c2g , 6
where h is the height of the sewage level, Pb is the seawaterpressure, ρ is the density of the sewage, u1 is the velocity ofthe sewage surface, and uc is the velocity of the outlet sewage.
We consider that the cross-sectional area of the ST ismuch larger than that of the sewage outlet. Therefore, thevelocity u1 of the sewage surface can be ignored. The velocityuc of the outlet sewage can be obtained as
uc = 2gh + 2 P − Pb
ρ7
h
Air inlet
A, u
Storage tank (150 L)
Sewage pipe ( l , D)
Gas cylinder
P0, T0, V0,
Pb, Vb, Ab, ub
P, T, qm
Sewage outlet
Figure 1: A simplified model of the sewage blowing-off system.
2 Journal of Sensors

The volume variation ΔV of the sewage blown off in timeΔt can be expressed as
ΔV = μAcucΔt = μAcΔt 2gh + 2 P − Pb
ρ8
Then,
dVdt
= μAc 2gh + 2 P − Pb
ρ9
The height variation Δh of the sewage level in time Δt canbe expressed as
Δh = ΔVF h
, 10
where F h is the area function of the cross section of the ST.Here,
dhdt
= dVdt
⋅1
F h11
Then,
dhdt
= μAc
F h2gh + 2 P − Pb
ρ12
Equations (9) and (12) reflect the instantaneous variationof the sewage volume and the sewage level height, respec-tively. Compared with the seawater pressure Pb and the airpressure p, the sewage level height h is small and can beignored. Therefore, the volume of the sewage blowing-off Vand the height of the sewage level h are both inversely pro-portional to the seawater pressure Pb and directly propor-tional to the air pressure p.
2.2. Simulation of the Sewage Blowing-Off Model Based onFluent. By using computational fluid dynamics, we can pre-dict the performance and provide solid guidelines duringthe design phase of modelling and parameter estimation.Therefore, the process of sewage blowing-off and the gas-liquid volume distribution can be clearly observed by usingthe volume of fluid (VOF) model of Fluent. And a simulationmodel of the ST with a volume of 150 L is set up, and its 3Dmodel is divided into 113925 hexahedral meshes by using themultizone sweep meshing.
In order to simulate the actual condition, the boundaryconditions are set as pressure inlet and pressure outlet; theinlet air pressure is 3.4MPa, and the outlet seawater pres-sure is 1.8MPa. The fluid medium in the ST is set to gas-liquid two-phase, where one phase is seawater and the otherphase is air. Before the simulation, a gravity acceleration of9.8m/s2 is added in the vertical direction, and the air volumefraction of the whole fluid area in the ST is 0, so the initialstate of the ST is filled with seawater. The gas-liquid volumedistribution diagram of the 3D model and the middle section
of the ST during the blowing-off time from 5 s to 40 s areshown in Figure 2.
Figures 2(a)–2(h) show the gas-liquid volume distribu-tion of the 3D model and the middle section of the ST atdifferent blowing-off times. The blue area and the red arearepresent seawater and air, respectively, and the othercoloured areas represent different air proportions of thegas-liquid mixtures. The volume fraction of air is shown atthe bottom of each picture at every time.
By monitoring the simulation process, the volume curveof the sewage in the ST and the flow rate of the outlet sewageat different seawater pressures are obtained as shown inFigures 3 and 4.
As can be seen from Figures 2–4, when the sewageblowing-off begins, the air enters into the ST and forms amixing layer at the gas-liquid interface. At this moment, theflow rate of the outlet sewage increases rapidly and maintainsbasic stability at a certain flow rate. With the continuous sew-age blowing-off, three distinct layers are formed in the ST.The upper layer is air and the middle layer is gas-liquid mix-ing, and both of the two layers spread continuously with theentry of air. The lower layer is water. Due to the large flowrate of the outlet sewage, the volume of the sewage in theST reduces rapidly, and the flow rate of the outlet sewagedecreases sharply. Since then, the sewage is basically emptied,and a small amount of residual sewage diffuses throughoutthe ST. The lower the pressure of seawater, the greater thepressure difference between high-pressure air and seawater.And the larger the pressure difference, the faster the flow rateof the outlet sewage and the faster the volume change of thesewage in the ST.
3. Method Study on the Real-Time SewageLevel Detection
In order to realize the quantitative sewage blowing-off andreduce the exhaust noise, it is effective to detect the sewagelevel in real-time during the blowing-off process. Sensingtechnology is widely used in underwater vehicles [14], butthe corrosive nature of seawater, biofouling, pressure resis-tant enclosure, data transfer reliability, and the dynamicnature of the ocean itself create great limitations in an under-water environment [15].
For the sewage blowing-off system, the ST is a sealed con-tainer withstanding high pressure, and the sewage is a solid-liquid mixture of human excreta and seawater in differentproportions. The sewage level will oscillate violently whenthe sewage is blown off by the high-pressure air. Therefore,it is difficult to accurately detect the sewage level in real-time by using conventional sensors in the process of sewageblowing-off.
To solve this problem, a sewage blowing-off system usinga weighing sensor to detect the sewage level in real-time isproposed. The ST is installed horizontally and is simply sup-ported by a beam structure. The sewage outlet is hinged withthe base through the flange, and the bottom of the other endis equipped with a weighing sensor. Therefore, the weighingsensor can detect about one-half of the sewage weight inreal-time, and the real-time sewage level and the total sewage
3Journal of Sensors

displacement can be obtained by conversion. In addition, thesewage inlet is connected to the bedpan by a flexible hose,which makes the ST rotate flexibly and enables it to avoidthe influence of the bedpan or pipeline based on the accuracyof the sewage weight detection.
When the system operates, the sewage is blown off by thehigh-pressure air and the weight of the ST decreases contin-uously. When the weighing sensor detects the lower limit ofthe ST weight, it feeds back a signal to the system. Then,the system closes the sewage outlet valve and the high-
6.0e−
01
4.5e−
01
3.0e−
01
0.0e+
00
7.5e−
01
9.0e−
01
1.0e+
00
1.5e−
01
(a)
6.0e−
01
4.5e−
01
3.0e−
01
0.0e+
00
7.5e−
01
9.0e−
01
1.0e+
00
1.5e−
01
(b)
6.0e−01
4.5e−01
3.0e−01
7.9e−06
7.5e−01
9.0e−01
1.0e+00
1.5e−01
(c)
6.0e−01
4.5e−01
3.0e−01
6.4e−04
7.5e−01
9.0e−01
1.0e+00
1.5e−01
(d)
6.1e−01
4.7e−01
3.2e−01
3.3e−02
7.6e−01
9.0e−01
1.0e+00
1.8e−01
(e)
6.6e−01
5.4e−01
4.1e−01
1.6e−01
7.9e−01
9.2e−01
1.0e+00
2.8e−01
(f)
9.5e−01
9.3e−01
9.2e−01
8.8e−01
9.7e−01
9.9e−01
1.0e+00
9.0e−01
(g)
9.7e−01
9.6e−01
9.5e−01
9.3e−01
9.8e−01
9.9e−01
1.0e+00
9.4e−01
(h)
Figure 2: Gas-liquid volume distribution during the blowing-off time from 5 s to 40 s: (a) 5 s, (b) 10 s, (c) 15 s, (d) 20 s, (e) 25 s, (f) 30 s, (g)35 s, and (h) 40 s.
0 5 10 15 20 25 30 35 40
0
20
40
60
80
100
120
140
160
Vol
ume (
L)
Time (s)
Seawater pressure0.5 MPaSeawater pressure1.0 MPa
Seawater pressure1.5 MPaSeawater pressure1.8 MPa
Figure 3: Volume curve of the sewage in the ST.
Seawater pressure0.5 MPaSeawater pressure1.0 MPa
Seawater pressure1.5 MPaSeawater pressure1.8 MPa
0 5 10 15 20 25 30 35 40
0
2
4
6
8
10
12
Flow
rate
(L·s−
1 )
Time (s)
Figure 4: Flow rate curve of the outlet sewage.
4 Journal of Sensors

pressure air valve, which realizes the sewage level detectionand the quantitative sewage blowing-off.
4. Experimental Testing and Results Discussion
4.1. Experimental Testing. In order to verify the effect of real-time sewage level detection, an experimental test system forsimulating the sewage blowing-off is established as shownin Figure 5.
In addition to the weighing sensor, an ultrasonic liquidlevel sensor and a capacitance level sensor are tested andcompared. The ultrasonic liquid level sensor is adsorbed onthe outer wall surface of the ST through its two magneticprobes, and the capacitance opens a hole on the wall surfaceof the ST and is inserted inside it.
The sewage is replaced by salt water and soil. The soilaccounts for about 10% of the total weight of the sewage,and the salinity of the salt water is about 3.5%. The sewageis discharged into the ST from the bedpan, and the ST is con-nected with a back-pressure simulated container through ametal hose. By controlling the pressure of the back-pressuresimulated tank, the seawater pressure can be simulated andadjusted. The overflow valve is used to maintain the pressureof the seawater during the process of the sewage blowing-off,and the pressure relief valve is used to regulate the pressuredifference between the air and the simulated seawater.
4.2. Results and Discussion. The detection effects of the threesensors are shown in Table 1.
The ultrasonic liquid level sensor detects the liquidlevel by transmitting velocity differences in different mediathrough ultrasonic waves, and its characteristics are suitable
for the noncontact liquid level detection of a pressure vessel.But for the ST, either the gas-liquid oscillation intensity orthe dirt thickness of the inner wall surface has great influenceon its detection effect. These factors lead to its response delayof about 60 s to 80 s. The capacitive liquid level sensor usesthe weak change of the different dielectric capacitance nearthe electrode to realize a liquid level signal output. However,when the solid-liquid phase containing salt is attached to itselectrode, it will cause greater interference to the response.The weighing sensor detects the sewage level by detectingthe weight of the sewage in the ST; it responds well in thewhole experimental testing process and its signal output isstable and repeatable.
In order to improve the accuracy of the experimentaltesting, the time of quantitative blowing-off 100 L of the sew-age is tested by using the weighing sensor. Limited by the test
Air compressor
Back-pressuresimulated tank Bedpan
Storage tankWeighingsensor
Pressurerelief valve
Overflowvalve
Capacitancelevel sensor
Ultrasonic liquidlevel sensor
Flexiblehose
Figure 5: Experiment testing system.
Table 1: Detection effect of the three sensors.
Sensor Precision Response state Response time
1Ultrasonic liquid
level sensor±0.5% Effective
Delay of about60 s to 80 s
2Capacitancelevel sensor
±0.5% Ineffective —
3 Weighing sensor ±0.1% Effective Sensitivity
0.05 0.10 0.15 0.20 0.25 0.30
8
10
12
14
16
18
20
22
24
Pressure difference (MPa)
Tim
e (s)
Seawater pressure 0Seawater pressure 0.1 MPaSeawater pressure 0.2 MPa
Figure 6: Time of the sewage blowing-off at low simulated seawaterpressure.
1 2 3 4 5
25.9
26.0
26.1
26.2
26.3
26.4
Test group
Tim
e (pr
essu
re d
iffer
ence
1.6
MPa
) (s)
Pressure difference 1.6 MPaPressure difference 1.9 MPa
20.2
20.4
20.6
20.8
21.0
21.2
21.4
Tim
e (pr
essu
re d
iffer
ence
1.9
MPa
) (s)
Figure 7: Time of the sewage blowing-off at a simulated seawaterpressure of 1.8MPa.
5Journal of Sensors

conditions, the simulated seawater pressure is set at lowpressure (0, 0.1MPa, and 0.2MPa) and high pressure(1.8MPa), and the pressure difference between the high-pressure air and seawater is adjusted by controlling the pres-sure of the high-pressure air. The time of the sewageblowing-off under different pressure differences is tested asshown in Figures 6 and 7.
As can be seen from Figure 6, the lower simulated seawa-ter pressure (0, 0.1MPa, and 0.2MPa) has little effect on thetime of the sewage blowing-off. But a smaller pressure differ-ence, such as 0.05MPa, can quickly blow the sewage off. Andwhen the pressure difference increased from 0.05MPa to0.3MPa, the blowing-off time obviously decreased.
In Figure 7, the time of the sewage blowing-off at a pres-sure difference of 1.9MPa is about 5 s or 6 s faster than that ofthe pressure difference of 1.6MPa. The data indicate that thetime of the sewage blowing-off is proportional to the pressuredifference, which is basically consistent with the result of theabove model and the simulation analysis.
The exhaust noise levels of the conventional sewageblowing-off and quantitative sewage blowing-off are bothtested by the noise meter as shown in Figure 8. The experi-mental environment noise is about 60 db, and the simulatedseawater pressure is 0.2MPa.
As can be seen from Figure 8, with the increase of thepressure difference, both the exhaust noise levels of con-ventional sewage blowing-off and quantitative sewageblowing-off are enhanced. The exhaust noise of quantitativesewage blowing-off is within the range of 90 dB, and the max-imum exhaust noise of conventional sewage blowing-off ismore than 130 dB. Therefore, quantitative sewage blowing-off can effectively reduce the noise of the sewage blowing-off system.
5. Conclusion
In this paper, the real-time liquid level detection is applied tothe sewage blowing-off system, which effectively realizes the
quantitative sewage blowing-off. The main conclusions aredrawn as follows:
(1) By using the weighing sensor, the sewage level can bedetected in real-time and the quantitative sewageblowing-off can be achieved, which can effectivelyavoid the inappropriate blowing-off time
(2) The time of the sewage blowing-off is mainly relatedto the pressure difference between the high-pressureair and seawater. A higher pressure difference canlead to a shorter blowing-off time
(3) Both the exhaust noise levels of conventional sewageblowing-off and quantitative sewage blowing-off areenhanced with the increase of pressure difference,and the quantitative sewage blowing-off can effectivelyreduce the noise of the sewage blowing-off system
Data Availability
The data used to support the findings of this study areincluded within the article.
Conflicts of Interest
The authors declare that they have no conflicts of interest.
Acknowledgments
This work is supported by the WuHan Yellow Crane TalentProgram (Grant No. 17D005).
References
[1] R. Font and J. García-Peláez, “On a submarine hovering sys-tem based on blowing and venting of ballast tanks,” OceanEngineering, vol. 72, pp. 441–447, 2013.
[2] Y. Chen, W. Wang, G. Xu, W. Zhang, and G. Wang, “Waterlevel control of submarine hovering tank based on sliding
0.05 0.10 0.15 0.20 0.25 0.30
83.0
83.5
84.0
84.5
85.0
85.5
86.0
86.5
87.0
Pressure difference (MPa)
Noi
se (q
uant
itativ
e sew
age b
low
ing-
off) (
dB)
Quantitative sewage blowing-off Conventional sewage blowing-off
100
105
110
115
120
125
130
135
Noi
se (c
onve
ntio
nal s
ewag
e blo
win
g-off
) (dB
)
Figure 8: The exhaust noise levels of conventional sewage blowing-off and quantitative sewage blowing-off.
6 Journal of Sensors

mode control,” Indian Journal of Geo-Marine Sciences, vol. 46,pp. 2461–2470, 2017.
[3] J. H. Zhang, K. Hu, and C. B. Liu, “Numerical simulation oncompressed gas blowing ballast tank of submarine,” Journalof Ship Mechanics, vol. 19, no. 04, pp. 363–368, 2015.
[4] H. Liu, J. Pu, Q. Li, and X. Wu, “The experiment research ofsubmarine high-pressure air blowing-off main ballast tanks,”Journal of Harbin Engineering University, vol. 1, 2013.
[5] S. A. Woods, R. J. Bauer, and M. L. Seto, “Automated ballasttank control system for autonomous underwater vehicles,”IEEE Journal of Oceanic Engineering, vol. 37, no. 4, pp. 727–739, 2012.
[6] M. H. Khodayari and S. Balochian, “Modeling and control ofautonomous underwater vehicle (AUV) in heading and depthattitude via self-adaptive fuzzy PID controller,” Journal ofMarine Science and Technology, vol. 20, no. 3, pp. 559–578,2015.
[7] K. Tanakitkorn, P. A.Wilson, S. R. Turnock, and A. B. Phillips,“Depth control for an over-actuated, hover-capable autono-mous underwater vehicle with experimental verification,”Mechatronics, vol. 41, pp. 67–81, 2017.
[8] Y. Liu, X. Zhao, D. Wu, D. Li, and X. Li, “Study on the controlmethods of a water hydraulic variable ballast system for sub-mersible vehicles,” Ocean Engineering, vol. 108, pp. 648–661,2015.
[9] X. Zhao, Y. Liu, M. Han, D. Wu, and D. Li, “Improving theperformance of an AUV hovering system by introducinglow-cost flow rate control into water hydraulic variable ballastsystem,” Ocean Engineering, vol. 125, pp. 155–169, 2016.
[10] X. Xiang, C. Yu, L. Lapierre, J. Zhang, and Q. Zhang, “Surveyon fuzzy-logic-based guidance and control of marine surfacevehicles and underwater vehicles,” International Journal ofFuzzy Systems, vol. 20, no. 2, pp. 572–586, 2018.
[11] L. Yinshui, R. Xiaojun, W. Defa, L. Donglin, and L. Xiaohui,“Simulation and analysis of a seawater hydraulic relief valvein deep-sea environment,” Ocean Engineering, vol. 125,pp. 182–190, 2016.
[12] J. Xia, Y. D. Liao, and K. Yang, “Simulation and experimentalinvestigation of an extra-high pressure pneumatic blowingvalve based on AMESim,” Chinese Journal of Ship Research,vol. 10, pp. 117–122, 2015.
[13] G. Yang, Y. Sun, and B. Li, “Numerical simulation on dynamiccharacteristics of a extra-high pressure pneumatic blowingvalve,” China Mechanical Engineering, vol. 23, pp. 42–45,2012.
[14] M. S. M. Aras, M. N. Kamarudin, I. Zainal, M. K. M. Zambri,and M. Sulaiman, “Analysis of integrated sensor forunmanned underwater vehicle application,” Indian Journalof Geo-Marine Sciences, vol. 46, pp. 2552–2561, 2017.
[15] M. R. Arshad, “Recent advancement in sensor technology forunderwater applications,” Indian Journal of Marineences,vol. 38, pp. 267–273, 2009.
7Journal of Sensors

International Journal of
AerospaceEngineeringHindawiwww.hindawi.com Volume 2018
RoboticsJournal of
Hindawiwww.hindawi.com Volume 2018
Hindawiwww.hindawi.com Volume 2018
Active and Passive Electronic Components
VLSI Design
Hindawiwww.hindawi.com Volume 2018
Hindawiwww.hindawi.com Volume 2018
Shock and Vibration
Hindawiwww.hindawi.com Volume 2018
Civil EngineeringAdvances in
Acoustics and VibrationAdvances in
Hindawiwww.hindawi.com Volume 2018
Hindawiwww.hindawi.com Volume 2018
Electrical and Computer Engineering
Journal of
Advances inOptoElectronics
Hindawiwww.hindawi.com
Volume 2018
Hindawi Publishing Corporation http://www.hindawi.com Volume 2013Hindawiwww.hindawi.com
The Scientific World Journal
Volume 2018
Control Scienceand Engineering
Journal of
Hindawiwww.hindawi.com Volume 2018
Hindawiwww.hindawi.com
Journal ofEngineeringVolume 2018
SensorsJournal of
Hindawiwww.hindawi.com Volume 2018
International Journal of
RotatingMachinery
Hindawiwww.hindawi.com Volume 2018
Modelling &Simulationin EngineeringHindawiwww.hindawi.com Volume 2018
Hindawiwww.hindawi.com Volume 2018
Chemical EngineeringInternational Journal of Antennas and
Propagation
International Journal of
Hindawiwww.hindawi.com Volume 2018
Hindawiwww.hindawi.com Volume 2018
Navigation and Observation
International Journal of
Hindawi
www.hindawi.com Volume 2018
Advances in
Multimedia
Submit your manuscripts atwww.hindawi.com