1 temporary sewage bypass & emergency · pdf file1.1.1.2 during the design stage of the...
TRANSCRIPT

1
1 TEMPORARY SEWAGE BYPASS & EMERGENCY DISCHARGE
1.1 Construction Phase 1.1.1 Potential Temporary Sewage Bypass Scenarios 1.1.1.1 Generally, the potential water quality impacts that may arise during the construction phase of
the project include (i) construction site runoff, (ii) sewage generated from workforce, and (iii) accidental spillage of chemicals. Good management practices and regulations are in place to mitigate the potential water quality impacts and are presented in the EIA Report.
1.1.1.2 During the design stage of the project, there is a need for the design consultant to prepare a
construction sequence plan for the upgrading of SCISTW and the PTWs on Hong Kong Island in order to minimise interruption to the operation of existing plants and prevent discharge of untreated sewage to Victoria Harbour via seawall bypass or submarine outfall. This a common requirement for conducting upgrading works in existing treatment facilities. Referring to the EIA reports of similar project e.g. Shatin STW Stage 3 Upgrading & Tai Po STW Stage 5 Phase 1 Upgrading, discharge of untreated sewage to Tolo Harbour via seawall bypass or submarine outfall during the construction phase are not required.
1.1.1.3 Based on the requirements specified in the consultancy Brief of HATS Stage 2A Upgrading
of the SCISTW and the PTWs - Investigation, Design and Construction, potential sewage discharges from the PTWs in Kowloon may occur during the construction phase of the project when the following modification works to the existing facilities are required under the Project:
• Modification works required for the existing main pumping station and Northwest Kowloon Pumping Station (NWKPS) at SCISTW to enhance maintainability, reliability, operational flexibility and pumping capacity for proper integration with the new works to be constructed under HATS Stage 2A.
• Provision of an interconnection between the existing main influent pumping station and the new influent pumping station on Stonecutters Island to enhance system reliability, flexibility and maintainability of the E&M equipment inside the pumping stations.
1.1.1.4 When the above modification works are required, sewage bypass from the Stage 1 tunnel
system to Victoria Harbour via the submarine outfalls at the Stage 1 PTWs is likely to be required to ensure a safe working environment.
1.1.1.5 The existing NWKPS will be inadequate to handle the future projected flow. Upgrading of the
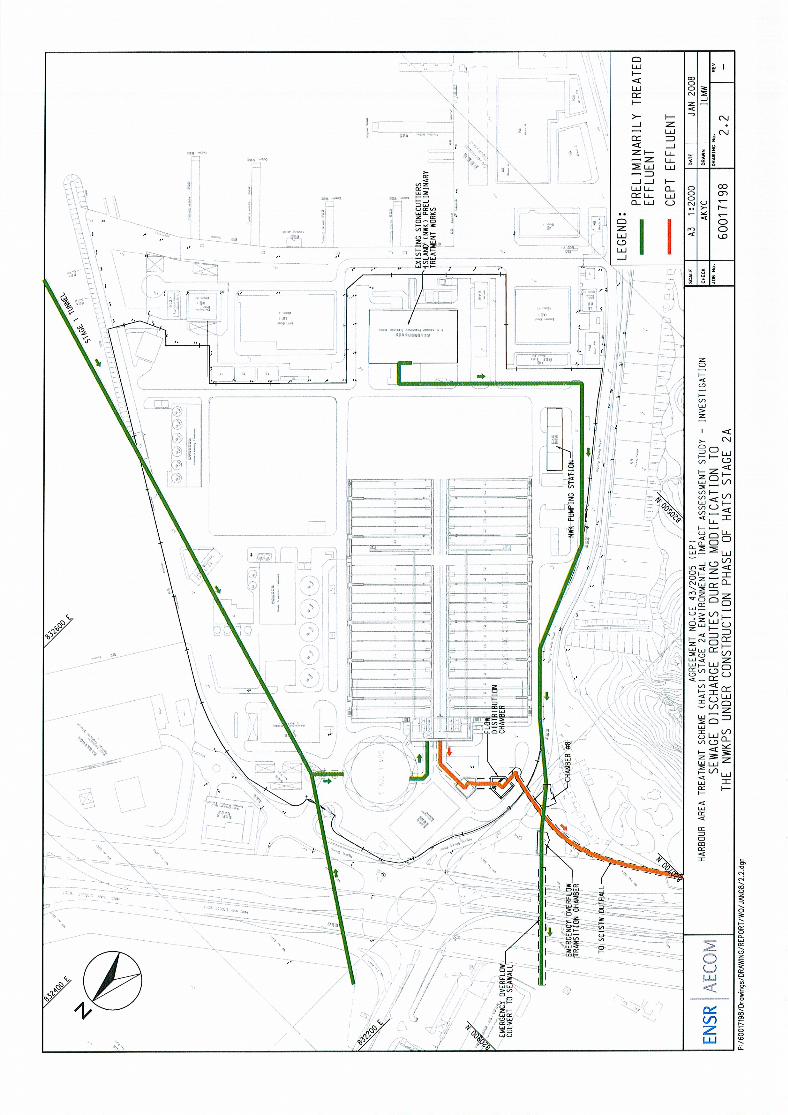
existing NWKPS or diversion of excess flow to the new influent pumping station would be required. Discharge of preliminarily treated sewage from Northwest Kowloon PTW to the effluent box culvert via the emergency bypass chamber may occur when constructing the modification works to the NWKPS. The preliminarily treated sewage from NWKPTW will be discharged to the Harbour via the seawall bypass while the preliminarily treated sewage from other Stage 1 PTWs will be under CEPT process at SCISTW before discharging to Victoria Harbour via the submarine outfall at Stonecutters Island.
1.1.1.6 The consultancy for the HATS Stage 2A Upgrading of the SCISTW and the PTWs -
Investigation, Design and Construction has been commissioned by DSD in August 2007. It is understood that the upgrading scheme for the upgrading of SCISTW has not been formulated at this stage. For allowing more flexibility to the design consultant in formulating the upgrading scheme for SCISTW, potential water quality impacts arising from the discharge of sewage from the Stage 1 PTWs and the NWKPS have been assessed in the EIA. In order to assess the magnitude of the water quality impacts, the predicted results from the sewage bypass scenarios are compared with the scenario under normal operation.
1.1.1.7 Table 2.1 summaries the potential sewage bypass scenarios identified for the construction
phase. The discharge volumes of the identified sewage bypass scenarios are shown in Table 2.2. The water qualities of the sewage for the temporary sewage bypass scenarios are presented in Tables 3.1 and 3.3 of Section 3.

2
Table 2.1 – Temporary Sewage Bypass Scenarios for the Construction Phase
Scenario Discharge Route Discharge Volume
Discharge Duration
(i) Modification to the existing main pumping station
Preliminary treated effluent → submarine outfalls at the Stage 1 PTWs ** (except for NWK PTW) Sewage flow from NWK PTW will be under CEPT process at SCISTW and discharged via the submarine outfall of SCISTW (refer to Figure 2.3)
Projected flow for 2014 of each PTW
(ii) Interconnection between the existing main pumping station and the new pumping station
Preliminary treated effluent → submarine outfalls at the Stage 1 PTWs ** (except for NWK PTW) Sewage flow from NWK PTW will be under CEPT process at SCISTW and discharged via the submarine outfall of SCISTW (refer to Figure 2.3)
Projected flow for 2014 of each PTW
2 weeks
CEPT effluent (excluding the flow from NWK PTW)
→ submarine outfall at Stonecutters Island
Projected flow for SCISTW without NWK PTW
(iii) Modification to the existing Northwest Kowloon Pumping Station
Preliminary treated effluent from NWK PTW
→ seawall bypass at Stonecutters Island (refer to Figure 2.2)
Projected flow for NWK PTW
2 weeks
Notes: (1) HATS Stage 2A works are scheduled to be completed by 2014. Thus, the preliminary
treated effluent from the Stage 2 PTWs will still be discharged to the Harbour via submarine outfalls at PTWs before 2014.
** Periodic flushing of these existing outfalls is being carried out by DSD to maintain the serviceability of these outfalls.
1.1.1.8 It should be noted that Scenario (i) and Scenario (ii) can be implemented at the same time.
As a worst-case scenario, the discharge duration of 2 weeks is adopted for EIA purpose, based on the latest information provided by the design consultant of this Project. The design consultancy should take effort to schedule the modification and interconnection works, if needed, at the same time in order to minimise the discharge duration.
1.1.1.9 For Scenario (iii), as a worst-case scenario, the discharge duration of 2 weeks is adopted for
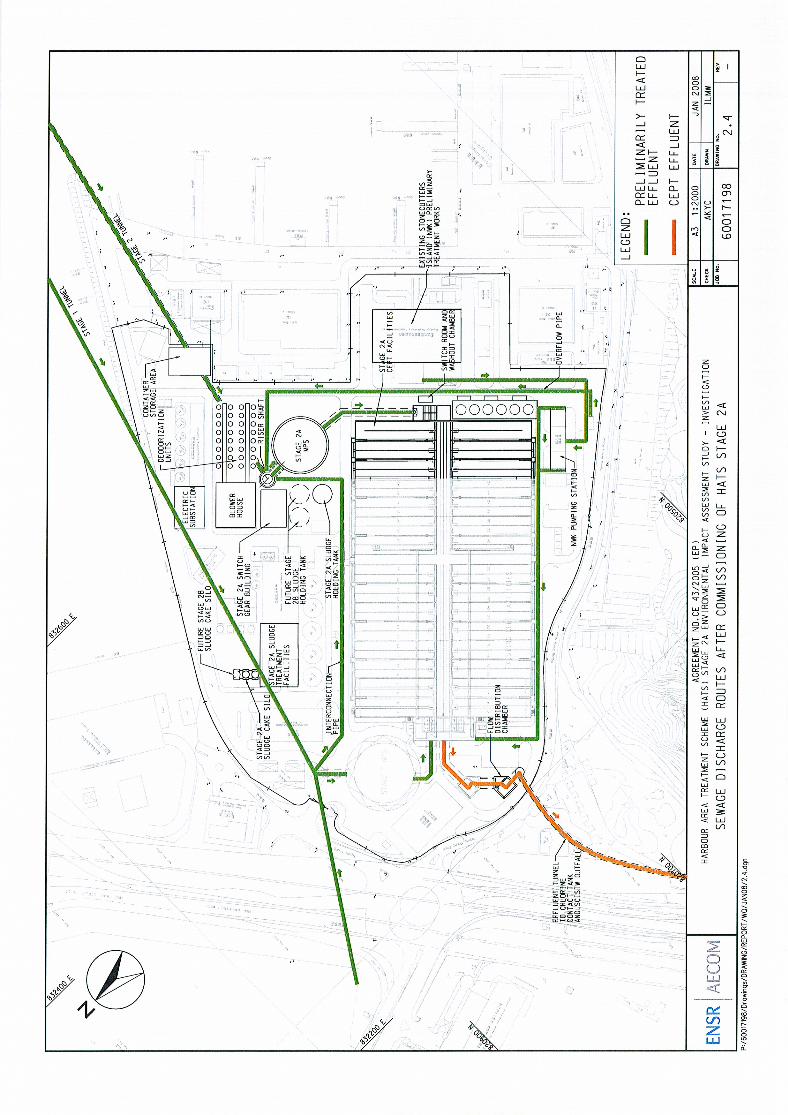
EIA purpose, based on the latest information provided by the design consultants of this Project. The design consultancy should take effort to reduce the discharge duration. For example, divert the flow from NWKPTW to the new influent pumping station before constructing the modification works for the NWKPS. For conservative sake, the total flow from NWK PTW is assumed to be discharged to the Harbour via the seawall bypass at Stonecutters Island.. Figure 2.1 and Figure 2.4 show the sewage discharge routes during normal operation of HATS Stage 1 and HATS Stage 2A respectively. Figure 2.2 and Figure 2.3 show the sewage discharge routes during the modification / interconnection scenarios under the construction phase of the Project as described in Table 2.1.
1.1.1.10 The pollution loading for water quality assessment is calculated based on the discharge
flowrate shown in Table 2.2 and water qualities shown in Tables 3.1 and 3.3.

3
Table 2.2 – Projected Flows for Year 2014
Stage 1
Projected Average Flows for Year 2014
(m3/day)
Stage 2
Projected Average Flows for Year 2014
(m3/day)
Chai Wan PTW 59,500 Sandy Bay PTW 5,300
Shau Kei Wan PTW 79,100 Cyberport PTW 8,300
Tseung Kwan O PTW 147,400 Wah Fu PTW 9,700
Kwun Tong PTW 326,400 Aberdeen PTW 79,800
To Kwa Wan PTW 230,000 Ap Lei Chau PTW 36,000
Kwai Chung PTW 234,000 North Point PTW 101,000
Tsing Yi PTW 58,800 Wan Chai East PTW 155,900
SCISTW without NW Kowloon PTW
1,135,400 Central PTW 117,300
NW Kowloon PTW 415,000
Notes: (1) Estimated based on the flows in TN on Flow and Load Projections (Part 1 and Part 2) (April 2007).
(2) Roundup figures.
1.1.2 Modelling Scenarios
1.1.2.1 Two modelling scenarios are proposed for construction phase, namely Scenario D and Scenario E respectively.
Scenario D
1.1.2.2 Scenario D aims to assess the worst-case sewage bypass for a period of 2 weeks at the
submarine outfalls of all the Stage 1 PTWs (except for NWK PTW) in 2014 during the construction phase. Sewage flow from NWK PTW will be under CEPT process at SCISTW and discharged via the submarine outfall of SCISTW during the sewage bypass period. Scenario A addresses the water quality impacts due to the modification works at the existing main pumping station and the interconnection between the existing main pumping station and the new pumping station, i.e. Items (i) and (ii) respectively in Table 2.1. The assumed flow and the pollution concentrations for the Stage 1 PTWs are provided in Table 2.2 and Table 3.1 respectively. Two alternative sewage bypass periods covering the typical dry season and wet season respectively were assessed. It is assumed that each sewage bypass event will occur for a period of 2 weeks covering a typical spring-neap tidal cycle.
Scenario E
1.1.2.3 Scenario E covers the impact due to the modification work at the existing NWK PTW, i.e.
Item (iii) in Table 2.1. It is assumed that the sewage flow from the NWK PTW would be discharged to the Harbour via the seawall bypass at Stonecutters Island while the CEPT effluent from SCISTW (from other Stage 1 PTWs) would be discharged via the submarine outfall of SCISTW. The effluent flow of SCISTW have been assumed to be 1.14 Mm
3 per day
under this scenario. The measured effluent pollution concentrations for SCISTW were used for calculating the pollution loading of SCISTW for model input. The loading from NWK PTW was calculated based on the assumed flow and the pollution concentrations provided in Table 2.2 and Table 3.1 respectively. Similar to Scenario D, two alternative simulation periods are proposed to assess the water quality changes under typical dry season and wet season respectively. It is assumed that each sewage bypass event will occur for a period of 2 weeks covering a typical spring-neap tidal cycle.
1.2 Operation Phase 1.2.1.1 Before identifying the sewage emergency discharge scenarios for the operation phase of the
Project, review of the tunnel system design, historical emergency discharge records of HATS,

4
and precautionary design measures to control emergency discharge has been conducted. 1.2.1 Design of HATS Tunnel System 1.2.1.1 The Stage 1 tunnel was designed to provide adequate capacity to carry the seasonal and
diurnal dry weather flow variations. This is intended to be 2.0 times ADWF for large catchments and 2.2 times ADWF for smaller catchments. Adoption of this design philosophy means that flows in excess of these peaking factors, presumably associated with rainfall events would be passed through the PTWs for preliminary treatment, and then discharged to Victoria Harbour via submarine outfalls or seawall bypasses when the existing submarine outfalls are no longer serviceable. It is understood that the same design philosophy as the Stage 1 tunnel has been adopted in the design of the Stage 2 tunnel.
1.2.1.2 In using the peaking factors of 2.0 or 2.2 in the development of design flows for the tunnel
segments, the assumption was made that these peak flows would be coincident, and thus additive. Accordingly, the estimated peak flow in the tunnel for design purpose was taken to be the sum of the peak flows upstream of the point in question. No allowance would be made for any attenuation of these peaks resulting either from in-system storage (which would be small, owing to the design concept of the tunnel system), or from the fact that not all catchments will peak at the same time.
1.2.1.3 According to the Design Memorandum of the HATS Stage 1 System, sewage emergency
discharge associated with heavy rainfalls from the Stage 1 PTWs to Victoria Harbour via submarine outfalls or seawall bypass was estimated based on the capacity difference between the PTWs and the tunnel segments. As a very conservative assumption, similar approach has been adopted in this Project to calculate the overflow rates for HATS Stage 1 and Stage 2 system as provided in Table 2.6(b) below.
1.2.1.4 It should be noted that the calculated overflow rates adopted in the modelling exercise are based on the assumption that a peaking factor of 2.0 times ADWF would be applied for the tunnel system, which is deviated from the latest design of using a lower peaking factor of 1.7 times ADWF (Section 2.23 of the main EIA text refers). For the purpose of water quality modelling, the duration of emergency discharge associated with heavy rainfall from PTWs is assumed to be 8 hours, which is made reference to the historical records (see Section 2.2.2 below), resulting a total discharge volume of 358,848 m
3 per overflow event. It should be
highlighted that the total overflow volume of 358,848 m3 adopted in the modelling is based on
a very adverse assumption of using the peak overflow values (refer to Table 2.6(b) below) for continuous discharge of 8 hours. In reality, the peak flow rates would occur during a short period of time within the overflow period. It is also assumed that the peak overflow discharge would occur at all the PTWs at the same time for 8 hours. This is also extremely conservative due to the fact that not all the catchments will peak at the same time. As such, under the real situation, the actual overflow volume should be much smaller than the extreme value of 358,848 m
3.
1.2.1.5 Analysis of the actual flow data collected from SCISTW and the actual performance of the
HATS Stage 1 system indicated that the projected volume of overflow from the whole HATS system under the worst-case condition in the ultimate year would be only about 560,000 m
3
per year as a result of using a lower peaking factor of 1.7 times ADWF for the tunnel system, which is based on the latest information provided by the design consultant of this Project. As the overflow event would occur for a number of times within a year, the worst-case overflow volume per event (based on the peaking factor of 1.7 times ADWF and the analysis of actual flow records) would still be smaller than the extreme overflow value (358,848 m
3) assumed in
this modelling exercise. As such, the water quality impact arising from using a lower peaking factor (1.7 times ADWF) for the tunnel system would be covered under the modelling scenario assumed in this EIA.
1.2.2 Historical Records (2002-2005) 1.2.2.1 The historical emergency discharge records of the Stage 1 PTWs and SCISTW for the
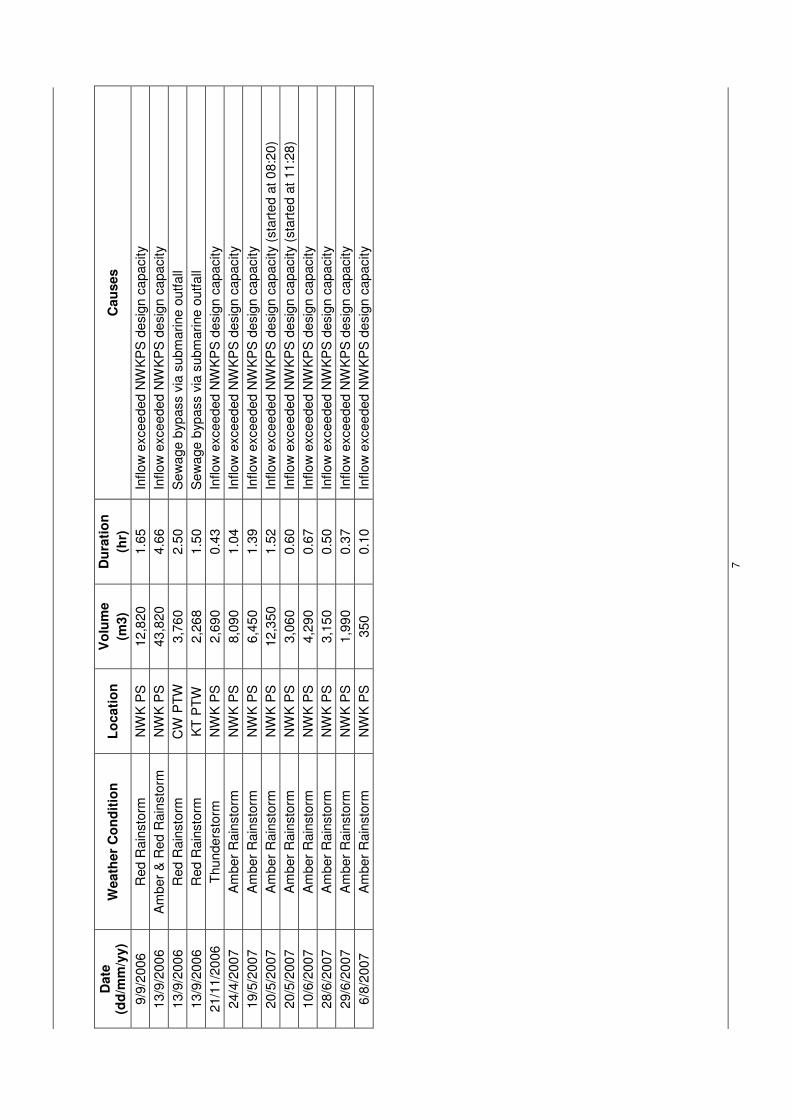
period from January 2005 to August 2007 were reviewed in order to understand the main causes of emergency discharges during the operation of HATS. Table 2.3 is a summary
5
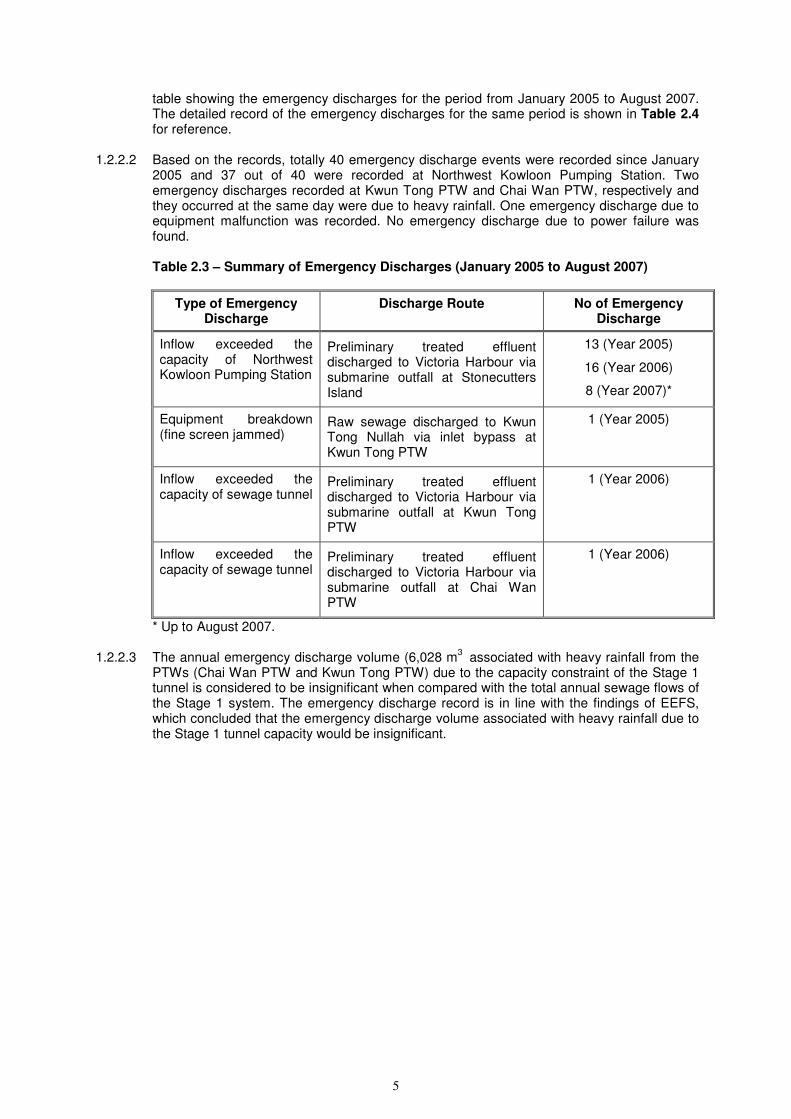
table showing the emergency discharges for the period from January 2005 to August 2007. The detailed record of the emergency discharges for the same period is shown in Table 2.4 for reference.
1.2.2.2 Based on the records, totally 40 emergency discharge events were recorded since January
2005 and 37 out of 40 were recorded at Northwest Kowloon Pumping Station. Two emergency discharges recorded at Kwun Tong PTW and Chai Wan PTW, respectively and they occurred at the same day were due to heavy rainfall. One emergency discharge due to equipment malfunction was recorded. No emergency discharge due to power failure was found.
Table 2.3 – Summary of Emergency Discharges (January 2005 to August 2007)
Type of Emergency Discharge
Discharge Route No of Emergency Discharge
Inflow exceeded the capacity of Northwest Kowloon Pumping Station
Preliminary treated effluent discharged to Victoria Harbour via submarine outfall at Stonecutters Island
13 (Year 2005)
16 (Year 2006)
8 (Year 2007)*
Equipment breakdown (fine screen jammed)
Raw sewage discharged to Kwun Tong Nullah via inlet bypass at Kwun Tong PTW
1 (Year 2005)
Inflow exceeded the capacity of sewage tunnel
Preliminary treated effluent discharged to Victoria Harbour via submarine outfall at Kwun Tong PTW
1 (Year 2006)
Inflow exceeded the capacity of sewage tunnel
Preliminary treated effluent discharged to Victoria Harbour via submarine outfall at Chai Wan PTW
1 (Year 2006)
* Up to August 2007. 1.2.2.3 The annual emergency discharge volume (6,028 m
3 associated with heavy rainfall from the
PTWs (Chai Wan PTW and Kwun Tong PTW) due to the capacity constraint of the Stage 1 tunnel is considered to be insignificant when compared with the total annual sewage flows of the Stage 1 system. The emergency discharge record is in line with the findings of EEFS, which concluded that the emergency discharge volume associated with heavy rainfall due to the Stage 1 tunnel capacity would be insignificant.

6
Tab
le 2
.4 –
Sew
ag
e O
verf
low
Reco
rds (
Jan
ua
ry 2
005 –
Au
gu
st
20
07)
Date
(d
d/m
m/y
y)
Weath
er
Co
nd
itio
n
Lo
cati
on
V
olu
me
(m3)
Du
rati
on
(hr)
C
au
ses
27/5
/200
5
Am
ber
Rain
sto
rm
NW
K P
S
4,3
40
1.1
In
flo
w e
xcee
ded N
WK
PS
desig
n c
apacity
24/6
/200
5
Red R
ain
sto
rm
NW
K P
S
41,4
30
5.2
5
Inflo
w e
xcee
ded N
WK
PS
desig
n c
apacity
29/6
/200
5
Thunders
torm
N
WK
PS
5,0
60
0.7
5
Inflo
w e
xcee
ded N
WK
PS
desig
n c
apacity
13/8
/200
5
Am
ber
Rain
sto
rm
NW
K P
S
4,8
20
0.6
5
Inflo
w e
xcee
ded N
WK
PS
desig
n c
apacity (
sta
rte
d a
t 1
2:1
9)
13/8
/200
5
Am
ber
Rain
sto
rm
NW
K P
S
750
0.2
In
flo
w e
xcee
ded N
WK
PS
desig
n c
apacity (
sta
rte
d a
t 2
2:3
1)
19/8
/200
5
Hea
vy R
ain
N
WK
PS
6,6
90
0.8
8
Inflo
w e
xcee
ded N
WK
PS
desig
n c
apacity (
sta
rte
d a
t 0
9:0
6)
19/8
/200
5
Am
ber
Rain
sto
rm
NW
K P
S
11,6
70
1.7
8
Inflo
w e
xcee
ded N
WK
PS
desig
n c
apacity (
sta
rte
d a
t 1
9:1
3)
19/8
/200
5
Thunders
torm
N
WK
PS
21,0
30
4.3
6
Inflo
w e
xcee
ded N
WK
PS
desig
n c
apacity (
sta
rte
d a
t 0
4:0
9)
19/8
/200
5
Hea
vy R
ain
K
TP
TW
29,0
00
2.1
7
Fin
e s
cre
ens jam
med b
y larg
e s
ized
waste
s,
dis
charg
e to K
wun
Tong N
ulla
h v
ia inle
t b
yp
ass
20/8
/200
5
Am
ber
Rain
sto
rm
NW
K P
S
72,2
60
7.4
9
Inflo
w e
xcee
ded N
WK
PS
desig
n c
apacity
30/8
/200
5
Thunders
torm
N
WK
PS
100
0.0
5
Inflo
w e
xcee
ded N
WK
PS
desig
n c
apacity
4/9
/2005
Thunders
torm
N
WK
PS
6,3
80
1.4
2
Inflo
w e
xcee
ded N
WK
PS
desig
n c
apacity
25/9
/200
5
Hea
vy R
ain
N
WK
PS
1,0
20
0.5
3
Inflo
w e
xcee
ded N
WK
PS
desig
n c
apacity (
sta
rte
d a
t 0
3:0
2)
25/9
/200
5
Hea
vy R
ain
N
WK
PS
4,7
60
0.7
3
Inflo
w e
xcee
ded N
WK
PS
desig
n c
apacity (
sta
rte
d a
t 1
0:5
3)
24/4
/200
6
Red &
Bla
ck R
ain
sto
rm
NW
K P
S
14,7
40
1.5
9
Inflo
w e
xcee
ded N
WK
PS
desig
n c
apacity
2/5
/2006
Red R
ain
sto
rm
NW
K P
S
6,3
80
0.6
8
Inflo
w e
xcee
ded N
WK
PS
desig
n c
apacity (
sta
rte
d a
t 2
1:1
9)
2/5
/2006
Red R
ain
sto
rm
NW
K P
S
4,2
00
0.6
2
Inflo
w e
xcee
ded N
WK
PS
desig
n c
apacity (
sta
rte
d a
t 2
3:0
3)
2/5
/2006
Red R
ain
sto
rm
NW
K P
S
1,1
10
0.2
7
Inflo
w e
xcee
ded N
WK
PS
desig
n c
apacity (
sta
rte
d a
t 0
2:5
3)
2/6
/2006
Am
ber
& R
ed R
ain
sto
rm
NW
K P
S
24,9
30
2.7
5
Inflo
w e
xcee
ded N
WK
PS
desig
n c
apacity
9/6
/2006
Am
ber
& R
ed &
Bla
ck
NW
K P
S
45,2
50
3.8
2
Inflo
w e
xcee
ded N
WK
PS
desig
n c
apacity
13/6
/200
6
Am
ber
& R
ed R
ain
sto
rm
NW
K P
S
13,4
80
1.4
5
Inflo
w e
xcee
ded N
WK
PS
desig
n c
apacity
22/6
/200
6
Thunders
torm
N
WK
PS
8,8
20
1.2
5
Inflo
w e
xcee
ded N
WK
PS
desig
n c
apacity
28/6
/200
6
Thunders
torm
N
WK
PS
4,4
60
0.6
4
Inflo
w e
xcee
ded N
WK
PS
desig
n c
apacity
8/7
/2006
Thunders
torm
& A
mber
NW
K P
S
8,2
40
1.2
3
Inflo
w e
xcee
ded N
WK
PS
desig
n c
apacity
28/7
/200
6
Thunders
torm
N
WK
PS
1,3
20
0.2
7
Inflo
w e
xcee
ded N
WK
PS
desig
n c
apacity (
sta
rte
d a
t 0
4:0
3)
28/7
/200
6
Am
ber
Rain
sto
rm
NW
K P
S
5,2
80
0.8
0
Inflo
w e
xcee
ded N
WK
PS
desig
n c
apacity (
sta
rte
d a
t 0
9:1
1)
29/7
/200
6
Thunders
torm
N
WK
PS
2,3
90
0.3
8
Inflo
w e
xcee
ded N
WK
PS
desig
n c
apacity
7
Date
(d
d/m
m/y
y)
Weath
er
Co
nd
itio
n
Lo
cati
on
V
olu
me
(m3)
Du
rati
on
(hr)
C
au
ses
9/9
/2006
Red R
ain
sto
rm
NW
K P
S
12,8
20
1.6
5
Inflo
w e
xcee
ded N
WK
PS
desig
n c
apacity
13/9
/200
6
Am
ber
& R
ed R
ain
sto
rm
NW
K P
S
43,8
20
4.6
6
Inflo
w e
xcee
ded N
WK
PS
desig
n c
apacity
13/9
/200
6
Red R
ain
sto
rm
CW
PT
W
3,7
60
2.5
0
Se
wa
ge b
yp
ass v
ia s
ubm
arine o
utf
all
13/9
/200
6
Red R
ain
sto
rm
KT
PT
W
2,2
68
1.5
0
Se
wa
ge b
yp
ass v
ia s
ubm
arine o
utf
all
21/1
1/2
006
Thunders
torm
N
WK
PS
2,6
90
0.4
3
Inflo
w e
xcee
ded N
WK
PS
desig
n c
apacity
24/4
/200
7
Am
ber
Rain
sto
rm
NW
K P
S
8,0
90
1.0
4
Inflo
w e
xcee
ded N
WK
PS
desig
n c
apacity
19/5
/200
7
Am
ber
Rain
sto
rm
NW
K P
S
6,4
50
1.3
9
Inflo
w e
xcee
ded N
WK
PS
desig
n c
apacity
20/5
/200
7
Am
ber
Rain
sto
rm
NW
K P
S
12,3
50
1.5
2
Inflo
w e
xcee
ded N
WK
PS
desig
n c
apacity (
sta
rte
d a
t 0
8:2
0)
20/5
/200
7
Am
ber
Rain
sto
rm
NW
K P
S
3,0
60
0.6
0
Inflo
w e
xcee
ded N
WK
PS
desig
n c
apacity (
sta
rte
d a
t 1
1:2
8)
10/6
/200
7
Am
ber
Rain
sto
rm
NW
K P
S
4,2
90
0.6
7
Inflo
w e
xcee
ded N
WK
PS
desig
n c
apacity
28/6
/200
7
Am
ber
Rain
sto
rm
NW
K P
S
3,1
50
0.5
0
Inflo
w e
xcee
ded N
WK
PS
desig
n c
apacity
29/6
/200
7
Am
ber
Rain
sto
rm
NW
K P
S
1,9
90
0.3
7
Inflo
w e
xcee
ded N
WK
PS
desig
n c
apacity
6/8
/2007
Am
ber
Rain
sto
rm
NW
K P
S
350
0.1
0
Inflo
w e
xcee
ded N
WK
PS
desig
n c
apacity

8
1.2.3 Precautionary Measures to Control Emergency Discharge 1.2.3.1 The historical records show that the number of emergency discharges at the Stage 1 PTWs
arising from equipment malfunctions and power failure is low. This is probably due to the provision of precautionary measures e.g. standby equipment and backup power supply at the Stage 1 facilities to control emergency discharge.
1.2.3.2 Similar precautionary measures should be implemented at the Stage 2 PTWs and SCISTW
under the upgrading consultancy to reduce the risk of failure of pumping stations and other E&M equipment, which would result in an emergency discharge of sewage. The following precautionary measures, but not limited to, should be included as far as practicable in the design of the Stage 2A upgrading:
• Standby unit should be provided to facilitate maintenance and repairing of equipment;
• Dual (back-up) power supply should be provided. Dual power supply could be in the
format of ring main, or an automatic-operated emergency generator with sufficient
capacity to cope with the demand loading of the essential plant equipment;
• If the facility is unmanned, a telemetry system should be provided to the nearest manned
plant so that swift actions could be taken in the case of malfunction of the unmanned
facilities; and
• Manually cleaned screens should be provided at the overflow bypass to prevent the
discharge of floating solids into receiving water.
1.2.4 Potential Emergency Discharge Scenarios 1.2.4.1 Table 2.5 shows the identified emergency discharge scenarios for the operation phase. The
emergency discharge scenarios are identified based on the historical emergency discharge records, discussion with DSD/ST2, and the preliminary design for the SCISTW and the PTWs upgrading.
1.2.4.2 Under the current deign, in the emergency event when the tunnel systems or the submarine
outfall at Stonecutters Island are out of operation and power failure of SCISTW, preliminary treated effluent will be discharged directly from the PTWs into Victoria Harbour via submarine outfalls. The occurrence of malfunction of tunnel systems or submarine outfall would be very remote given the very robust design of these components. However, in the event that it did happen it may take considerable time to repair the tunnel systems and submarine outfall. The water quality of Victoria Harbour would go back to the pre-HATS situation. No water quality assessment would be conducted for these very remote events.
1.2.4.3 Scenario (i) – Emergency discharges of preliminarily treated effluent from the PTWs to the Harbour may occur during heavy rainfall via submarine outfalls or seawall bypasses when the existing submarine outfalls are no longer serviceable. Based on the historical records, emergency discharges due to heavy rainfall are low and the discharge volume is insignificant when compared with the total sewage from HATS.
1.2.4.4 As a very conservative assumption, the volume of emergency discharge at the PTWs due to
heavy rainfall is assumed to be the design capacity difference between the PTWs and the tunnel segments (see Table 2.6). The duration of emergency discharge associated with heavy rainfall from PTWs is assumed to be 8 hours, which is made reference to the historical records. The water quality of the discharge is calculated based on the 3:1 mix following the EEFS. Emergency discharge via the submarine outfall of the PTW would achieve a greater dilution and dispersion effect as compared to the scenario via the seawall bypass. For the purpose of this EIA, it is assumed that all the emergency discharges occur at the PTWs during the operational phase would be via the seawall bypass for conservative assessment.
1.2.4.5 Scenario (ii) – Provision of standby unit(s) would reduce the risk of equipment breakdown at
the PTWs. With provision of standby unit(s) at the PTWs, in the emergency discharge event when one or two equipment are out of operation the raw sewage will be discharged directly to the Harbour via seawall bypass. A 50% of the projected ultimate flow (e.g. one unit is out of service) of each PTW is assumed to be the emergency discharge volume with a discharge duration of 8 hours.

9
1.2.4.6 Scenario (iii) – In the emergency discharge event when power failure occurs at PTWs the
raw sewage will be discharged directly to the Harbour via seawall bypass. It should be noted that no power failure has been occurred at the PTWs since its commissioning. Discharge duration of 6 hours is assumed for EIA purpose based on the experience of other sewage treatment works e.g. Tai Po STW.
1.2.4.7 Scenario (iv) – When power failure occurs at SCISTW, the preliminary treated effluent will
be discharged directly to the Harbour via seawall bypass at the PTWs. Discharge duration of 6 hours is assumed based on the experience of other sewage treatment works. It should be noted that no power failure has occurred at SCISTW since its commissioning. The occurrence of this scenario is remote as dual power supply is provided at SCISTW.
1.2.4.8 Scenario (v) – Discharge of the preliminary treated effluent directly to the Harbour via seawall bypass at the PTWs represents the worst-case scenario for equipment breakdown at SCISTW. Sufficient standby equipment and standby treatment facilities will be provided at the SCISTW. Emergency discharge due to equipment malfunction at SCISTW would be remote. It should be noted that no emergency discharge due to equipment failure has occurred at SCISTW since its commissioning. For the purpose of water quality modelling, discharge duration of 6 hours is assumed based on the experience of other sewage treatment works.
1.2.4.9 Scenario (vi) – NWKPS is physically distinct from the Stage 1 tunnel system. Under the
upgrading of SCISTW, improvement measures to control emergency discharge of preliminary treatment effluent associated with heavy rainfall will be provided. It is expected that the frequency and volume of emergency discharge of preliminary treated effluent associated with heavy rainfall from NWKPS will be significantly reduced after the upgrading of SCISTW. For assessment purpose, the maximum discharge rate of some 12,000 m
3/hr
based on the historical overflow records is adopted as a worst-case scenario. Discharge duration of 8 hours is assumed based on the historical overflow records.
1.2.4.10 Scenario (vii) – It is concluded from the hydraulic design for HATS that the effluent and submarine outfall system of HATS would have adequate capacity to convey effluent into sea without any overflow under peak design flow and highest astronomical tide condition. However, under the condition when the extreme tide event (i.e. tide level higher than the highest astronomical tide) coincides with the peak flow, some treated effluent of SCISTW may overflow to the harbour via the North West Kowloon Outfall (NWKO) as detailed in the subsequent sections.
1.2.4.11 The SCISTW effluent would overflow at the NWKO only when the tide level reaches 2.95 mPD (which would occur only once in 5 years) at the same time when the SCISTW effluent flow exceeds the threshold value of 55.93 m
3/s (equivalent to 98% of the design peak flow
value). Under such circumstances, some disinfected CEPT effluent would be discharged at the NWKO in a rate of 0.52m
3/s only (which is equivalent to 0.9% of the total SCISTW design
flow rate of 55.6m3/s). When the tide level is below 2.95 mPD, no overflow would occur even
if the SCISTW flow reaches its peak rate.
1.2.4.12 Under the 1 in 50 year extreme tide condition (i.e. when the tide level reaches 3.35 mPD), the disinfected CEPT effluent would be discharged at the NWKO only if the SCISTW effluent flow exceeds 53.7.m
3/s (equivalent to 95% of the design peak flow of SCISTW). Under such
circumstances, the overflow would be discharged at a rate of 1.43 m3/s (equivalent to only 2.5% of the total SCISTW design flow rate of 55.6 m
3/s) and the frequency of its occurrence
would be (at most) once in 50 years. When the SCISTW effluent flow value is at or below 53.7 m
3/s, no overflow would occur even under the 1 in 50 year extreme tide condition.
1.2.4.13 It should be highlighted that the overflow would only occur when the effluent flow exceeds 95% of the design peak flow under the 1 in 50 year extreme tide condition. Based on the analysis of the typical diurnal flow pattern measured at SCISTW during HATS Stage 1 as shown below, the effluent flow values that are higher than 95% of the peak flow value is expected to last for less than 1 hour only. It is therefore expected that the overflow period would not exceed 1 hour.

10
0100002000030000400005000060000700008000090000
0:00 1:00 2:00 3:00 4:00 5:00 6:00 7:00 8:00 9:00 10:00 11:00 12:00 13:00 14:00 15:00 16:00 17:00 18:00 19:00 20:00 21:00 22:00 23:00HourHourHourHourDiurnal Flow Value (m3)Diurnal Flow Value (m3)Diurnal Flow Value (m3)Diurnal Flow Value (m3)
Measured Diurnal Flow Pattern at HATS Stage 195% of Measured Peak Diurnal Flow
Figure 2.5 Measured Diurnal Flow Pattern at SCISTW
1.2.4.14 The location of the NWK outfall is shown in Figure 2.6 below.
Figure 2.6 Locations of NWK Outfall and SCISTW Submarine Outfall
1.2.4.15 In summary, the overflow at NWKO would occur at most once in 5 years with a discharge duration of less than 1 hour, and the discharge quality would be high (CEPT plus disinfection) with the total discharge volume of no more than 3% of the total SCISTW effluent flow. In addition the NWKO is located at the northern fairway (in close vicinity of
SSCCIISSTTWW SSUUBBMMAARRIINNEE
OOUUTTFFAALLLL
NNWWKK
OOUUTTFFAALLLL

11
the HATS submarine outfall) with high current speeds and dispersion capacity. It is expected that the water quality impact associated with the small discharge of disinfected CEPT effluent (<3% of the total SCISTW outfall) at the NWKO would be minor. The overflow discharge would not cause any adverse water quality impact on the distant water sensitive receivers (which are more than 4 km away). No water quality modelling is therefore proposed for this overflow scenario.
1.2.4.16 Scenario (viii) – Chlorination disinfection will be provided under the Stage 2A upgrading. When the dosing facility fails, the undisinfected CEPT effluent will be discharged to the Harbour via the submarine outfall at Stonecutters Island. The emergency discharge scenarios adopted in this EIA followed the scenarios adopted in the EIA Study, “HATS EIA for the Provision of Disinfection Facilities at SCISTW – Investigation”. Brief description together with the impacts by the emergency discharge scenarios for breakdown of disinfection facility at SCISTW are provided in the EIA report.
1.2.4.17 Sufficient standby equipment and treatment facilities will be provided at the SCISTW.
Emergency discharge due to equipment malfunction at SCISTW would be extremely remote and is therefore not assessed. The pollution loading for water quality assessment is calculated based on the discharge flowrate shown in Tables 2.6 and 2.7, and water qualities shown in Tables 3.1 to 3.3.
Table 2.5 – Emergency Discharge Scenarios for the Operation Phase
Scenario Discharge Route Discharge Volume
Discharge Duration
(i) Capacity constraint of the Stages 1 and 2 tunnel systems due to heavy rainfall
Diluted preliminary treated effluent (3:1 mix following EEFS, refer to Table 3.2)
→ seawall bypass at all the Stages 1 and 2 PTWs (except for NWK PTW, refer to Item v below)
See Table 2.6
8 hours
(ii) Equipment malfunction at Stage 2 PTWs
Raw sewage
→ seawall bypass at Stage 2 PTWs
50% of the projected ultimate flow of each PTW
8 hours
(iii) Power failure at Stage 2 PTWs
Raw sewage
→ seawall bypass at Stage 2 PTWs
Projected ultimate flow of each PTW
6 hours
(iv) & (v) Power / equipment failure at SCISTW
Preliminary treated effluent
→ seawall bypass at all the Stages 1 and 2 PTWs
Projected ultimate flow of each PTW
6 hours
Disinfected CEPT effluent
→ submarine outfall at Stonecutters Island
Projected ultimate flow of SCISTW
(vi) Capacity constraint of Northwest Kowloon Pumping Station due to heavy rainfall
Diluted preliminary treated effluent from NWK PTW (3:1 mix following EEFS, refer to Table 3.2)
→ seawall bypass at Stonecutters Island
12,000 m3/hr
(1) of diluted
preliminary treated effluent from NWK PTW
8 hours
(vii) Extreme tide condition in combination with peak SCISTW effluent flow
Overflow of disinfected CEPT effluent to the Habour via NWK outfall
No water quality modelling is proposed for this scenario
(vii) Breakdown of disinfection facility at SCISTW
Follow the scenarios adopted in the EIA Study, “HATS EIA for the Provision of Disinfection Facilities at SCISTW – Investigation”
Notes: (1) For EIA purpose, the maximum discharge rate of 12,000m
3/hr in the historical overflow record is
adopted.

12
Table 2.6(a) – Design Capacity of Sewage Conveyance System
Stage 1 Tunnel Design Capacity
of Tunnel Section (m
3/sec)
Stage 2 Tunnel Design Capacity of
Tunnel Section (m
3/sec)
Tseung Kwan O � Kwun Tong
4.89 North Point � Wan Chai East
2.84
Chai Wan � Shau Kei Wan
1.66 Wan Chai East � Central 7.07
Shau Kei Wan � Kwun Tong
2.72 Central � Sai Ying Pun 10.27
Kwun Tong � To Kwa Wan
14.81 Ap Lei Chau � Aberdeen 1.11
To Kwa Wan � SCI MPS 21.80 Aberdeen � Wah Fu 3.12
Kwai Chung � Tsing Yi 7.36 Wah Fu � Cyberport 3.37
Tsing Yi � SCI MPS 9.45 Cyberport � Sandy Bay 3.60
Sandy Bay � Sai Ying Pun
3.86
Sai Ying Pun � SCISTW 14.13
Notes: (1) Design capacities of Stage 1 Sewage Conveyance System are extracted from the O&M Manual
of PTWs provided by DSD. (2) Design capacities of Stage 2 Sewage Conveyance System are extracted from the Preliminary
Design Report on PTW Upgrading Works under HATS Stage 2A EIA – Investigation (July 2006) and Preliminary Design Report of Sewage Conveyance System under HATS Stage 2A Sewage Conveyance System – Investigation, Design and Construction (November 2006).
Table 2.6(b) – Projected Flow for Ultimate Scenario and Estimated Overflow Rate
PTW Projected Flow for Ultimate
Scenario (m3/sec)
Estimated Overflow Rate(m
3/sec)
Stage 1 PTW
Chai Wan 2.07 0.41
Shau Kei Wan 2.71 1.65
Tseung Kwan O 5.39 0.50
Kwun Tong 10.99 3.79
To Kwa Wan 8.61 1.62
Kwai Chung 7.23 0
Tsing Yi 1.98 0
Stage 2 PTW
Sandy Bay 0.40 0.14
Cyberport 0.34 0.11
Wah Fu 0.37 0.12
Aberdeen 2.93 0.92
Ap Lei Chau 1.30 0.19
North Point 3.72 0.88
Wan Chai East 5.40 1.17
Central 4.16 0.96
Notes: (1) Overflow Flow Rate at PTW = Projected Peak Flow of PTW + Tunnel Design Capacity Upstream
of PTW – Tunnel Design Capacity Downstream of PTW

13
Table 2.7 – Projected Average Flows for Ultimate Scenario
Stage 1
Projected Flows for Ultimate
Scenario (m
3/day)
Stage 2 Projected Flows for Ultimate Scenario
(m3/day)
Chai Wan PTW 65,372 Sandy Bay PTW 11,431
Shau Kei Wan PTW 87,584 Cyberport PTW 9,816
Tseung Kwan O PTW
182,452 Wah Fu PTW 10,518
Kwun Tong PTW 390,608 Aberdeen PTW 95,059
To Kwa Wan PTW 300,849 Ap Lei Chau PTW 39,940
Kwai Chung PTW 249,612 North Point PTW 122,759
Tsing Yi PTW 62,642 Wan Chai East PTW
182,690
SCISTW (1)
2,446,906 Central PTW 138,193
1.2.5 Modelling Scenarios
1.2.5.1 Three modelling scenarios are proposed to address the worst case impacts for emergency
discharge during operational phase, namely Scenario A, B and C respectively. Scenario A assumes that sewage overflow from the NWKPS for discharge at seawall bypass at Stonecutters Island (Item (vi) of Table 2.5) would occur together with the sewage overflow at the seawall bypass of all the Stages 1 & 2 PTWs (except NWK PTW) (Item (i) of Table 2.5) for period of 8 hours to address the worst-case impact due to the capacity constraints as a result of heavy rain. The discharge quantity and quality follow those described in Table 2.6(b) and Table 3.2.
1.2.5.2 Scenario B would cover the worst-case impact due to power or equipment failure at SCISTW
as described in Items (iv) and (v) of Table 2.5. This scenario assumes that the discharge of screened sewage at the seawall bypass of all the PTWs would occur at the same time for a period of 6 hours under ultimate flow condition as shown in Table 2.7.
1.2.5.3 Scenario C is to assess the impact from seawall bypass of raw sewage at individual PTW
due to power or equipment failure assuming that 100% of the ultimate flow would be discharged at the seawall bypass for a period of 8 hours to cover the impacts described in Items (ii) and (iii) of Table 2.5. Based on the past records, power / equipment failure has not happened simultaneously at more than one PTW before. Therefore, model simulation was performed for only one PTW at a time to evaluate the extent of impact due to the sewage bypass at one individual PTW alone. The model simulation was performed for each of the Stage 2 PTW. The average flow for each PTW under ultimate condition as shown in Table 2.7 was used for model simulation.
1.2.5.4 For Scenario A, four separate model runs were conducted to simulate the impacts for four
temporary discharge periods centred at namely neap tide high water, neap tide low water, spring tide mid-flood and spring tide mid-ebb respectively for both wet and dry seasons. The model results were then analyzed to determine the sensitivity of the water quality impacts under different discharge times. Based on the sensitivity results for Scenario A, only two tide conditions are selected and modelled for dry season and wet season respectively under both Scenarios B and C.
1.2.5.5 Water quality impacts in relation to the temporary failure of disinfection facilities, refer to Item
(vi) of Table 2.5, have been fully assessed under the separate EIA for “HATS Provision of Disinfection Facilities at SCISTW (ADF)” and therefore will not be re-modelled under this Assignment. Only the key findings of the ADF study (including a summary of the water quality impact and the recommended mitigation measures) are provided in the EIA report for this Assignment.

14
2 WATER QUALITY OF EMERGENCY DISCHARGE & TEMPORARY SEWAGE BYPASS
2.1.1.1 The influent qualities of each PTW shown in Tables 3.1 and 3.2 were calculated based on the estimated sewage flow and pollution loadings of each PTW. Different development types at PTW catchments result in different pollution concentrations. The water qualities shown in Table 3.1 to Table 3.3 were used as the basis for the emergency discharge or temporary sewage bypass scenarios. The pollution loading for each discharge scenario was calculated based on the discharge flow and the water quality data.
Table 3.1 – Water Quality of Raw Sewage and Preliminary Treated Sewage at PTWs
SS BOD TKN NH3-N E. Coli. PTW (mg/L) (mg/L) (mg/L) (mg/L) (no./100mL)
HATS Stage 1
Chai Wan 225 286 41 23 1.94E+07
Shau Kei Wan 172 207 33 19 1.55E+07
Tseung Kwan O 178 213 34 20 1.64E+07
Kwun Tong 210 264 38 22 1.81E+07
To Kwa Wan 204 258 37 21 1.71E+07
NW Kowloon 167 208 31 17 1.42E+07
Kwai Chung 218 287 38 22 1.79E+07
Tsing Yi 197 227 39 23 1.90E+07
HATS Stage 2
Sandy Bay 173 209 32 18 1.52E+07
Cyberport 158 194 29 17 1.36E+07
Wah Fu 222 250 44 26 2.18E+07
Aberdeen 136 170 25 14 1.16E+07
Ap Lei Chau 145 170 28 16 1.37E+07
North Point 214 277 38 21 1.74E+07
Wan Chai E 216 301 36 19 1.50E+07
Central 230 302 40 22 1.79E+07
Notes: (1) Projected Pollutant Concentration = Projected Pollutant Loading / Ultimate ADWF (2) Ultimate ADWF of PTWs are extracted from the Technical Note – Flow and Load
Projections (Parts 1 and 2) under HATS Stage 2A EIA - Investigation (April 2007) (3) Assumed the same water qualities for raw sewage and preliminary treated sewage for
EIA purpose.

15
Table 3.2 – Water Quality of Scenario (i) and Scenario (v) Emergency Discharge for the Operation Phase
Parameters SS
(mg/L) BOD
(mg/L) TKN
(mg/L) NH3-N (mg/L)
E. Coli (no./100mL)
Rainstorm(1)
43 22 1.8 0.2 0.00E+00
HATS Stage 1(2)
Chai Wan 180 220 31 17 1.46E+07
Shau Kei Wan 140 161 25 14 1.16E+07
Tseung Kwan O 144 165 26 15 1.23E+07
Kwun Tong 168 204 29 17 1.36E+07
To Kwa Wan 164 199 28 16 1.28E+07
NW Kowloon 136 162 24 13 1.07E+07
Kwai Chung 174 221 29 17 1.34E+07
Tsing Yi 159 176 30 17 1.43E+07
HATS Stage 2(2)
Sandy Bay 141 162 24 14 1.14E+07
Cyberport 129 151 22 13 1.02E+07
Wah Fu 177 193 33 20 1.64E+07
Aberdeen 113 133 19 11 8.70E+06
Ap Lei Chau 120 133 21 12 1.03E+07
North Point 171 213 29 16 1.31E+07
Wan Chai E 173 231 27 14 1.13E+07
Central 183 232 30 17 1.34E+07
Notes: (1) Storm water quality is based on a storm water quality study conducted by EPD (CDM,
1999). (2) Overflow quality at each PTW is calculated based on the 3:1 mix following the EEFS.
Raw sewage quality of PTWs is listed in Table 3.1.
Table 3.3 – Water Quality of CEPT Effluent
SS BOD TKN NH3N E. Coli. Item (mg/L) (mg/L) (mg/L) (mg/L) (no./100mL)
CEPT Effluent without disinfection
(1)
37 45 26 20 2.0E+07
CEPT Effluent with disinfection (1)
37 45 26 20 2.0E+04
(2)
Notes: (1) The SS, BOD, TKN and NH3-N are the average values based on the operation data
from Dec 05 to Aug 06. (2) Disinfection standard (monthly geometric mean).
16
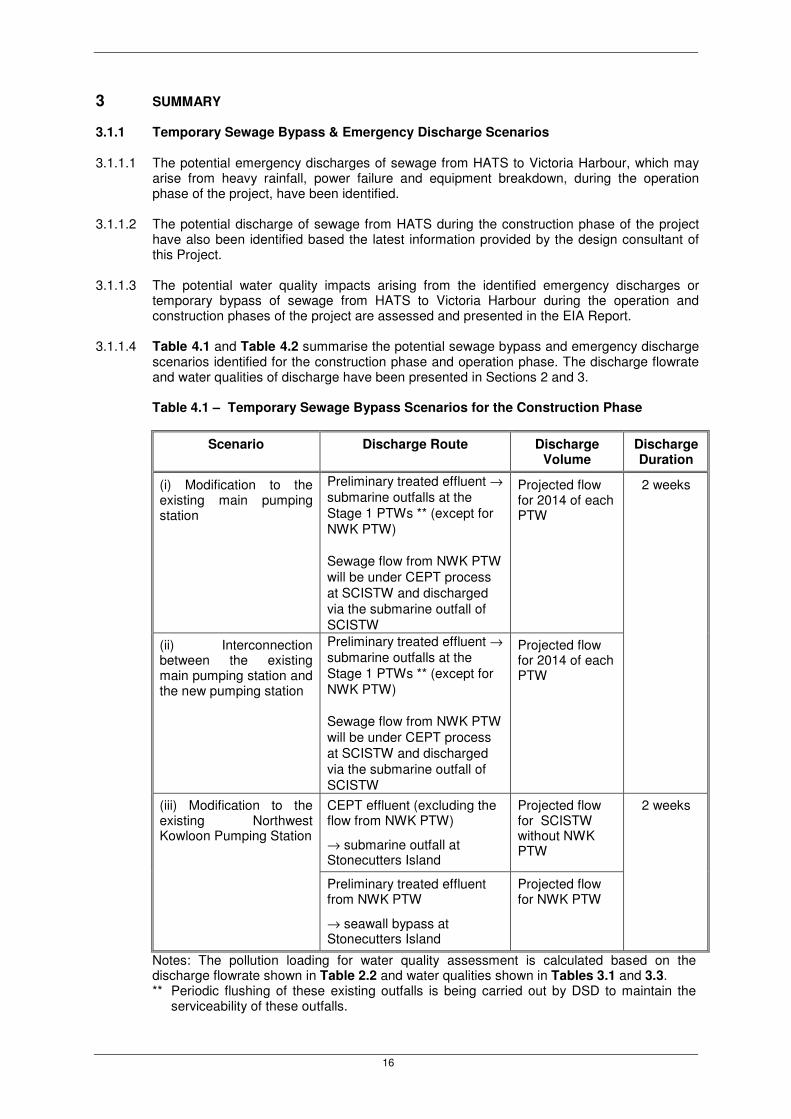
3 SUMMARY 3.1.1 Temporary Sewage Bypass & Emergency Discharge Scenarios 3.1.1.1 The potential emergency discharges of sewage from HATS to Victoria Harbour, which may
arise from heavy rainfall, power failure and equipment breakdown, during the operation phase of the project, have been identified.
3.1.1.2 The potential discharge of sewage from HATS during the construction phase of the project
have also been identified based the latest information provided by the design consultant of this Project.
3.1.1.3 The potential water quality impacts arising from the identified emergency discharges or
temporary bypass of sewage from HATS to Victoria Harbour during the operation and construction phases of the project are assessed and presented in the EIA Report.
3.1.1.4 Table 4.1 and Table 4.2 summarise the potential sewage bypass and emergency discharge
scenarios identified for the construction phase and operation phase. The discharge flowrate and water qualities of discharge have been presented in Sections 2 and 3.
Table 4.1 – Temporary Sewage Bypass Scenarios for the Construction Phase
Scenario Discharge Route Discharge Volume
Discharge Duration
(i) Modification to the existing main pumping station
Preliminary treated effluent →
submarine outfalls at the
Stage 1 PTWs ** (except for
NWK PTW)
Sewage flow from NWK PTW
will be under CEPT process
at SCISTW and discharged
via the submarine outfall of
SCISTW
Projected flow for 2014 of each PTW
(ii) Interconnection between the existing main pumping station and the new pumping station
Preliminary treated effluent →
submarine outfalls at the
Stage 1 PTWs ** (except for
NWK PTW)
Sewage flow from NWK PTW
will be under CEPT process
at SCISTW and discharged
via the submarine outfall of
SCISTW
Projected flow for 2014 of each PTW
2 weeks
CEPT effluent (excluding the flow from NWK PTW)
→ submarine outfall at Stonecutters Island
Projected flow for SCISTW without NWK PTW
(iii) Modification to the existing Northwest Kowloon Pumping Station
Preliminary treated effluent from NWK PTW
→ seawall bypass at Stonecutters Island
Projected flow for NWK PTW
2 weeks
Notes: The pollution loading for water quality assessment is calculated based on the discharge flowrate shown in Table 2.2 and water qualities shown in Tables 3.1 and 3.3. ** Periodic flushing of these existing outfalls is being carried out by DSD to maintain the
serviceability of these outfalls.

17
Table 4.2 – Emergency Discharge Scenarios for the Operation Phase
Scenario Discharge Route Discharge Volume Discharge Duration
(i) Capacity constraint of the Stages 1 and 2 tunnel systems due to heavy rainfall
Diluted preliminary treated effluent (3:1 mix following EEFS, refer to Table 3.2)
→ seawall bypass at the Stages 1 and 2 PTWs (except for NWK PTW, refer to Item v below)
See Table 2.6
8 hours
(ii) Equipment breakdown at Stage 2 PTWs
Raw sewage
→ seawall bypass at Stage 2 PTWs
50% of the projected ultimate flow of each PTW
8 hours
(iii) Power failure at Stage 2 PTWs
Raw sewage
→ seawall bypass at Stage 2 PTWs
Projected ultimate flow of each PTW
6 hours
(iv) & (v) Power or equipment failure at SCISTW
Preliminary treated effluent
→ seawall bypass at all the Stages 1 and 2 PTWs
Projected ultimate flow of each PTW
6 hours
Disinfected CEPT effluent
→ submarine outfall at Stonecutters Island
Projected ultimate flow of SCISTW
(vi) Capacity constraint of Northwest Kowloon Pumping Station
Diluted preliminary treated effluent from NWK PTW (3:1 mix following EEFS, refer to Table 3.2)
→ seawall bypass at Stonecutters Island
12,000 m3/hr
(1) of
diluted preliminary treated effluent from NWK PTW
8 hours
(vii) Extreme tide condition in combination with peak SCISTW effluent flow
Overflow of disinfected CEPT effluent to the Harbour via NWK outfall
No water quality modelling is proposed for this scenario
(viii) Breakdown of disinfection facility at SCISTW
Follow the scenarios adopted in the EIA Study, “HATS EIA for the Provision of Disinfection Facilities at SCISTW – Investigation”
Notes: (1) For EIA purpose, the maximum discharge rate of 12,000m
3/hr in the historical overflow
record is adopted. (2) The pollution loading for water quality assessment is calculated based on the discharge flowrate shown in Tables 2.6 and 2.7, and water qualities shown in Tables 3.1 to 3.3.
3.1.2 Water Quality Modelling Scenarios
Construction Phase
3.1.2.1 Two modelling scenarios are proposed for construction phase, namely Scenario D and Scenario E respectively.
3.1.2.2 Scenario D aims to assess the worst-case sewage bypass for a period of 2 weeks at the
submarine outfalls of all the Stage 1 PTWs (except for NWK PTW) in 2014 during the construction phase. Sewage flow from NWK PTW will be under CEPT process at SCISTW and discharged via the submarine outfall of SCISTW during the sewage bypass period. Scenario D would address the water quality impacts due to the modification works at the existing main pumping station and the interconnection between the existing main pumping station and the new pumping station, i.e. Items (i) and (ii) respectively in Table 4.1.
3.1.2.3 Scenario E covers the impact due to the modification work at the existing NWK PTW, i.e.
Item (iii) in Table 4.1. It is assumed that the sewage flow from the NWK PTW would be discharged to the Harbour via the seawall bypass at Stonecutters Island while the CEPT

18
effluent from SCISTW (from other Stage 1 PTWs) would be discharged via the submarine outfall of SCISTW for a period of 2 weeks. Details of the modelling scenarios for construction phase are provided in Section 2.1.2.
Operational Phase
3.1.2.4 Three modelling scenarios are proposed to address the worst case impacts for emergency discharge during operational phase, namely Scenario A, B and C respectively. Scenario A assumes that sewage overflow from the NWKPS for discharge at seawall bypass at Stonecutters Island (Item (vi) of Table 4.2) would occur together with the sewage overflow at the seawall bypass of all the Stages 1 & 2 PTWs (except NWK PTW) (Item (i) of Table 4.2) for period of 8 hours to address the worst-case impact due to the capacity constraints as a result of heavy rain.
3.1.2.5 Scenario B would cover the worst-case impact due to power or equipment failure at SCSTW as described in Items (iv) and (v) of Table 4.2. This scenario assumes that the discharge of screened sewage at the seawall bypass of all the PTWs would occur at the same time for a period of 6 hours under ultimate flow condition.
3.1.2.6 Scenario C is to assess the impact from seawall bypass of raw sewage at individual PTW
due to power or equipment failure at the PTW assuming that 100% of the ultimate flow would be discharged at the seawall bypass for a period of 8 hours to cover the impacts described in Items (ii) and (iii) of Table 4.2. Based on the past records, power / equipment failure has not happened simultaneously at more than one PTW before. Therefore, model simulation was performed for only one PTW at a time to evaluate the extent of impact due to the sewage bypass at one individual PTW alone. The model simulation was performed for each of the Stage 2 PTW. Details of the modelling scenarios for operational phase are provided in Section 2.2.5.