study on carbon sinks by classified biofloc …study on carbon sinks by classified biofloc...
TRANSCRIPT

AACL Bioflux, 2016, Volume 9, Issue 4. http://www.bioflux.com.ro/aacl
845
Study on carbon sinks by classified biofloc phytoplankton from marine shrimp pond water 1Hidayah Manan, 1Julia H. Zhong Moh, 1,2Nor A. Kasan, 3Suhaimi Suratman, 1Mhd Ikhwanuddin
1 Institute of Tropical Aquaculture, Universiti Malaysia Terengganu, Kuala Nerus, Terengganu, Malaysia; 2 School of Fisheries and Aqua-Industry, Universiti Malaysia
Terengganu, 21030 Kuala Nerus, Terengganu, Malaysia; 3 Institute of Oceanography and Environment, Universiti Malaysia Terengganu, Kuala Nerus, Terengganu, Malaysia.
Corresponding author: M. Ikhwanuddin, [email protected]
Abstract. Study on the carbon sink by biofloc phytoplankton from species Oocystis sp. (Chlorophyta) and Chroococcus sp. (Cyanophyta) was done from the study area of marine shrimp farm i- sharp Setiu, Terengganu. Three month of database for carbon sinks was collected from the selected phytoplankton in the pond. The biovolume of the phytoplankton was calculated using simple geometrical formula and carbon conversion factor to convert the biovolume of each class of phytoplankton to carbon sink amount of value. Overall, Chroococcus sp. was identified as the most abundance species found in the pond where it can sequestrate 14923.39 µ g C L-1 amount of carbon dioxide (CO2) as compared to the amount of carbon can be sequestrated by Oocystis sp. which is around 3778.20 µ g C L-1. It also can be claimed that Chroococcus sp. was more carbon dense compared to Oocystis sp. because of its bigger cell volume. It can be assumed that biofloc phytoplankton was successful in carbon sequestration and contributed as small part of carbon sinker in the world due to its ability to sequester CO2 and high abundances in number found in the pond make its more efficient in sinking carbon dioxide. Key words: carbon sink, biofloc, phytoplankton, bio volume, geometrical formula, CO2 sequestration.
Introduction. In the intensive shrimp farming, ecosystem of the shrimp pond is the basic tool in producing a healthy and highly profitable value of products. For example, overload of nutrient in the farm also will cause eutrophication in the pond and affect the ecosystem and the shrimp itself. Other important factor like the carbon budget in the pond ecosystem also must be in balance to ensure that the pond water is not too acidic to the entire living organisms in the pond (Tucker & D’Abramo 2008). In the shrimp farm that practicing the biofloc technology (BFT), the water quality of the pond can be maintained a long period of time with 0% of water exchange. Biofloc consists of high abundances of microorganisms (bacteria, phytoplankton, zooplankton protozoa and algae) that floc together and become an additional food for shrimp and some of them function as the stabilizer for the water maintenance without needed water exchange (Hargreves 2013; Avnimelech 2012). Nitrifying bacteria such as Nitrosomonas sp. and Nitrobacter sp. is one of the important decomposers bacteria that degrade the sludge, dead plankton, faeces, wastes and organic matter from the shrimps in the pond. It converts the ammonia to nitrite and nitrate and keeps the pond water in the stable condition (Perez-Rostro et al 2014). Concurrently the carbon budget in the pond also must be in the balance situation. Phytoplankton in the pond that consists of Chlorophyta (green algae), Dynophyta (dinoflagelles), Chrysophyta (golden-brown algae), Cyanophyta (cyanoobacteria) and other type of algae group operates as the carbon sink in the shrimp pond through the photosynthesis process. The phytoplanktons are capable on converting the dissolved carbon dioxide (CO2) to oxygen (O2) and energy (glucose) (Lindsey & Scott 2010). Contrary with the decomposers bacteria, they react as the carbon emitter in the pond which taking up O2 in the pond and create CO2 in the pond. The shrimp itself also contribute to the release of CO2 to the pond ecosystem and to the

AACL Bioflux, 2016, Volume 9, Issue 4. http://www.bioflux.com.ro/aacl
846
atmosphere. Tonne of shrimp produced each year also will contribute tonne of carbon footprint emission to the atmosphere. Sayre (2010) discovered that microalgae are among the most productive biological systems for generating biomass and as a natural carbon attractor. Microalgae has an ability to transport bicarbonate into cells that makes them efficient for carbon sequestration as the carbon dioxide or bicarbonate are 90% captured by microalgae in the open pond. According to Konoplya & Soares (2011) the method for calculating algal biomass may be direct such as the cell count, biovolume, and estimation of chlorophyll.
Based on these methods, this paper is focusing on the study of carbon sinking by two selected species of biofloc microorganisms which are from Cyanophyta group (Chroococcus sp.) and Chlorophyta group (Oocystis sp.) using biovolume method of calculation. These two species of phytoplankton were among the most abundance phytoplankton species which can be found in the every sampling station pond and study done on the carbon sequestration by these two species must be valuable in the future. Material and Method. Water samples consisting of biofloc microorganisms were collected from intensive shrimp farm I-sharp, Setiu, from March 2013 until August 2013. Six sampling points were reviewed, which are main inlet, 4 ponds consisting of cultured shrimp of different ages and, finally, the main outlet. The samplings were done weekly in each pond. YSI 556 multi-probe instrument was used for water parameter analysis and data for each station was taken and recorded. Three litres of water samples were filtered using 20 µm mesh size of plankton net and the filtered samples of microorganisms were preserved in 4% formalin solution. Samples were immediately transported to the laboratory for further analysis. The microalgae and phytoplankton abundance was calculated using haemocytometer and Lackey’s methods (APHA 1989). The taxa of the plankton were identified under advance microscope (Nikon 80i) and also a light microscope for direct size measuring purpose. Carbons sink for the microorganisms was calculated using carbon conversion factor for phytoplankton. Cell were counted and sized for height (µm), width (µm) and diameter (µm) at an appropriated magnification using advance microscope (Nikon Eclipse 80i) and the samples volume were calculated using simple geometric formula (Sun & Liu 2003; Vadrucci et al 2007). Volume was converted to the unit of carbon according to Strathmann (1967). Biovolume for phytoplankton was converted to carbon content using conversion factor (Lundgren 1978). Data collection and pre-processing. Carbons sinking by microorganism (Chroococcus sp. and Oocystis sp.) were calculated from the bio volume of the organisms by using carbon conversion factor. Conversion factor for phytoplankton, 16% wet weight of Chlorophytes and, 14% wet weight of Dinophytes, 22% of wet weight for Cyanophytes and 11% of wet weight for all others algae (Rocha & Duncan 1985). Results and Discussion. Through the biovolume calculation, it more focus on the calculation of phytoplankton species of biomass per se rather than estimation of phytoplankton division such as Chlorophyta, Cynophyta, Egulenophyta group through chlorophyll method calculation. From the data analysis of carbon sink by Cyanobacteria from Chroococcus sp., it was found that highest carbon sink occurred in May (week 3) which is 14923.39 µ g C L-1 (Figure 1). Abundance of Chroococcus sp. identified in the water column will help sinking highest CO2 from the photosynthesis process. This is confirmed by the study of Jansson & Northen (2010), who found out that Cyanobacteria and eukaryotic algae most effectively use bicarbonate and transport bicarbonate as a source CO2 of for photosynthesis.

AACL Bioflux, 2016, Volume 9, Issue 4. http://www.bioflux.com.ro/aacl
847
Figure 1. Carbon biomass sinking by Chroococcus sp. according to months. Sampling station was
from different shrimp pond sampled.
In April 2013, carbon sink was highest in pond 51011 around 7243,86 µ g C L-1 in week 1 and also found highest in pond 71312 around 1589.59 µ g C L-1 in week 3 (Figure 2).
Figure 2. Carbon biomass sinking by Chroococcus sp. collected for April 2013.
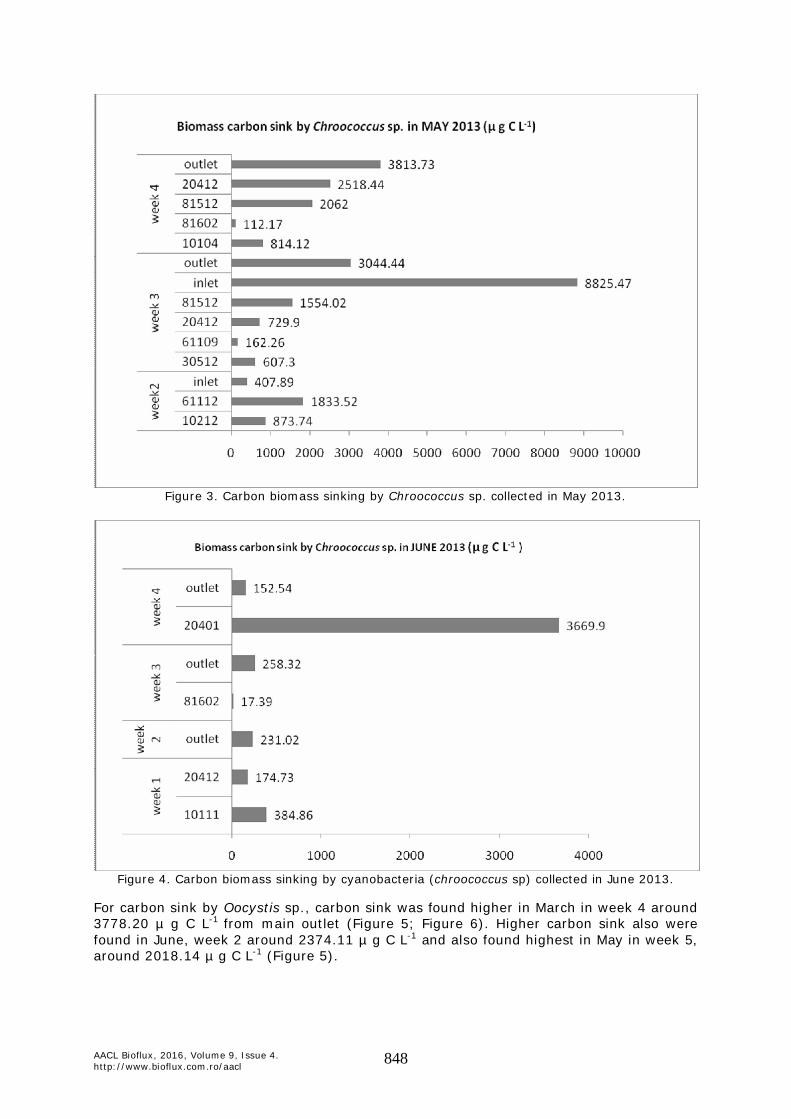
In May 2013, Chroococcus sp. was found mostly in all sampling ponds in week 2, week 3 and week 4. Carbon sink were identified highest in week 3 from main inlet station around 8825.47 µ g C L-1 also in outlet around 3044.44 µ g C L-1. In week 4, carbon sink was highest in main outlet followed by sampling pond 20412 the carbon sequestration from the Chroococcus sp. is around 2518.44 µ g C L-1 (Figure 3). In June 2013, carbon sink was higher in week 4 from pond 20401 around 3669.9 µ g C L-1 (Figure 4). This is because abundance number of Chroococcus sp. was identified in the pond same with other species of phytoplankton.
AACL Bioflux, 2016, Volume 9, Issue 4. http://www.bioflux.com.ro/aacl
848
Figure 3. Carbon biomass sinking by Chroococcus sp. collected in May 2013.
Figure 4. Carbon biomass sinking by cyanobacteria (chroococcus sp) collected in June 2013.
For carbon sink by Oocystis sp., carbon sink was found higher in March in week 4 around 3778.20 µ g C L-1 from main outlet (Figure 5; Figure 6). Higher carbon sink also were found in June, week 2 around 2374.11 µ g C L-1 and also found highest in May in week 5, around 2018.14 µ g C L-1 (Figure 5).

AACL Bioflux, 2016, Volume 9, Issue 4. http://www.bioflux.com.ro/aacl
849
Figure 5. Carbon biomass sinking by Oocystis sp. according to months. Sampling station
was from different shrimp pond sampled.
Figure 6. Carbon biomass sinking by Oocystis sp. collected in March 2013.
In April 2013, carbon sink was identified highest in pond 71312, around 869.97 µ g C L-1 in week 4 and also in week 1 from pond 51011, around 319.19 µ g C L-1 (Figure 7).
Figure 7. Carbon biomass sinking by Oocystis sp. collected in April 2013.

AACL Bioflux, 2016, Volume 9, Issue 4. http://www.bioflux.com.ro/aacl
850
In May 2013 carbon sink was only found higher in week 5 from pond 10104, around 1464.11 µ g C L-1. Carbon sink from other ponds was in small rate in week 3 and week 4 in range 0.24–12.85 µ g C L-1 from sampling pond (Figure 8).
Figure 8. Carbon biomass sinking by Oocystis sp. collected in May 2013.
In June 2013, higher carbon sink was identified in week 2 from pond 20412, around 2356.14 µ g C L-1. It is because of higher density of Oocystis sp. was available in the pond 020412. In week 1 the carbon sink from 20412 pond was the highest amount compared to other ponds. In week 3, all ponds showed small amount of carbon sink around 0.6-12.72 µ g C L-1 for pond 81602, pond 20412 and outlet (Figure 9).
Figure 9. Carbon biomass sinking by Oocystis sp. collected in June 2013.
Overall from the data, Chroococcus sp. was identified as the most abundant species found in the shrimp farm as it can sequestrate 14923.39 µ g C L-1 of carbon dioxide compared to Oocystis sp., the green algae group. Oocystis sp. highest carbon sink was

AACL Bioflux, 2016, Volume 9, Issue 4. http://www.bioflux.com.ro/aacl
851
only 3778.20 µ g C L-1 in March (week 4) compared to carbon sink by Chroococcus sp. from cyanobacteria group. It also can be claimed that Chroococcus sp. (Figure 10) was more carbon dense than Oocystis sp. (Figure 11) because of its bigger cell volume. It confirms the literature from the review that the positive biovolume influences the carbon biomass in phytoplankton (Gotsis-Skretas & Ignatiades 2010).
Figure 10. Chroococcus sp. bio volume estimation using sphere geometrical shape.
Picture was taken and sized using Advance microscope Nikon 80i.
Figure 11. Oocystis sp. biovolume estimation using prolate spheroid geometrical shape.
Picture was taken and sized using Advance microscope Nikon 80i. The highest concentration of biomass in phytoplankton from the biovolume estimation confirmed that the biofloc also contributed as the carbon sequestration. Biofloc phytoplankton was also capable to absorb and sequestrate the CO2 produced from the biological processes and activities done by microbials in biofloc. This is in agreement with

AACL Bioflux, 2016, Volume 9, Issue 4. http://www.bioflux.com.ro/aacl
852
Levinton (2001) and Raven et al (2001) that planktonic algae is an important primary producer and can fix carbon in their biomass by the photosynthetic processes.
Conclusions. It was identified that the phytoplankton aggregates in the biofloc was also helpful in sink carbon and store it in the biomass form. Phytoplankton in biofloc was successful in sequestrated carbon dioxide from the atmosphere as according to the higher biomass identified from the two species of Oocystis sp. around 3778.20 µ g C L-1 and Chroococcus sp. around 14923.39 µ g C L-1 measured. Acknowledgements. Author would like to thanks Sciences officer, Mr Ihwan Zakariah for all the assistance during used Advance microscope and Mr Nordin, the assistant fisheries officer from FRI Tanjung Demong, Besut, Malaysia for the assistant during sampling in the shrimp farm. Author also want to thank Fisheries Research Institute Pulau Sayak, Kedah, Malaysia for the financial support under grant “Climate Change and mitigation” during the project. References American Public Health Association (APHA), 1989 Standard methods for the examination
of water and wastewater. 17th edition, Washington DC, pp. 10-23. Avnimelech Y., 2012 Biofloc technology - a practical guidebook. 2nd edition, The World
Aquaculture Society, Baton Rouge, Louisiana, USA, pp. 48, 189. Gotsis-Skretas O., Ignatiades L., 2010 Phytoplankton carbon biomass in Mediterranean
Sea. Hellenic Center for Marine Research, Rapp Comm int Mer Médit, No. 39, 369 pp.
Hargreaves J. A., 2013 Biofloc production systems for aquaculture. Southern Regional Aquaculture Center, SRAC Publication, No. 4503, pp. 1-12.
Jansson C., Northen T., 2010 Calcifying cyanobacteria - the potential of biomineralization for carbon capture and storage. Current Opinion in Biotechnology 21:365-371.
Konoplya B. I., Soares F. S., 2011 New geometric models for calculation of microalgal biovolume. Brazilian Archives in Biology and Technology 54(3):527-534.
Levinton J. S., 2001 Marine biology: function, biodiversity, ecology. Oxford University Press, Oxford, 515 pp.
Lindsey R., Scott M., 2010 What are phytoplankton? Available at: NASA Earth Observatory, http://earthobservatory.nase.gov/Features/Phytoplankton/. Accessed: September, 2010.
Lundgren A., 1978 Experimental lake fertilization in the Kuokkel area, northern Sweden: changes in sestonic carbon and the role of phytoplankton. Verh Int Verein Limnol 20:863-868.
Perez-Rostro C. I., Perez-Fuentes J. A., Hernandez-Vergara M. P., 2014 Biofloc, a technical alternative for culturing Malaysian prawn Macrobrachium rosenbergii. In: Sustainable aquaculture techniques, INTECH, pp. 87-104.
Raven P. H., Evert R. F., Eichhorn S. E., 2001 Vegetal Biology. 6a ed. Editora Guanabara Koogan, Rio de Janeiro, 906 pp. [in Portuguese]
Rocha O., Duncan A., 1985 The relationship between cell carbon and cell volume in freshwater algal species used in zooplanktonic studies. Journal of Plankton Research 7:279-294.
Sayre R., 2010 Microalgae: the potential for carbon capture. Bioscience 60(9):722-727. Strathmann R. R., 1967 Estimating the organic carbon content of phytoplankton from cell
volume or plasma volume. Limnology and Oceanography 12(3):411-418. Sun S., Liu D., 2003 Geometric models for calculating cell biovolume and surface area for
phytoplankton. Journal of Plankton Research 25(11):1331-1346. Tucker C. S., D’Abramo L. R., 2008 Managing high pH in freshwater ponds. Southern
Regional Aquaculture Center, SRAC Publication, No. 4604, 1-5 pp. Vadrucci M. R., Cabrini M., Basset A., 2007 Biovolume determination of phytoplankton
guilds in transitional water ecosystems of Mediterranean ecoregion. Transitional Water Bulletin 2:83-102.
AACL Bioflux, 2016, Volume 9, Issue 4. http://www.bioflux.com.ro/aacl
853
Received: 21 May 2016. Accepted: 18 July 2016. Published online: 05 August 2016. Authors: Hidayah Manan, Institute of Tropical Aquaculture, Universiti Malaysia Terengganu, Kuala Terengganu, Mengabang Telipot Kuala Nerus, 21030, Malaysia, e-mail: [email protected] Julia Hwei Zhong Moh, Institute of Tropical Aquaculture, Universiti Malaysia Terengganu, Kuala Terengganu, Mengabang Telipot Kuala Nerus, 21030, Malaysia, e-mail: [email protected] Nor Azman Kasan, Institute of Tropical Aquaculture, Universiti Malaysia Terengganu, Kuala Terengganu, Mengabang Telipot Kuala Nerus, 21030, Malaysia, e-mail: [email protected] Suhaimi Suratman, Institute of Oceanography and Enviroment, Universiti Malaysia Terengganu, Kuala Terengganu, Mengabang Telipot Kuala Nerus, 21030, Malaysia, e-mail: [email protected] Mhd. Ikhwanuddin, Institute of Tropical Aquaculture, Universiti Malaysia Terengganu, Kuala Terengganu, Mengabang Telipot Kuala Nerus, 21030, Malaysia, e-mail: [email protected] This is an open-access article distributed under the terms of the Creative Commons Attribution License, which permits unrestricted use, distribution and reproduction in any medium, provided the original author and source are credited. How to cite this article: Manan H., Moh J. H. Z., Kasan N. A., Suratman S., Ikhwanuddin M., 2016 Study on carbon sinks by classified biofloc phytoplankton from marine shrimp pond water. AACL Bioflux 9(4):845-853.