sts simulations: layout, digitizers, performance
DESCRIPTION
STS simulations: Layout, digitizers, performance. Radoslaw Karabowicz GSI. STS detector. Tracking detector: - low-mass detector - full azimuthal angle coverage - polar angle coverage: from 2.5° to 25 ° high track density in the inner-most region high collision rate - PowerPoint PPT PresentationTRANSCRIPT

STS simulations:Layout, digitizers, performance
Radoslaw Karabowicz
GSI

2
STS detector
Tracking detector:- low-mass detector- full azimuthal angle coverage- polar angle coverage: from 2.5° to 25°- high track density in the inner-most region- high collision rate- vertical magnetic field

3
STS designSilicon Tracking System:8 stations (at 30, 35, 40, 50, 60, 75, 90 and 100cm away from the target)build from micro-strip double-sided silicon sensors (~300m thick, 6cm wide, 2÷6 cm high)with narrow strips (60m): vertically oriented on the front side and slightly rotated on the back side (by 15°)readout electronics located in the bottom and top parts outside of defined acceptancesensor readout ensured by low-mass microcablessmall sensors in the inner region to reduce the occupancy, outer regions covered by larger sensors, or even chained sensors, to minimize number of channels

4
n-XYTER
FEB with8 s
Module
Siliconsensor
Cable
n-XYTER
FEB with8 s
Cable
~6cm
2-6c
m

5
Overlaps vs gaps
39.65 40 40.35
Example realizations of the station #3 at z=40cm
gaps
overlapsintermediate

6
Overlaps vs gaps – tracking efficiency
Overlap geometry Gap geometry
overall efficiency1 gap, 2 gaps1 overlap, 2 overlaps
Traversing overlaps does notchange tracking efficiency
Traversing gaps doeschange tracking efficiency
Work done by the GSISummer StudentMaksym Zyzak fromNational University, Kyiv

7
Overlaps vs gaps – momentum resolution
Overlap geometry Gap geometry
overall resolution1 gap, 2 gaps1 overlap, 2 overlaps
Traversing overlaps does notchange momentum resolution
Traversing gaps doeschange momentum resolution
Work done by the GSISummer StudentMaksym Zyzak fromNational University, Kyiv

8
Realistic detector response
The hit is determined by the track position in the center of the silicon detector
Ideal response:
Physical processes:-charge smearing-collection efficiency-Lorentz angle due to magnetic field
Realistic response:

9
Realistic response - models
w/2 p/2 transverse tracksCMS @ LHC
CBM: |B| = 1THoles: = 1.5°, x = 8mElectrons: = 7.5°, x = 40m

10
Hit density
0-35 hits/cm2 0-31 hits/cm2
0-5.8% 0-11%
Strip occupancy
Ideal Realistic

11
<eff> = 98.6%94-100%
<eff> = 91.9%54-99%
1.4-2.3 strips
Cluster length
Hit finding efficiency
Ideal Realistic
1 strip from definition of ideal response

12
Realistic response - results
Ideal response: Realistic response:

13
Idea
l

14
Rea
listic

15
Detector X-ray
x[cm]
y[c
m]
- silicon detector thickness:
currently 0.3% x0 (300m)
- station with cables and support
structure: up to 1% x0
-total vertex/tracking system: < 15% x0
x/x0
x/x0
Radiation length thicknessstation 5 (z = 60cm)
STS detector
6 million 10 GeV/c pions in Geant

16
Summary
(more)Realistic geometry that matches recent discussions on construction possibilities available (thanks to Sergey Belogurov)The geometry has been tested by Irina Rostovtseva, Maksym Zyzak and meMore discussion with engineers needed
The realistic digitizer and cluster finder readyDetector response study essential

17
Deltas – expected behavior
Station 10.3 e- / beam particle
Station 40.12 e- / beam particle
Station 50.08 e- / beam particle
18
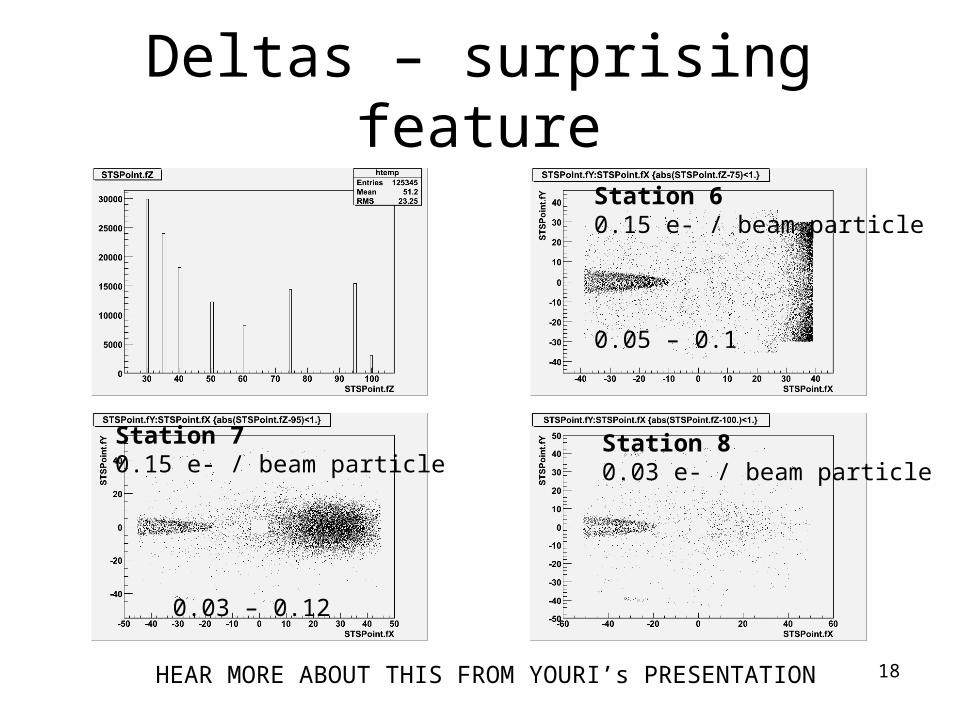
Deltas – surprising feature
HEAR MORE ABOUT THIS FROM YOURI’s PRESENTATION
Station 80.03 e- / beam particle
Station 60.15 e- / beam particle
0.05 – 0.1
Station 70.15 e- / beam particle
0.03 – 0.12

19
Delta electrons study by Iouri Vassiliev

20
Left-right asymmetry

21
Hit density
0-35 hits/cm2 0-31 hits/cm2
0-5.8% 0-11%
Strip occupancy
Ideal Realistic

22
<eff> = 98.6%94-100%
<eff> = 91.9%54-99%
1.4-2.3 strips
Cluster length
Hit finding efficiency
Ideal Realistic
1 strip from definition of ideal response

STS test beam early results
Radoslaw Karabowicz
GSI

24
Sil
ico
nse
nso
r
Test beam setup
Siliconsensor
n-XY
TERFEB w
ith
n-XY
TERFEB with

25
First signals from beta source 90Sr
Time in epochs
yiel
d
source source

26
First signals from beta source 90Sr
ADC channels
yiel
d
Noise Beta source

27
Beam in Cave C!!!
Time in epochs
yiel
d
Playing with threshold
Screams: Do we have beam??

28
Beam bunches
time [a.u.] .
HitsBeam counter
Yield

29
Channel number correlations
Horizontal strips Vertical strips channel numberon detector 1 on detector 2
ch
anne
l num
ber
Ver
tical
str
ips
Hor
izon
tal s
trip
s
on d
etec
tor
1
on d
etec
tor
2

30
Time correlationsbe
am d
etec
tor
time
– hi
t tim
e [a
.u.]
channel number on roc1 (n side)

31
Time correlations
Run020
Run015

32
Summary
LOTS TO DO!!!to analyze and understand the data
to prepare for next beam time
Conclusions