structure of the presentation: gudrun (winter storm 2005) meteorology gudrun sea level
DESCRIPTION
- PowerPoint PPT PresentationTRANSCRIPT
1
1st INTERNATIONAL ASTRA CONFERENCE“ARE WE PREPARED TO COPE WITH CLIMATIC CHANGE?CONSEQUENCES OF THE WINTER STORM 2005”MAY 18-20, 2006Klaipeda (Lithuania)
Consequences of the winter storm 2005 in Estonia; possible changes in mean and extreme sea levels due to climate change
Ülo Suursaar, Estonian Marine Institute, Univ. of Tartu(ASTRA - Are Kont group)
2
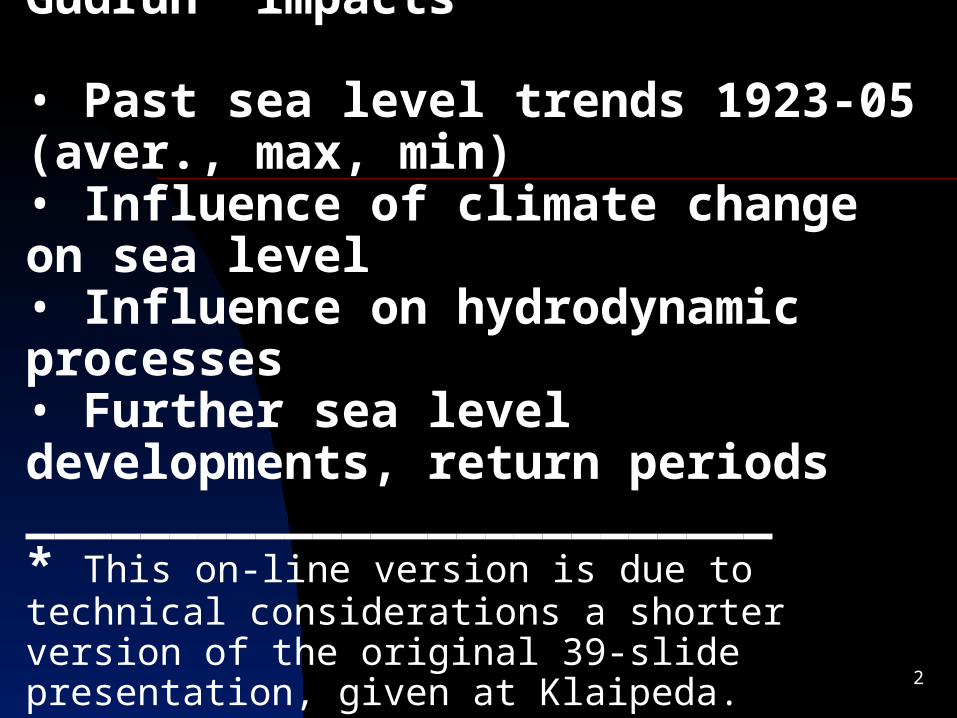
Structure of the presentation:
• Gudrun (winter storm 2005) meteorology• Gudrun sea level• Hydrodynamic modelling of Gudrun impacts
• Past sea level trends 1923-05 (aver., max, min) • Influence of climate change on sea level• Influence on hydrodynamic processes• Further sea level developments, return periods__________________________* This on-line version is due to technical considerations a shorter version of the original 39-slide presentation, given at Klaipeda.
3
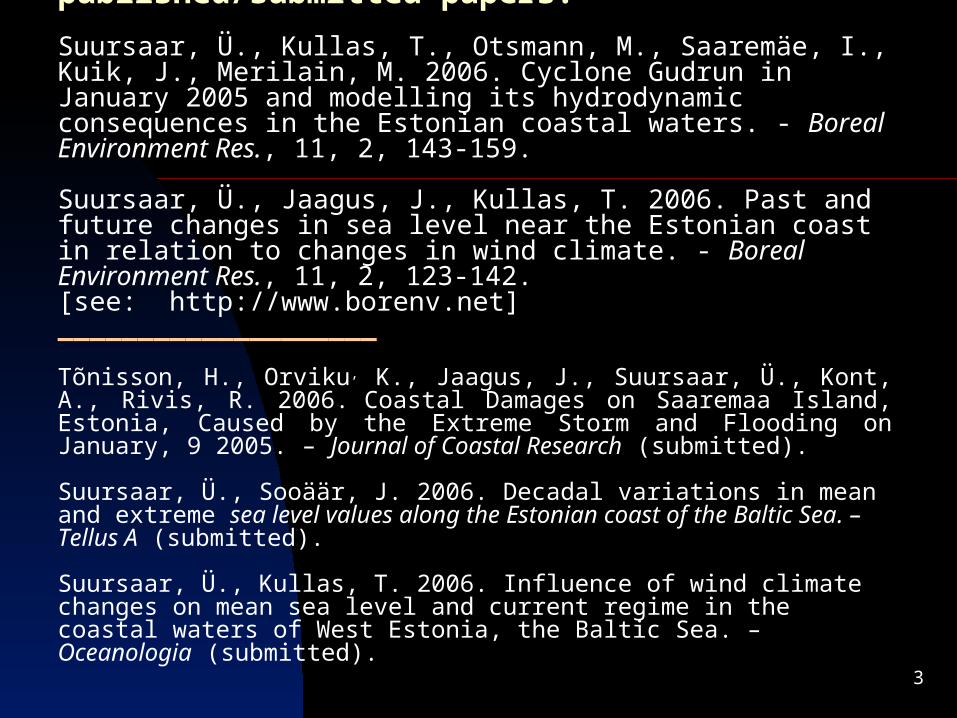
The presentation is based on published/submitted papers:
Suursaar, Ü., Kullas, T., Otsmann, M., Saaremäe, I., Kuik, J., Merilain, M. 2006. Cyclone Gudrun in January 2005 and modelling its hydrodynamic consequences in the Estonian coastal waters. - Boreal Environment Res., 11, 2, 143-159.
Suursaar, Ü., Jaagus, J., Kullas, T. 2006. Past and future changes in sea level near the Estonian coast in relation to changes in wind climate. - Boreal Environment Res., 11, 2, 123-142. [see: http://www.borenv.net]____________________
Tõnisson, H., Orviku, K., Jaagus, J., Suursaar, Ü., Kont, A., Rivis, R. 2006.
Coastal Damages on Saaremaa Island, Estonia, Caused by the Extreme Storm and Flooding on January, 9 2005. – Journal of Coastal Research (submitted).
Suursaar, Ü., Sooäär, J. 2006. Decadal variations in mean and extreme sea level values along the Estonian coast of the Baltic Sea. – Tellus A (submitted).
Suursaar, Ü., Kullas, T. 2006. Influence of wind climate changes on mean sea level and current regime in the coastal waters of West Estonia, the Baltic Sea. – Oceanologia (submitted).

4
Cyclone “Gudrun/ Erwin” 09.01.2005, 06.00 UTC
5
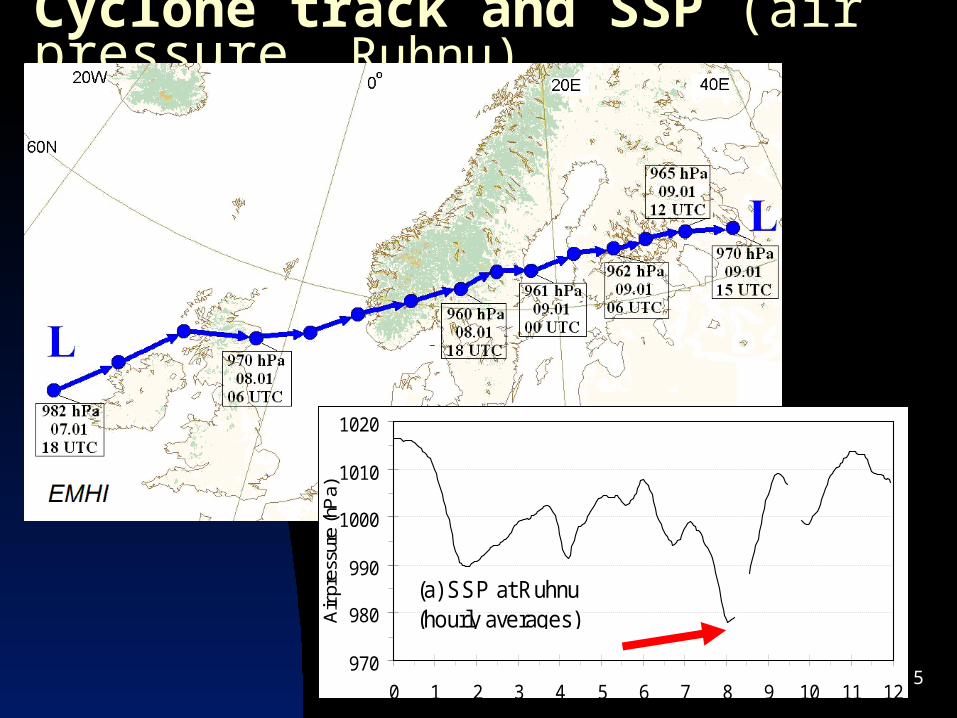
Cyclone track and SSP (air pressure, Ruhnu)
970
980
990
1000
1010
1020
0 1 2 3 4 5 6 7 8 9 10 11 12
Air
pres
sure
(hP
a)
(a) SSP at Ruhnu (hourly averages)
6
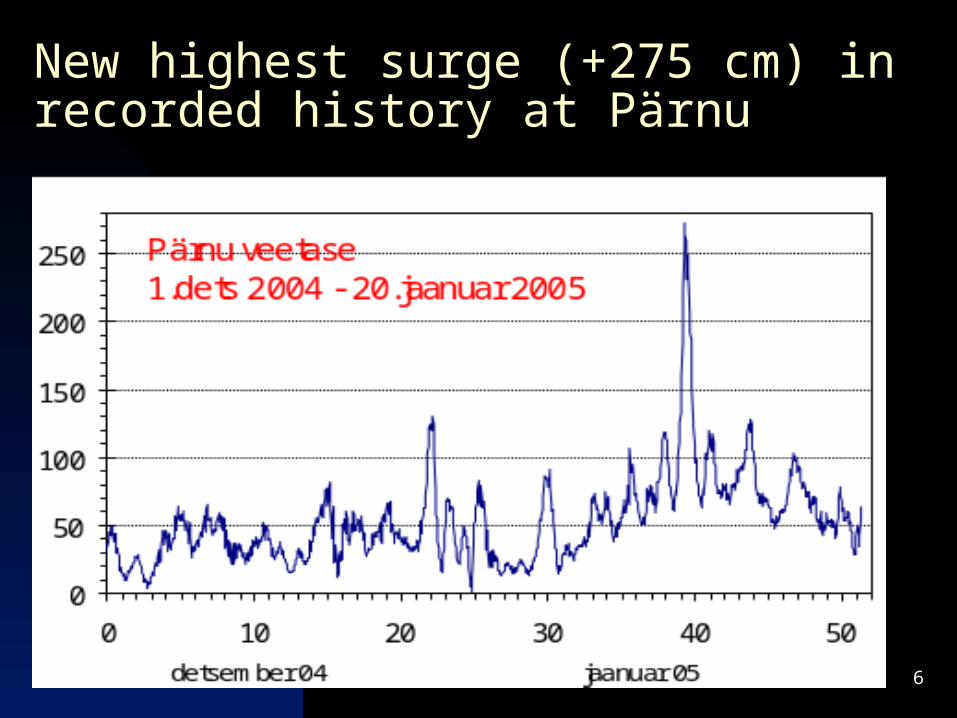
New highest surge (+275 cm) in recorded history at Pärnu
7
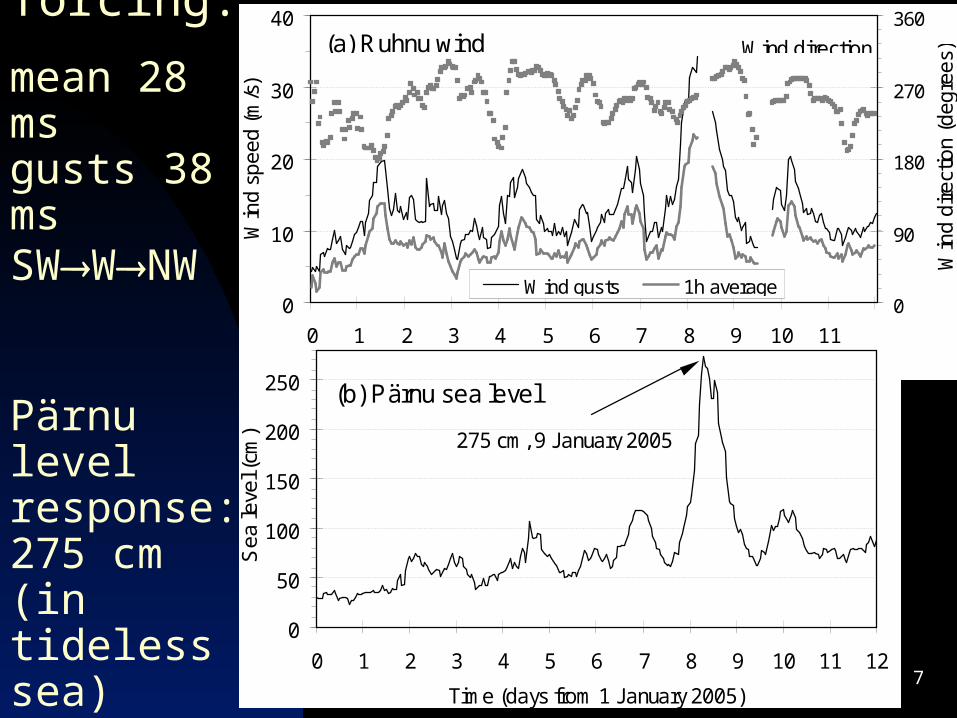
Windforcing:
mean 28 msgusts 38 msSWWNW
Pärnu level response:275 cm(in tideless sea)
0
10
20
30
40
0 1 2 3 4 5 6 7 8 9 10 11Time (days from 1 January 2005)
Win
d s
pe
ed
(m
/s)
0
90
180
270
360
Win
d d
ire
ctio
n (
de
gre
es)
Wind gusts 1h average
(a) Ruhnu wind Wind direction
0
50
100
150
200
250
0 1 2 3 4 5 6 7 8 9 10 11 12
Time (days from 1 January 2005)
Sea
leve
l (cm
)
(b) Pärnu sea level
275 cm, 9 January 2005
8
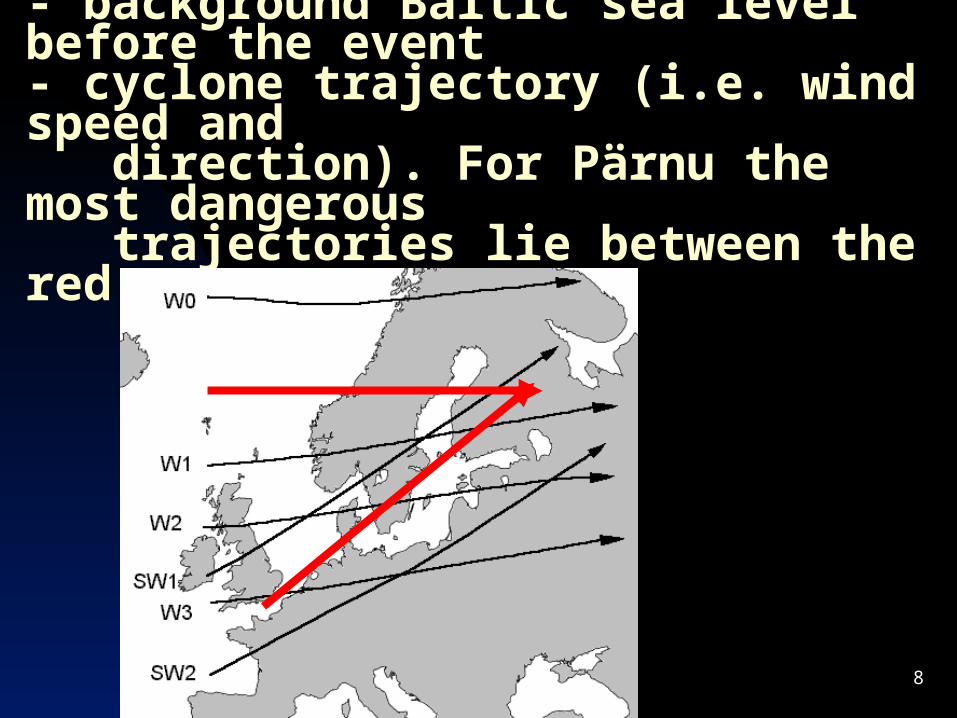
Surge height depends on - background Baltic sea level before the event- cyclone trajectory (i.e. wind speed and direction). For Pärnu the most dangerous trajectories lie between the red arrows.
9
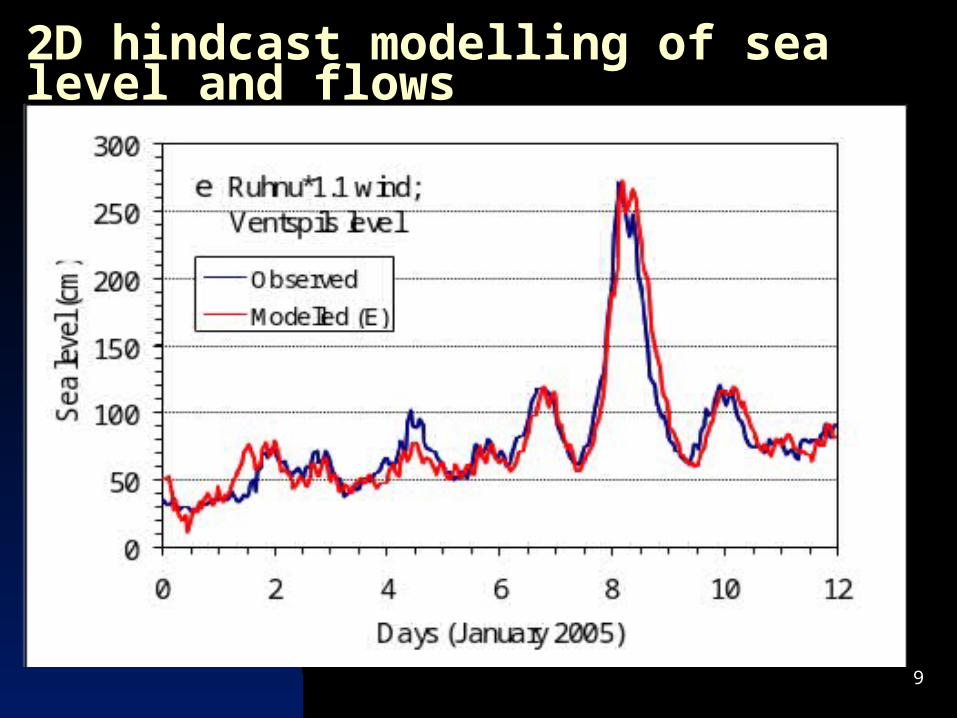
2D hindcast modelling of sea level and flows
10
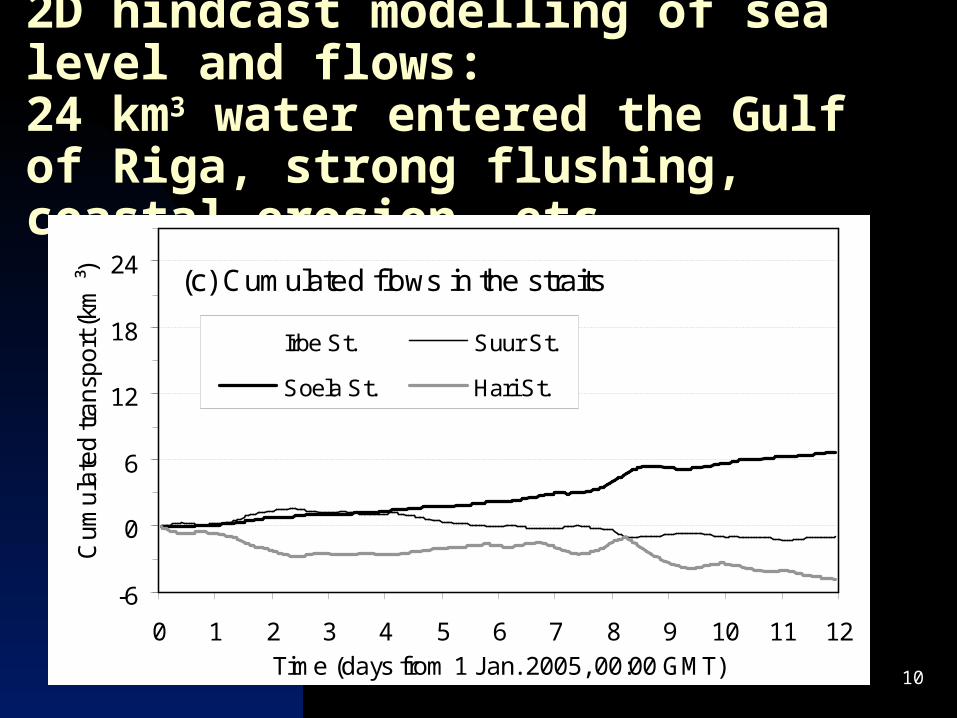
2D hindcast modelling of sea level and flows:24 km3 water entered the Gulf of Riga, strong flushing, coastal erosion, etc.
-6
0
6
12
18
24
0 1 2 3 4 5 6 7 8 9 10 11 12Time (days from 1 Jan. 2005, 00:00 GMT)
Cu
mu
late
d tr
an
spo
rt (
km ³
) .
Irbe St. Suur St.
Soela St. Hari St.
(c) Cumulated flows in the straits
11
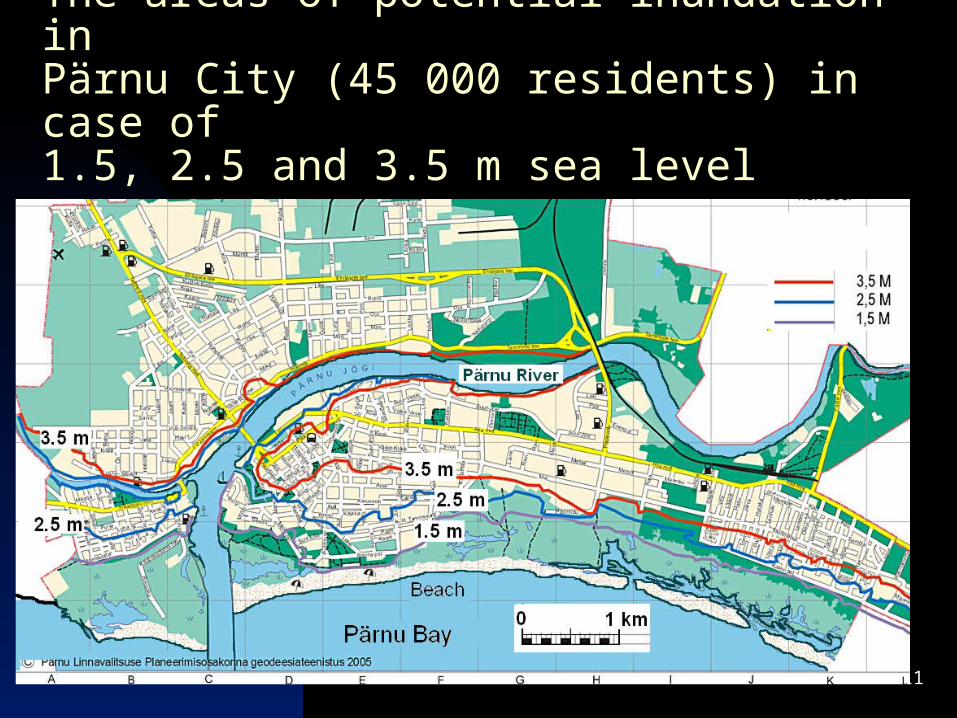
The areas of potential inundation in Pärnu City (45 000 residents) in case of 1.5, 2.5 and 3.5 m sea level rise.
12
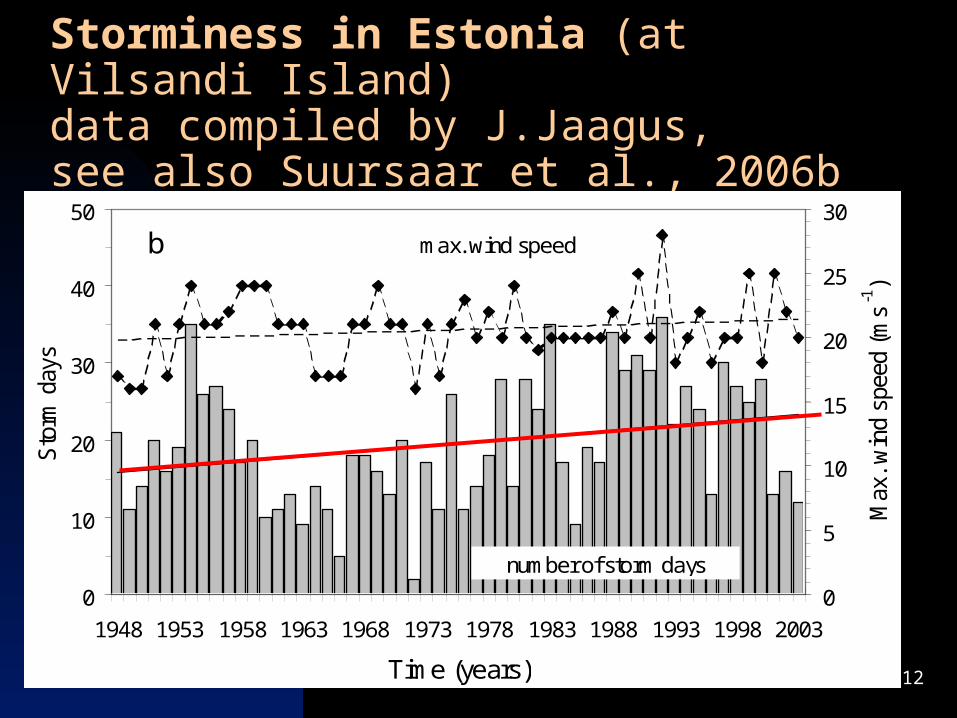
Storminess in Estonia (at Vilsandi Island) data compiled by J.Jaagus, see also Suursaar et al., 2006b
0
10
20
30
40
50
1948 1953 1958 1963 1968 1973 1978 1983 1988 1993 1998 2003
Time (years)
Sto
rm d
ays
.
0
5
10
15
20
25
30
Max
. w
ind
spee
d (m
s -1)
b
number of storm days
max. wind speed
13
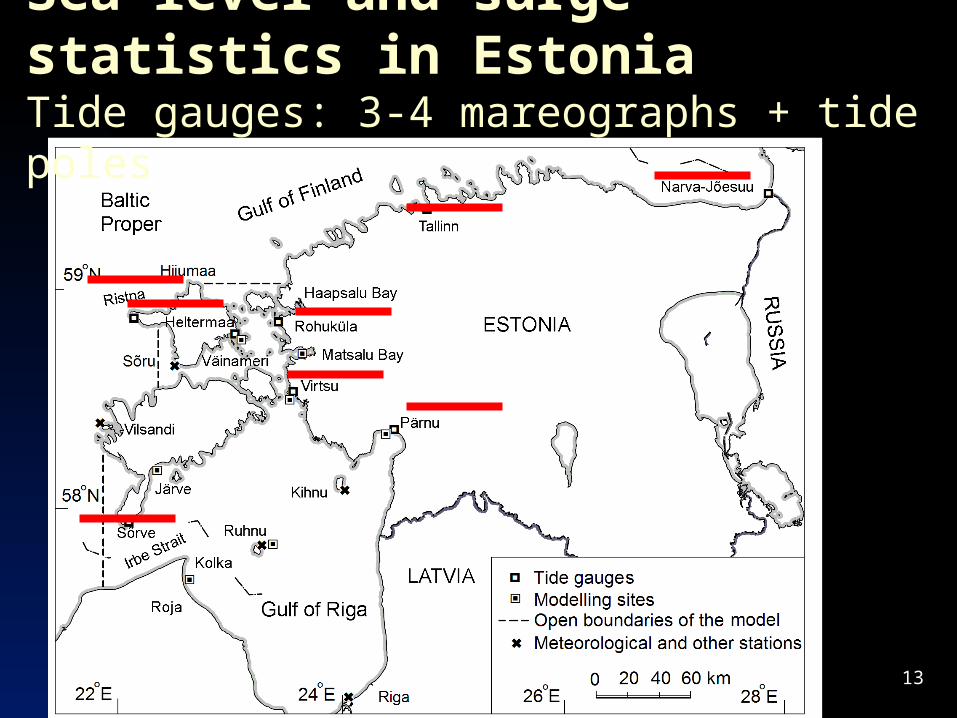
Sea level and surge statistics in EstoniaTide gauges: 3-4 mareographs + tide poles
14
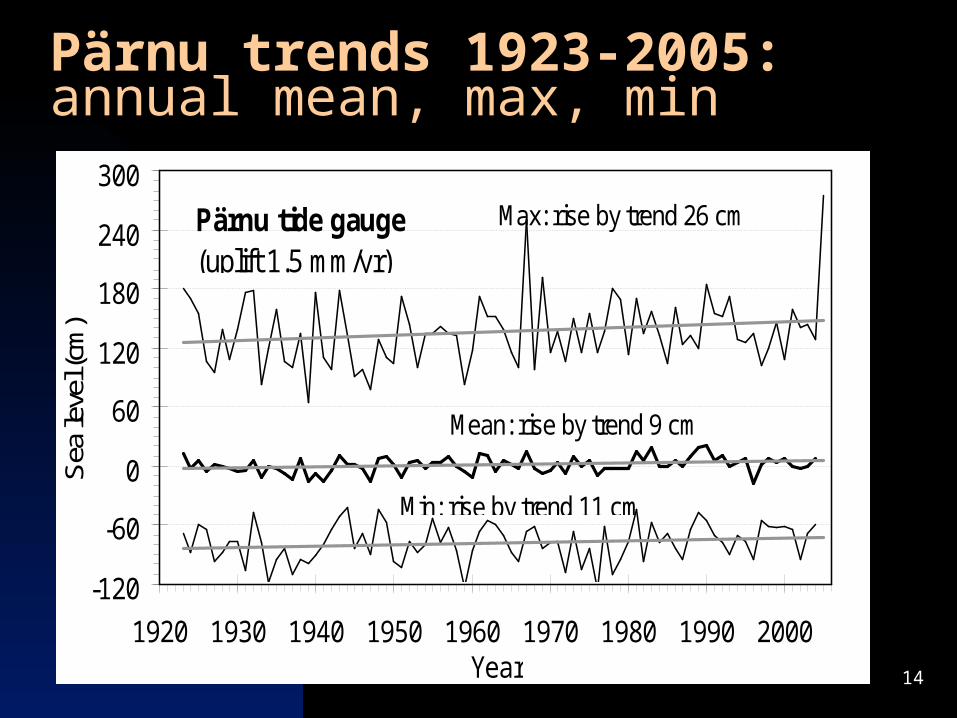
Pärnu trends 1923-2005:annual mean, max, min
-120
-60
0
60
120
180
240
300
1920 1930 1940 1950 1960 1970 1980 1990 2000Year
Sea
leve
l (cm
)
Pärnu tide gauge(uplift 1.5 mm/yr)
Mean: rise by trend 9 cm
Max: rise by trend 26 cm
Min: rise by trend 11 cm
15
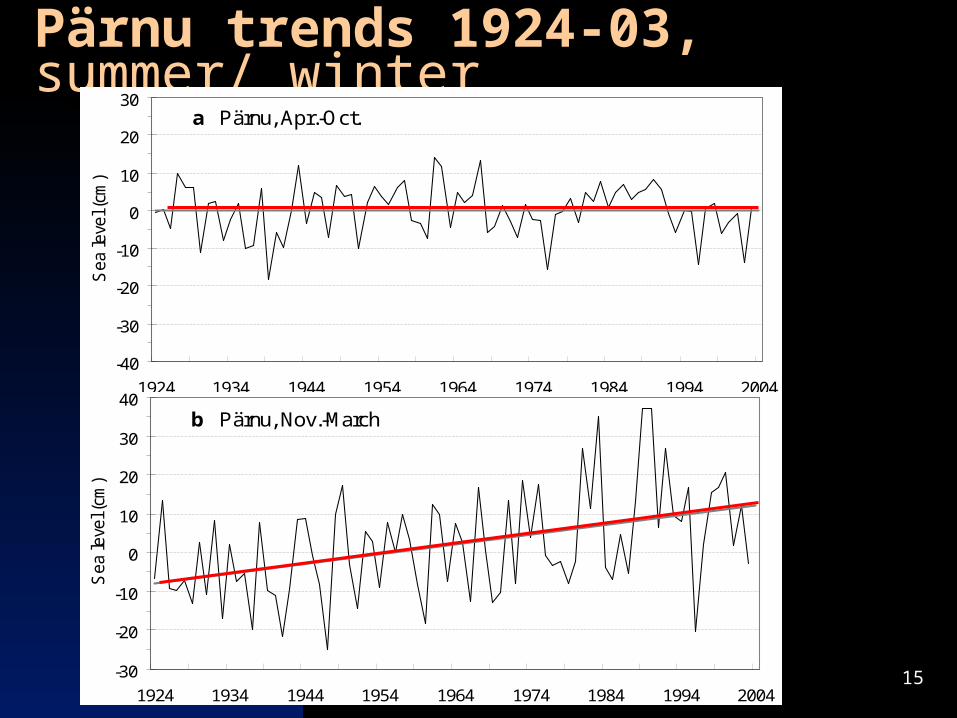
Pärnu trends 1924-03, summer/ wintera Pärnu, Apr.-Oct.
-40
-30
-20
-10
0
10
20
30
1924 1934 1944 1954 1964 1974 1984 1994 2004
Sea le
vel (
cm) .
b Pärnu, Nov.-March
-30
-20
-10
0
10
20
30
40
1924 1934 1944 1954 1964 1974 1984 1994 2004
Sea le
vel (
cm) .
16
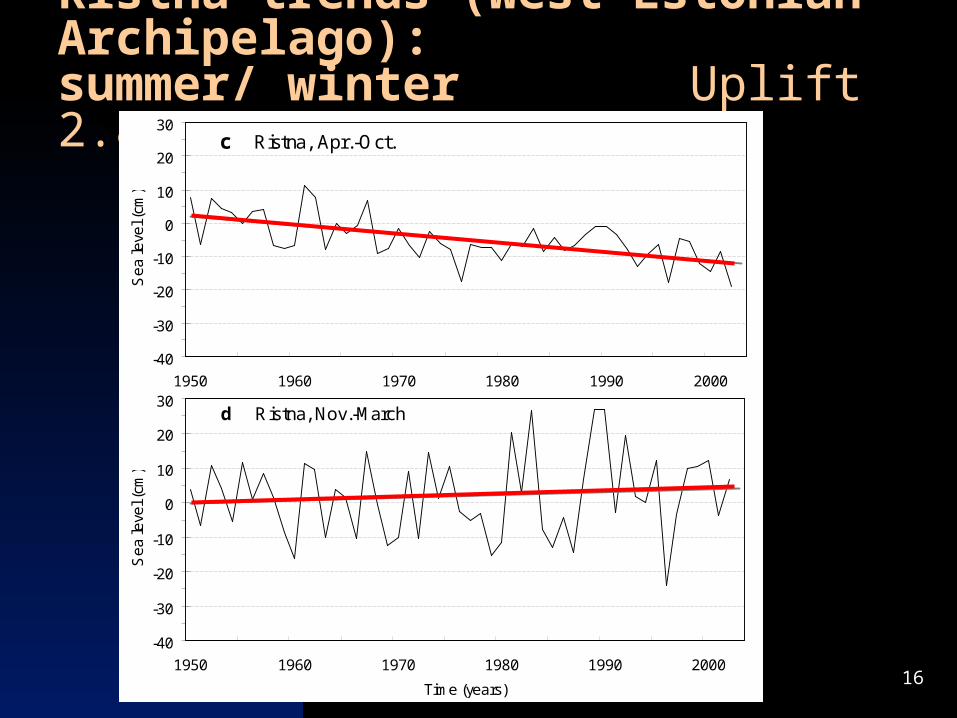
Ristna trends (West-Estonian Archipelago): summer/ winter Uplift 2.8 mm/yr
c Ristna, Apr.-Oct.
-40
-30
-20
-10
0
10
20
30
1950 1960 1970 1980 1990 2000
Time (years)
Se
a le
vel (
cm)
d Ristna, Nov.-March
-40
-30
-20
-10
0
10
20
30
1950 1960 1970 1980 1990 2000
Time (years)
Se
a le
vel (
cm)

17
List of further figures:
•Seasonality in sea level (and NAO) trends•Seasonal structure of correlations: NAO/ Sea level/ Storminess•Seasonal structure of Pärnu max, mean and min sea levels•11 year running averages and corrected linear trendlines•Results of 2D modelled sea levels, Gulf of Riga•Modelled influence of changes in westerlies•Change in flow regime (cumulated fluxes) due to enhanced •S, SW, E winds at Järve (Saaremaa Island): •annual bottom stress could increase 2-3 fold•Return periods based on Pärnu max sea level data 1923-2005

18
Pärnu hourly data histogram,
n=369 071, ca 15%=50 000, nout =ca 19h
0.0001
0.001
0.01
0.1
1
10
100
-150 -100 -50 0 50 100 150 200 250Sea level classes (cm)
Pro
babi
lity
(%)
1961-January 2005n=369 071
1961-January 20052 storms (19h) excl.n=369 052
c)

19
Thank you