structural performance of nail-laminated timber-concrete
TRANSCRIPT

Structural Performance of Nail-Laminated Timber-Concrete Composite Floors
by
Kwan Eui Marcel Hong
B.ASc., University of Waterloo, 2014
A THESIS SUBMITTED IN PARTIAL FULFILLMENT OF
THE REQUIREMENTS FOR THE DEGREE OF
MASTER OF APPLIED SCIENCE
in
THE FACULTY OF GRADUATE AND POSTDOCTORAL STUDIES
(Civil Engineering)
THE UNIVERSITY OF BRITISH COLUMBIA
(Vancouver)
August 2017
© Kwan Eui Marcel Hong, 2017

ii
Abstract
Nail-laminated timber-concrete composite (TCC) is a system composed of a nail-laminated
timber (NLT) panel connected to a concrete slab through shear connections. When used as
flexural elements such as floors, the concrete and NLT are located in the compression and
tension zones, respectively. NLT panels, being constructed out of inexpensive lumber planks
nailed on their sides, offer an economical advantage in mass-timber constructions that
complement the structural and building physics advantages of TCC. However, the performance
of nail-laminated TCC as well as efficient shear connectors for this system have not been
investigated.
This thesis presents the experimental study conducted on the performance of TCC panels
constructed out of NLT, mechanical fasteners, and cast-in-place concrete. First, nine different
sizes of truss-plates and two configurations of self-tapping screws installed in small-scale TCC
specimens were tested under shear load. The connections’ strength and stiffness were determined
to evaluate its performance as TCC shear connectors. Second, four truss-plate configurations
were selected for implementation in full-scale TCC panels. Two panels for each shear connection
systems were tested under impact loading and a quasi-static monotonic loading to determine the
vibration bending properties, respectively. Panel specifications and layouts of the connectors
were designed based on the established �-method. The test results show that nail-laminated TCC
panels reached slightly higher fundamental natural frequency and elastic bending stiffness than
predicted. Furthermore, failure did not occur until loading reached 5 to 7 times the serviceability
requirements. The selected truss-plates shear connection demonstrated to be an efficient solution
for nail-laminated TCC panels.

iii
Lay Summary
Floor structures constructed out of timber and concrete are advantageous compared to timber-
only floors or concrete slabs. An economic type of timber-concrete composite floor is
constructed by first assembling lumber planks on their sides, then installing mechanical
connectors, and finally pouring concrete on top of it.
The goal of the research presented in this thesis was to experimentally evaluate the performance
of the aforementioned timber-concrete composite system with different connections. The
connection systems investigated are different sizes of punctured metal plates known as truss
plates and structural screws known as self-tapping screws. The selected truss-plates shear
connection demonstrated to be an efficient solution for nail-laminated TCC panels.

iv
Preface
This thesis is the original work of the author, Kwan Eui Marcel Hong, executed under the
supervision of Dr. Thomas Tannert.
The identification and design of the research program was performed largely independently;
however, some suggestions were incorporated from industry professionals and suppliers
regarding specific connections to be tested.
All parts of the research reported herein were performed primarily by myself, with occasional
assistance as needed from friends, colleagues, and technicians from the faculties of Civil
Engineering and Wood Science.
The analysis of all data generated over the course of the research program was performed by
myself, in consultation with my supervisor, Dr. Thomas Tannert.

v
Table of Contents
Abstract ................................................................................................................................... ii
Lay Summary ............................................................................................................................... iii
Preface .................................................................................................................................. iv
Table of Contents .......................................................................................................................... v
List of Tables .............................................................................................................................. viii
List of Figures ................................................................................................................................ x
Acknowledgements ..................................................................................................................... xv
Dedications ................................................................................................................................ xvi
Chapter 1. Introduction ............................................................................................................. 1
1.1 Background ...................................................................................................................... 1
1.2 Research Need .................................................................................................................. 2
1.3 Objectives ......................................................................................................................... 2
Chapter 2. Literature Review ................................................................................................... 3
2.1 Mass-timber Construction ................................................................................................ 3
2.1.1 Overview ................................................................................................................... 3
2.1.2 Nail-laminated Timber (NLT) .................................................................................. 5
2.2 Timber Connections ......................................................................................................... 8
2.2.1 Overview ................................................................................................................... 8
2.2.2 Truss-Plate Connections ........................................................................................... 8
2.2.3 Self-Tapping Screws (STS) .................................................................................... 11
2.3 Timber-Concrete Composites ........................................................................................ 12
2.3.1 Overview ................................................................................................................. 12
2.3.2 Advantages of TCC................................................................................................. 13
2.3.3 Shear Connection System ....................................................................................... 14
2.3.4 Design Methods ...................................................................................................... 17

vi
2.3.5 Short-Term Behaviour ............................................................................................ 19
2.3.6 Long-Term Behaviour ............................................................................................ 20
2.3.7 Vibrational Behaviour ............................................................................................. 21
2.3.8 NLT Application in TCC ........................................................................................ 22
2.3.9 Truss-plate Application for TCC Shear Connectors ............................................... 23
2.3.10 Screw Application for TCC Shear Connectors ....................................................... 24
Chapter 3. Experimental Study .............................................................................................. 25
3.1 Overview ........................................................................................................................ 25
3.2 Materials ......................................................................................................................... 26
3.2.1 Wood ....................................................................................................................... 26
3.2.2 Nails ........................................................................................................................ 27
3.2.3 Concrete .................................................................................................................. 27
3.2.4 Truss-plates ............................................................................................................. 28
3.2.5 Self-Tapping Screws (STS) .................................................................................... 30
3.2.6 Plastic Separation Layer ......................................................................................... 31
3.2.7 Insulation................................................................................................................. 31
3.3 Small-scale Shear Tests .................................................................................................. 32
3.3.1 Specimen Design .................................................................................................... 32
3.3.2 Specimen Fabrication.............................................................................................. 39
3.3.3 Test Set-up and Instrumentation ............................................................................. 42
3.3.4 Test Procedure ........................................................................................................ 43
3.3.5 Analysis Method ..................................................................................................... 44
3.3.6 Results ..................................................................................................................... 46
3.3.6.1 Overview ........................................................................................................ 46
3.3.6.2 Strength and Stiffness ..................................................................................... 46
3.3.6.3 Truss-plate Shear Connections ....................................................................... 49
3.3.6.4 Truss-plate Shear Connections with 25mm Insulation Layer ......................... 53
3.3.6.5 STS at 30° Shear Connections ........................................................................ 55
3.3.6.6 Pairs of STS at 45° Shear Connections with 25mm Insulation Layer ............ 56
3.3.7 Discussion ............................................................................................................... 58
3.3.7.1 Overview ........................................................................................................ 58

vii
3.3.7.2 Comparison of Truss-plate Shear Connection Performance ......................... 58
3.3.7.3 Influence of Truss-plate Thickness ................................................................ 60
3.3.7.4 Influence of Truss-plate Length..................................................................... 61
3.3.7.5 Influence of Timber Embedment Depths ...................................................... 66
3.3.7.6 Influence of Insulation Layer on Truss-plate Shear Connections ................. 67
3.3.7.7 Comparison of the STS Configurations ......................................................... 70
3.4 Full-scale Bending and Vibration Tests ......................................................................... 72
3.4.1 Shear Connectors .................................................................................................... 72
3.4.2 Panel Design ........................................................................................................... 73
3.4.3 Panel Fabrication .................................................................................................... 77
3.4.4 Test Set-up and Instrumentation ............................................................................. 80
3.4.5 Test Procedure ........................................................................................................ 82
3.4.6 Analysis Methods.................................................................................................... 83
3.4.7 Results and Discussions .......................................................................................... 86
3.4.7.1 Overview.......................................................................................................... 86
3.4.7.2 Vibration Properties......................................................................................... 86
3.4.7.3 Bending Stiffness ............................................................................................. 87
3.4.7.4 Panel Capacity ................................................................................................. 91
3.4.7.5 Failure Modes .................................................................................................. 94
3.4.8 Efficiency of Shear Connectors ............................................................................ 100
Chapter 4. Conclusions .......................................................................................................... 102
4.1 Summary ...................................................................................................................... 102
4.2 Further Research .......................................................................................................... 104
References ............................................................................................................................... 105
Appendices ............................................................................................................................... 112
Appendix A – Load-Displacement Curves for Small-Scale Specimens ................................. 112
Appendix B – Design of Full-scale Specimens According to �-Method ................................ 122
Appendix C – Shear Connector Efficiency ............................................................................. 129

viii
List of Tables
Table 1: Material Properties of NLT Planks ................................................................................. 26
Table 2: Concrete Properties ......................................................................................................... 28
Table 3: Truss-plate Properties ..................................................................................................... 29
Table 4: Fully-threaded Cylindrical Head Self-Tapping Screw Properties .................................. 30
Table 5: Series of Truss-plate Connected Small-scale TCC Specimens ...................................... 33
Table 6: Series of STS Connected Small-scale TCC Specimens ................................................. 34
Table 7: Estimated, Characteristic and Average Strength Results ............................................... 47
Table 8: Average Stiffness Results ............................................................................................... 48
Table 9: Influence of Truss-plate Thickness ................................................................................. 60
Table 10: Influence of MT20 Truss-plate Length ......................................................................... 61
Table 11: Influence of MII16 Truss-plate Length with 76.2mm Timber Embedment Depth ...... 63
Table 12: Influence of MII16 Truss-plate Length with 101.6mm Timber Embedment Depth .... 64
Table 13: Influence of MII16 Truss-plate Length through 25mm Insulation Layer .................... 65
Table 14: Influence Timber Embedment Depths of the Truss-plates ........................................... 66
Table 15: Influence of Insulation Layer (MII16 Truss-plates 317.5mm Length) ......................... 68
Table 16: Influence of Insulation Layer (MII16 Truss-plates 444.5mm Length) ......................... 69
Table 17: Selected TCC Shear Connector for Full-Scale Tests .................................................... 72
Table 18: Full-Scale Panel Configurations ................................................................................... 74
Table 19: Vibration Test Results .................................................................................................. 86
Table 20: Deflection and Effective Stiffness ................................................................................ 88
Table 21: Panel Capacity .............................................................................................................. 92

ix
Table 22: Failure Modes Observed ............................................................................................. 100
Table 23: Shear Connector Efficiency ........................................................................................ 101
Table 24: Statistical Moments of Series ID 5x10-20G ............................................................... 112
Table 25: Statistical Moments of Series ID 5x16-20G ............................................................... 113
Table 26: Statistical Moments of Series ID 5x10-16G ............................................................... 114
Table 27: Statistical Moments of Series ID 5x17.5-16G ............................................................ 115
Table 28: Statistical Moments of Series ID 7x12.5-16G ............................................................ 116
Table 29: Statistical Moments of Series ID 7x17.5-16G ............................................................ 117
Table 30: Statistical Moments of Series ID 7x12.5-16G_I......................................................... 118
Table 31: Statistical Moments of Series ID 7x17.5-16G_I......................................................... 119
Table 32: Statistical Moments of Series ID STS-30° ................................................................. 120
Table 33: Statistical Moments of Series ID X-STS-45°_I .......................................................... 121

x
List of Figures
Figure 1. Nailing Pattern of NLT (Werner, 1997) .......................................................................... 6
Figure 2. System effect of the nail-laminated timber system (Natterer, 2002) ............................... 7
Figure 3. Examples of TCC connections with: nails (A1); glued reinforced concrete steel bars
(A2); screws (A3); inclined screws (A4); split rings (B1); split rings and toothed plates (B2);
steel tubes (B3); steel punched metal plates (B4); round indentations in timber, with fasteners
preventing uplift (C1); square indentations, ditto (C2); cup indentations and prestressed steel bars
(C3), nailed timber planks deck and steel shear plates slotted through the deeper planks (C4),
steel lattice glued to timber (D1); and steel plate glued to timber (D2). ...................................... 15
Figure 4. Comparison of different shear connector categories (Dias, 2005). ............................... 16
Figure 5: Details of nail-laminated TCC shear connectors: (a) triangular plates; (b) triangular
plates and spikes; (c) lag screws; (d) sloped notches and spikes (Richart and Williams, 1943) .. 23
Figure 6: Collated wire-weld nail for NLT ................................................................................... 27
Figure 7: MT20 (left) and MII16 (right) truss-plates .................................................................... 29
Figure 8: Fully-threaded Cylindrical Head Self-tapping Screws .................................................. 30
Figure 9: Series ID 5x10-20G ....................................................................................................... 34
Figure 10: Series ID 5x16-20G ..................................................................................................... 35
Figure 11: Series ID 5x10-16G ..................................................................................................... 35
Figure 12: Series ID 5x17.5-16G .................................................................................................. 36
Figure 13: Series ID 7x12.5-16G .................................................................................................. 36
Figure 14: Series ID 7x17.5-16G .................................................................................................. 37
Figure 15: Series 7x12.5-16G_I .................................................................................................... 37
Figure 16: Series 7x17.5-16G_I .................................................................................................... 38
Figure 17: Series ID STS-30 ......................................................................................................... 38

xi
Figure 18: Series ID X-STS-45_I ................................................................................................. 39
Figure 19: Fabrication of Small-scale Specimens:a) truss-plate attached to cut lumber piece; (b)
truss-plate shear connector and NLT component with slip membrane; (c) truss-plate shear
connectors and NLT components with insulation; (d) STS shear connector and NLT component
with slip membrane; (e) concrete pouring onto small-scale specimens; (f) small-scale specimen
after removing formwork .............................................................................................................. 41
Figure 20: Shear Test Setup: Schematic (left) and Photo (right) .................................................. 42
Figure 21: Shear Test Loading Protocol ....................................................................................... 43
Figure 22: Sample Load-Displacement Curve .............................................................................. 44
Figure 23: Example of Averaged Piece-wise Linear Curve ......................................................... 45
Figure 24: Truss-plate Shear Connections Average Results......................................................... 47
Figure 25: STS Shear Connections Average Results .................................................................... 48
Figure 26: Load-displacement Curves of Series ID 5x10-20G .................................................... 49
Figure 27: Load-displacement Curves of Series ID 5x16-20G .................................................... 50
Figure 28: Load-displacement Curves of Series ID 5x10-16G .................................................... 50
Figure 29: Load-displacement Curves of Series ID 5x17.5-16G ................................................. 51
Figure 30: Load-displacement Curves of Series ID 7x12.5-16G ................................................. 51
Figure 31: Load-displacement Curves of Series ID 7x17.5-16G ................................................. 52
Figure 32: Examples of Shear Slips of Small-scale Specimens ................................................... 52
Figure 33: Load-displacement Curves of Series ID 7x12.5-16G_I .............................................. 54
Figure 34: Load-displacement Curves of Series ID 7x17.5-16G_I .............................................. 54
Figure 35: Out-of-plane Rotation (left) and Concrete Failure (right) of Small-scale Specimens
with Insulation .............................................................................................................................. 55
Figure 36: Load-displacement Curves of Series ID STS-30 (per screw) ..................................... 56

xii
Figure 37: Load-displacement Curves of Series ID X-STS-45_I (per screw pair)....................... 57
Figure 38: Gap Between Insulation and Timber (left) and Close-up of STS Failure (right) ........ 57
Figure 39: Strength Comparison of Truss-plate Shear Connections ............................................ 59
Figure 40: Stiffness Comparison of Truss-plate Shear Connections ............................................ 59
Figure 41: Comparison of Truss-plate Thickness ......................................................................... 60
Figure 42: Comparison of MT20 Truss-plate Lengths ................................................................. 62
Figure 43: Comparison of MII16 Truss-plate Lengths with 76.2mm Timber Embedment Depth 63
Figure 44: Comparison of MII16 Truss-plate Lengths with 101.6mm Timber Embedment Depth
....................................................................................................................................................... 64
Figure 45: Comparison of Truss-plate Lengths through 25mm Insulation Layer ........................ 65
Figure 46: Comparison of Timber Embedment Depths of Truss-plates ....................................... 67
Figure 47: Comparison of Insulated Connections 317.4mm Long MII16 Truss-plates ............... 68
Figure 48: Comparison of Insulated Connections with 444.5mm Long MII16 Truss-plates ....... 69
Figure 49: Strength Comparison of STS Shear Connections ........................................................ 71
Figure 50: Strength Comparison of STS Shear Connections ........................................................ 71
Figure 51: NLT nailing detail [mm] ............................................................................................. 73
Figure 52: Layout of MT20 5x10 and MII16 5x10 truss-plate shear connectors (S1 & S2) ........ 74
Figure 53: Section A-A' (127mm x254mm truss-plate) ............................................................... 75
Figure 54: Detail A (127mm x254mm truss-plate)....................................................................... 75
Figure 55: Layout of MII16 5x17.5 truss-plate shear connectors (S3) ......................................... 75
Figure 56: Section B-B' (127mm x 444.5mm truss-plate) ............................................................ 76
Figure 57: Detail B (127mm x 444.5mm truss-plate) ................................................................... 76
Figure 58: Layout of MII16 7x17.5 truss-plate shear connectors (S4) ......................................... 76

xiii
Figure 59: Section C-C' (127mm x 444.5mm truss-plate) ............................................................ 77
Figure 60: Detail C (177.8mm x 444.5mm truss-plate) ................................................................ 77
Figure 61: Installation of truss-plate shear connectors ................................................................. 79
Figure 62: Fabrication of NLT ...................................................................................................... 79
Figure 63: Installation of insulation and formwork ...................................................................... 79
Figure 64: Concrete casting .......................................................................................................... 79
Figure 65: Test Setup and Instrumentation Schematic ................................................................. 81
Figure 66: Photo of Test Setup and Instrumentation .................................................................... 81
Figure 67: Full-scale loading protocol .......................................................................................... 83
Figure 68: Acceleration time-history plot (left) and discrete FFT plot (right) ............................. 84
Figure 69: Four-point bending beam diagram .............................................................................. 85
Figure 70: Load vs. displacement of series S1 up to service level ............................................... 89
Figure 71: Load vs. displacement of series S2 up to service level ............................................... 89
Figure 72: Load vs. displacement of series S3 up to service level ............................................... 90
Figure 73: Load vs. displacement of series S4 up to service level ............................................... 90
Figure 74: Load vs. displacement of series S1 ............................................................................. 92
Figure 75: Load vs. displacement of series S2 ............................................................................. 93
Figure 76: Load vs. displacement of series S3 ............................................................................. 93
Figure 77: Load vs. displacement of series S4 ............................................................................. 94
Figure 78: Load vs. shear slip of series S1 ................................................................................... 97
Figure 79: Load vs. shear slip of series S2 ................................................................................... 97
Figure 80: Load vs. shear slip of series S3 ................................................................................... 98

xiv
Figure 81: Load vs. shear slip of series S4 ................................................................................... 98
Figure 82: Failure mechanisms: (a) state of panel at end of bending test; (b) governing timber
fracture; (c) non-governing concrete crushing; (d) governing concrete crushing; (e) & (f) shear
slips at panel ends ......................................................................................................................... 99
Figure 83: Complete Load-Displacement Curves of Series ID 5x10-20G ................................. 112
Figure 84: Complete Load-Displacement Curves of Series ID 5x10-20G ................................. 113
Figure 85: Complete Load-Displacement Curves of Series ID 5x10-16G ................................. 114
Figure 86: Complete Load-Displacement Curves of Series ID 5x17.5-16G .............................. 115
Figure 87: Complete Load-Displacement Curves of Series ID 7x12.5-16G .............................. 116
Figure 88: Complete Load-Displacement Curves of Series ID 7x17.5-16G .............................. 117
Figure 89: Complete Load-Displacement Curves of Series ID 7x12.5-16G_I ........................... 118
Figure 90: Complete Load-Displacement Curves of Series ID 7x17.5-16G_I ........................... 119
Figure 91: Complete Load-Displacement Curves of Series ID STS-30° ................................... 120
Figure 92: Complete Load-Displacement Curves of Series ID X-STS-45°_I ............................ 121

xv
Acknowledgements
My sincerest gratitude goes to Dr. Thomas Tannert, my supervisor, for being so patient and
understanding in guiding me to complete this thesis. His knowledge and passion have
encouraged and motivated me throughout the challenges in this study. Thank you, Dr. Tannert
for providing me the opportunity to explore the possibilities of timber engineering.
I thank engineers Brian Maver and Mark Robertson of WHM Structural Engineers and Govinder
Dhesi of West Coast Home and Truss Ltd. for their technical expertise and wisdom. They
provided me with valuable advice and resources that guides this research from theory to practice.
I extend my thanks to the technicians and staff at the laboratories in UBC and West Coast Home
and Truss Ltd. who, through hard work and dedication, made the fabrication and experimentation
of the specimens possible. Special thanks to Harald Schrempp and John Wong at the Structures
Lab, George Lee and Chao Zhang at the Wood Mechanics Lab, and Lawrence Guenther and
Joern Dettmer at the Centre for Advanced Wood Processing.
In turn, I must also acknowledge Rempel Bros. Concrete and Lafarge for their generous donation
of concrete and the National Sciences and Engineering Research Council of Canada’s Engage
Program for providing the funding to proceed with this project.
Lastly, I would like to express my thanks to my colleagues and friends for their tremendous
support in fabricating the specimens especially to Johannes Schneider, whose talent with the
tools contributed greatly. Thank you for not only in helping to fabricate but also having fun
together while doing so.

xvi
Dedications
To my parents,
for believing in me and endlessly supporting me.

1
Chapter 1. Introduction
1.1 Background
Timber as a building material addresses important issues of the 21st century by requiring low
energy in production and providing the capacity for storing CO2. In addition to ecological
concerns, mass-timber panels composed of wood planks and steel nails known as nail-laminated
timber (NLT) address economical issues (Natterer, 2002).
In 2012, a significant development was made in the British Columbia Building Code (2012) by
increasing the limit of light-frame wood construction from 4 storeys to 6 storeys. Methods to
address the challenges of using timber as a structural material for tall buildings are still being
investigated. For floor structures, these challenges can be limited by its structural integrity and
discomforting vibrations. One solution is to integrate mass-timber floors with concrete into a
composite floor system known as timber-concrete composites (TCC). And applying NLT into
TCC systems can propose an economically promising solution.
A requirement for TCC to achieve composite action is that the two materials must be connected
using shear connectors. Investigations on different shear connectors have been conducted in the
past. For nail-laminated TCC, compatible shear connections are, but not limited to, metal truss-
plates and screw-type connections because of their ease of installation. The efficiency of the
installation of the truss-plates can be recognized because their teeth can be pressed onto the face
of each laminations of the NLT leaving a certain depth exposed to be embedded by the concrete
before nailing the individual planks. Overall, nail-laminated TCC can offer a floor system that is
economical in materials and construction, however, has yet to be investigated in terms of its
structural and vibrational behaviour.

2
1.2 Research Need
TCC systems face challenges in general to be implemented widespread by designers in North
America. For nail-laminated TCC, these challenges include: (i) lack of agreed upon design
approach for TCC systems, (ii) lack of appropriate test data on nail-laminated TCC, and (iii) on
truss-plates or screws applied as shear connector as well as other readily available shear
connectors suitable for the system. Research on the structural and serviceability performances
are needed in order to address these challenges.
1.3 Objectives
A test program for nail-laminated TCC was developed at the University of British Columbia to
systematically address the challenges and to provide a potentially economical option of a TCC
system for engineers, designers and manufacturers in North America. The results of this test
program can lead to creating new opportunities for the utilization of timber as a material for
building structures and providing another potential layer of value-added services to the
construction industry.
The aim of this research project is to investigate the properties of nail-laminated TCC systems in
a way that is most useful to current engineering practice. This requires fabricating specimens of
the TCC system such that manufacturers would produce the TCCs in transportable panels and
then conducting tests that simulates its applications for floor systems to its shear connectors and
overall system. The specific objectives were to investigate (i) the properties of truss-plates and
self-tapping screws (STS) as shear connectors, (ii) the short-term bending and (iii) vibration of
nail-laminated TCC with selected truss-plates as shear connectors.

3
Chapter 2. Literature Review
This chapter reviews the literature related to nail-laminated TCC. Section 2.1 reviews mass-
timber constructions including detailed information on NLT. Section 2.2 reviews timber
connections including detailed reviews on truss-plates and self-tapping screws since they are
investigated as shear connectors in the experimental work. Section 2.3 reviews various topics of
timber-concrete composites including the applications of NLT, truss-plates, and STS in TCCs.
2.1 Mass-timber Construction
2.1.1 Overview
Mass-timber construction is known as the type of construction process that uses traditional or
contemporary engineered wood products as the primary structural material of choice (Kremer
and Symmons, 2015). The traditional form of mass-timber construction consists of using heavy
wooden frames of posts and beams supporting floor joists with un-reinforced brick and mortar
for exterior walls (Friedman, 2010). This form of construction was recognized to construct tall
buildings (buildings 5 storeys and above) in North America in the early 19th century. In Canada,
these buildings were originally built as factories, warehouses, and manufacturing plants during
the industrial era. There are many examples of these buildings from the early 20th century that
are still in service today. Urban renewal of Canadian cities has led to the renovations of these
existing industrial buildings to be re-used or re-purposed for unique work and living
environments. High open ceilings, exposed wood structural frames, exposed steel connections,
exposed mechanical systems, and sand blasted brick walls in these buildings features as a form
of expression and identification of its history (Koo, 2013).

4
Over the second half of the 20th century, mass-timber construction declined due to the
technological advancement of alternative construction materials. However, the rising
environmental concerns in the present along with innovations in engineered wood products and
connections revived the practice and engaged developers to build modern tall wood buildings. In
addition, the initiative for objective- and performance-based building codes, have significantly
contributed to its revival. Recent advancements in fire safety and protection engineering,
building science, and structural engineering analysis have also benefitted mass-timber
construction (Karacabeyli and Mohammad, 2015). Presently, mass-timber construction is
typically used in applications as a substitute for wet-poured reinforced concrete, solid section
‘tilt-slab’ concrete, and steel framing. Mass-timber construction is ideally suited for mid-rise
structures, and has been used internationally to greatly effect public occupancy buildings such as
libraries, and detached multi-residential housing (Kremer and Symmons, 2015).
Mass-timber construction projects involve full or partial use of mass-timber panels. Mass-timber
panels, made from either traditional wood products or engineered wood products, are used in a
variety of building types and sizes as wall, floor, core and roof sections. Examples of such panels
are cross-laminated timber (CLT), glue-laminated timber (GLT), nail-laminated timber (NLT),
laminated veneer lumber (LVL), and laminated strand lumber (LSL). Mass-timber panels can
offer to be beneficial in terms of fire, acoustic, seismic and structural performance, rigidity,
stability, and construction efficiency. Building codes require all building systems to perform to
the same level of safety, regardless of the material used in construction. Mass-timber panels
significantly contribute wood building materials to meet and in some cases, exceed code
requirements (Canadian Wood Council, 2014).

5
2.1.2 Nail-laminated Timber (NLT)
Applications of NLT can be dated back to the traditional form of mass-timber constructions in
the early 19th century. Certain historical buildings with heavy-timber framing and brick cladding
incorporated NLT floor panels to build factories and warehouses. In North America, most bridge
decks from the 1920’s through the mid-1960’s were made of transverse NLT panels with the
exception of few longitudinal NLT panels. With the introduction of GLT, NLT bridge decks
have declined for being deemed not suitable to provide structural strength unless supporting
beams were closely spaced (Ritter, 1990). Presently, NLT technology is being acknowledged as
having economical values as much as environmental in massive timber constructions. Current
examples of residential buildings, spatial structures, and shell structures where NLT is applied
for structural and architectural purposes can be found across Europe (Natterer, 2002).
NLT is a construction technique that consist of a series of lumber planks (4 to 12 inches deep
with a nominal thickness of 2 inches) placed on edge and nailed together on their wide faces. The
resulting panel has a width corresponding to the widths of all the planks. Typically, the nailing
pattern for NLT panels consist two rows of nails. Spacing of the nails should be designed to
conservatively resist the shear flow but should not be more than 300 mm apart. The nails in one
row are spaced halfway between the other row creating a zig-zag pattern as shown in Figure 1
(Werner, 1997).

6
Figure 1. Nailing Pattern of NLT (Werner, 1997)
NLT panels can be constructed in a continuous manner using planks of the same length or having
planks of different lengths overlaid to one another. This method is called overlaying and butt-
joints are formed as a result (Werner, 1997).
NLT panels with continuous planks can be designed based on the provisions from the Canadian
Engineering Design Standard CSA O86-14. The provisions provided for built-up beams can be
used for the design of NLT panels. But built-up beams are limited to 5-ply and NLT panels
would typically require more plies of laminations. Hence, the individual planks can be treated as
structural joists with zero spacing and designed to satisfy the required strength and serviceability
criteria for sawn lumber joists. The nails can be designed as dowel-type fasteners to resist the
shear flow occurring in the connected plank members of the panel.
This method, however, cannot be used to design NLT panels with butt-joints because the
discontinuity in the planks contributes to decrease the bending stiffness of the panel. Haller
(2000) tested 3.9m long simply-supported NLT panels (28mm by 120mm lumber and 165mm

7
nail spacing) with different butt-joint configurations of varying irregularity. The bending
stiffness reduced by approximately 20% for butt-joints arranged in a line and slightly better for
irregularly distributed butt-joints. The butt-joints and their distribution were concluded to be
crucial for the structural behaviour of the floors.
Natterer (2002) emphasizes as the main advantage of NLT that it is an economical form of
timber construction because it is able to utilize medium-to-low quality wood instead of relying
on high-quality. A defect in one plank has little influence on the failure of the NLT structure as a
whole because stress is distributed to the adjacent planks through the nails. Thus, NLT is less
variable in strength compared to solid wood. The frequency of strength due to a system of planks
as compared to a single plank is depicted in Figure 2.
Figure 2. System effect of the nail-laminated timber system (Natterer, 2002)
Moreover, overlaying the planks can reduce waste of wood by utilizing shorter planks and thus
reducing cost of additional lumber (Werner, 1997). Other advantages when compared to
traditional joist system are: (1) reduce construction height, (2) improve acoustic and thermal
insulation, and (3) variants of aesthetics for visible ceilings (Natterer 2002).

8
2.2 Timber Connections
2.2.1 Overview
Mass-timber construction requires the use of different types of timber connections depending on
the type of load transfers. A variety of mechanical fasteners exists for timber connections: nails,
spikes, lag screws, wood screws, bolts, dowels, drift pins, timber rivets, shear plates, split rings,
truss-plates, joist hangers, and framing anchors. Dowel type fasteners transmit either lateral
loads, which are transmitted by bearing stresses developed between the fastener and the
connection members, or withdrawal loads, which are axial loads parallel to fastener axis
transmitted through friction or bearing to the connected material. The resistance of the wood
material in bearing or withdrawal often governs the connection design rather than the strength of
the fastener. The resistance of the wood material depends on the wood species, direction and
duration of load, and conditions of use. Therefore, fasteners are selected and designed to provide
satisfactory performance for the life of the structure without causing splitting, cracking or
excessive deformation of the wood members (ASCE, 1996).
2.2.2 Truss-Plate Connections
Truss-plates were first introduced in the 1950s as a prefabricated connection for wood truss
systems to replace nailed plywood gusset board truss systems. It rapidly became popular in
North American residential, industrial, and low-rise commercial construction due to its
versatility, cost effectiveness and ease of installation (Xiaoqin, 2013).
Truss-plates are metal plates generally made of light structural quality steel with zinc, zinc-
aluminum alloy coatings or stainless steel. These plates have integral regularly-patterned teeth
protruded on one side and is manufactured to various lengths, widths, and thicknesses (ASCE,

9
1996). Truss-plates in North America are generally made of galvanized stainless-steel sheets
approximately 1.6mm (0.062in.), 1.27mm (0.05in.), and 0.9mm (0.038in.) in thickness which are
commonly referred 16-, 18-, or 20-gauge respectively. Truss-plates are intended to connect
nominal two-by lumber (38mm thick wood planks). Truss-plate joints are fabricated by pressing
the teeth of the plates using a hydraulic press or a roller into the wood members laid out. The
strength and stiffness of the truss-plates are important because truss joints are the critical links in
a truss system. Failure in the joints can occur, leading to a failure of the whole truss system, if
the truss-plate has lower strength and stiffness than the wood members (Xiaoqin, 2013).
In the joint of a truss system, load is transferred from one wood member to the other through the
truss-plates. The strength and stiffness of the joint connection depends on the plates’ shear and
tensile capacities, as well as the gripping capacity of the plates’ protruded teeth with respect to
different force-plate-grain orientations (Xiaoqin, 2013). Past experimental studies (Lau, 1986;
Wolfe, 1990; Gupta and Gebremedhim, 1990; Gupta, 1992; Stahl et al., 1994; O’Regan et al.,
1998) conclude that the latter governs the strength and stiffness of a truss connection as tooth
withdrawal is shown to be one of the dominant failure modes for connections in tension. Thus,
the connection behaves in a composite nature and characterizing the load-displacement
relationship of each tooth with respect to the wood bearing is of significance in determining the
joint stiffness. Truss connections axially loaded in tension were frequently investigated to simply
understand its behaviour that may serve to guide the study of more complex connections.
Furthermore, the configuration of the joints, and the size and layout of the tooth of the truss-
plates were found to affect the strength and stiffness of the truss joints as well as their failure
mode (Xiaoqin, 2013).

10
Ellegard (2000) tested series of truss joints to compare with the results of an existing finite
element model for analysis of trusses. The joints were constructed using 1mm thick truss-plates
and 45mm thick Swedish spruce lumber where the effects of both tension and compression loads
applied were investigated. Moreover, the tests were performed in all combinations of force-plate-
grain orientations for every 30-degree rotation. Although the truss joints were designed to fail in
the plates, brittle failures in the anchorage and timber were observed in certain tensile tests after
the plate had become plastic which may show misleading results. Results from the compression
series was found to be inaccurate with the outcomes of the model due to uncertainty in the load
level where the plate starts to buckle. However, the author concludes that the model is able to
predict the stiffness and load level where the plate starts to buckle.
A sophisticated model that can predict the plate peeling and tooth withdrawal was developed by
Xiaoqin (2013) and proposed a tentative tooth withdrawal failure criterion based on percentile of
tooth withdrawal. To verify these, truss connections made of nominal two-by-four (38x89mm)
Spruce-Pine-Fir (SPF) lumber and 0.9mm thick metal truss-plates were tested. The
configurations consisted of teeth parallel, perpendicular, 45-degree, and 60-degree to grain while
all loads were applied in tension parallel to grain. Approximately a quarter of the plate’s teeth
were pressed onto the wood member loaded in tension on each side of the joint and the
remaining teeth connected to the opposing wood member. Failure of all joint configurations
exhibited similar to each other being teeth withdrawal associated with plate peeling. The
calibrated model predicted the behaviour of the joint adequately well up to the critical load with
over 95% ratios of predicted maximum force to the average test data.

11
2.2.3 Self-Tapping Screws (STS)
Self-tapping screws (STS) were developed to increase the load-carrying capacity of traditional
lag screws or wood screws for use in large-scale timber structures. Their threads are longer to
provide reliable embedment into timber elements and hardened to produce higher tensile,
moment and torsional yield strengths. Most STS feature a continuous thread leading to a more
uniform load transfer over the whole length. The STS tips are optimized to not require any pre-
drilling giving the advantage in faster installation which makes it a cost-efficient connector
appropriate for many timber structures (Dietsch and Brandner, 2015). The high axial load-
carrying capacity of the screws can be maximally utilized when the screws are loaded parallel to
the axis. This can be achieved in timber shear connections with the screws installed at angles
between 30° and 90° to the wood grain. In addition, pairs of crosswise arranged screws are able
to transfer tension and compression forces which can provide higher capacity in shear
connections than singly-inclined screws (Closen, 2012).
Closen (2012) tested STS connections in shear to investigate its performance under monotonic
and reverse cyclic loading. The connections were installed in multiple crosswise arrangements at
30° and 45° screw-in angles. The screws were 8mm in diameter of various lengths to provide
equivalent embedment lengths for each arrangement. The number of screws used for each
crosswise arrangement was either 4 screws or 8 screws. The test results obtained provide basic
information for STS connections in terms of strength, stiffness and efficiency. Comparing the
screw-in angles, the average capacity of screws installed at 30° was calculated to be 30% higher
than those installed at 45°. As expected, an increase in capacity was observed due to the decrease
of the force component perpendicular to the fastener axis. However, no distinct increase was
seen in terms of average stiffness.

12
2.3 Timber-Concrete Composites
2.3.1 Overview
Timber-concrete composite (TCC) is a technique that integrates timber and concrete in structural
elements. It was initially developed after World War II due to shortage of steel for steel
reinforcement in concrete. In European cities, the application of TCC was primarily a method of
rehabilitating old historical buildings to comply with current regulations of building physics with
regards to sound insulation and fire resistance. The interest in TCC systems grew in the last 50
years to bridge construction, upgrading existing timber floors, and construction of new multi-
storey buildings for medium to long-span (7 to 15 metres) floor systems (Yeoh et al., 2010).
TCC system consists of a timber element in the form of joists/beams or a solid deck of mass-
timber panels in the tension zone and are connected compositely to a thin layer of concrete in the
compression zone. The concrete mainly resists compression and the timber resists tension and
bending when in flexure under gravity loads. Concrete is strong and stiff in compression, as is
timber in tension. Thus, each material is fully exploited to its inherent strengths in this
arrangement (Yeoh, 2010). The timber is connected to the concrete by a system of shear
connectors. The design and properties of the shear connector system are crucial to the
performance and efficiency of the TCC system (Lukaszewska, 2009). Different connection
systems, as summarized in section 2.3.3, have been investigated and developed in this aspect.
Yeoh et al. (2010) identified three fundamental design criteria that must be satisfied for this
technique to be efficient: (i) the neutral axis of the composite cross section should be located
near the timber-concrete interface to ensure both elements act efficiently with concrete purely
compressed (and therefore un-cracked) and the timber mostly subjected to tensile stresses; (ii)

13
the connection system must be strong and stiff enough to transfer the design shear force and
provide an effective composite action; and (iii) the timber must be strong enough to resist
bending tensile stresses induced by gravity loads applied on the composite beam. Awareness of
and familiarity with the behaviour and design methods of TCC are important for this type of
construction to become a viable option for the building industry.
2.3.2 Advantages of TCC
TCC floors can be advantageous compared to lightweight timber-frame floors and traditional
reinforced concrete as it resolves their weaknesses. For many types of timber-frame floors,
serviceability criteria are what govern its design limiting its application to non-residential
buildings. This is because timber floors are well reputed to suffer from excessive deflection,
susceptibility to vibrations as well as insufficient acoustic separation, inefficient insulation and
low fire resistance. TCC floors can address to these limitations by: (i) significantly increase its
stiffness, mass and damping which leads to reduction in deflections and susceptibility to
vibrations; (ii) improve the acoustic separation and insulation, particularly with the introduction
of a rigid insulation layer between the timber and concrete, and (iii) enhance its fire resistance.
Additionally, it can increase the thermal mass which reduce the energy needed to heat and cool
the building (Yeoh, 2010).
In reinforced concrete slabs, there is inefficient use of material because of the tension zone
cracks reducing the effective structural depth by 40-60%. Tensile cracking can expose the steel
reinforcement in the concrete making it vulnerable to corrosion and risk of fire. TCC floors
resolve this by having solid wood to replace the reinforced concrete in the tension zone. The self-
weight of the structure can be markedly reduced because the overall depth of the concrete slab
can be reduced by up to 50%. There is low risk of the reinforcement being exposed to fire

14
because the concrete in TCC floors are not subjected to high tensile stress (Gutkowski et al.
2008). Additional advantages can be provided by increasing the speed of construction, reducing
weight imposing less load on foundations and lateral strength against seismic activity required
within the structural system, possibility to use the timber as decorative ceiling lining, low
embodied energy, and reduced CO2 emissions (Yeoh, 2010).
2.3.3 Shear Connection System
In TCC, the timber and concrete elements are connected through a shear connection system
which should be capable to transfer internal shear force from one material to the other in order to
achieve full or partial composite behaviour within the structure. Typically, the positions of the
shear connections are arranged according to the shear force distribution. For a simply-supported
bending member subjected to a uniformly distributed load, they are closely positioned near the
supports, where the internal shear force reaches maximum, and spaced out gradually towards the
middle of the span, where the internal shear force reaches zero (Yeoh, 2010).
Different shear connection systems exist and are continued to be studied in different parts of the
world. With such variety, the connection systems can be categorized based on how they are
installed and arranged along the timber: discrete/continuous, vertical/inclined, glued/non-glued,
and prestressed/non-prestressed (Yeoh et al., 2011). Ceccotti (2002) grouped the most commonly
used connections in relation to their stiffness as shown in Figure 3: Connectors in groups A, B,
and C provides partially composite action and are ordered from low stiffness to high stiffness.
Full composite action can be achieved with connectors in group D for being the stiffest.

15
Figure 3. Examples of TCC connections with: nails (A1); glued reinforced concrete steel bars
(A2); screws (A3); inclined screws (A4); split rings (B1); split rings and toothed plates (B2);
steel tubes (B3); steel punched metal plates (B4); round indentations in timber, with fasteners
preventing uplift (C1); square indentations, ditto (C2); cup indentations and prestressed steel
bars (C3), nailed timber planks deck and steel shear plates slotted through the deeper planks
(C4), steel lattice glued to timber (D1); and steel plate glued to timber (D2).

16
The connectors should have the shear strength and stiffness that can maximize the composite
action with the minimal amount required. Preferably, the connectors should also be ductile
within the TCC element as both concrete and timber are naturally brittle in compression and
tension respectively (Deam et al., 2008). In order to characterize a connection system, shear tests
on small-scale specimens of the TCC system, where connectors are subjected to a direct shear
force, are often performed to determine the strength and stiffness. Shear tests are typically
conducted according to EN 26891 (CEN, 1991) where load-displacement curves are usually
produced to determine the properties. The strength is defined as the maximum load applied
before failure. Stiffness is quantified by the slip modulus (slope of the load-displacement curve)
at three different load levels (40, 60, and 80% of the average maximum load). This also accounts
for the non-linear behaviour of the connectors (Yeoh et al., 2011). A comparison of load-
displacement relationship for different categories of connection can be seen in Figure 4.
Figure 4. Comparison of different shear connector categories (Dias, 2005).

17
The connectors should be inexpensive to manufacture and install to make TCC cost effective.
Therefore, how efficient a TCC system is depends significantly on the shear connection system
and its properties (Deam et al., 2008). The efficiency of the shear connectors can be determined
by evaluating the performance of TCC floor systems using the following definition:
���������� = �� − ��
�� − ��∙ 100%
(1)
where DC is the theoretical fully composite deflection (calculated by transformed section
analysis), DN is the theoretical fully non-composite deflection (calculated as a layered beam
without interlayer shear transfer), and DI is the measured deflection for incomplete composite
action of the specimen (Gutkowski et al., 2008).
2.3.4 Design Methods
Various methods have been proposed and studied to design TCC bending members (Mohler,
1956; McCutcheon, 1977; Frangi and Fontana, 2003; Girhammar, 2009). The method of
transformed sections, used for steel-concrete composites, is only valid for sections that are fully
composite. It is non-conservative for partially composite sections, which is the case for TCC
systems with semi-rigid connectors (Clouston and Schreyer, 2008).
Under flexure, the concrete and timber layers in a partially composite section relatively slide to
one another in a partially constrained manner. The relative slip is maximum at the ends and
reduces to zero towards the middle of the span. This mechanism is what creates a compressive
axial force on the concrete and tensile force on the timber when the TCC panel is loaded in pure
bending to deflect downwards. These forces act as an internal force couple and shear forces
develop on the shear connectors to ensure equilibrium of each layer in the axial direction that is
consistent with the deformation (Ceccotti, 2002). For linear-elastic behaviour, the slip

18
mechanism indicate that the classical bending theory of beams cannot be applied since the Euler-
Bernoulli assumption (plane section remains plane) is not valid throughout the whole cross-
section (Clouster and Schreyer, 2008).
With the Euler-Bernouilli beam theory assumed for the concrete and timber sections only and not
at the interlayer, Mohler (1956) derived a linear-elastic solution, known as the �(Gamma)-
method, to design TCC bending members. It makes use of an effective flexural rigidity, (EI)eff :
(��)��� = � (���� + ���������)
�
���
(2)
where subscript i corresponds to the layer of the composite (i = 1 for concrete and i = 2 for
timber), EI and A are the flexural rigidity and cross-sectional area of each element respectively, a
is the distance from the neutral axis of the composite to the neutral axis of the elements, and � is
the ‘connection efficiency factor’ ranging between 0 (no composite action) and 1 (full composite
action):
�� = 1
1 +��������
�����
, �� = 1 (3)
where E is the modulus of elasticity, s1 is spacing of the connectors between rows, nr is the
number of connectors per row, and l is the span length. K is stiffness of the shear connector
which is the slip modulus determined from shear tests. It is important to note that (EI)eff is not
necessarily a characteristic of the cross-section but a function of both the load distribution and
span. However, its dependence on the load distribution can usually be neglected for engineering
purposes (Ceccotti, 2002). With the calculated (EI)eff, element stresses are calculated by linear
superposition of flexural and axial contributions.

19
Additional TCC design methods by McCutcheon (1977) and Girhammar (2009) were developed
but are essentially equivalent to the �-method in that they were derived from the exact same set
of differential equations. Both methods account for different factors. McCutcheon’s (1977)
method introduces a hyperbolic factor to account for different loading condition. Girhammar’s
(2009) method was formulated for a mechanically fastened beam and therefore, a parameter is
incorporated to account for different possible boundary conditions. Regardless, both methods
result identical solutions to the �-method for simply-supported beam under standard loading
condition. Frangi and Fontana (2003) specifically proposed the elastoplastic solution for cases in
which the failure of the TCC is attained after connector plasticization. This is fairly common
when the connectors are low strength, low stiffness, and high ductility. The failure load is
evaluated by assuming a rigid-perfectly plastic connection.
The European Standard for Timber Design, Eurocode 5, Part 1, Annex B (CEN, 2004), provides
detailed formulae based on the �-method to design composite bending members. Presently, this
provision is most widely used for designing TCC bending members.
2.3.5 Short-Term Behaviour
The short-term behaviour of TCC systems are often investigated by conducting point-load
bending tests on full-scale specimen to the point of collapse. Aspects investigated are the load-
bearing capacity and deflection at serviceability limit states (SLS) and ultimate limit states
(ULS), the percentage of composite efficiency the system achieved, and the failure mechanism.
Yeoh et al. (2011) state that a close relationship exists between the collapse load, the failure
mechanism, and the type of connection system.
Numerous full-scale bending tests have been performed on various TCC floor systems to date.

20
Van der Linden (1991) conducted full-scale bending tests on 30 glulam-concrete composite
beams using three different shear connectors: screws installed at 45° (10 specimens), truss-plates
bent at 90° (10 specimens), and concrete grooves with reinforcement bars (10 specimens). The
tests were conducted to the simply-supported beams in four-point bending where point loads
were applied at one third of the span length to simulate live loads. Displacement transducers
were installed to measure the maximum vertical displacement, the slip along the beam axis (at
interlayer), and the deformation due to the compression stresses perpendicular to the grain at the
supports (gaps). At increasing load, concrete cracks, gaps between the timber and concrete slab,
and splitting of timber beams were observed. All specimens ultimately exhibited brittle failures
in the timber element but satisfied the SLS and ULS requirements. Past full-scale TCC bending
tests often refer to Van der Linden’s (1991) test methods as a basis.
2.3.6 Long-Term Behaviour
Many complex phenomena including, but not limited to, concrete creep, mechano-sorptive creep,
shrinking/swelling, thermal strain, and concrete cracking may occur in the component materials
(concrete, wood, and connectors) in the extended service period of TCCs. Fragiacomo et al.
(2007) investigated the long-term performance of nail-laminated TCC beams with shear notch
connections. A dead load simulating the quasi-permanent part of the serviceability design was
applied to the beams for 133 days in an uncontrolled environment. From monitoring the
deflections and environmental conditions, a total deflection of approximately the span
length/100, which exceeds SLS requirements, was observed at the end of the testing period. The
effect of shrinkage was found to be critical to the composite because of the high stiffness of the
shear connectors. Decay of wood due to moisture from concrete bleeding was not observed.

21
2.3.7 Vibrational Behaviour
In the past, deflection limits have been used in an attempt to control floor vibrations but they
showed to be unsatisfactory as the number of complaints increased from occupants. The National
Research Council of Canada replaced these limits in the latest National Building Code of Canada
(NBCC) with recommended acceleration limits depending on the occupancies affected by the
vibration. A number of factors relating to both the loading type (i.e. amplitude and frequency),
and structural dynamic properties (i.e. mass, damping, stiffness, and mode shapes) are taken into
consideration in the NBCC criterion.
For timber floors, the lightweight nature leads to large initial peak velocities causing substantial
vibrations when subjected to an impulse load such as occupant footfalls. This is associated with
timber floors having low rigidity and inertia. The perceptibility of these vibration is apparent
enough to induce discomfort to occupants (Bernard, 2008). Past research has indicated that
vibrations perceived as annoying or uncomfortable are not to occur by ensuring the natural
frequency of the floor system is above a typical limit of 8.0 to 10.0Hz (Ljunggren et al., 2007) or
a lower limit range from 8.0 to 12.0Hz (Smith and Chui, 1988). Floor systems with a natural
frequency predicted below 8.0Hz impose a great risk that the response of a vertical footfall
excitation can become resonant (Ohlsson, 1998).
TCC floor systems were studied to determine the influence the added concrete has on the
vibrational behaviour. While the mode shapes and damping ratios are important to characterise
the dynamic performance of TCC floors and should be evaluated regarding to their use (Jorge et
al., 2010), the fundamental natural frequency is recognized as most important (Abd Ghafer et al.,
2008). Eurocode 5 (CEN, 2004b) presents a simplified expression to predict the fundamental
natural frequency, fn, for the simply-supported beam as:

22
�� = �
2
1
���
��
�
(4)
where L is the span length, EI is the bending stiffness and m is the mass of the TCC panel.
The ratio within square root is worth noting. On one hand, the added mass by the concrete
increases the natural frequency, which was the case for the CLT-concrete composite Jorge et al.
(2010) investigated (natural frequency increased by between 20% and 70%). On the other hand,
the increased stiffness counteracts to decrease the natural frequency, which was the case for the
experimental results of glulam-concrete composite beams by Santos et al. (2015) (from 31.0 to
17.4Hz). The fundamental natural frequency can also be measured from dynamic impact tests.
Santos et al. (2015) applied impacts at different points of the glulam-TCC beams while recording
the acceleration time-history at a sampling frequency of 5000Hz to be later transformed through
the Fast-Fourier Transform (FFT) to the frequency domain to determine the natural frequency.
2.3.8 NLT Application in TCC
One of the oldest TCC systems that were used for highway bridge decks in the United States and
Canada since 1932. NLT was the timber element with alternate planks raised up to 2 inches to
form longitudinal grooves rigidly interlocking with the concrete (American Wood-Preservers’
Association, 1941). Eventually this led to some of the earliest full-scale bending tests (Richart
and Williams, 1943) conducted on composite beams on the nail-laminated TCC system. The
primary objective was to compare its performance using four different shear connectors shown in
Figure 5. The trapezoidal steel plates supplemented with spikes performed best with high load-
carrying capacity, good integral beam action (developed small slip at the interlayer), and small

23
deflections. The Oregon Highway Department developed a design based on the test results and
has been used for several bridge constructions (Lukaszewska, 2009).
Figure 5: Details of nail-laminated TCC shear connectors: (a) triangular plates; (b) triangular
plates and spikes; (c) lag screws; (d) sloped notches and spikes (Richart and Williams, 1943)
2.3.9 Truss-plate Application for TCC Shear Connectors
Truss-plates have been studied to be applied as shear connectors for TCC systems. Girhammer
(1984) was the first to thoroughly investigate truss-plates as TCC shear connectors and states
three possible failure modes: (i) failure of the truss-plates in tension/compression and shear; (ii)
anchorage failure of the truss-plates in the timber due to failure of the teeth of the truss-plates or
of the wood; and (iii) anchorage failure of the truss-plates of in the concrete due to failure of the
bond between the truss-plates and the concrete.
Clouston and Schreyer (2011) conducted shear and full-scale bending tests on LVL-concrete
composite T-beams using two pre-manufactured, 152mm wide by 304mm long 20-gauge steel
truss-plates as shear connectors. The truss-plates were placed doubly-sided between two LVL
and half its depth were embedded into the wood while the remaining half exposed to concrete
were bent 45-degree by hand. For the shear tests, all specimens were observed to have failed by
distortion and yielding of the truss-plates at the shear interface. The corresponding load-

24
displacement curves indicate ductile mechanical behaviour of steel failure mechanism. Peak
strength and stiffness from the slope of the linear portion of the load-displacement curves were
calculated as 62kN and 128kN/mm respectively. The values were within the expected range
compared to low and high stiffness connectors. For the bending tests, ductile failure behaviour
was observed similar to the shear tests. Shearing of the connectors (partial tearing of the steel
plate) appeared to be the main failure from visible shear deformation at the ends of the beam.
2.3.10 Screw Application for TCC Shear Connectors
Screws have been well investigated in the past as efficient shear connectors for TCC systems
(Van der Linden, 1999; Jorge et al, 2010; Kavaliauskas et al, 2010; and Kanocz et al, 2013) and
for pre-fabricated TCC systems (Lukaszewska, 2009). The ability of STS to be effectively
embedded at angles to the grain provides the opportunity to utilize the high axial strength and
stiffness of the connectors and makes them an excellent choice for shear connectors in TCC,
which typically are required to resist high forces parallel to the axis of the timber at the highest
stiffness possible.
Kanócz et al. (2013) experimentally investigated the short-term behaviour of cross-inclined steel
screws (5x120mm) as shear connectors. The composite system consists of a fibre-reinforced
concrete slab and vertically oriented timber planks (joists) spaced 278mm centre-to-centre. From
the four-point bending tests, shear cracks were observed on both sides of the concrete slab as
load reached approximately 70% of ultimate level (3kN in on average) until collapse, which was
confirmed due to tension failure of the timber for all specimens. The �-method was able to
accurately predict the short-term performance.

25
Chapter 3. Experimental Study
This chapter presents the experimental work conducted to investigate on the performance of nail-
laminated TCC. Section 3.1 gives an overview of the different tests conducted, section 3.2
specifies the properties of the materials used, and sections 3.3 and 3.4 explain the design, test
proceedings, methodology, analysis results and discussions of the small-scale and full-scale
specimens, respectively.
3.1 Overview
The performance of nail-laminated TCC floors was investigated by conducting shear tests on
small-scale specimens with various shear connectors, and bending and dynamic tests on full-
scale panels. The specimens required prefabricating the NLT with the shear connectors installed
prior to concrete pouring. The objective of the small-scale shear tests was to determine and
compare the strength and stiffness properties of the different shear connectors. For the shear
tests, the investigated shear connectors consist of different sized truss-plates and configurations
of STS. The influence of a rigid insulation as interlayer was also investigated. Shear connectors
from the shear tests were selected for the full-scale tests. The objectives of the full-scale tests
were to evaluate the bending and dynamic properties of nail-laminated TCC panels. The
connection layouts of the test panels were arranged in the design process to perform for a service
load level representative of 4.8kPa live load.

26
3.2 Materials
3.2.1 Wood
In Canada, designers are mandated to design wood structural members according to CSA O86-14
(CSA, 2015) which specifies the mechanical properties of different wood species and grades. In
this project, Canadian Spruce-Pine-Fir (SPF) No. 1 lumber, purchased from local companies,
was used to construct the NLT. The size of the lumber was nominal two-by-six (38x140mm)
used for light-frame construction. The lumber is categorized as structural joists and planks given
its dimension. Table 1 summarizes the mechanical properties of the lumber used (CSA, 2015).
Table 1: Material Properties of NLT Planks
Species Grade Mechanical Properties (MPa) (1)
fb (2) fv fc fcp ft
E (2)
Spruce-Pine-Fir No. 1 11.8 1.5 11.5 5.3 5.5 9,500
(1) E = Modulus of elasticity; fb, fv, fc, fcp, ft = specified strengths in bending at extreme fibre, longitudinal shear, compression parallel to grain, compression perpendicular to grain, and tension parallel to grain
(2) Specified values are based on loads applied to the narrow face
Due to the large amount of lumber required to construct the NLT, the modulus of elasticity
(MOE) could not be individually determined and hence, the tabulated value in Table 1 was used
for analysis. As well, the wood used is not produced to be visually exposed and can therefore
contain degradations visible to the human eye.
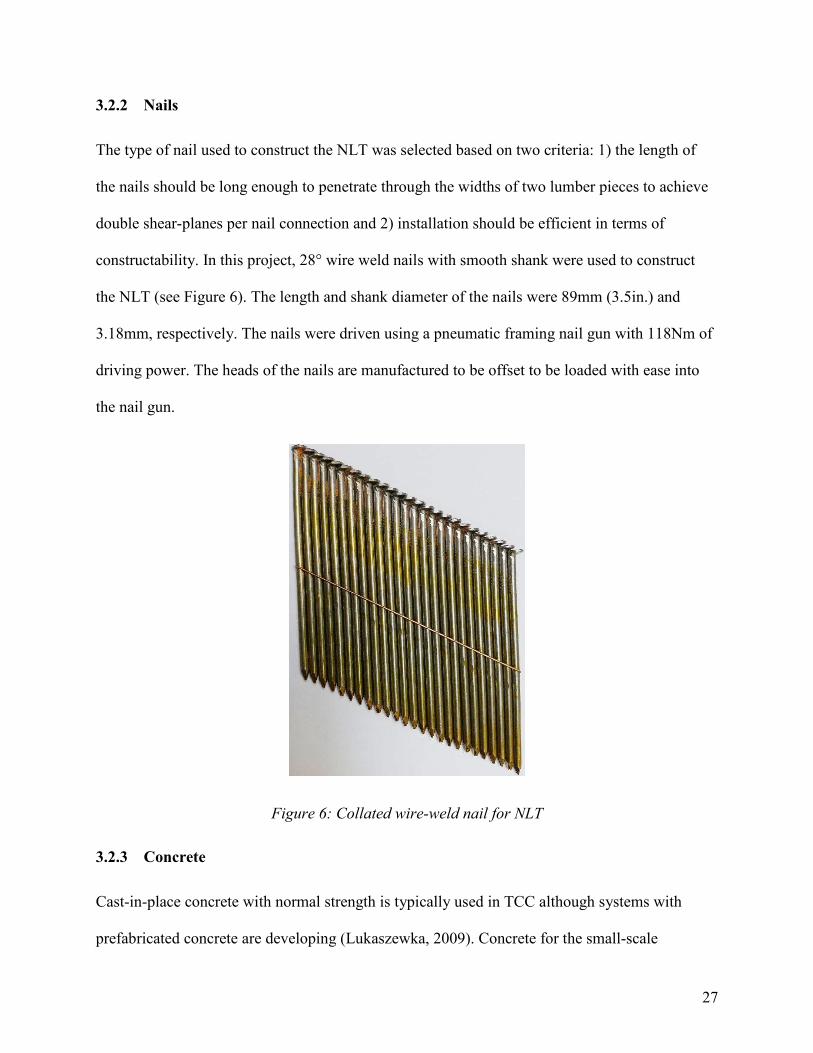
27
3.2.2 Nails
The type of nail used to construct the NLT was selected based on two criteria: 1) the length of
the nails should be long enough to penetrate through the widths of two lumber pieces to achieve
double shear-planes per nail connection and 2) installation should be efficient in terms of
constructability. In this project, 28° wire weld nails with smooth shank were used to construct
the NLT (see Figure 6). The length and shank diameter of the nails were 89mm (3.5in.) and
3.18mm, respectively. The nails were driven using a pneumatic framing nail gun with 118Nm of
driving power. The heads of the nails are manufactured to be offset to be loaded with ease into
the nail gun.
Figure 6: Collated wire-weld nail for NLT
3.2.3 Concrete
Cast-in-place concrete with normal strength is typically used in TCC although systems with
prefabricated concrete are developing (Lukaszewka, 2009). Concrete for the small-scale

28
specimens were prepared with a 1.0m3 batch of ready-mix concrete provided by a Rempel Bros.
Concrete. Concrete for the full-scale specimens and additional small-scale specimens were
prepared with a 4.0m3 batch of ready-mix concrete provided by Lafarge. The properties of the
concrete are summarized in Table 2.
Table 2: Concrete Properties
Supplier Provided f’c
(MPa) f’c based on cylinder
tests (MPa) Max aggregate
size (mm) Weight
Rempel Bros. 25 Unknown Unknown Normal
Lafarge 30 42.8(1) 19 Normal
(1) Based on 16 cylinder tests
3.2.4 Truss-plates
Metal truss-plates are intended for joint connections in wood trusses but have been investigated
as ductile shear connectors for TCC systems (Girhammer, 1984; Yeoh, 2010; Clouston and
Schreyer, 2011). Typically, truss-plate shear connectors were pressed onto the timber element to
align the teeth parallel to the grain. Thus, the strength of the individual connector can be
identified as the shear strength of the truss-plate parallel to the grain. Although the shear strength
can be higher at different angles to the grain, a reasonable concrete embedment depth can be
achieved in this arrangement.
The truss-plates used for shear connectors for the nail-laminated TCC specimens were supplied
by plate manufacturer Mitek Canada Inc. 20- and 16-gauge truss-plates, shown in Figure 7, were
selected for investigation being the thinnest and thickest plates available. The mechanical
properties of the investigated truss-plates are provided in Table 3. The allowable shear strengths

29
are provided by product evaluation reports for the 20-gauge truss-plate (CCMC 11996-L, 2009)
and the 16-gauge truss-plate (CCMC 10319-L, 2010).
Table 3: Truss-plate Properties
Truss-plate(1) Thickness (mm) Width (mm) Length (mm) Shear Resistance (2) (kN/mm)
MT20 5x10 0.9 127 254 0.10
MII16 5x10 1.6 127 254 0.14
MII16 5x17.5 1.6 127 444.5 0.14
MII16 7x12.5 1.6 177.8 317.5 0.14
MII16 7x17.5 1.6 177.8 444.5 0.14
(1) Denoted MT or MII[gauge thickness] [width in inches]x[length in inches] (2) Properties for teeth slots perpendicular to truss-plate length
all units in [mm]
Figure 7: MT20 (left) and MII16 (right) truss-plates

30
3.2.5 Self-Tapping Screws (STS)
The STS used in this research, as shown in Figure 8, are fully-threaded screws with cylindrical
heads provided by MyTiCon Timber Connectors Inc (ASSY VG CYL). Their relevant properties
are summarized in Table 4. The technical specifications of the screws are provided by the
Canadian production evaluation report (CCMC 13677-R, 2013).
Figure 8: Fully-threaded Cylindrical Head Self-tapping Screws
Table 4: Fully-threaded Cylindrical Head Self-Tapping Screw Properties
Length, L (mm)
Thread Length,
Lthread (mm)
Head Diameter, dhead (mm)
Threaded Diameter, d
(mm)
Withdrawal Strength per
20mm at 30°(1) (kN)
Withdrawal Strength per
20mm at 45°(1) (kN)
200 185 13.4 10 1.53 1.64
220 205 13.4 10 1.53 1.64
(1) Un-factored resistance values for SPF with mean oven-dry relative density of 0.42

31
3.2.6 Plastic Separation Layer
A plastic separation layer was placed between the timber and concrete elements as slip
membranes in all uninsulated small- and full-scale specimens. The layers prevented moisture
ingress into the timber elements during the concrete pouring procedure and minimized the
influence of friction between the two elements in determining the stiffness properties of the
connector. The layers were cut from rolls of clear 6mil polyethylene sheeting (0.15mm
thickness), a heavy-duty plastic material which is used commonly as vapour and moisture barrier
in construction applications.
3.2.7 Insulation
It is sometimes desirable to install an insulation layer into TCC floors to enhance the acoustic
performance. A rigid insulation layer between the timber and concrete elements can increase the
static moment arm between the two elements without adding significant weight. In this way, it is
possible to increase the stiffness of the panel and potentially the vibration performance provided
the shear connector can connect effectively through the insulation. In this project, 25mm thick
insulation panels are placed between the timber and concrete elements to small- and full-scale
specimens without a plastic separation layer. These panels are Foamular® C-200 extruded
polystyrene rigid insulation having a compressive strength of 140kPa according to the
manufacturers’ product data sheet 07 2113.13.OCC (Owens Corning, 2013).

32
3.3 Small-scale Shear Tests
3.3.1 Specimen Design
The small-scale specimens were designed with consideration of two factors: 1) the design
parameters should represent the practicality of the construction of nail-laminated TCC floors and
2) its geometry is such that the specimen can be tested using the available testing machine
without requiring bracing. An inclined geometry according to EN 408 (2012) was selected which
aligns the loading and reaction surfaces resulting in no rotational moment, thus eliminating the
need for out of plane bracing. The small-scale specimens were made of 2x6 lumber for the NLT
and 75mm thick concrete to maintain a manageable size for ease of handling, transport, and
mounting on to the testing machine.
For truss-plate shear connectors, the parameters investigated were its length, thickness, timber
embedment depth, and the addition of a 25mm layer of rigid insulation. For the STS shear
connectors, two different configurations were investigated: one aimed to utilize their full
capacity by installing at 30° and the other in a 45° cross-wised arrangement with a 25mm layer
of rigid insulation. The number of fasteners per specimen was determined based on spacing
requirements (CCMC 13677-R, 2013) to avoid group effects. A total of 10 series of small-scale
specimens, as summarized in Table 5 and Table 6, were fabricated and subsequently tested, each
one having a different shear connector layout. Details for the test specimen series are shown in
Figure 9 - Figure 18 with their respective series number and shear connector notation.

33
Table 5: Series of Truss-plate Connected Small-scale TCC Specimens
Series ID Truss-plate No. of Conn.
Embedment Depths (mm) Separation
Layer No.
Reps. Wood Concrete
5x10-20G MT20 5x10 2 76.2 50.8 S.M. 6
5x16-20G MT20 5x16 2 76.2 50.8 S.M. 5
5x10-16G MII16 5x10 2 76.2 50.8 S.M. 6
5x17.5-16G MII16 5x17.5 2 76.2 50.8 S.M. 6
7x17.5-16G MII16 7x12.5 2 127.0 50.8 S.M. 5
7x12.4-16G MII16 7x17.5 2 127.0 50.8 S.M. 6
7x12.5-16G_I MII16 7x12.5 2 76.2 50.8 INS. 6
7x17.5-16G_I MII16 7x17.5 2 76.2 50.8 INS. 5
Series ID denoted in truss-plate dimensions: [width in inches]x[length in inches]-[gauge thickness]_[I for insulation]
S.M. – indicates use of 6mil polyurethane sheeting material to minimize friction between wood and concrete and protect wood from moisture ingress during casting
INS. – indicates use of 25mm rigid insulation layer

34
Table 6: Series of STS Connected Small-scale TCC Specimens
Series ID Self-tapping
Screw No. of Conn.
Embedment Depths (mm) Screw
Angle Separation
Layer No.
Reps. Wood Concrete
STS-30 ASSY VG
CYL 10x200 4 150 70 30° S.M. 6
X-STS-45_I Cross-wised ASSY VG
CYL 10x220 4 120 44.3 45° INS. 5
ASSY VG CYL STS product dimensions given [threaded diameter in mm] x [length in mm]
S.M. – indicates use of 6mil polyurethane sheeting material to minimize friction between wood and concrete and protect wood from moisture ingress during casting
INS. – indicates use of 25mm rigid insulation layer
Figure 9: Series ID 5x10-20G

35
Figure 10: Series ID 5x16-20G
Figure 11: Series ID 5x10-16G

36
Figure 12: Series ID 5x17.5-16G
Figure 13: Series ID 7x12.5-16G

37
Figure 14: Series ID 7x17.5-16G
Figure 15: Series 7x12.5-16G_I

38
Figure 16: Series 7x17.5-16G_I
Figure 17: Series ID STS-30

39
Figure 18: Series ID X-STS-45_I
3.3.2 Specimen Fabrication
The small-scale specimens were fabricated in two stages. 24 specimens were fabricated in spring
2016 and 35 specimens were fabricated alongside the full-scale specimens in summer 2016.
Prefabrication of the specimens took place at the UBC Centre for Advanced Wood Processing
(CAWP) and at West Coast Home and Truss Ltd., a truss manufacturing plant in Surrey, BC.
The truss-plate connected small-scale specimens were fabricated following a general procedure:
(i) Cut 2x6 planks into NLT lamination pieces according to the dimensions and geometry as
shown in Figure 9 - Figure 18;
(ii) Attach the truss-plates to two of the lamination pieces per specimen to be held firm for
pressing;

40
(iii) Feed the pieces nailed with the truss-plates through the plate pressing machine minimum
two times to firmly press the plates;
(iv) Nail the laminates together using a pneumatic framing nail gun to assemble the NLT;
(v) Cut and install 6mil polyurethane sheeting material on the NLT face where concrete is to
be poured for uninsulated specimens (wood staples were adequate to attach the sheeting
material to the NLT);
(vi) Cut and install 25mm insulation layer on the NLT face where concrete is to be poured for
insulated specimens;
(vii) Build formwork out of 12.5mm thick plywood around the specimens for each series;
(viii) Pour concrete into the formwork, vibrate, level, finish and cover;
(ix) Take out of formwork after curing.
The lumber was cut by using a circular saw or by feeding it to an automated cut off and marking
saw to efficiently cut the skewed angle at the ends. Special care was taken not to hammer the
teeth of the truss-plates into the wood to have the force pressing the teeth be provided solely
from the plate pressing machine. All truss-plates were pressed under an automated roller
machine specifically designed to manufacture trusses.
The STS connected small-scale specimens followed a similar procedure where the connectors
were installed using jigs on the assembled NLT to ensure accurate installation at the angle and
spacing specified. All prefabricated specimens were then transported to CAWP to be casted and
cured outside until testing. Finally, the formwork was removed and the specimens were ready to
be tested. Photos of several specimens at various stages of fabrication are shown in Figure 19.

41
(a) (b)
(c) (d)
(e) (f)
Figure 19: Fabrication of Small-scale Specimens:a) truss-plate attached to cut lumber piece;
(b) truss-plate shear connector and NLT component with slip membrane; (c) truss-plate shear
connectors and NLT components with insulation; (d) STS shear connector and NLT component
with slip membrane; (e) concrete pouring onto small-scale specimens; (f) small-scale specimen
after removing formwork

42
3.3.3 Test Set-up and Instrumentation
The shear tests were performed at the UBC Structures Laboratory on a universal testing machine.
The specimens were mounted so that the load was applied to the concrete cross-sectional area on
top through a steel bearing plate. The NLT cross-sectional area on bottom was supported by
another steel bearing plate (see Figure 20). By setting the specimen up this way, the geometry
allows for the line of force to pass through the centre and the upper and lower bearing plates
produce a resultant force that is vertically aligned. No additional bracing for stability was
required in this set-up thus accommodating to the testing machine.
Figure 20: Shear Test Setup: Schematic (left) and Photo (right)
Two linear voltage displacement transducers (LVDTs) were instrumented on each side of the
specimens to measure the relative slip between the timber and concrete elements. Each LVDT
was fastened to the NLT through a thin block of wood using wood screws. The tip of the
LVDT’s probe shaft rested on a custom bracket that is clamped onto the concrete side without
being in contact with the timber element. In this way, the relative slip was measured directly

43
along the shear plane and related to the applied loads as recorded by a calibrated load cell. The
applied load and displacements were recorded real-time.
3.3.4 Test Procedure
The shear tests were conducted according to the loading protocol as stated in EN 26891 (CEN
1991). The loading protocol, see Figure 21, proceeds by initially preloading the specimen up to
40% of the estimated maximum load, unloading to 10% of the estimated maximum load before
reloading the connection to failure at a rate corresponding to 20% of the estimated failure load
per minute. The load is held for 30 seconds between each loading and unloading. The specimens
are initially preloaded to eliminate any friction in the connection and to ensure any inelastic slip
does not affect the performance of the connection. This procedure requires an estimate of the
maximum failure load. The first small-scale specimens of each series were tested until failure
without preloading and the peak load recorded was taken as the estimated maximum load. The
loading protocol was set to displacement controlled in order to capture the ductile characteristic
of the shear connectors. The applied load and displacement readings were recorded at a sampling
rate of 5Hz. The test was considered to have been completed once the applied fell to 80% of the
maximum load after reaching the maximum load which is assumed that the connector has failed.
Figure 21: Shear Test Loading Protocol
0
20
40
60
80
100
0 1 2 3 4 5 6 7 8 9 10
Forc
e (
kN
)
Time (min.)

44
3.3.5 Analysis Method
Load-displacement curves are plotted to understand the performance (strength and stiffness) and
to comparatively characterize the performance of the individual connectors. The strength of each
specimen is quantified as the maximum applied load recorded (Fult). The stiffness is quantified
by taking the slip modulus (secant slopes) at 4 different load levels: at 40%, 60%, 80%, and
100% of Fult denoted K0.4, K0.6, K0.8, and Kult respectively.
The strength and stiffness are averaged for each connection series. The average K0.4 is used as
the stiffness of the connection to determine the effective bending stiffness, EIeff, for SLS. The
average K0.8 is used as the stiffness of the connection to determine EIeff for ULS. The notations
are illustrated in a sample load-displacement curve in Figure 22.
Figure 22: Sample Load-Displacement Curve
The results of the connector series are graphically represented as piece-wise linear curves of the
non-linear behaviour. The piece-wise linear curves are produced with the averaged Fult and
averaged K0.4, K0.6, K0.8, and Kult for each connector series. For example, if Fult and K0.4 of a
series of a particular shear connector averaged out to 100kN and 100kN/mm respectively, the

45
displacement would be calculated as 0.4*Fult/K0.4 = (0.4*100kN / 100kN/mm) = 0.40 mm. An
example piece-wise linear curve is shown in Figure 23. Characteristic 5th percentile connector
strengths, Fk, were derived assuming a student-t distribution based on the number of tests
conducted for each test series.
The influence of truss-plate parameters and the presence of the insulation layer to the strength
and stiffness of the shear connector was checked for correlation. Linear regression was
performed to determine statistically quantify how significant the influence was by assigning the
strength and stiffness properties as the dependant variables and the parameters as the
independent variable. Results were deemed to be statistically significant when the probability of
the observed relationship (P-value) being a random error was less than 5% (i.e. α = 0.05).
Figure 23: Example of Averaged Piece-wise Linear Curve
-10
10
30
50
70
90
110
0.0 1.0 2.0 3.0 4.0 5.0 6.0
Load (
kN
)
Displacement (mm)
Load level
F (kN)
K (kN/mm)
∆ (mm)
0% 0 0 0
40% 40 100 0.4
60% 60 60 1.0
80% 80 45 1.8
100% 100 20 5.0

46
3.3.6 Results
3.3.6.1 Overview
The test results in terms of strength and stiffness properties as well as visual observations are
provided in this section. A summary of the average results is presented in section 3.3.6.2.
Calculated properties from each connection series along with the load-displacement curves along
with the failure modes observed are presented in sections 3.3.6.3 - 3.3.6.5. The relative influence
of the connection parameters in terms of statistical relevance are discussed in section 3.3.7.
Complete load-displacement curves including the inelastic slip are presented in Appendix A.
3.3.6.2 Strength and Stiffness
The average results are presented as relative strength and stiffness by zeroing the measured data
after the specimens have been preloaded. The measured data of some specimens resulted to be
outliers or did not follow the general trend in the load-displacement curves and were therefore
discarded when calculating the average results. Average strength and stiffness are illustrated in
the piece-wise linear curves shown in Figure 24 for all truss-plate connection series and Figure
25 for the STS connection series with respect to screw count.
The average and characteristic strengths are summarized in Table 8. The calculated stiffness at
each load level are summarized in Table 8. Results for the truss-plate connections are given as
specified in the small-scale configurations instead of per plate or per plate length.

47
Table 7: Estimated, Characteristic and Average Strength Results
Series ID. Fest (kN) Fult (kN) Fk (kN) Std.Dev. C.O.V. DOF No. of Reps(1)
5x10-20G 80.34 84.14 72.69 5.37 6% 4 6
5x16-20G 89.92 97.17 64.16 14.03 14% 3 5
5x10-16G 109.28 103.88 92.22 5.47 5% 4 6
5x17.5-16G 194.80 178.21 148.58 13.9 8% 4 6
7x12.5-16G 143.79 134.24 124.50 4.14 3% 3 5
7x17.5-16G 206.38 191.49 176.50 7.03 4% 4 6
7x12.5-16G_I 124.60 114.60 102.92 5.48 5% 4 6
7x17.5-16G_I 186.40 148.57 128.76 8.42 6% 3 5
STS-30 27.26(2) 23.61(2) 9.11(2) 6.8 29% 4 6
X-STS-45_I 7.76(3) 15.50(3) 11.57(3) 1.67 11% 3 5
(1) includes initial test for Fest; (2) per screw; (3) per screw pair
Figure 24: Truss-plate Shear Connections Average Results
0
20
40
60
80
100
120
140
160
180
200
0 2 4 6 8
Forc
e (k
N)
Displacement (mm)
Series
5x10-20G
5x16-20G
5x10-16G
5x17.5-16G
7x12.5-16G
7x17.5-16G
7x12.5-16G_Insul.
7x17.5-16G_Insul.

48
Table 8: Average Stiffness Results
Series ID K0.4 (kN/mm) K0.6 (kN/mm) K0.8 (kN/mm) Kult (kN/mm) No. of Reps(1)
5x10-20G 65.13 49.89 43.05 11.90 6
5x16-20G 96.53 77.68 66.38 25.54 5
5x10-16G 82.20 75.00 70.16 37.80 6
5x17.5-16G 140.33 114.95 93.01 40.19 6
7x17.5-16G 114.41 88.31 77.92 35.93 5
7x12.4-16G 136.40 113.99 94.75 47.01 6
7x12.5-16G_I 74.44 62.58 54.80 19.50 6
7x17.5-16G_I 100.04 79.88 63.78 28.14 5
STS-30 101.15(2) 75.10(2) 56.99(2) 40.71(2) 6
X-STS-45_I 40.16(3) 35.13(3) 30.38(3) 19.23(3) 5
(1) includes initial test for Fest; (2) per screw; (3) per screw pair
Figure 25: STS Shear Connections Average Results
0
5
10
15
20
25
0.0 0.2 0.4 0.6 0.8 1.0
Forc
e (k
N)
Displacement (mm)
Series
STS-30
X-STS-45_I
per screw
per screw pair

49
3.3.6.3 Truss-plate Shear Connections
Two truss-plates were installed to the NLT and embedded 50.8mm into the concrete. Two
different thicknesses and three different lengths of the plate, and two different timber embedment
depths were investigated. The sizes of the truss-plate were selected based on their availability.
The load-displacement curves from the individual tests and averaged results are plotted in Figure
26 - Figure 31, one figure for each connector.
The slip of the concrete layer along the shear plane (∆ in Figure 20) became apparent after the
connectors yielded (see Figure 32). This confirms that the specimen actually failed in the
connections. However, it was typical for specimens with truss-plates of larger dimensions to
exhibit concrete crushing followed by the shear slip. Cracks developed along the length of the
connector soon after the yield point or the ultimate load. The specimens were unreinforced in the
shear tests. The full-scale specimens, which were reinforced with a sheet of welded wire mesh,
showed no signs of significant cracks around the connectors (refer to section 3.4.7.5 for details).
Figure 26: Load-displacement Curves of Series ID 5x10-20G
0
20
40
60
80
100
0 2 4 6 8 10 12 14
Forc
e (k
N)
Displacement (mm)

50
Figure 27: Load-displacement Curves of Series ID 5x16-20G
Figure 28: Load-displacement Curves of Series ID 5x10-16G
0
20
40
60
80
100
120
0 2 4 6 8 10 12 14
Forc
e (k
N)
Displacement (mm)
0
20
40
60
80
100
120
0 1 2 3 4 5 6 7
Forc
e (k
N)
Displacement (mm)
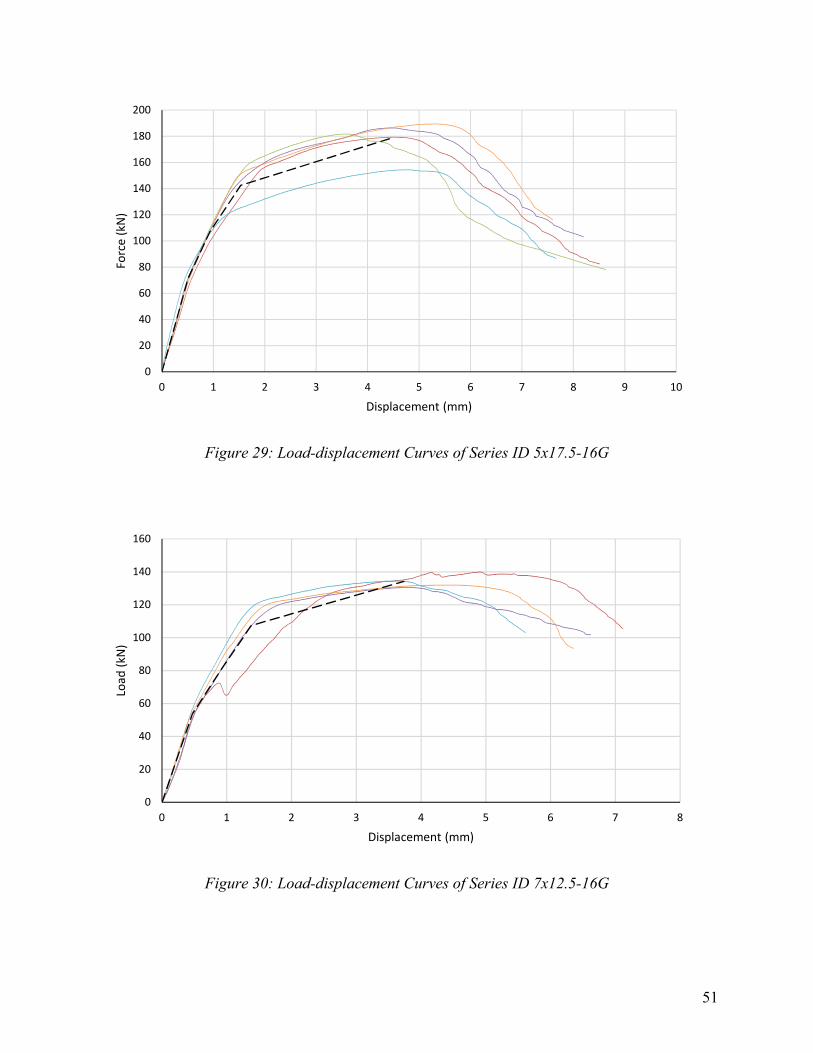
51
Figure 29: Load-displacement Curves of Series ID 5x17.5-16G
Figure 30: Load-displacement Curves of Series ID 7x12.5-16G
0
20
40
60
80
100
120
140
160
180
200
0 1 2 3 4 5 6 7 8 9 10
Forc
e (k
N)
Displacement (mm)
0
20
40
60
80
100
120
140
160
0 1 2 3 4 5 6 7 8
Load
(kN
)
Displacement (mm)

52
Figure 31: Load-displacement Curves of Series ID 7x17.5-16G
Figure 32: Examples of Shear Slips of Small-scale Specimens
0
20
40
60
80
100
120
140
160
180
200
0 2 4 6 8 10 12
Forc
e (k
N)
Displacement (mm)

53
3.3.6.4 Truss-plate Shear Connections with 25mm Insulation Layer
A 25mm layer of rigid insulation was placed between the timber and concrete in two series of the
truss-plate connections. Load-displacement for each test and average piece-wise linear curves are
presented in Figure 33 and Figure 34.
Typically, the truss-plates are fully braced against buckling by the wood and concrete; the
insulation, however, is unable to provide the same degree of lateral restraint making the
connector less stiff and less strong. To address this, the thickest truss-plates (MII16 - 1.6mm
thickness) were selected for the insulated series as advised by engineers from the plate
manufacturer. Consequently, the failure mode of concrete crushing resulted from using large
truss-plates in most specimens. The concrete layer was visually observed to be rotating out-of-
plane at the insulation layer immediately after the load was applied (see Figure 35). This was
also apparent from the LVDT readings showing displacements opposite to each other. Taking the
average of the two readings as the shear slips accounted for this phenomenon. The cause is likely
that the specimen size was too small to provide sufficient rigidity against rotation.

54
Figure 33: Load-displacement Curves of Series ID 7x12.5-16G_I
Figure 34: Load-displacement Curves of Series ID 7x17.5-16G_I
0
20
40
60
80
100
120
140
0 2 4 6 8 10 12
Forc
e (k
N)
Displacement (mm)
0
20
40
60
80
100
120
140
160
180
0 2 4 6 8 10 12 14
Forc
e (k
N)
Displacement (mm)

55
Figure 35: Out-of-plane Rotation (left) and Concrete Failure (right) of Small-scale Specimens
with Insulation
3.3.6.5 STS at 30° Shear Connections
Fully threaded ASSY VG CYL 10x220 screws were installed 150mm into the timber at 30° in
order to utilize the axial strength and stiffness of the connectors to the greatest degree possible
while still having a constructible connection. The screws were oriented to carry loads in tension
thereby the axial load in the screws create a clamping force equal to 50% of the axial load. Load-
displacement of each test and average piece-wise linear curves are presented in Figure 36.
At failure, shear slips between the concrete and timber were visually observed with no gap
between the two layers. The connection would most likely have failed in combination of tension
and screw withdrawal. No concrete bond failure is suspected seeing no cracks developed in the
concrete layer. Although the connection parameters were kept constant and the same failure
mode was observed in all specimens, a high variance resulted in the ultimate strengths possibly
due to the heterogeneity of the screw-embedded wood material.

56
Figure 36: Load-displacement Curves of Series ID STS-30 (per screw)
3.3.6.6 Pairs of STS at 45° Shear Connections with 25mm Insulation Layer
Pairs of ASSY VG CYL 10x200 screws were installed at 45° in a cross-wise arrangement
through a 25mm layer of rigid insulation and 120mm into the timber. The screws were arranged
cross-wised so that no additional compressive stresses would result from the component of the
axial load in the screws which would tend to crush the insulation. Each STS in a pair (one screw
each in tension and compression) was installed on separate laminations to avoid wood crushing.
Load-displacement of each test and average piece-wise linear curves are presented in Figure 37.
At failure, shear slips between the concrete and timber were visually observed. As well, concrete
cracks beginning to develop near the connectors and gaps between the insulation and timber
occasionally occurred (see Figure 38). The failure mode is unknown but a combination of screws
in tension, compression and loss of bond with the concrete can generally be assumed.
0
5
10
15
20
25
30
35
0 0.5 1 1.5 2 2.5
Forc
e (k
N)
Displacement (mm)

57
Figure 37: Load-displacement Curves of Series ID X-STS-45_I (per screw pair)
Figure 38: Gap Between Insulation and Timber (left) and Close-up of STS Failure (right)
0
5
10
15
20
0 0.5 1 1.5 2 2.5
Forc
e (k
N)
Displacement (mm)

58
3.3.7 Discussion
3.3.7.1 Overview
This section discusses the results obtained from the small-scale shear tests. Performance of the
truss-plate connections are first compared in section 3.3.7.2 and the influences of the connection
parameters plus providing the insulation layer are discussed in sections 3.3.7.2 - 3.3.7.6.
Performance of the STS connections are compared in section 3.3.7.7.
3.3.7.2 Comparison of Truss-plate Shear Connection Performance
With numerous truss-plate shear connections tested, designers are interested how their strength
and stiffness compare to one another to select the optimal size when designing TCC floor panels.
In this section, the characteristic strength Fk of the truss-plate shear connections are compared in
order evaluate its performance at ULS and the average stiffness K0.4 of the truss-plate shear
connections are compared in order to evaluate its performance at SLS. The comparison of the
strength is presented in Figure 39 where Fk of each connection is expressed as a percentage of
the strength and stiffness achieved for the strongest connection (7x17.5-16G). The comparison of
the stiffness is presented in Figure 40 where K0.4 of each connection is expressed as a percentage
of the stiffest connection (5x17.5-16G). This section is not intended to value-engineer shear
connections based on the sizes of the truss-plates but to provide an estimate of how much
strength and stiffness is reduced by reducing the size of the truss-plates.
Initially, it was assumed that the truss-plates with the larger dimensions or greater embedment
depths into the timber would be perform better in strength and stiffness. However, certain shear
connections with smaller sized truss-plates or timber embedment depths performed better in
strength and stiffness; a noteworthy point when selecting the truss-plate size for TCC shear

59
connectors. Three observations are made in the comparison: (i) the connection with the longer
20-gauge truss-plates resulted to be stiffer but less in strength by 5%; (ii) the maximum Fk
resulted from the connection with the largest dimensions but the maximum K04 resulted from
5x17.5-16G although the difference is only by 3%; and (iii) the insulated connections resulted in
lower strength and stiffness compared to their non-insulated counterparts.
Figure 39: Strength Comparison of Truss-plate Shear Connections
Figure 40: Stiffness Comparison of Truss-plate Shear Connections
100%84%
71%58% 58% 52%
41% 36%
0%16%
29%42% 42% 48%
59% 64%
0%
10%
20%
30%
40%
50%
60%
70%
80%
90%
100%
Stre
ngt
h R
atio
Connection Series ID
100% 97%82%
71% 69%59% 53% 46%
0% 3%18%
29% 31%41% 47% 54%
0%
10%
20%
30%
40%
50%
60%
70%
80%
90%
100%
Stre
ngt
h R
atio
Connection Series ID

60
3.3.7.3 Influence of Truss-plate Thickness
The influence the thickness of the truss-plate has on the strength and stiffness of the shear
connections were investigated by comparing two different thicknesses (t = 1.3mm and 1.6mm)
while keeping all other parameters constant. The regression results are shown in Table 9 and the
average results are compared in Figure 41.
Table 9: Influence of Truss-plate Thickness
Dependant Variable
Correlation Coefficient, R
R2 Slope P-value DOF
Fult (kN) 0.898 0.806 65.779 0.000
9
K0.4 (kN/mm) 0.733 0.538 56.908 0.015
K0.6 (kN/mm) 0.784 0.615 83.727 0.007
K0.8 (kN/mm) 0.792 0.627 90.359 0.006
Kult (kN/mm) 0.781 0.609 86.330 0.008
*P-values > 0.05 indicate results are not statistically significant
Figure 41: Comparison of Truss-plate Thickness
0
20
40
60
80
100
120
0 1 2 3 4 5 6 7 8
Forc
e (k
N)
Displacement (mm)
Series
5x10-20G
5x10-16G
t = 1.6mm (16-gauge)
t = 1.2mm (20-gauge)

61
The specimens with thicker truss-plates statistically proved to achieve higher strength and
stiffness. This agrees with findings from CCMC evaluation reports (2009; 2010) which specify
higher shear strengths for MII16 truss-plates (t = 1.6mm) compared to the MT20 truss-plates (t =
1.2mm) when the teeth slots are oriented perpendicular to grain in a truss connection. Despite the
disadvantage in materials cost, the 1.6mm thick truss-plates offer favourable properties as TCC
shear connectors. However, the load-displacement curves show that those specimens experienced
less shear deformation compared to the ones with thinner truss-plates. It is expected that the
thickness of the truss-plates is associated to its plasticity where increased thickness correlates to
increased strength and stiffness and decreased thickness results in more ductile behaviour.
3.3.7.4 Influence of Truss-plate Length
The influence the length of the truss-plate has on the strength and stiffness of the shear
connections were investigated by comparing two different lengths while keeping all other
parameters constant. The statistical results are summarized in Table 10 - Table 13 and average
results are compared in Figure 42 - Figure 45.
Table 10: Influence of MT20 Truss-plate Length
Dependant Variable
Correlation Coefficient, R
R2 Slope P-value DOF
Fult (kN) 0.590 0.348 0.085 0.094*
8
K0.4 (kN/mm) 0.735 0.541 0.206 0.024
K0.6 (kN/mm) 0.815 0.665 0.182 0.007
K0.8 (kN/mm) 0.888 0.789 0.153 0.001
Kult (kN/mm) 0.983 0.996 0.083 0.000
*P-values > 0.05 indicate results are not statistically significant

62
Figure 42: Comparison of MT20 Truss-plate Lengths
The 152.4mm increase in length of the MT20 truss-plates (t = 1.2mm) has a favourable effect on
the stiffness properties and no statistically significant increase was observed in the strength. With
the ultimate stiffness influenced, the truss-plates exhibited different shear deformations at their
ultimate loads. The reason for the lack of influence in the strength is unclear. With no concrete
failure observed, a possible speculation is that there was little influence in the anchorage strength
of the plates’ teeth and resulted to fail in similar ultimate load.
0
10
20
30
40
50
60
70
80
90
100
0 1 2 3 4 5 6 7 8
Forc
e (k
N)
Displacement (mm)
Series
5x10-20G
5x16-20G
l = 254mm (10in.)
l = 406.4mm (16in.)

63
Table 11: Influence of MII16 Truss-plate Length with 76.2mm Timber Embedment Depth
Dependant Variable
Correlation Coefficient, R
R2 Slope P-value DOF
Fult (kN) 0.970 0.940 0.390 0.000
9
K0.4 (kN/mm) 0.914 0.835 0.305 0.000
K0.6 (kN/mm) 0.914 0.834 0.210 0.000
K0.8 (kN/mm) 0.744 0.554 0.120 0.014
Kult (kN/mm) 0.106 0.011 0.013 0.771*
*P-values > 0.05 indicate results are not statistically significant
Figure 43: Comparison of MII16 Truss-plate Lengths with 76.2mm Timber Embedment Depth
The 190.5mm increase in length of the MII16 truss-plates (t = 1.6mm) embedded 76.2mm deep
into the timber proved to be statistically significant to increase the ultimate strength and stiffness
with the exception of stiffness at the ULS level. A possible reason for this is that the truss-plates
are expected behave in a similar ductile manner once yielded. Note that the connection with
0
20
40
60
80
100
120
140
160
180
0 1 2 3 4 5
Forc
e (k
N)
Displacement (mm)
Series
5x10-16G
5x17.5-16G
l = 254mm (10in.)
l = 444.5mm (17.5in.)

64
higher strength results the shear deformation to be greater because of the stiffness at ULS level
being uninfluenced from the increase in length.
Table 12: Influence of MII16 Truss-plate Length with 101.6mm Timber Embedment Depth
Dependant Variable
Correlation Coefficient, R
R2 Slope P-value DOF
Fult (kN) 0.983 0.967 0.451 0.000
8
K0.4 (kN/mm) 0.755 0.570 0.173 0.018
K0.6 (kN/mm) 0.687 0.472 0.210 0.041
K0.8 (kN/mm) 0.529 0.280 0.133 0.143*
Kult (kN/mm) 0.543 0.295 0.088 0.131*
*P-values > 0.05 indicate results are not statistically significant
Figure 44: Comparison of MII16 Truss-plate Lengths with 101.6mm Timber Embedment Depth
0
20
40
60
80
100
120
140
160
180
200
0 1 2 3 4 5
Forc
e (k
N)
Displacement (mm)
Series
7x12.5-16G
7x17.5-16G
l = 444.5mm (17.5in.)
l = 317.4mm (12.5in.)

65
The 127mm increase in length of the MII16 truss-plates (t = 1.6mm) embedded 101.6mm deep
into the timber proved to be statistically significant to increase the ultimate strength and the
stiffness under serviceability condition, however, became less significant at higher load levels. A
possible reason for this is that as the truss-plates reaches up to the yield point, they are expected
to behave in similar ductile manner and almost identical after yielding.
Table 13: Influence of MII16 Truss-plate Length through 25mm Insulation Layer
Dependant Variable
Correlation Coefficient, R
R2 Slope P-value DOF
Fult (kN) 0.940 0.884 3.305 0.001
7
K0.4 (kN/mm) 0.590 0.348 0.202 0.124*
K0.6 (kN/mm) 0.424 0.180 0.136 0.295*
K0.8 (kN/mm) 0.258 0.067 0.071 0.537*
Kult (kN/mm) 0.780 0.608 0.068 0.022
*P-values > 0.05 indicate results are not statistically significant
Figure 45: Comparison of Truss-plate Lengths through 25mm Insulation Layer
0
20
40
60
80
100
120
140
160
0 1 2 3 4 5 6 7
Forc
e (k
N)
Displacement (mm)
Series
7x12.5-16G_I
7x17.5-16G_I
l = 444.5mm (17.5in.)
l = 317.4mm (12.5in.)

66
The 127mm increase in length of the MII16 truss-plates (t = 1.6mm) through 25mm insulation
layer proved to be statistically significant to increase the strength and the stiffness at ULS but not
influential to the stiffness for the load levels in between. The insulation layer is assumed to
provide no resistance in the connection. With the 25mm gap between the timber and concrete,
there is less bearing effect from the timber and concrete on the truss-plates and the stiffness is
then most likely depended on the material property of the truss-plates instead of the length; a
possible speculation for the stiffness being uninfluenced. Once the truss-plates have yielded, the
teeth-to-wood and concrete bearing is then likely to come into effect and the increased length
would be influential to its stiffness.
3.3.7.5 Influence of Timber Embedment Depths
The influence of how much the truss-plates are embedded into the timber are investigated to the
strength and stiffness of the connections by comparing two different embedment depths (76.2mm
and 101.4mm) while keeping all other parameters constant. The regression results are shown in
Table 14 and the average results are compared in Figure 46.
Table 14: Influence Timber Embedment Depths of the Truss-plates
Dependant Variable
Correlation Coefficient, R
R2 Slope P-value DOF
Fult (kN) 0.560 0.312 0.523 0.093*
9
K0.4 (kN/mm) 0.146 0.021 -0.155 0.687*
K0.6 (kN/mm) 0.002 0.000 0.001 0.996*
K0.8 (kN/mm) 0.087 0.008 0.069 0.812*
Kult (kN/mm) 0.446 0.199 0.268 0.197*
*P-values > 0.05 indicate results are not statistically significant

67
Figure 46: Comparison of Timber Embedment Depths of Truss-plates
The 25.4mm difference in the timber embedment depth of the truss-plates proved to have no
statistically significant influence in the strength and stiffness of the shear connection. The results
show that the performance of the shear connection does not depend on the number of teeth
pressed into the timber. Designers can take this into consideration in designing TCC floors as the
cost of the truss-plates typically increases with increased width.
3.3.7.6 Influence of Insulation Layer on Truss-plate Shear Connections
The influence the 25mm layer of insulation placed in between the concrete and timber has on the
strength and stiffness of the shear connectors was investigated. Plate embedment depths of
50.8mm into the concrete and 76.2mm into the timber were maintained in specimens with 25mm
layer of insulation by using truss-plates that are 177.8mm (7 in.) wide. Sections 3.3.7.4 and
3.3.7.5 states that the length of the truss-plate has statistically significant influence on the
strength and stiffness but the timber embedment depth do not. Therefore, regression analyses
0
20
40
60
80
100
120
140
160
180
200
0 1 2 3 4 5
Forc
e (k
N)
Displacement (mm)
Series
5x17.5-16G
7x17.5-16G
dembed_timber = 101.6mm
dembed_timber = 76.2mm

68
were performed by keeping the length constant but not necessarily the timber embedment depths.
Statistical results are shown in Table 15 and Table 16 and the average results are compared in
Figure 47 and Figure 48.
Table 15: Influence of Insulation Layer (MII16 Truss-plates 317.5mm Length)
Dependant Variable
Correlation Coefficient, R
R2 Slope P-value DOF
Fult (kN) 0.919 0.845 -19.640 0.001
7
K0.4 (kN/mm) 0.799 0.639 -39.977 0.017
K0.6 (kN/mm) 0.526 0.277 -25.725 0.180*
K0.8 (kN/mm) 0.520 0.270 -23.127 0.187*
Kult (kN/mm) 0.746 0.557 -16.435 0.033
*P-values > 0.05 indicate results are not statistically significant Note: Specimens with insulation were assigned 1 and specimens without were assigned 0
Figure 47: Comparison of Insulated Connections 317.4mm Long MII16 Truss-plates
0
20
40
60
80
100
120
140
0 1 2 3 4 5 6
Forc
e (k
N)
Displacement (mm)
Series
7x12.5-16G
7x12.5-16G_I
dembed_timber = 76.2mm
dembed_timber = 101.6mm

69
Table 16: Influence of Insulation Layer (MII16 Truss-plates 444.5mm Length)
Dependant Variable
Correlation Coefficient, R
R2 Slope P-value DOF
Fult (kN) 0.836 0.698 -36.281 0.000
13
K0.4 (kN/mm) 0.782 0.611 -38.322 0.001
K0.6 (kN/mm) 0.845 0.714 -35.096 0.000
K0.8 (kN/mm) 0.824 0.679 -30.108 0.000
Kult (kN/mm) 0.722 0.521 -15.461 0.004
*P-values > 0.05 indicate results are not statistically significant Note: Specimens with insulation were assigned 1 and specimens without were assigned 0
Figure 48: Comparison of Insulated Connections with 444.5mm Long MII16 Truss-plates
The addition of the 25mm layer of insulation between the concrete and timber shows a
statistically significant influence to decrease the strength and stiffness of the shear connection
than without the insulation. This is expected because the insulation layer is assumed to provide
0
20
40
60
80
100
120
140
160
180
200
0 1 2 3 4 5 6
Forc
e (k
N)
Displacement (mm)
Series
5x17.5-16G
7x17.5-16G
7x17.5-16G_I
dembed_timber = 76.2mm
dembed_timber = 101.6mm
dembed_timber = 76.2mm 25mm insulation

70
no resistance in the connection. It is likely that the bearing effect from are not engaged within the
25mm layer and the teeth embedded into the timber and concrete are holding the truss-plates,
deforming at the 25mm gap, until they reach their yield points. Without the insulation, the
bearing effect of the teeth from both materials is assumed to be engaged immediately after
preloading.
3.3.7.7 Comparison of the STS Configurations
The coefficient of variations exceeded 10% for the STS shear connections (see Appendix A);
hence, the average ultimate strength Fult of the STS shear connections are compared instead to
evaluate its performance at ULS and the average stiffness K0.4 of the STS shear connections are
compared in order to evaluate its performance at SLS. The comparison of the strength is
presented in Figure 49 where Fult of each connection is expressed as a percentage of the strength
and stiffness achieved for the strongest connection. The comparison of the stiffness is presented
in Figure 49 and Figure 50 where K0.4 of each connection is expressed as a percentage of the
stiffest connection.
The STS-30 connections significantly bear greater strength and stiffness than X-STS-45_I. Its
attributing factors are a screw embedment depth 30mm greater and screw angle 15° closer to the
wood grain. Despite the cross-wise configuration, the insulation layer is suspected as the main
reason for the X-STS-45_I connections’ weak performance. Further investigation is required
with better prediction and less variation to evaluate the performance of STS shear connections in
nail-laminated TCC.

71
Figure 49: Strength Comparison of STS Shear Connections
Figure 50: Strength Comparison of STS Shear Connections
100%
66%
0%
34%
0%
10%
20%
30%
40%
50%
60%
70%
80%
90%
100%
STS-30 X-STS-45_I
Stre
ngt
h R
atio
(%
)
Connection Series ID
100%
40%
0%
60%
0%
10%
20%
30%
40%
50%
60%
70%
80%
90%
100%
STS-30 X-STS-45_I
Stif
fne
ss R
atio
(%
)
Connection Series ID

72
3.4 Full-scale Bending and Vibration Tests
3.4.1 Shear Connectors
The bending and vibrational behaviours of four different truss-plate TCC shear connectors
selected from the small-scale shear tests were investigated. Each connector has a different
parameter of interest to represent all truss-plate shear connectors tested at the small-scale. The
influence of a layer of rigid insulation was also investigated. The STS shear connectors were not
investigated in the full-scale tests due to budgetary constraints. The selected shear connectors for
each panel series are summarized in Table 17.
Table 17: Selected TCC Shear Connector for Full-Scale Tests
Series ID No. of Reps.
Shear Conn. Interlayer Reason for Selection
S1 2 MT20 5x10 S.M. To represent the lower bound performance of nail-laminated TCCs.
S2 2 MII16 5x10 S.M. To determine the influence of 16-gauge truss-plates compared to 20-gauge truss-plates.
S3 2 MII16 5x17.5 S.M. To determine the influence of 444.5mm plate length compared to the 254mm plate length.
S4 2 MII16 7x17.5 INS.
To determine the influence of the 25mm layer of insulation for the 444.5mm long plates compared to no insulation.
S.M. – indicates use of 6mil polyurethane sheeting material to minimize friction between wood and concrete and protect wood from moisture ingress during casting
INS. – indicates use of 25mm rigid insulation layer

73
3.4.2 Panel Design
Full-scale nail-laminated TCC panels were designed using the �-method with the same material
specifications, nail spacings and embedment depths from the small-scale shear tests (refer to
Section 3.3.1) except the edge spacing of the nails of the NLT which increased from 25.4mm to
38mm. Figure 51 shows the nailing configuration of the NLT.
Figure 51: NLT nailing detail [mm]
The stiffness of the shear connectors K0.4 and K0.8 determined from the small-scale shear tests
were used in the �-method for SLS and ULS analyses respectively. The panels were designed to
be acceptable within the l/360 criteria in deflection due to four-point bending at service level.
Service level is defined as the applied load causing the same bending moment as would be
obtained from a 4.8kPa uniformly distributed load. As is the case for most experimental testing,
no load combination or material reduction factors were applied to determine the actual behaviour
of the panel. Example calculations of the �-method and SLS and ULS design checks are
provided in Appendix B.
Each nail-laminated TCC panel consists of a NLT panel made of 2x6 lumber planks 6.1m in
length, an interlayer of either 6mil polyurethane slip membrane or 25mm rigid insulation, and
75mm thick welded-wire reinforced cast-in-place concrete slab. The compressive strength of the
concrete was specified according to CSA A23.3. The dimensions of the panels ensured an

74
adequate span length and maintained a manageable size for transportation and ease of test set-up.
Configurations of the shear connectors for each panel series is summarized in Table 18.
The parameters h1, h2 and hi refer to concrete, timber and interlayer thickness respectively. The
parameters s1 and s2 refer to the spacings of the connectors in high and low shear zones of the
panel respectively while se is the spacing from the connector to the panel ends. ‘Rows’ refers to
the number of rows of connectors across the width of the panel. Note that each row consists of
two rows of truss-plates because two truss-plates is considered as one shear connector from
Phase 1. The individual drawings for each panel series (2 replicates per series) are shown in
Figure 52 - Figure 60.
Table 18: Full-Scale Panel Configurations
Series ID
Shear Connector
h1 (mm)
h2 (mm)
hi
(mm) s1
(mm) s2
(mm) se
(mm) Rows
S1 MT 20 5x10 75 140 - 500 1150 400 3
S2 MII 16 5x10 75 140 - 500 1150 400 3
S3 MII 16 5x17.5 75 140 - 1000 1450 600 3
S4 MII 16 7x17.5 75 140 25 1000 1450 600 3
Figure 52: Layout of MT20 5x10 and MII16 5x10 truss-plate shear connectors (S1 & S2)

75
Figure 53: Section A-A' (127mm x254mm truss-plate)
Figure 54: Detail A (127mm x254mm truss-plate)
Figure 55: Layout of MII16 5x17.5 truss-plate shear connectors (S3)

76
Figure 56: Section B-B' (127mm x 444.5mm truss-plate)
Figure 57: Detail B (127mm x 444.5mm truss-plate)
Figure 58: Layout of MII16 7x17.5 truss-plate shear connectors (S4)

77
Figure 59: Section C-C' (127mm x 444.5mm truss-plate)
Figure 60: Detail C (177.8mm x 444.5mm truss-plate)
3.4.3 Panel Fabrication
The full-scale panels were prefabricated at West Coast Home and Truss Ltd. in Surrey, BC. The
panels were then transported to CAWP for casting. A procedure was followed for the
prefabrication of each specimen.
(i) Mark layout of connector locations on six 2x6 planks (6 rows of uniform spacing at panel
end regions and one connector in mid-span)
(ii) Lightly nail truss-plates onto marked 2x6 planks to be held firm for pressing
(iii) Feed the planks nailed with truss-plates into the plate pressing machine minimum two
times to firmly press the plates

78
(iv) Align planks using clamp and wood screws to prepare for nailing (unclamped and
unscrewed after nailing)
(v) Mark layout of nail locations on the edge surface of the aligned plank
(vi) Nail the planks together using a pneumatic framing nail gun to assemble the NLT
(vii) Install 6mil polyurethane sheeting material on the NLT face as slip membranes for the
uninsulated specimens (wood staples were adequate to attach the sheeting material to the
NLT)
(viii) Install 25mm insulation layer on the NLT face where concrete is to be poured for
insulated specimens (insulation panels were cut to fit in between the connectors)
(ix) Build formwork out of 12.5mm thick plywood around panel
(x) Cut and install welded wire mesh reinforcing using chairs centered in concrete depth
Photos of the specimens at various stages of fabrication are shown in Figure 61 - Figure 64. All
panels were laid out on tarps at the CAWP courtyard for sequential casting with a ready-mix
concrete truck. As panels were poured, the concrete was evenly vibrated, leveled, finished and
covered. The TCC panels were left to cure for a minimum 28 days. 16 test cylinders were also
poured at the time of casting and left on the same site to cure. All panels and cylinders were
covered in tarps for protection against rainfall. It should be noted that the actual width of the
panels came out to be greater than the total widths of the laminates used to construct the NLT
possibly due to the construction method or the truss-plate thickness. Width measurements were
taken at least five points along the panels’ lengths and a conservative average of 750mm was
taken as the width of the panels in the �-method calculations.

79
Figure 61: Installation of truss-plate shear connectors
Figure 62: Fabrication of NLT
Figure 63: Installation of insulation and formwork
Figure 64: Concrete casting

80
3.4.4 Test Set-up and Instrumentation
The panels were tested for their vibrational behaviour under impact excitation (dynamic test) and
strength and stiffness under four-point bending (bending test). The panels spanned 5.8m between
two roller supports to truly simulate simply supported condition. For the dynamic test, a digital
accelerometer was set at the center of the panel to measure the vertical acceleration from
dynamic excitation.
For the bending test, load was applied at the third points along the panel through a spreader beam
which was pin connected to a 250kN hydraulic actuator in a steel reaction frame. The loads were
spread evenly across the width of the panel using HSS steel tubes. Roller bearings were located
at the loading points between the spreader beam and HSS steel tubes ensuring that the specimens
were entirely unrestrained by the test apparatus. A schematic of the complete test apparatus is
shown in Figure 65 and a photo of one mounted test specimen in Figure 66.
Loads were recorded using a calibrated load cell while vertical displacements were measured
using two LVDTs at the mid-span for the stiffness test. Four additional LVDTs were installed to
measure the relative slip between the concrete and timber at each of the four corners directly
over the supports.

81
Figure 65: Test Setup and Instrumentation Schematic
Figure 66: Photo of Test Setup and Instrumentation

82
3.4.5 Test Procedure
For each panel, the full-scale test started by performing the vibration test followed by the four-
point bending test. The dynamic tests were performed by applying a light impact (heel-strike or
2.5kg hammer impact) at the mid-span of the panel while the acceleration time-history was
monitored using a digital accelerometer.
The bending test procedure for the full-scale specimens was adapted from EN 26891 (CEN
1991) and the test procedure for the small-scale shear tests. TTC connectors show varying
degrees of initial inelastic displacement upon first loading that are not effectively present during
service in floor structures. To minimize its effect on the bending stiffness of the panel, a
preloading sequence to the panel was incorporated into the loading protocol to quantify the level
of inelastic deflection (denoted as ∆i in Table 20). The loading protocol started by preloading the
panel to its service level (previously defined as the actuator load causing the same bending
moment as would be obtained form a 4.8kPa uniformly distributed load), held for 30 seconds,
then unload to zero displacement at the mid-span, and held for 30 seconds a total of two times
before loading the panel to failure. This loading protocol, depicted in Figure 67, was further
adapted by converting from a load-controlled to displacement-controlled protocol at a constant
loading and unloading rate of 6mm/min.

83
Figure 67: Full-scale loading protocol
3.4.6 Analysis Methods
The parameter of interest from the full-scale vibration tests is the fundamental natural frequency
of each panel. The dynamic properties of each full-scale panel were predicted based on the
established methods of mechanics (Chopra, 2012) using the effective bending stiffness
determined by the �-method:
Generalized modal mass: ���� = ����
�
2 (5)
Generalized stiffness: ���� =�������
2�� (6)
Fundamental natural frequency: �� =1
2���
����
����� (7)
where mTCC = mass of the panel per unit length, l = span length, and EIeff = effective bending
stiffness.
0 1 2 3 4 5 6 7 8
Load
(kN
)
Time (min.)
Service Load Level

84
The fundamental natural frequencies were estimated from plots of the Fast Fourier
Transformation (FFT) of the recorded accelerations. The following complex number calculations
of the FFT was performed in MATLAB® R2015a (2015):
FFT: �(�) = � �(�)��(���)(���)
�
���
(8)
where �� = �(����)/� (9)
Y and X implement the Fourier transform (i.e. frequency domain representation) and inverse
Fourier transform (i.e. acceleration), of length n respectively. The power spectral density can
then be obtained by multiplying Y with its complex conjugate. A sample acceleration time-
history and discrete Fourier transform plot is shown in Figure 68. From the plot, the fundamental
natural frequency is determined from the frequency domain with the maximum power spectral
density.
Figure 68: Acceleration time-history plot (left) and discrete FFT plot (right)
-0.08
-0.06
-0.04
-0.02
0
0.02
0.04
0.06
0.08
0 1 2 3 4 5
Acc
eler
atin
on
(g)
Time (s)
8 9 10 11 12
Po
wer
Sp
ectr
al D
ensi
ty
Frequency (Hz)

85
The parameter of interest from the full-scale bending tests are the effective bending stiffness and
the bending moment capacity of each panel. The beam diagram in Figure 69 shows the variables
used to calculate the parameters used in the following equations:
Load: � =
������
2 (10)
Panel stiffness: � =
�
∆������� (11)
Effective bending stiffness: ����� =
��
24(3�� − 4��) (12)
Maximum bending moment
per unit width: � =
��
� (13)
where b is the panel width in metres.
Figure 69: Four-point bending beam diagram

86
3.4.7 Results and Discussions
3.4.7.1 Overview
The results are presented in sections 3.4.7.2 - 3.4.7.5. The vibration results are discussed first
since the dynamic tests were conducted prior to the bending tests. From the bending tests, the
properties of the panels investigated are the effective bending stiffness at service load level and
the bending capacity to evaluate their structural performance at SLS and ULS respectively. The
different failure modes are also discussed.
3.4.7.2 Vibration Properties
The fundamental natural frequency of each panel type was predicted by applying EIeff obtained
from the �-method into Equation (6). Additionally, the fundamental natural frequency of each
tested panel was estimated by applying the measured EIeff calculated using Equation (12) into
Equation (6). The acceleration time-history of each panel subjected to an impact load at mid-
span was recorded and the fundamental natural frequency was obtained according to the method
described in Section 3.4.6. The vibration results are summarized in Table 19.
In most cases, the �-method and measured EIeff predictions underestimated the fundamental
natural frequency of the TCC panels by a small margin of error. This was shown to be the case
since the EIeff obtained from the bending tests resulted to be greater than predicted. All panels
exhibited a fundamental natural frequency above 8.0 Hz which is acknowledged as the
susceptible range of human induced vibration (Ohlsson, 1998). The significant mass of the
panels is shown to limit the motion perceived by the occupants.
Table 19: Vibration Test Results

87
Series ID Replicate
Fundamental Natural Frequency (Hz)
FFT Measured
����� Difference
�-method �����
Difference
S1 1 10.38 10.09 3%
9.43 9%
2 10.13 10.03 1% 7%
S2 1 10.25 10.19 1%
9.65 6%
2 10.13 9.87 3% 5%
S3 1 10.25 9.89 4%
10.17 1%
2 10.38 10.48 -1% 2%
S4 1 11.96 12.06 -1%
11.60 3%
2 11.23 11.89 -6% -3%
3.4.7.3 Bending Stiffness
Each of the full-scale specimen was subjected to multiple loadings up to service level as
described in section 3.4.5, from which the effective bending stiffness was calculated according to
Equation (10). The deflections and effective bending stiffness obtained from the test results and
the �-method predictions are compared in Table 20 along with the inelastic deformations, ∆i,
which remained after the initial loadings. Load-displacement curves up to service level are
plotted for each of the four test series in Figure 70 to Figure 73. The load shown is the total load
applied Ptotal. The average mid-span displacements are shown as relative displacements by being
subtracted from the inelastic displacement.
In most cases, the analytical predictions underestimated the effective bending stiffness and
consequently overestimated the mid-span deflection at service load level. The deviations can be

88
due to several factors and identifying the cause is difficult especially for composite structures. In
this case, the MOE of the timber used to predict could have been underestimated. Another
possible cause is that the small-scale shear test method may have measured inaccurate stiffness.
The results are favourable for TCC floors with less deflections exhibited and the panel being
stiffer than predicted in most cases. That is to say the �-method provided conservative
predictions. At SLS, the rigid insulation layer demonstrated to be more desirable with
significantly less mid-span deflection and higher bending stiffness (23% higher) than without
because of the increased static moment arm between the timber and concrete.
Table 20: Deflection and Effective Stiffness
Series Replicate
Measurements �-method Predictions
∆i (mm) �����
(1012 Nmm2)
�����
(1012 Nmm2) Difference
S1 1 1.91 8.37
7.31 13%
2 2.26 8.26 11%
S2 1 2.07 8.53
7.66 10%
2 3.36 8.00 4%
S3 1 3.11 8.04
8.50 -6%
2 0.80 9.03 6%
S4 1 1.37 11.95
11.06 7%
2 1.08 11.16 5%

89
Figure 70: Load vs. displacement of series S1 up to service level
Figure 71: Load vs. displacement of series S2 up to service level
0
5
10
15
20
25
30
0 2 4 6 8 10 12 14
Load
(kN
)
Displacement (mm)
Service Load Limit
Replicate 1
Replicate 2
Prediction (γ-method)
0
5
10
15
20
25
30
0 2 4 6 8 10 12 14
Load
(kN
)
Displacement (mm)
Service Load Limit
Replicate 1
Replicate 2
Prediction (γ-method)

90
Figure 72: Load vs. displacement of series S3 up to service level
Figure 73: Load vs. displacement of series S4 up to service level
0
5
10
15
20
25
30
0 2 4 6 8 10 12 14
Load
(kN
)
Displacement (mm)
Service Load Limit
Series2
Series3
Prediction (γ-method)
0
5
10
15
20
25
30
0 2 4 6 8 10 12 14
Load
(kN
)
Displacement (mm)
Service Load Limit
Series1
Series2
Prediction (γ-method)

91
3.4.7.4 Panel Capacity
Each panel was loaded to failure following the initial loadings according to the procedure
described in Section 3.4.5. The total maximum load Pmax was recorded and the bending moment
capacity Mmax was calculated according to Equation (13). The capacities of the panels were
predicted using the �-method by incrementing the applied load with a scale factor until a failure
in one of the TCC component was detected. The predicted and observed failure modes are
discussed in section 3.4.7.5. The experimental results and the predictions are compared in Table
21 by calculating the global factor of safety which is the measurement-to-prediction ratio of the
capacities. The load-displacement curves for each series are shown in Figure 74 to Figure 77.
The load shown is the total load applied Ptotal. The average mid-span displacements are shown as
relative displacements by being subtracted from the inelastic displacement.
Failure of the panels did not occur until loading at least 5 - 7 times the serviceability
requirements ensuring confidence in its structural integrity in SLS. Evidently, the �-method
under-predicted the capacities. All experimental load capacities were approximately 2 - 4 times
its predictions which were indicated by the detection of the failures in the shear connectors for
series S1-S3 and the NLT for series S4. Such deviation is likely due to underestimating the
strengths of these failed component in the TTC (see section 3.4.7.5 for failure modes). Failure in
the truss plate shear connections was detected when the shear force applied to the connectors
exceeded its ultimate shear strength Fult measured from the small-scale shear tests. Failure in the
NLT was detected when the total stress at the extreme fibre of the timber exceeded its specified
bending strength for the given wood material. Series S4 panels demonstrated with the greatest
capacity out of all the panels. This confirms that the additional increase to the moment arm due
to the rigid insulation layer affected in increasing the capacity.

92
Table 21: Panel Capacity
Series Replicate Measurements
�-method Predictions Global Factor of
Safety Mult (kNm) Mult (kNm)
S1 1 189.1
50.7 3.7
2 209.8 4.1
S2 1 212.4
60.8 3.5
2 204.9 3.4
S3 1 209.3
53.2 3.9
2 194.3 3.7
S4 1 225.2
131.7 1.7
2 250.5 1.9
Figure 74: Load vs. displacement of series S1
0
20
40
60
80
100
120
140
160
180
0 25 50 75 100 125 150
Load
(kN
)
Displacement (mm)
Service Load Limit
S1 Replicate 1
S1 Replicate 2
Predicted Capacity (γ-method)
Load spike not
accounted for
determining Pmax

93
Figure 75: Load vs. displacement of series S2
Figure 76: Load vs. displacement of series S3
0
20
40
60
80
100
120
140
160
180
0 25 50 75 100 125 150
Load
(kN
)
Displacement (mm)
Service Load Limit
S2 Replicate 1
S2 Replicate 2
Predicted Capacity (γ-method)
0
20
40
60
80
100
120
140
160
180
0 25 50 75 100 125 150
Load
(kN
)
Displacement (mm)
Service Load Limit
S3 Replicate 1
S3 Replicate 2
Predicted Capacity (γ-method)

94
Figure 77: Load vs. displacement of series S4
3.4.7.5 Failure Modes
The predicted and observed failure modes are compared in The experimental work showed that
all the TCC panels experienced both ductile and brittle failure mechanisms where the shear
connectors were gradually yielding with increasing load followed by concrete crushing or timber
fracture. In comparison to the small-scale shear tests, no concrete cracking around the shear
connectors and no out-of-plane rotation between the rigid insulation layer were observed as
expected due to the additional wire reinforcing and the inherent confinement provided by the
larger mass of concrete.
The predicted failure modes were not what governed the failures of the nail-laminated TCC
panels in most cases. Brittle failure modes of the laminates in the NLT fracturing governed for
most panels (see Figure 82 b) where it was predicted that the failure of the connections would.
0
20
40
60
80
100
120
140
160
180
200
0 25 50 75 100 125 150
Load
(kN
)
Displacement (mm)
Service Load Limit
S4 Replicate 1
S4 Replicate 2
Predicted Capacity (γ-method)

95
The second replicate of series S4 was predicted to fail in the timber failure was governed by an
abrupt concrete crushing (see Figure 82 d). It can be concluded that the �-method is inaccurate
in predicting the failure modes. What is clear is that the brittle failure modes occurred at very
high loads; as low as 5 and as high as 7 times the service load. As well, significant displacements
in the shear slips (see Figure 82 e and f) tended to occur at loads applied well above the service
load and predicted capacity. This demonstrates that the failure modes of nail-laminated TCC
panels do not hold much practical importance when designed for serviceability limit state
performance.
. The observed failure modes are based on interpretation of the load-shear slip curves along with
visual observation during testing. The observed failure modes are categorized as non-governing,
which were observed and the panel was able to sustain more loads, and governing, which were
observed when the panel reached its capacity. The shear slip between the concrete and timber
layers were recorded at each corner of the panels throughout the bending tests. Load-shear slip
curves were plotted by taking the applied load with respect to the averaged shear slips at each
end of the panel as they were loaded to failure. Each connector load-slip curves are presented in
Figure 78 to Figure 81. A significant shear slip is interpreted as a ductile failure mechanism
where yielding of the connectors took place. Brittle failure mechanisms such as concrete
crushing and tensile fracture of the individual laminated planks in the NLT were observed when
panels reached their capacity. Sample photos of the failure types are presented in Figure 82.
The failure modes of each panel were predicted using the �-method by identifying which TCC
component was first to show that its demand exceeded its resistance as the load applied was
incremented by a scale factor in the analysis (the resulting load is taken as the predicted capacity

96
of the panel). The experimental work showed that all the TCC panels experienced both ductile
and brittle failure mechanisms where the shear connectors were gradually yielding with
increasing load followed by concrete crushing or timber fracture. In comparison to the small-
scale shear tests, no concrete cracking around the shear connectors and no out-of-plane rotation
between the rigid insulation layer were observed as expected due to the additional wire
reinforcing and the inherent confinement provided by the larger mass of concrete.
The predicted failure modes were not what governed the failures of the nail-laminated TCC
panels in most cases. Brittle failure modes of the laminates in the NLT fracturing governed for
most panels (see Figure 82 b) where it was predicted that the failure of the connections would.
The second replicate of series S4 was predicted to fail in the timber failure was governed by an
abrupt concrete crushing (see Figure 82 d). It can be concluded that the �-method is inaccurate in
predicting the failure modes. What is clear is that the brittle failure modes occurred at very high
loads; as low as 5 and as high as 7 times the service load. As well, significant displacements in
the shear slips (see Figure 82 e and f) tended to occur at loads applied well above the service
load and predicted capacity. This demonstrates that the failure modes of nail-laminated TCC
panels do not hold much practical importance when designed for serviceability limit state
performance.

97
Figure 78: Load vs. shear slip of series S1
Figure 79: Load vs. shear slip of series S2
0
20
40
60
80
100
120
140
160
180
0 2 4 6 8 10 12
Load
(kN
)
Displacement (mm)
Service Load Limit
S1 Rep. 1 LVDT 1 & 3
S1 Rep. 1 LVDT 2 & 4
S1 Rep. 2 LVDT 1 & 3
S1 Rep. 2 LVDT 2 & 4
Predicted Capacity (γ-method)
0
20
40
60
80
100
120
140
160
180
200
0 2 4 6 8 10 12
Load
(kN
)
Displacement (mm)
Service Load Limit
S2 Rep. 1 LVDT 1 & 3
S2 Rep. 1 LVDT 2 & 4
S2 Rep. 2 LVDT 1 & 3
S2 Rep. 2 LVDT 2 & 4
Predicted Capacity (γ-method)

98
Figure 80: Load vs. shear slip of series S3
Figure 81: Load vs. shear slip of series S4
0
20
40
60
80
100
120
140
160
180
0 2 4 6 8 10 12
Load
(kN
)
Displacement (mm)
Service Load Limit
S3 Rep. 1 LVDT 1 & 3
S3 Rep. 1 LVDT 2 & 4
S3 Rep. 2 LVDT 1 & 3
S3 Rep. 2 LVDT 2 & 4
Predicted Capacity (γ-method)
0
20
40
60
80
100
120
140
160
180
200
0 1 2 3 4 5 6 7 8
Load
(kN
)
Displacement (mm)
Service Load Limit
S4 Rep. 1 LVDT 1 & 3
S4 Rep. 1 LVDT 2 & 4
S4 Rep. 2 LVDT 1 & 3
S4 Rep. 2 LVDT 2 & 4
Predicted Capacity (γ-method)

99
(a) (b)
(c) (d)
(e) (f)
Figure 82: Failure mechanisms: (a) state of panel at end of bending test; (b) governing timber
fracture; (c) non-governing concrete crushing; (d) governing concrete crushing; (e) & (f) shear
slips at panel ends

100
Table 22: Failure Modes Observed
Series Replicate Observations
�-method Predictions Governing Non-governing
S1 1 timber fracture
concrete crushing & connector yielding failure of shear
connections 2 timber fracture connector yielding
S2 1 timber fracture connector yielding failure of shear
connections 2 timber fracture connector yielding
S3 1 timber fracture connector yielding failure of shear
connections 2 timber fracture connector yielding
S4 1 timber fracture
concrete crushing & connector yielding
failure in timber
2 concrete crushing connector yielding
3.4.8 Efficiency of Shear Connectors
The efficiency of the shear connectors is informative in evaluating the truss-plate sizes and
quantity required to make economical decisions when designing the TCCs. The efficiencies of
the truss-plate shear connectors were determined as defined in Equation (1). The panels were
designed to achieve composite efficiencies of at least 75%. However, the overestimation of the
mid-span deflection at service load demonstrated higher efficiencies for the shear connectors as
summarized in Table 23. Example calculations of the shear connector efficiencies are shown in
Appendix C.
The shear connectors in series S1, S2 and S3 achieved similar efficiencies. The shear connectors
in series S4 panels demonstrated as the most efficient with the greatest truss-plate sizes in the

101
least amount required. The increase of the moment arm from the addition of the rigid insulation
layer significantly increased the S4 panels’ effective stiffness leading to an overall performance
better than the panels in the other series. It is of interest to note that the shear connectors in series
S4 did not pertain the best properties and exhibited out-of-plane rotations in the small-scale shear
tests yet showed to have achieved a very high efficiency.
Table 23: Shear Connector Efficiency
Series Shear
Connector Shear Connector
Quantity Replicate
Efficiency
Design Experimental
S1 MT 20 5x10
27
(54 plates)
1 77%
79%
2 79%
S2 MII 16 5x10
27
(54 plates)
1 79%
80%
2 78%
S3 MII 16 5x17.5
15
(30 plates)
1 78%
75%
2 80%
S4 MII 16 7x17.5
15
(30 plates)
1 84%
89%
2 88%

102
Chapter 4. Conclusions
This chapter concludes the thesis with an overall summary of the work accomplished and
potential areas for further research. Section 4.1 summarizes the experimental work conducted
and the key findings. Section 4.2 discusses potential areas for further research.
4.1 Summary
Nail-laminated TCC offers a practical solution as floor systems considering the economic
advantage of NLT and the structural and building physics advantages of TCC as well as the
overall environmental benefits of using mass-timber. Experimental work at UBC investigated the
properties of shear connections, as well as floor bending and vibrational behaviour. Eleven shear
connections (nine truss-plates of different sizes and two configurations of STS) were investigated
by conducting shear tests on small-scale specimens. Four truss-plate shear connections were then
implemented into full-scale TCC panels and tested for vibration and bending performance.
Results from the small-scale shear tests were obtained with respect to the strength and stiffness
as well as their failure modes. The objective was to compare the connection properties and
determine the influencing parameters. Key findings are:
(i) Shear slips were generally observed at failure in all shear connections, however, concrete
cracks near the connections and out-of-plane rotations were observed for truss-plates of
higher dimensions and insulated connections, respectively.
(ii) The thickness and length of the truss-plates correlates well (correlation coefficients
between0.73 and 0.98) to its strength and stiffness with exceptions of stiffness at certain load
levels.

103
(iii) The timber embedment depth of the truss-plates (minimum 75mm) has no statistically
significance on the shear connection properties.
(iv) The presence of a 25mm rigid insulation layer in truss-plate shear connections decreases the
strength and stiffness compared to the non-insulated counterparts.
(v) STS installed at 30° provided greater strength and stiffness compared to the cross-wise
configuration of STSs installed at 45° with 25mm rigid insulation layer.
Results from the full-scale bending and vibration tests were used to evaluate the overall
performance of nail-laminated TCCs. Key findings are:
(i) The fundamental natural frequency resulted to be greater than predicted and above the
susceptible range of human induced vibrations of 8.0 Hz.
(ii) The �-method underestimated the elastic bending stiffness by 4% - 13% and the panels
performed desirably under serviceability conditions. It can be concluded that the �-method
predictions were fairly conservative.
(iii) The experimental load capacities of the panels were approximately 2 - 4 times larger than the
�-method predictions. It can be concluded that the �-method underestimates the capacity of
the panel.
(iv) Brittle failure modes in the timber or concrete were observed to have governed during the
tests. The �-method did not correctly predict the governing failure modes in most cases.
However, the failure mode was not significant in the performance nail-laminated TCCs
because the panels were capable of sustaining loads up to 5 – 7 times the service loads.
(v) The truss-plate shear connections all achieved efficiencies in the range of 75% - 80% and as
high as 89% with the presence of the 25mm rigid insulation layer.

104
(vi) The increase in moment arm due to the 25mm rigid insulation layer contributed in improving
the overall performance of the TCC panel.
4.2 Further Research
Further research should address nail-laminated TCC with multi-span segments where the NLT
consists of butt-joints instead of continuous laminations of lumber planks across the span length.
This provides the option of extending the length of the panel by overlapping the laminates.
Waste of the wood can be reduced as a result by utilizing planks of different lengths bringing
efficiency in material cost. Butt-joints and their distributions are known to be crucial for the
structural behaviour of floors by likely reducing its bending strength and stiffness. Experimental
testing and numerical investigations can be conducted to multi-span nail-laminated TCC with
different configurations of controlled random butt-joints and corresponding adjustment factors
for the bending strength and stiffness can be formulated.
In addition, further research should address the long-term performance of nail-laminated TCC by
quantifying the relative contributions of each components of the TCC to its overall creep.
Analytical methods can be used to calculate the effective properties of the concrete, NLT and the
connectors for long-term loading and then verified against experimental testing. This can pose to
be challenging due to the non-linear behaviour of the NLT and the shear connectors.
Development of simplified calculations for the long-term performance can ensure that
appropriate considerations of the non-linear performance are considered.

105
References
[1] American Society of Civil Engineers (ASCE). (1996). Mechanical Connections in Wood
Structures. New York, NY: American Society of Civil Engineers.
[2] American Wood-Preservers’ Association. (1941). Timber-concrete composite decks for
bridges-piers-docks-ramps-buildings-and other structures requiring heavy duty floors.
Retrieved February 6, 2016 from Public Domain, Google-digitized.
http://hdl.handle.net/2027/coo.31924003646670.
[3] Bernard, E. S. (2008). Dynamic serviceability in lightweight engineered timber floors.
Journal of Structural Engineering, 134(February), 258–268.
http://doi.org/10.1061/(ASCE)0733-9445(2008)134:2(258)
[4] British Columbia, Office of Housing and Construction Standards, National Research
Council Canada. (2012). British Columbia Building Code 2012. British Columbia,
Canada: Office of Housing and Construction Standards.
[5] Canadian Wood Council. (2014, April 7). 21st century wood design, building and
construction solution. Retrieved July 23, 2016, from Wood Works BC:
http://wood-works.ca/wp-content/uploads/Contractors-main.4.7.14.allC_.pdf.
[6] Canadian Standards Association. (2014, May). CSA O86-14 Engineering design in wood.
Ontario, Canada.
[7] Ceccotti, A. (2002). Composite concrete-timber structures. Progress in Structural
Engineering and Materials, 4(3), 264–275. http://doi.org/10.1002/pse.126
[8] CEN Comité Européen de Normalisation. (1991) EN 26891 – Timber structures – Joints
made with mechanical fasteners – General principles for the determination of strength
and deformation characteristics. Brussels, Belgium.

106
[9] CEN Comité Européen de Normalisation. (2004) Eurocode 5 – Design of timber
structures – Part 1-1: General rules and rules for buildings. Brussels, Belgium.
[10] Clouston, P.L. and Schreyer, A.C. (2008). Design and Use of Wood-Concrete
Composites. Practice Periodical on Structural Design and Construction, 13 (November),
167-174
[11] Clouston, P.L. and Schreyer, A.C. (2011). Truss-plates for use as wood-concrete
composite shear connectors. Structures Congress 2011 © ASCE 2011 2862, 1020, 2862–
2873.
[12] Deam, B. L., Fragiacomo, M., & Gross, L. S. (2008). Experimental Behavior of
Prestressed LVL-Concrete Composite Beams, Journal of Structural Engineering, 134(5),
801–809.
[13] Dias, A.M.P.G. (2005). Mechanical behaviour of timber-concrete joints. (Doctoral
Thesis). University of Coimbra, Portugal, ISBN 90-9019214-X. Retrieved October 21,
2016 from uuid:fc148f88-9ad7-4322-8dda-af121c940b62.
[14] Dietsch P, Brandner R (2015), Self-tapping screws and threaded rods as reinforcement
for structural timber elements – A state-of-the-art report, Construction and Building
Materials, 97, pp 78–89
[15] Ellegard, P. (2000). Stiffness Analysis of Nail Plates. International Council for Research
and Innovation in Building and Construction: Working Commission W18-Timber
Structures, CIB-W18/33-7-9.

107
[16] EN 26891 (1991). Timber structures, joints made with mechanical fasteners, general
principles for the determination of strength and deformation characteristics." CEN
European Committee for Standardization, Brussels, Belgium
[17] EN 408 (2012). Timber structures – Structural timber and glued laminated timber –
Determination of some physical and mechanical properties. CEN European Committee
for Standardization, Brussels, Belgium
[18] Evaluation Report – MT16 and MII 16 Truss-plate, (2010). CCMC 10319-L, Canadian
Construction Materials Centre, Ottawa, Canada
[19] Evaluation Report – MT-20 and MII-20 Truss-plate, (2009). CCMC 11996-L, Canadian
Construction Materials Centre, Ottawa, Canada
[20] Evaluation Report – SWG ASSY® VG Plus and SWG ASSY® 3.0 Self-Tapping Wood
Screws, (2013). CCMC 13677-R, Canadian Construction Materials Centre, Ottawa,
Canada
[21] Fragiacomo, M., Gutkowski, R. M., Balogh, J., & Fast, R. S. (2007). Long-Term
Behavior of Wood-Concrete Composite Floor / Deck Systems with Shear Key
Connection Detail, 133(September), 1307–1315.
[22] Friedman, D. (1995). Historical Building Construction. New York, NY: W.W. Norton
and Company, Inc.
[23] Frangi, A. and Fontana, M. (2003). Elasto-plastic model for timber-concrete composite
beams with ductile connection. Structural Engineering International, 13(1), 47-57.
[24] Girhammer, U.A. (1984), Nail-plates as shear connectors in composite timber and
concrete composites, IABSE 12th Congress, Vancouver, Final Report, pp. 961-968.

108
[25] Girhammer, U.A., (2009). A simplified analysis method for composite beams with
interlayer slip. International Journal of Mechanical Sciences, 51(7), 515-530.
[26] Gupta, R., Gebremedhin, K. G. (1990). Destructive testing of metal-plateconnected wood
truss joints. Journal of Structural Engineering, 116(7), 1971-1982.
[27] Gupta, R. (1992). Testing apparatus for metal-plate-connected wood-truss joints.
Wood Design Focus, 3(2), 3-5.
[28] Haller, P. (2000) Experimental and numerical study of nailed laminated timber elements
for in plane and transverse loading. World Conference on Timber Engineering 2000.
Institut für Baukonstruktionen und Holzbau, Technische Universität Dresden, Dresden,
Germany.
[29] Werner, H. (1997). "Brettstapelbauweise." Informationdienst Holz. Bruderverlag,
Karlsruhe, Germany. Retrieved on December 11, 2015 from http://informationsdienst-
holz.de.
[30] Jorge, L., Habenbacher, J., & Dujic, B. (2010). Timber-concrete composite systems with
cross-laminated timber. Proceedings of the 11th World Conference on Timber
Engineering. Trentino, Italy.
[31] Kanócz, J., Bajzecerová, V., and Šteller, S. (2013). Timber – Concrete Composite
Elements with Various Composite Connections Part 1: Screwed Connection, Wood
Research. 58(4), 555–570.
[32] Karacabeyli, E. and Mohhammad, M. (2015). Historical, Current and Future Tall Wood
Buildings. Wood Design and Building. Retrieved on June 3, 2016 from
http://wooddesign.dgtlpub.com/2015/2015-01-31/pdf/Tall_Wood.pdf.
[33] Koo, K. (2013). A Study on Historical Tall Wood Buildings in Toronto and Vancouver.
Canadian Forest Service Final Report.

109
[34] Kavaliauskas, S., Kvedaras, A. K., & Valiunas, B. (2007). Mechanical Behaviour of
Timber-to-Concrete Connections with Inclined Screws. Journal of Civil Engineering and
Management, 8(3), 193–199.
[35] Kremor, P.D. and Symmons, M.A. (2015). Mass-timber construction as an alternative to
concrete and steel in the Australian building industry: a PESTL evaluation of the
potential. International Wood Products Journal, 6(3), 138-147.
[36] Lau, P. W. C. (1987). Factors affecting the behaviour and modelling of toothed
metal-plate joints. Canadian Journal of Civil Engineering, 14(2), 183-195.
[37] Ljunggren, F., Wang, J., and Agren, A. (2007). “Human vibration perception from single-
and dual-frequency components.” Journal of Sound and Vibration, 300(1–2), 13–24.
[38] Lukaszewka, E. (2009). Development of prefabricated timber-concrete composite floors.
(Doctoral Thesis). Luleå University of Technology, Sweden. DOI:
10.1680/stbu.10.00010.
[39] McCutcheon, W.J. (1977). Method for Predicting the Stiffness of Wood-Joist Floor
Systems with Partial Composite Action, No. FSRP-FPL-289. Forest Products Lab
Madison, WIS.
[40] National Research Council Canada. (2010). Commentary D: Deflection and Vibration
Criteria for Serviceability and Fatigue Limit States. National Building Code of Canada.
Ottawa: Associate Committee on the National Building Code.
[41] Natterer, J. K. (2002). New technologies for engineered timber structures. Progress in
Structural Engineering and Materials, 4: 245–263.

110
[42] O'Regan, P. J., Woeste, F. E., & Lewis, S. L. (1998). Design procedure for the
steel net-section of tension splice joints in MPC wood trusses. Forest Products Journal,
48(5), 35-42.
[43] Ohlsson, S. (1995). “STEP lecture A18: Serviceability limit states vibration of wooden
floors.” Timber engineering STEP 1, Centrum Hout, Almere, Netherlands.
[44] Owens Corning. (2013, October). Foamular® C-200 extruded polystyrene rigid
insulation. Product Data Sheet 07 2113.13.OCC. Retrieved on January 19, 2017 from
http://insulation.owenscorning.ca/assets/0/188/ec10aa77-7e0c-4905-96b5-
02790e992bcf.pdf
[45] Richart, F. E. and Williams, C. B. (1943). Tests of composite timber-concrete beams.
Journal of the American Concrete Institute, 14(4), 253-276.
[46] Ritter, M. A. (1990). “Timber Bridges: Design, Construction, Inspection, and
Maintenance. Washington, DC: p. 944.
[47] Santos, P. G. G. dos, Martins, C. E. de J., Skinner, J., Harris, R., Dias, A. M. P. G., &
Godinho, L. M. C. (2015). Modal frequencies of a reinforced timber-concrete composite
floor: testing and modeling. Journal of Structural Engineering, 04015029(11), 04015029.
[48] Smith, I., and Chui, Y. H. (1988). Design of lightweight wooden floors to avoid human
discomfort. Canadian Journal of Civil Engineering, 15(2), 254–262. [49] Stahl, D. C., Wolfe, R. W., Cramer, S. M., & McDonald, D. (1994). Strength and
stiffness of large-gap metal-plate wood connections. Research Paper no. FPL-RP-
535, USDA Forest Products Laboratory, Madison, Wisconsin. [50] Van der Linden, M. L. R. (1999). Timber-concrete composite beams. HERON, 44(4),
215-239.

111
[51] Wolfe, R. W. (1990). Metal-plate connections loaded in combined bending and
tension. Forest Products Journal, 40(9), 17-23.
[52] Xiaoqin, L. (2013). Three-dimensional modeling of metal plate connected wood truss
joints. (Doctoral Thesis). University of British Columbia, Vancouver, Canada. DOI:
10.14288/1.0073918.
[53] Yeoh, D. (2010). Behaviour and design of timber-concrete composite floor system.
(Doctoral Thesis). University of Canterbury, Christchurch, New Zealand. Retrieved on
October 17, 2016 from http://hdl.handle.net/10092/4428.
[54] Yeoh D, Fragiacomo M, Buchanan A, Gerber C. (2009). Preliminary research towards a
semi-prefabricated LVL-concrete composite floor system for the Australasian market.
Australasian. Journal of Structural Engineering, 9(3), 225-240.
[55] Yeoh, D., Fragiacomo, M., De Franceschi, M., & Boon, K. H. (2011). State of the art on
timber-concrete composite structures: literature review. Journal of Structural
Engineering, 137(10), 1085–1095.

112
Appendices
Appendix A – Load-Displacement Curves for Small-Scale Specimens
Figure 83: Complete Load-Displacement Curves of Series ID 5x10-20G
Table 24: Statistical Moments of Series ID 5x10-20G
Random Variable Mean Standard Deviation COV
Fult (kN) 84.14 5.37 6%
∆0.4 (mm) 0.52 0.06 11%
∆0.6 (mm) 1.07 0.31 29%
∆0.8 (mm) 1.61 0.32 20%
∆ult (mm) 7.11 0.43 6%
K0.4 (kN/mm) 65.13 5.82 9%
K0.6 (kN/mm) 49.89 11.81 24%
K0.8 (kN/mm) 43.05 8.18 19%
Kult (kN/mm) 11.90 1.43 12%
0
20
40
60
80
100
0 2 4 6 8 10 12 14 16 18
Load
(kN
)
Displacement (mm)

113
Figure 84: Complete Load-Displacement Curves of Series ID 5x10-20G
Table 25: Statistical Moments of Series ID 5x16-20G
Random Variable Mean Standard Deviation COV
Fult (kN) 97.17 14.03 14%
∆0.4 (mm) 0.43 0.14 32%
∆0.6 (mm) 0.77 0.19 24%
∆0.8 (mm) 1.18 0.20 17%
∆ult (mm) 3.96 0.53 13%
K0.4 (kN/mm) 96.53 23.94 25%
K0.6 (kN/mm) 77.68 10.14 13%
K0.8 (kN/mm) 66.38 4.29 6%
Kult (kN/mm) 25.4 1.2 5%
0
20
40
60
80
100
120
0 2 4 6 8 10 12 14 16
Load
(kN
)
Displacement (mm)

114
Figure 85: Complete Load-Displacement Curves of Series ID 5x10-16G
Table 26: Statistical Moments of Series ID 5x10-16G
Random Variable Mean Standard Deviation COV
Fult (kN) 103.88 5.47 5%
∆0.4 (mm) 0.51 0.05 9%
∆0.6 (mm) 0.84 0.13 16%
∆0.8 (mm) 1.23 0.32 26%
∆ult (mm) 3.17 1.24 39%
K0.4 (kN/mm) 82.20 11.08 13%
K0.6 (kN/mm) 75.00 10.36 14%
K0.8 (kN/mm) 70.16 14.36 20%
Kult (kN/mm) 37.80 16.33 43%
0
20
40
60
80
100
120
0 2 4 6 8 10 12 14 16 18
Load
(kN
)
Displacement (mm)

115
Figure 86: Complete Load-Displacement Curves of Series ID 5x17.5-16G
Table 27: Statistical Moments of Series ID 5x17.5-16G
Random Variable Mean Standard Deviation COV
Fult (kN) 178.21 13.90 8%
∆0.4 (mm) 0.52 0.09 17%
∆0.6 (mm) 0.94 0.13 14%
∆0.8 (mm) 1.54 0.12 8%
∆ult (mm) 4.51 0.63 14%
K0.4 (kN/mm) 140.33 17.13 12%
K0.6 (kN/mm) 114.95 9.50 8%
K0.8 (kN/mm) 93.01 7.52 8%
Kult (kN/mm) 40.19 6.95 17%
0
20
40
60
80
100
120
140
160
180
200
220
0 2 4 6 8 10 12
Load
(kN
)
Displacement (mm)

116
Figure 87: Complete Load-Displacement Curves of Series ID 7x12.5-16G
Table 28: Statistical Moments of Series ID 7x12.5-16G
Random Variable Mean Standard Deviation COV
Fult (kN) 134.24 4.14 3%
∆0.4 (mm) 0.47 0.04 9%
∆0.6 (mm) 0.96 0.28 29%
∆0.8 (mm) 1.45 0.42 29%
∆ult (mm) 4.19 1.97 47%
K0.4 (kN/mm) 114.41 8.50 7%
K0.6 (kN/mm) 88.31 19.13 22%
K0.8 (kN/mm) 77.92 16.82 22%
Kult (kN/mm) 35.93 11.21 31%
0
20
40
60
80
100
120
140
160
0 2 4 6 8 10 12
Load
(kN
)
Displacement (mm)

117
Figure 88: Complete Load-Displacement Curves of Series ID 7x17.5-16G
Table 29: Statistical Moments of Series ID 7x17.5-16G
Random Variable Mean Standard Deviation COV
Fult (kN) 191.49 7.03 4%
∆0.4 (mm) 0.56 0.05 8%
∆0.6 (mm) 1.01 0.09 9%
∆0.8 (mm) 1.64 0.22 13%
∆ult (mm) 4.18 0.76 18%
K0.4 (kN/mm) 136.40 12.27 9%
K0.6 (kN/mm) 114.99 12.99 11%
K0.8 (kN/mm) 94.75 13.90 15%
Kult (kN/mm) 47.01 8.30 18%
0
20
40
60
80
100
120
140
160
180
200
220
0 2 4 6 8 10 12 14 16
Load
(kN
)
Displacement (mm)

118
Figure 89: Complete Load-Displacement Curves of Series ID 7x12.5-16G_I
Table 30: Statistical Moments of Series ID 7x12.5-16G_I
Random Variable Mean Standard Deviation COV
Fult (kN) 114.60 5.48 5%
∆0.4 (mm) 0.66 0.18 27%
∆0.6 (mm) 1.25 0.46 37%
∆0.8 (mm) 1.93 0.76 40%
∆ult (mm) 6.03 1.00 17%
K0.4 (kN/mm) 74.44 23.01 29%
K0.6 (kN/mm) 62.58 28.03 41%
K0.8 (kN/mm) 54.80 26.09 43%
Kult (kN/mm) 19.50 4.20 20%
0
20
40
60
80
100
120
140
0 2 4 6 8 10 12 14
Load
(kN
)
Displacement (mm)

119
Figure 90: Complete Load-Displacement Curves of Series ID 7x17.5-16G_I
Table 31: Statistical Moments of Series ID 7x17.5-16G_I
Random Variable Mean Standard Deviation COV
Fult (kN) 148.57 8.42 6%
∆0.4 (mm) 0.60 0.08 13%
∆0.6 (mm) 1.13 0.14 13%
∆0.8 (mm) 1.89 0.25 13%
∆ult (mm) 5.38 1.06 20%
K0.4 (kN/mm) 100.04 16.98 17%
K0.6 (kN/mm) 79.88 11.16 14%
K0.8 (kN/mm) 63.78 8.50 13%
Kult (kN/mm) 28.14 3.80 13%
0
20
40
60
80
100
120
140
160
180
200
0 2 4 6 8 10 12 14 16
Load
(kN
)
Displacement (mm)

120
Figure 91: Complete Load-Displacement Curves of Series ID STS-30°
Table 32: Statistical Moments of Series ID STS-30°
Random Variable Mean Standard Deviation COV
Fult (kN) 23.61 6.80 29%
∆0.4 (mm) 0.10 0.05 48%
∆0.6 (mm) 0.20 0.08 41%
∆0.8 (mm) 0.33 0.08 26%
∆ult (mm) 0.58 0.09 16%
K0.4 (kN/mm) 101.15 21.71 21%
K0.6 (kN/mm) 75.10 13.58 18%
K0.8 (kN/mm) 56.99 8.23 14%
Kult (kN/mm) 40.71 9.72 24%
0
10
20
30
40
0.0 0.5 1.0 1.5 2.0 2.5 3.0 3.5
Load
(kN
)
Displacement (mm)

121
Figure 92: Complete Load-Displacement Curves of Series ID X-STS-45°_I
Table 33: Statistical Moments of Series ID X-STS-45°_I
Random Variable Mean Standard Deviation COV
Fult (kN) 15.50 1.67 11%
∆0.4 (mm) 0.17 0.06 33%
∆0.6 (mm) 0.29 0.10 33%
∆0.8 (mm) 0.46 0.17 36%
∆ult (mm) 0.99 0.59 59%
K0.4 (kN/mm) 40.16 14.05 35%
K0.6 (kN/mm) 35.13 13.95 40%
K0.8 (kN/mm) 30.38 13.11 43%
Kult (kN/mm) 19.23 8.86 46%
0
2
4
6
8
10
12
14
16
18
20
0 0.5 1 1.5 2 2.5
Load
(kN
)
Displacement (mm)

122
Appendix B – Design of Full-scale Specimens According to �-Method

123

124

125

126

127

128

129
Appendix C – Shear Connector Efficiency