structural health monitoring using non destructive testing...
TRANSCRIPT
STRUCTURAL HEALTH MONITORING USING NON DESTRUCTIVE TESTING OF CONCRETE
A THESIS SUBMITTED IN PARTIAL FULFILLMENT
OF THE REQUIREMENTS FOR THE DEGREE OF
Bachelor of Technology
in
Civi l Engineering
By
AYAZ MAHMOOD
Depar tment o f C iv i l Eng ineer ing
Nat iona l Ins t i tu te o f Techno logy
Rourke la
2008
STRUCTURAL HEALTH MONITORING USING NON DESTRUCTIVE TESTING OF CONCRETE
A THESIS SUBMITTED IN PARTIAL FULFILLMENT
OF THE REQUIREMENTS FOR THE DEGREE OF
Bachelor of Technology
in
Civi l Engineering
By
AYAZ MAHMOOD
Under the Guidance of
Dr. S.K.SAHU
Department of Civ i l Engineer ing
Nat ional Inst i tute of Technology
Rourkela
2008

2008
National Institute of Technology
Rourkela
CERTIFICATE
This is to certify that the thesis entitled, “STRUCTURAL HEALTH MONITORING
USING NON DESTRUCTIVE TESTING OF CONCRETE” submitted by
Mr. AYAZ MAHMOOD in fulfillment of the requirements for the award of Bachelor of
Technology Degree in Civil Engineering at the National Institute of Technology,
Rourkela (Deemed University) is an authentic work carried out by him under my
supervision and guidance.
To the best of my knowledge, the matter embodied in the
thesis has not been submitted to any other University / Institute for the any Degree or
Diploma.
Date:
Prof. S.K.SAHU
Dept. of Civil Engineering
National Institute of Technology
Rourkela-769008

ACKNOWLEDGEMENT
I extend our deep sense of gratitude and indebtedness to our guide Dr. S.K.Sahu,
Department Of Civil Engineering, National Institute of Technology, Rourkela for his kind
attitude, invaluable guidance, keen interest, immense help, inspiration and encouragement which
helped me in carrying out my present work.
I a m g r a t e f u l t o D r . K . C . P a t r a , H e a d o f t h e D e p a r t me n t ,
C i v i l E n g i n e e r i n g f o r g i v i n g a l o t o f f r e e d o m, e n c o u r a g e me n t a n d
g u i d a n c e , and Prof. J.K. Pani, Student Advisor and the faculty members of Civil
Engineering Department, National Institute of Technology, Rourkela, for providing all kind of
possible help throughout the two semesters for the completion of this project work..
I a m a l s o t h a n kfu l t o t he T e c h n i c a l S t a f f o f t h e S t r u c t u r a l
L a b o r a t o r y , N . I . T . R o u r k e l a f o r h e l p i n g me d u r i n g t h e e x p e r i me n t a l
wo r k . It is a great pleasure for me to acknowledge and express my gratitude to my classmates
and friends for their understanding, unstinted support. Lastly, I thank all those who are involved
directly or indirectly in completion of the present project work.
AYA Z MAHMOOD
R O L L N O : 1 0 4 0 1 0 0 1
C I V I L E N G I N E E RI N G
N . I . T R O U R K E L A
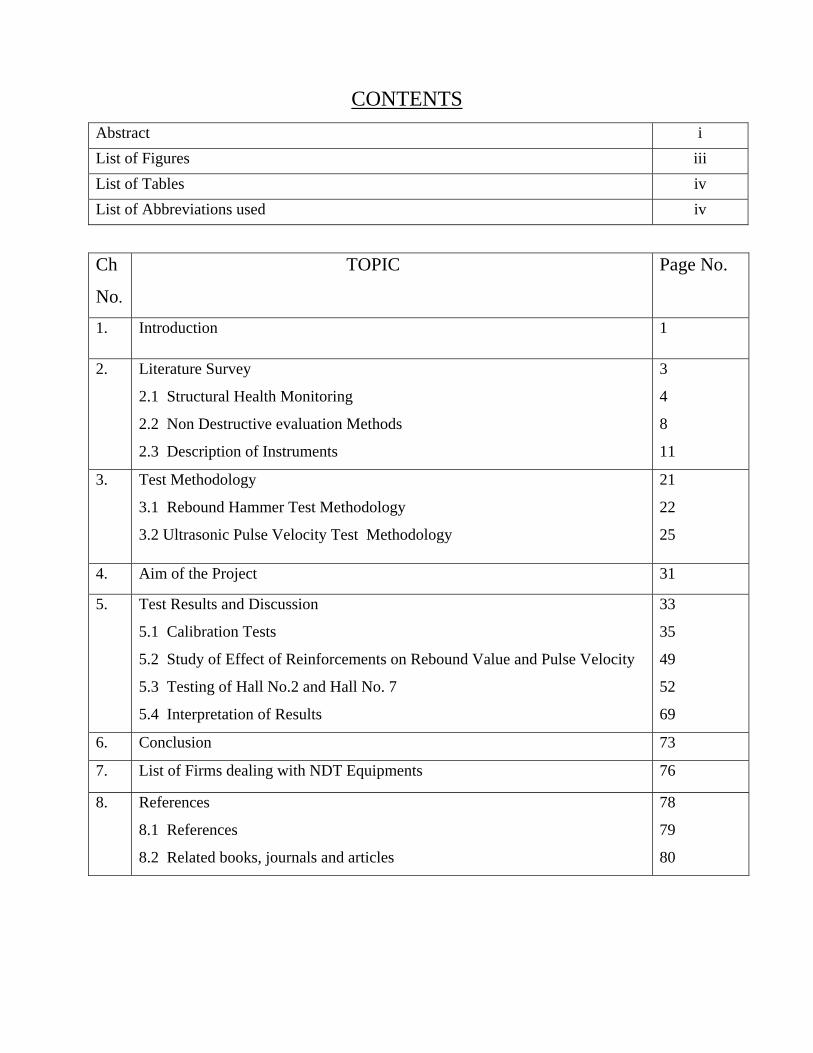
CONTENTS Abstract i List of Figures iii List of Tables iv List of Abbreviations used iv
Ch
No.
TOPIC Page No.
1. Introduction 1
2. Literature Survey
2.1 Structural Health Monitoring
2.2 Non Destructive evaluation Methods
2.3 Description of Instruments
3
4
8
11
3. Test Methodology
3.1 Rebound Hammer Test Methodology
3.2 Ultrasonic Pulse Velocity Test Methodology
21
22
25
4. Aim of the Project 31
5. Test Results and Discussion
5.1 Calibration Tests
5.2 Study of Effect of Reinforcements on Rebound Value and Pulse Velocity
5.3 Testing of Hall No.2 and Hall No. 7
5.4 Interpretation of Results
33
35
49
52
69
6. Conclusion 73
7. List of Firms dealing with NDT Equipments 76
8. References
8.1 References
8.2 Related books, journals and articles
78
79
80
i
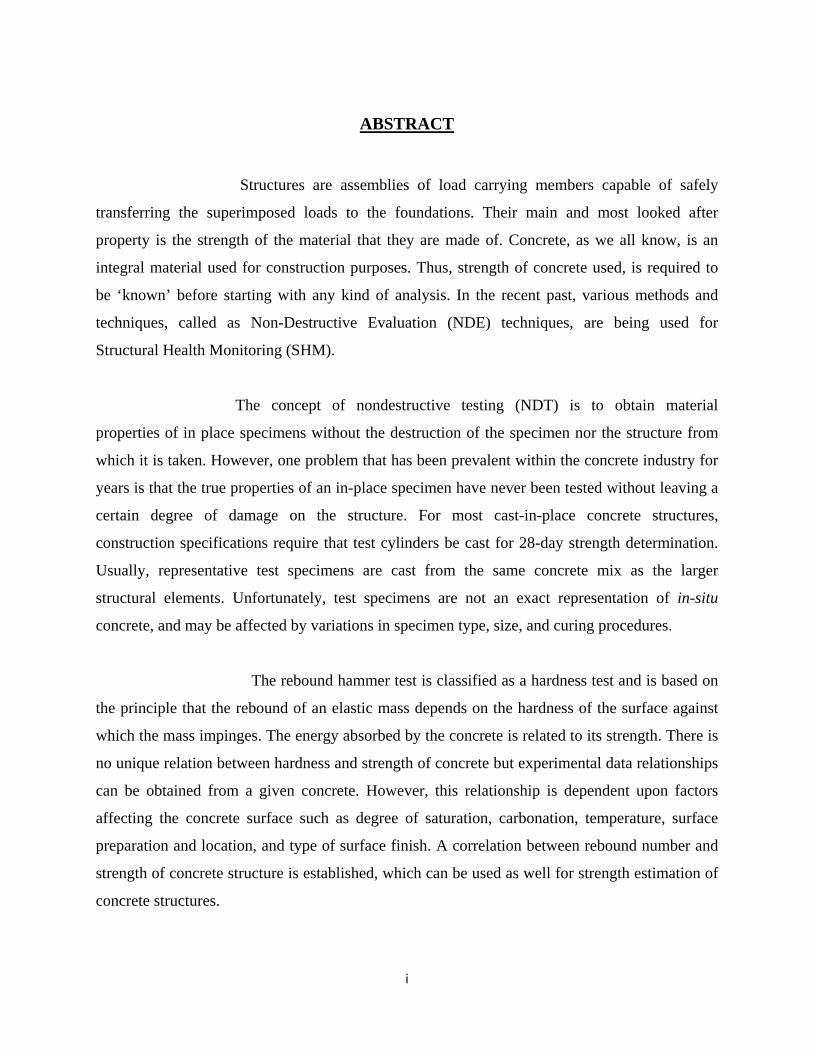
ABSTRACT
Structures are assemblies of load carrying members capable of safely
transferring the superimposed loads to the foundations. Their main and most looked after
property is the strength of the material that they are made of. Concrete, as we all know, is an
integral material used for construction purposes. Thus, strength of concrete used, is required to
be ‘known’ before starting with any kind of analysis. In the recent past, various methods and
techniques, called as Non-Destructive Evaluation (NDE) techniques, are being used for
Structural Health Monitoring (SHM).
The concept of nondestructive testing (NDT) is to obtain material
properties of in place specimens without the destruction of the specimen nor the structure from
which it is taken. However, one problem that has been prevalent within the concrete industry for
years is that the true properties of an in-place specimen have never been tested without leaving a
certain degree of damage on the structure. For most cast-in-place concrete structures,
construction specifications require that test cylinders be cast for 28-day strength determination.
Usually, representative test specimens are cast from the same concrete mix as the larger
structural elements. Unfortunately, test specimens are not an exact representation of in-situ
concrete, and may be affected by variations in specimen type, size, and curing procedures.
The rebound hammer test is classified as a hardness test and is based on
the principle that the rebound of an elastic mass depends on the hardness of the surface against
which the mass impinges. The energy absorbed by the concrete is related to its strength. There is
no unique relation between hardness and strength of concrete but experimental data relationships
can be obtained from a given concrete. However, this relationship is dependent upon factors
affecting the concrete surface such as degree of saturation, carbonation, temperature, surface
preparation and location, and type of surface finish. A correlation between rebound number and
strength of concrete structure is established, which can be used as well for strength estimation of
concrete structures.

ii
The direct determination of the strength of concrete implies that concrete
specimens must be loaded to failure. Therefore, the determination of concrete strength requires
special specimens to be taken, shipped, and tested at laboratories. This procedure may result in
the actual strength of concrete, but may cause trouble and delay in evaluating existing structures.
Because of that, special techniques have been developed in which attempts were made to
measure some concrete properties other than strength, and then relate them to strength,
durability, or any other property. Some of these properties are hardness, resistance to penetration
or projectiles, rebound number, resonance frequency, and ability to allow ultrasonic pulses to
propagate through concrete. Concrete electrical properties, its ability to absorb, scatter, and
transmit X-rays and gamma rays, its response to nuclear activation, and its acoustic emission
allow us to estimate its moisture content, density, thickness, and its cement content. However,
the term “nondestructive” is given to any test that does not damage or affect the structural
behavior of the elements and also leaves the structure in an acceptable condition for the client.
The use of the ultrasonic pulse velocity tester is introduced as a tool to
monitor basic initial cracking of concrete structures and hence to introduce a threshold limit for
possible failure of the structures. Experiments using ultrasonic pulse velocity tester have been
carried out, under laboratory conditions, on various concrete specimens loaded in compression
up to failure.
. The aim of the project was to obtain the Calibration Graphs for Non
Destructive Testing Equipments viz., the Rebound Hammer and Ultrasonic pulse Velocity Tester
and to study the effect of reinforcement on the obtained results. These Non Destructive
Instruments were then used to test the columns, beams and slabs of two double storied
buildings viz., Hall No.2 and Hall no.7 ( a newly constructed hostel ) in N I T Rourkela.
The use of the combined methods produces results that lie close to the
true values when compared with other methods. The method can be extended to test existing
structures by taking direct measurements on concrete elements.

iii
LIST OF FIGURES
FIGURE PAGE NO.
Fig.2.1 Components of a Rebound Hammer 11
Fig.2.2 Components of a USPV TESTER 14
Fig. 3.1 Various positions of Rebound Hammer 22
Fig. 3.2 Various Methods of UPV Testing 25
Fig.3.3 Testing of a beam by USPV Tester 29
Fig.5.1 Components of a Rebound Hammer used in the Project 36
Fig.5.2 Rebound Hammer Testing of a Specimen 36
Fig. 5.3 Calibration Graph for Rebound Hammer with its Equation 43
Fig.5.4 Zeroing of the Transducers 45
Fig.5.5 USPV Tester used in the Project 45
Fig. 5.6 USPV Testing of a Specimen 46
Fig. 5.7 Graph obtained for USPV Testing 48
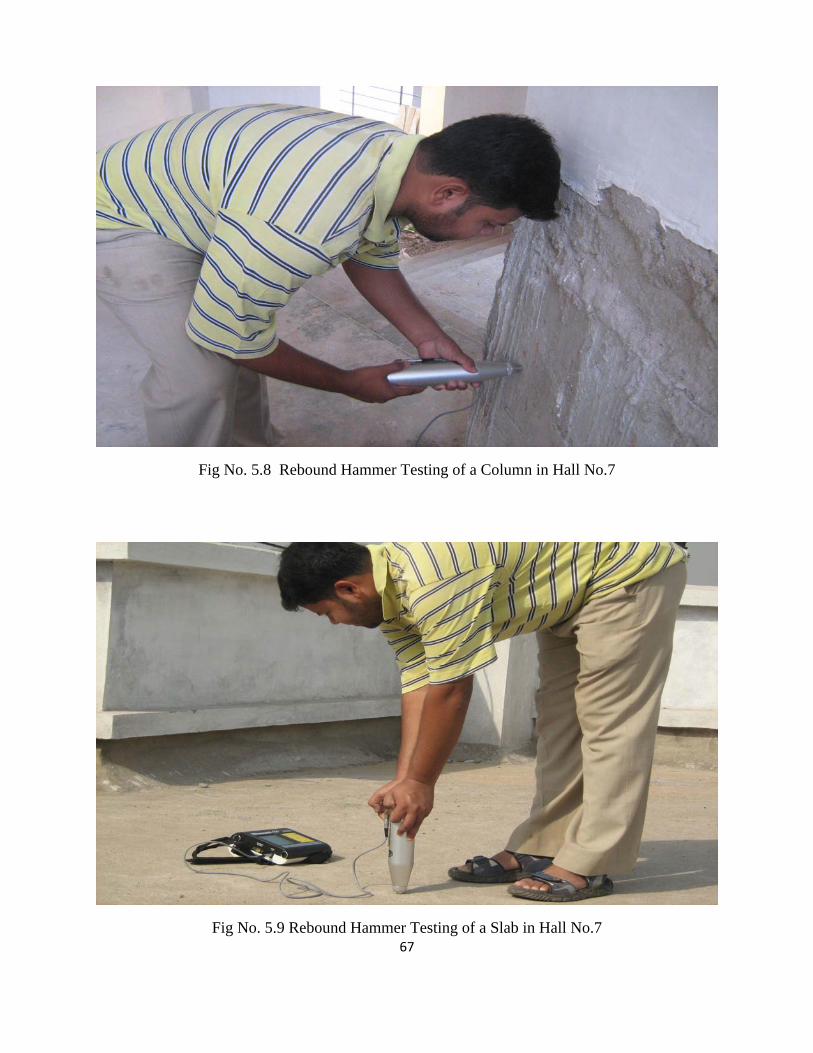
Fig No. 5.8 Rebound Hammer Testing of a Column in Hall No.7 67
Fig No. 5.9 Rebound Hammer Testing of a Slab in Hall No.7 67
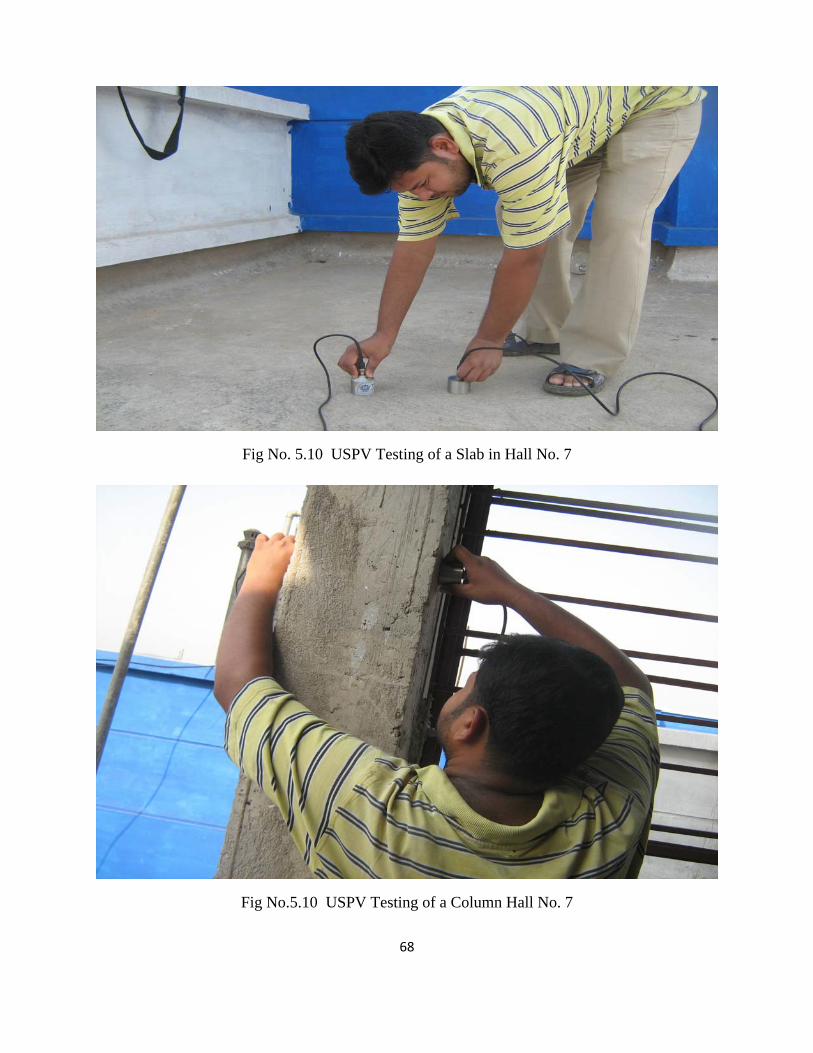
Fig No. 5.10 USPV Testing of a Slab in Hall No. 7 68
Fig No.5.10 USPV Testing of a Column Hall No. 7 68
Fig No. 5.11 Variation of Strength with increase in Height of Column 72
iv
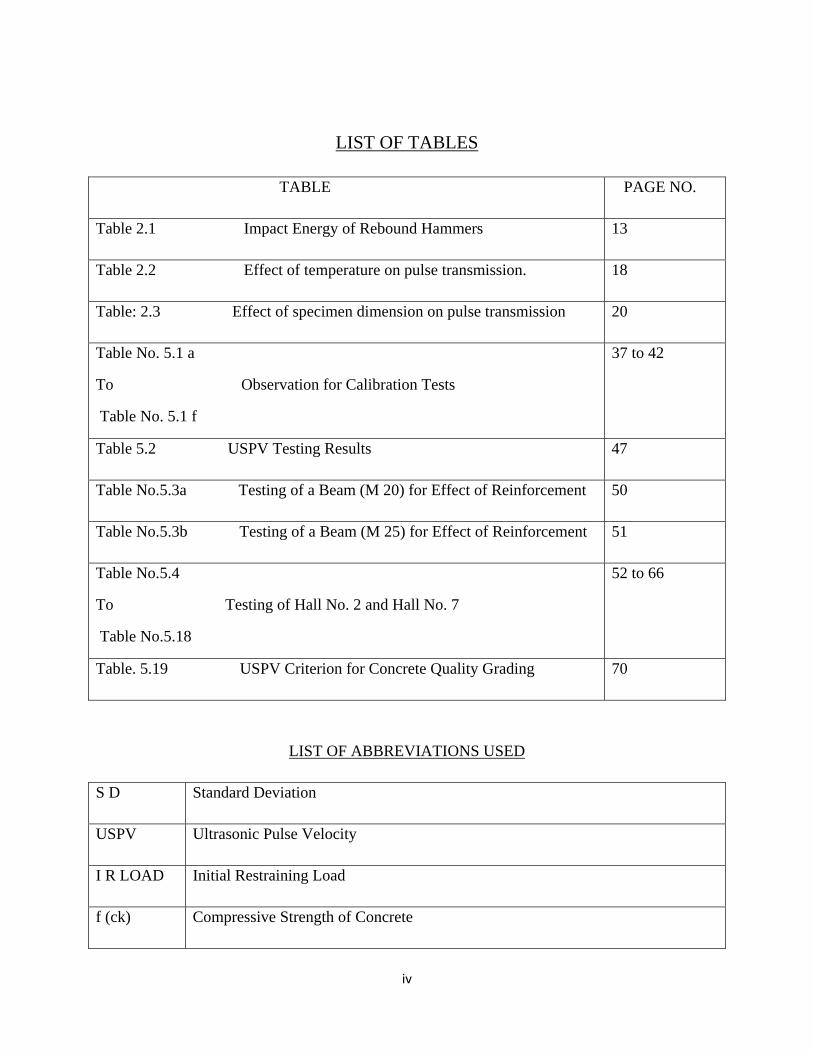
LIST OF TABLES
TABLE PAGE NO.
Table 2.1 Impact Energy of Rebound Hammers 13
Table 2.2 Effect of temperature on pulse transmission. 18
Table: 2.3 Effect of specimen dimension on pulse transmission 20
Table No. 5.1 a
To Observation for Calibration Tests
Table No. 5.1 f
37 to 42
Table 5.2 USPV Testing Results 47
Table No.5.3a Testing of a Beam (M 20) for Effect of Reinforcement 50
Table No.5.3b Testing of a Beam (M 25) for Effect of Reinforcement 51
Table No.5.4
To Testing of Hall No. 2 and Hall No. 7
Table No.5.18
52 to 66
Table. 5.19 USPV Criterion for Concrete Quality Grading 70
LIST OF ABBREVIATIONS USED
S D Standard Deviation
USPV Ultrasonic Pulse Velocity
I R LOAD Initial Restraining Load
f (ck) Compressive Strength of Concrete

1
Chapter 1
INTRODUCTION
2
INTRODUCTION
To keep a high level of structural safety, durability and performance of
the infrastructure in each country, an efficient system for early and regular structural assessment
is urgently required. The quality assurance during and after the construction of new structures
and after reconstruction processes and the characterisation of material properties and damage as
a function of time and environmental influences is more and more becoming a serious concern.
Non-destructive testing (NDT) methods have a large potential to be part of such a system. NDT
methods in general are widely used in several industry branches. Aircrafts, nuclear facilities,
chemical plants, electronic devices and other safety critical installations are tested regularly with
fast and reliable testing technologies. A variety of advanced NDT methods are available for
metallic or composite materials.
In recent years, innovative NDT methods, which can be used for the
assessment of existing structures, have become available for concrete structures, but are still not
established for regular inspections. Therefore, the objective of this project is to study the
applicability, performance, availability, complexity and restrictions of NDT.
The purpose of establishing standard procedures for nondestructive testing
(NDT) of concrete structures is to qualify and quantify the material properties of in-situ concrete
without intrusively examining the material properties. There are many techniques that are
currently being research for the NDT of materials today. This chapter focuses on the NDT
methods relevant for the inspection and monitoring of concrete materials.

3
Chapter 2
LITERATURE SURVEY

4
2.1 Structural Health Monitoring
Structural health monitoring is at the forefront of structural and
materials research. Structural health monitoring systems enable inspectors and engineers to
gather material data of structures and structural elements used for analysis. Ultrasonics can be
applied to structural monitoring programs to obtain such data, which would be especially
valuable since the wave properties could be used to obtain material properties.
This testing approach may be used to assess the uniformity and
relative quality of the concrete, to indicate the presence of voids and cracks, and to evaluate the
effectiveness of crack repairs. It may also be used to indicate changes in the properties of
concrete, and in the survey of structures, to estimate the severity of deterioration or cracking.
Decreases in ultrasonic waves speeds over time can reveal the onset of damage before visible
deficiencies become evident. This allows inspectors and engineers to implement repair
recommendations before minor deficiencies become safety hazards.
5
Structural Health Monitoring using Non-Destructive Testing
The quality of new concrete structures is dependent on many
factors such as type of cement, type of aggregates, water cement ratio, curing, environmental
conditions etc. Besides this, the control exercised during construction also contributes a lot to
achieve the desired quality. The present system of checking slump and testing cubes, to assess
the strength of concrete, in structure under construction, are not sufficient as the actual strength
of the structure depend on many other factors such as proper compaction, effective curing also.
Considering the above requirements, need of testing of hardened concrete in new structures as
well as old structures, is there to asses the actual condition of structures. Non-Destructive Testing
(NDT) techniques can be used effectively for investigation and evaluating the actual condition of
the structures. These techniques are relatively quick, easy to use, and cheap and give a general
indication of the required property of the concrete. This approach will enable us to find suspected
zones, thereby reducing the time and cost of examining a large mass of concrete. The choice of a
particular NDT method depends upon the property of concrete to be observed such as strength,
corrosion, crack monitoring etc.
The subsequent testing of structure will largely depend upon the result of
preliminary testing done with the appropriate NDT technique.
The NDT being fast, easy to use at site and relatively less expensive can be used for
(i) Testing any number of points and locations
(ii) Assessing the structure for various distressed conditions
(iii) Assessing damage due to fire, chemical attack, impact, age etc.
(iv) Detecting cracks, voids, fractures, honeycombs and weak locations
(v) Assessing the actual condition of reinforcement
6
Many of NDT methods used for concrete testing have their origin to the
testing of more homogeneous, metallic system. These methods have a sound scientific basis, but
heterogeneity of concrete makes interpretation of results somewhat difficult. There could be
many parameters such as materials, mix, workmanship and environment, which influence the
result of measurements.
Moreover the test measures some other property of concrete (e.g.
hardness) yet the results are interpreted to assess the different property of the concrete e.g.
(strength). Thus, interpretation of the result is very important and a difficult job where
generalization is not possible. Even though operators can carry out the test but interpretation of
results must be left to experts having experience and knowledge of application of such non-
destructive tests.
Variety of NDT methods have been developed and are available for
investigation and evaluation of different parameters related to strength, durability and overall
quality of concrete. Each method has some strength and some weakness. Therefore prudent
approach would be to use more than one method in combination so that the strength of one
compensates the weakness of the other. The various NDT methods for testing concrete bridges
are listed below –
A. For strength estimation of concrete
(i) Rebound hammer test
(ii) Ultrasonic Pulse Velocity Tester
(iii) Combined use of Ultrasonic Pulse Velocity tester and rebound hammer test
(iv) Pull off test
(v) Pull out test
(vi) Break off test

7
B. For assessment of corrosion condition of reinforcement and to determine reinforcement
diameter and cover
(i) Half cell potentiometer
(ii) Resistively meter test
(iii) Test for carbonation of concrete
(iv) Test for chloride content of concrete
(v) Profometer
(vi) Micro covermeter
C. For detection of cracks/voids/ delamination etc.
(i) Infrared thermographic technique
(ii) Acoustic Emission techniques
(iii) Short Pulse Radar methods
(iv) Stress wave propagation methods
- pulse echo method
- impact echo method
- response method
8
2.2 NON DESTRUCTIVE EVALUATION (NDE) METHODS
Introduction to NDE Methods
Concrete technologists practice NDE methods for
(a) Concrete strength determination (b) Concrete damage detection
2.3(a) Strength determination by NDE methods:
Strength determination of concrete is important because its elastic behaviour & service behaviour
can be predicted from its strength characteristics. The conventional NDE methods typically
measure certain properties of concrete from which an estimate of its strength and other
characteristics can be made. Hence, they do not directly give the absolute values of strength.
Damage detection by NDE methods:
Global techniques: These techniques rely on global structural response for damage identification.
Their main drawback is that since they rely on global response, they are not sensitive to localized
damages. Thus, it is possible that some damages which may be present at various locations
remain un-noticed.
Local techniques: These techniques employ localized structural analysis, for damage detection.
Their main drawback is that accessories like probes and fixtures are required to be physically
carried around the test structure for data recording. Thus, it no longer remains autonomous
application of the technique. These techniques are often applied at few selected locations, by the
instincts/experience of the engineer coupled with visual inspection. Hence, randomness creeps
into the resulting data.
9
NDE Methods in Practice
Visual inspection: The first stage in the evaluation of a concrete structure is to study the
condition of concrete, to note any defects in the concrete, to note the presence of cracking and
the cracking type (crack width, depth, spacing, density), the presence of rust marks on the
surface, the presence of voids and the presence of apparently poorly compacted areas etc. Visual
assessment determines whether or not to proceed with detailed investigation.
The Surface hardness method: This is based on the principle that the strength of concrete is
proportional to its surface hardness. The calibration chart is valid for a particular type of cement,
aggregates used, moisture content, and the age of the specimen.
The penetration technique: This is basically a hardness test, which provides a quick means of
determining the relative strength of the concrete. The results of the test are influenced by surface
smoothness of concrete and the type and hardness of the aggregate used. Again, the calibration
chart is valid for a particular type of cement, aggregates used, moisture content, and age of the
specimen. The test may cause damage to the specimen which needs to be repaired.
The pull-out test: A pullout test involves casting the enlarged end of a steel rod after setting of
concrete, to be tested and then measuring the force required to pull it out. The test measures the
direct shear strength of concrete. This in turn is correlated with the compressive strength; thus a
measurement of the in-place compressive strength is made. The test may cause damage to the
specimen which needs to be repaired.
The rebound hammer test: The Schmidt rebound hammer is basically a surface hardness test
with little apparent theoretical relationship between the strength of concrete and the rebound
number of the hammer. Rebound hammers test the surface hardness of concrete, which cannot be
converted directly to compressive strength. The method basically measures the modulus of
elasticity of the near surface concrete. The principle is based on the absorption of part of the
stored elastic energy of the spring through plastic deformation of the rock surface and the
10
mechanical waves propagating through the stone while the remaining elastic energy causes the
actual rebound of the hammer. The distance travelled by the mass, expressed as a percentage of
the initial extension of the spring, is called the Rebound number. There is a considerable amount
of scatter in rebound numbers because of the heterogeneous nature of near surface properties
(principally due to near-surface aggregate particles).
There are several factors other than concrete strength that influence rebound
hammer test results, including surface smoothness and finish, moisture content, coarse aggregate
type, and the presence of carbonation. Although rebound hammers can be used to estimate
concrete strength, the rebound numbers must be correlated with the compressive strength of
molded specimens or cores taken from the structure.
Ultra-sonic pulse velocity test: This test involves measuring the velocity of sound through
concrete for strength determination. Since, concrete is a multi-phase material, speed of sound in
concrete depends on the relative concentration of its constituent materials, degree of compacting,
moisture content, and the amount of discontinuities present. This technique is applied for
measurements of composition (e.g. monitor the mixing materials during construction, to estimate
the depth of damage caused by fire), strength estimation, homogeneity, elastic modulus and age,
& to check presence of defects, crack depth and thickness measurement. Generally, high pulse
velocity readings in concrete are indicative of concrete of good quality. The drawback is that this
test requires large and expensive transducers. In addition, ultrasonic waves cannot be induced at
right angles to the surface; hence, they cannot detect transverse cracks.
Acoustic emission technique: This technique utilizes the elastic waves generated by plastic
deformations, moving dislocations, etc. for the analysis and detection of structural defects.
However, there can be multiple travel paths available from the source to the sensors. Also,
electrical interference or other mechanical noises hampers the quality of the emission signals.
Impact echo test: In this technique, a stress pulse is introduced at the surface of the structure,
and as the pulse propagates through the structure, it is reflected by cracks and dislocations.
Through the analysis of the reflected waves, the locations of the defects can be estimated. The
main drawback of this technique is that it is insensitive to small sized cracks.
11
2.3 DESCRIPTION OF THE INSTRUMENTS
The following instruments were used in the project:
1. Rebound Hammer (Schmidt Hammer) (Impact energy of the hammer is about 2.2 Nm)
2. Ultrasonic Pulse Velocity Tester.
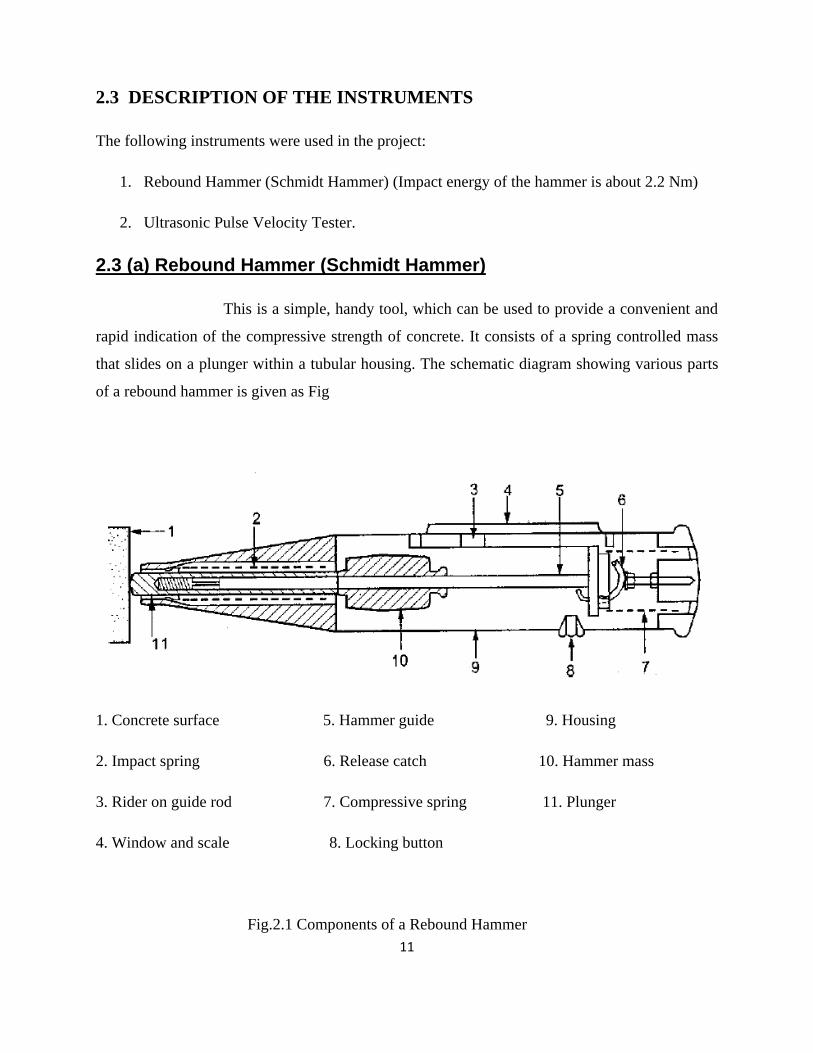
2.3 (a) Rebound Hammer (Schmidt Hammer)
This is a simple, handy tool, which can be used to provide a convenient and
rapid indication of the compressive strength of concrete. It consists of a spring controlled mass
that slides on a plunger within a tubular housing. The schematic diagram showing various parts
of a rebound hammer is given as Fig
1. Concrete surface 5. Hammer guide 9. Housing
2. Impact spring 6. Release catch 10. Hammer mass
3. Rider on guide rod 7. Compressive spring 11. Plunger
4. Window and scale 8. Locking button
Fig.2.1 Components of a Rebound Hammer
12
The rebound hammer method could be used for –
(a) Assessing the likely compressive strength of concrete with the help of suitable co-relations
between rebound index and compressive strength.
(b) Assessing the uniformity of concrete
(c) Assessing the quality of concrete in relation to standard requirements.
(d) Assessing the quality of one element of concrete in relation to another.
This method can be used with greater confidence for differentiating
between the questionable and acceptable parts of a structure or for relative comparison between
two different structures.
The test is classified as a hardness test and is based on the principle that
the rebound of an elastic mass depends on the hardness of the surface against which the mass
impinges. The energy absorbed by the concrete is related to its strength . Despite its apparent
simplicity, the rebound hammer test involves complex problems of impact and the associated
stress-wave propagation.
There is no unique relation between hardness and strength of concrete but
experimental data relationships can be obtained from a given concrete. However, this
relationship is dependent upon factors affecting the concrete surface such as degree of saturation,
carbonation, temperature, surface preparation and location, and type of surface finish. The result
is also affected by type of aggregate, mix proportions, hammer type, and hammer inclination.
Areas exhibiting honeycombing, scaling, rough texture, or high porosity must be avoided.
Concrete must be approximately of the same age, moisture conditions and same degree of
carbonation (note that carbonated surfaces yield higher rebound values). It is clear then that the
rebound number reflects only the surface of concrete. The results obtained are only
representative of the outer concrete layer with a thickness of 30–50 mm.

13
Principle:
The method is based on the principle that the rebound of an elastic mass
depends on the hardness of the surface against which mass strikes. When the plunger of rebound
hammer is pressed against the surface of the concrete, the spring controlled mass rebounds and
the extent of such rebound depends upon the surface hardness of concrete. The surface hardness
and therefore the rebound is taken to be related to the compressive strength of the concrete. The
rebound value is read off along a graduated scale and is designated as the rebound number or
rebound index. The compressive strength can be read directly from the graph provided on the
body of the hammer.
The impact energy required for rebound hammer for different applications is given below –
Table 2.1 Impact Energy of Rebound Hammers
Depending upon the impact energy, the hammers are classified into four
types i.e. N, L, M & P. Type N hammer having an impact energy of 2.2 N-m and is suitable for
grades of concrete from M-15 to M-45. Type L hammer is suitable for lightweight concrete or
small and impact sensitive part of the structure. Type M hammer is generally recommended for
heavy structures and mass concrete. Type P is suitable for concrete below M15 grade.
14
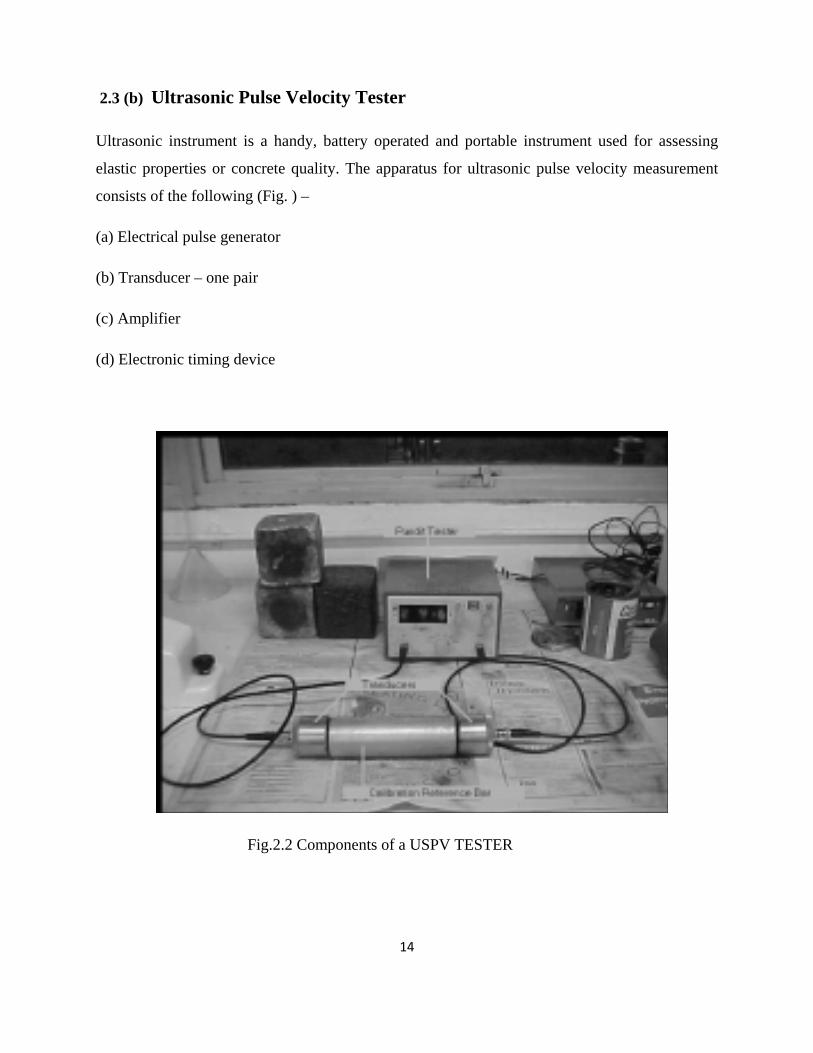
2.3 (b) Ultrasonic Pulse Velocity Tester
Ultrasonic instrument is a handy, battery operated and portable instrument used for assessing
elastic properties or concrete quality. The apparatus for ultrasonic pulse velocity measurement
consists of the following (Fig. ) –
(a) Electrical pulse generator
(b) Transducer – one pair
(c) Amplifier
(d) Electronic timing device
Fig.2.2 Components of a USPV TESTER

15
Objective:
The ultrasonic pulse velocity method could be used to establish:
(a) the homogeneity of the concrete
(b) the presence of cracks, voids and other imperfections
(c) change in the structure of the concrete which may occur with time
(d) the quality of concrete in relation to standard requirement
(e) the quality of one element of concrete in relation to another
(f) the values of dynamic elastic modulus of the concrete
Principle
The method is based on the principle that the velocity of an ultrasonic pulse through any material
depends upon the density, modulus of elasticity and Poisson’s ratio of the material.
Comparatively higher velocity is obtained when concrete quality is good in terms of density,
uniformity, homogeneity etc. The ultrasonic pulse is generated by an electro acoustical
transducer. When the pulse is induced into the concrete from a transducer, it undergoes multiple
reflections at the boundaries of the different material phases within the concrete. A complex
system of stress waves is developed which includes longitudinal (compression), shear
(transverse) and surface (Reyleigh) waves. The receiving transducer detects the onset of
longitudinal waves which is the fastest. The velocity of the pulses is almost independent of the
geometry of the material through which they pass and depends only on its elastic properties.
Pulse velocity method is a convenient technique for investigating structural concrete. For good
quality concrete pulse velocity will be higher and for poor quality it will be less. If there is a
crack, void or flaw inside the concrete which comes in the way of transmission of the pulses, the
pulse strength is attenuated and it passed around the discontinuity, thereby making the path
length longer. Consequently, lower velocities are obtained. The actual pulse velocity obtained
depends primarily upon the materials and mix proportions of concrete. Density and modulus of
elasticity of aggregate also significantly affects the pulse velocity. Any suitable type of

16
transducer operating within the frequency range of 20 KHz to 150 KHz may be used.
Piezoelectric and magneto-strictive types of transducers may be used and the latter being more
suitable for the lower part of the frequency range.
The electronic timing device should be capable of measuring the time
interval elapsing between the onset of a pulse generated at the transmitting transducer and onset
of its arrival at receiving transducer. Two forms of the electronic timing apparatus are possible,
one of which use a cathode ray tube on which the leading edge of the pulse is displayed in
relation to the suitable time scale, the other uses an interval timer with a direct reading digital
display. If both the forms of timing apparatus are available, the interpretation of results becomes
more reliable.
The ultrasonic pulse velocity has been used on concrete for more than 60
years. Powers in 1938 and Obert in 1939 were the first to develop and extensively use the
resonance frequency method. Since then, ultrasonic techniques have been used for the
measurements of the various properties of concrete. Also, many international committees,
specifications and standards adopted the ultrasonic pulse velocity methods for evaluation of
concrete. The principle of the test is that the velocity of sound in a solid material, V, is a function
of the square root of the ratio of its modulus of elasticity, E, to its density, d, as given by the
following equation:
(1)
Where, g is the gravity acceleration. As noted in the previous equation, the velocity is dependent
on the modulus of elasticity of concrete. Monitoring modulus of elasticity for concrete through
results of pulse velocity is not normally recommended because concrete does not fulfill the
physical requirements for the validity of the equation normally used for calculations for
homogenous, isotropic and elastic materials
17
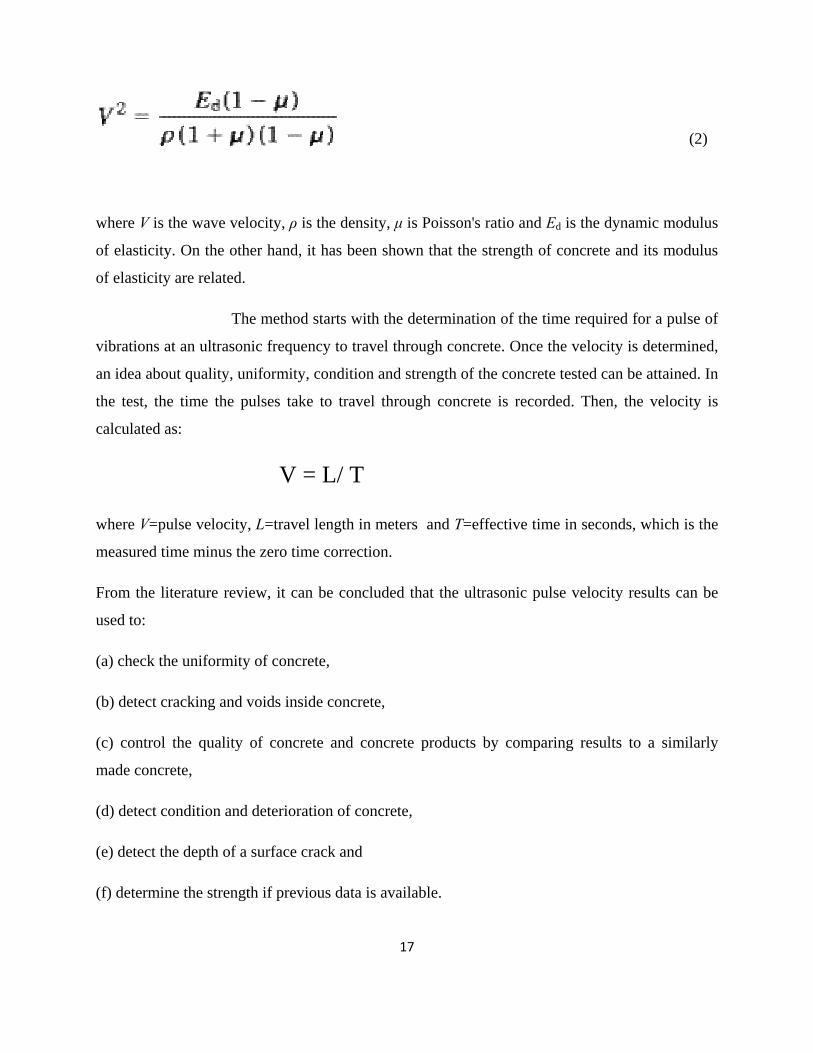
(2)
where V is the wave velocity, ρ is the density, µ is Poisson's ratio and Ed is the dynamic modulus
of elasticity. On the other hand, it has been shown that the strength of concrete and its modulus
of elasticity are related.
The method starts with the determination of the time required for a pulse of
vibrations at an ultrasonic frequency to travel through concrete. Once the velocity is determined,
an idea about quality, uniformity, condition and strength of the concrete tested can be attained. In
the test, the time the pulses take to travel through concrete is recorded. Then, the velocity is
calculated as:
V = L/ T
where V=pulse velocity, L=travel length in meters and T=effective time in seconds, which is the
measured time minus the zero time correction.
From the literature review, it can be concluded that the ultrasonic pulse velocity results can be
used to:
(a) check the uniformity of concrete,
(b) detect cracking and voids inside concrete,
(c) control the quality of concrete and concrete products by comparing results to a similarly
made concrete,
(d) detect condition and deterioration of concrete,
(e) detect the depth of a surface crack and
(f) determine the strength if previous data is available.

18
Factors influencing pulse velocity measurement
The pulse velocity depends on the properties of the concrete under test.
Various factors which can influence pulse velocity and its correlation with various physical
properties of concrete are as under:
Moisture Content:
The moisture content has chemical and physical effects on the pulse
velocity. These effects are important to establish the correlation for the estimation of concrete
strength. There may be significant difference in pulse velocity between a properly cured standard
cube and a structural element made from the same concrete. This difference is due to the effect
of different curing conditions and presence of free water in the voids. It is important that these
effects are carefully considered when estimating strength.
Temperature of Concrete:
No significant changes in pulse velocity, in strength or elastic properties
occur due to variations of the concrete temperature between 5° C and 30° C. Corrections to pulse
velocity measurements should be made for temperatures outside this range, as given in table
below:
Table 2.2 Effect of temperature on pulse transmission. BS 1881 (Pt 203 Year 1986)
19
Path Length:
The path length (the distance between two transducers) should be long
enough not to be significantly influenced by the heterogeneous nature of the concrete. It is
recommended that the minimum path length should be 100mm for concrete with 20mm or less
nominal maximum size of aggregate and 150mm for concrete with 20mm and 40mm nominal
maximum size of aggregate. The pulse velocity is not generally influenced by changes in path
length, although the electronic timing apparatus may indicate a tendency for slight reduction in
velocity with increased path length. This is because the higher frequency components of the
pulse are attenuated more than the lower frequency components and the shapes of the onset of
the pulses becomes more rounded with increased distance travelled. This apparent reduction in
velocity is usually small and well within the tolerance of time measurement accuracy.
Effect of Reinforcing Bars:
The pulse velocity in reinforced concrete in vicinity of rebars is usually
higher than in plain concrete of the same composition because the pulse velocity in steel is
almost twice to that in plain concrete. The apparent increase depends upon the proximity of
measurement to rebars, their numbers, diameter and their orientation. Whenever possible,
measurement should be made in such a way that steel does not lie in or closed to the direct path
between the transducers. If the same is not possible, necessary corrections needs to be applied.
The correction factors for this purpose are enumerated in different codes.
20
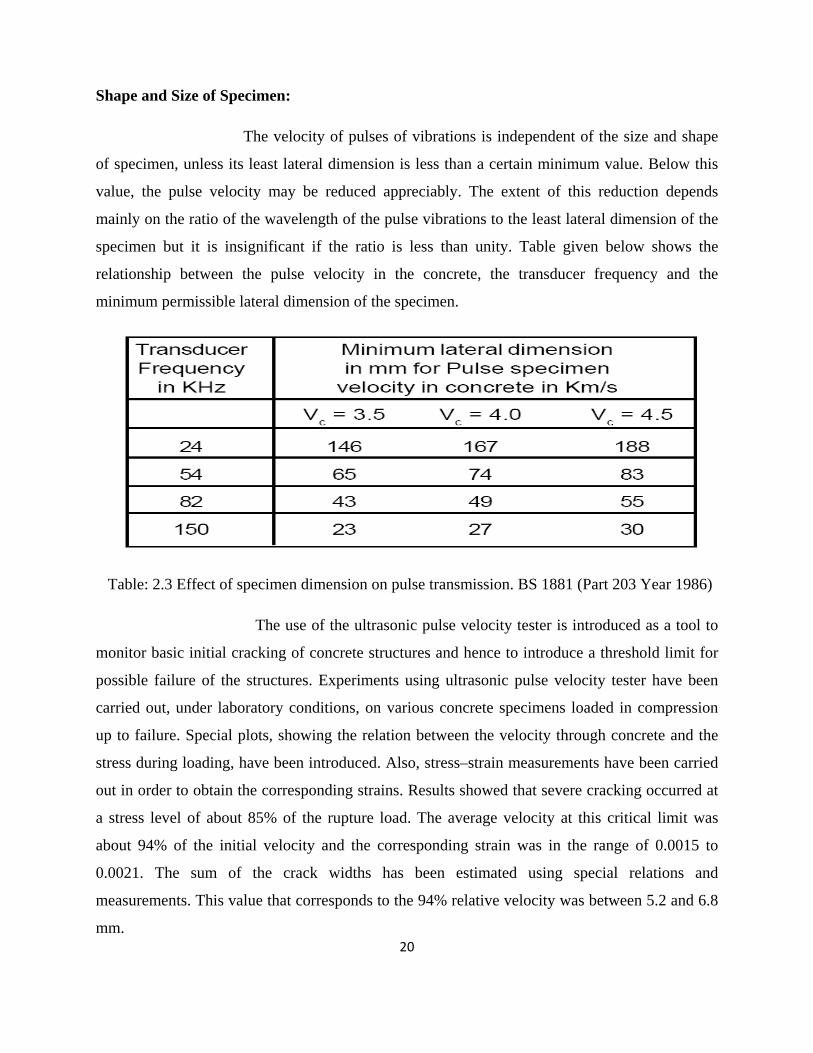
Shape and Size of Specimen:
The velocity of pulses of vibrations is independent of the size and shape
of specimen, unless its least lateral dimension is less than a certain minimum value. Below this
value, the pulse velocity may be reduced appreciably. The extent of this reduction depends
mainly on the ratio of the wavelength of the pulse vibrations to the least lateral dimension of the
specimen but it is insignificant if the ratio is less than unity. Table given below shows the
relationship between the pulse velocity in the concrete, the transducer frequency and the
minimum permissible lateral dimension of the specimen.
Table: 2.3 Effect of specimen dimension on pulse transmission. BS 1881 (Part 203 Year 1986)
The use of the ultrasonic pulse velocity tester is introduced as a tool to
monitor basic initial cracking of concrete structures and hence to introduce a threshold limit for
possible failure of the structures. Experiments using ultrasonic pulse velocity tester have been
carried out, under laboratory conditions, on various concrete specimens loaded in compression
up to failure. Special plots, showing the relation between the velocity through concrete and the
stress during loading, have been introduced. Also, stress–strain measurements have been carried
out in order to obtain the corresponding strains. Results showed that severe cracking occurred at
a stress level of about 85% of the rupture load. The average velocity at this critical limit was
about 94% of the initial velocity and the corresponding strain was in the range of 0.0015 to
0.0021. The sum of the crack widths has been estimated using special relations and
measurements. This value that corresponds to the 94% relative velocity was between 5.2 and 6.8
mm.

21
Chapter 3
TEST METHODOLOGY
22
TEST METHODOLOGY
3.1 REBOUND HAMMAR
Before commencement of a test, the rebound hammer should be tested
against the test anvil, to get reliable results. The testing anvil should be of steel having Brinell
hardness number of about 5000 N/mm2. The supplier/manufacturer of the rebound hammer
should indicate the range of readings on the anvil suitable for different types of rebound hammer.
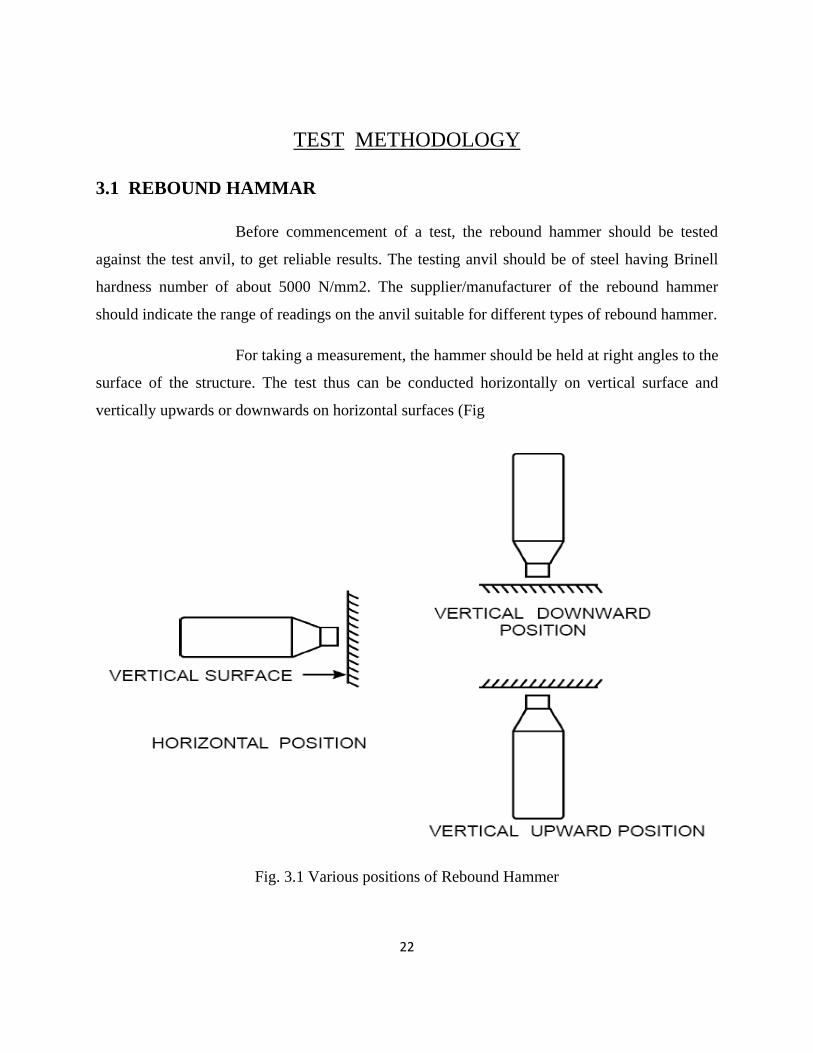
For taking a measurement, the hammer should be held at right angles to the
surface of the structure. The test thus can be conducted horizontally on vertical surface and
vertically upwards or downwards on horizontal surfaces (Fig
Fig. 3.1 Various positions of Rebound Hammer
23
If the situation so demands, the hammer can be held at intermediate angles
also, but in each case, the rebound number will be different for the same concrete.
The following should be observed during testing –
(a) The surface should be smooth, clean and dry
(b) The loosely adhering scale should be rubbed off with a grinding wheel or stone, before
testing
(c) The test should not be conducted on rough surfaces resulting from incomplete compaction,
loss of grout, spalled or tooled surfaces.
(d) The point of impact should be at least 20mm away from edge or shape discontinuity.
The ultrasonic pulse velocity results can be used:
(a) To check the uniformity of concrete,
(b) To detect cracking and voids inside concrete,
(c) To control the quality of concrete and concrete products by comparing results to a similarly
made concrete,
(d) To detect the condition and deterioration of concrete,
(e) To detect the depth of a surface crack, and,
(f) To determine the strength if previous data are available.
24
Procedure for obtaining correlation between Compressive Strength of Concrete and
Rebound Number :
The most satisfactory way of establishing a correlation between
compressive strength of concrete and its rebound number is to measure both the properties
simultaneously on concrete cubes. The concrete cubes specimens are held in a compression
testing machine under a fixed load, measurements of rebound number taken and then the
compressive strength determined as per IS 516: 1959. The fixed load required is of the order of 7
N/mm2 when the impact energy of the hammer is about 2.2 Nm. The load should be increased
for calibrating rebound hammers of greater impact energy and decreased for calibrating rebound
hammers of lesser impact energy. The test specimens should be as large a mass as possible in
order to minimize the size effect on the test result of a full scale structure. 150mm cube
specimens are preferred for calibrating rebound hammers of lower impact energy (2.2Nm),
whereas for rebound hammers of higher impact energy, for example 30 Nm, the test cubes
should not be smaller than 300mm.
If the specimens are wet cured, they should be removed from wet storage
and kept in the laboratory atmosphere for about 24 hours before testing. To obtain a correlation
between rebound numbers and strength of wet cured and wet tested cubes, it is necessary to
establish a correlation between he strength of wet tested cubes and the strength of dry tested
cubes on which rebound readings are taken. A direct correlation between rebound numbers on
wet cubes and the strength of wet cubes is not recommended. Only the vertical faces of the cubes
as cast should be tested. At least nine readings should be taken on each of the two vertical faces
accessible in the compression testing machine when using the rebound hammers. The points of
impact on the specimen must not be nearer an edge than 20mm and should be not less than
20mm from each other. The same points must not be impacted more than once.
25
3.2 Ultrasonic Pulse Velocity Tester
The equipment should be calibrated before starting the observation and at the end of test to
ensure accuracy of the measurement and performance of the equipment. It is done by measuring
transit time on a standard calibration rod supplied along with the equipment. A platform/staging
of suitable height should be erected to have an access to the measuring locations. The location of
measurement should be marked and numbered with chalk or similar thing prior to actual
measurement (pre decided locations).
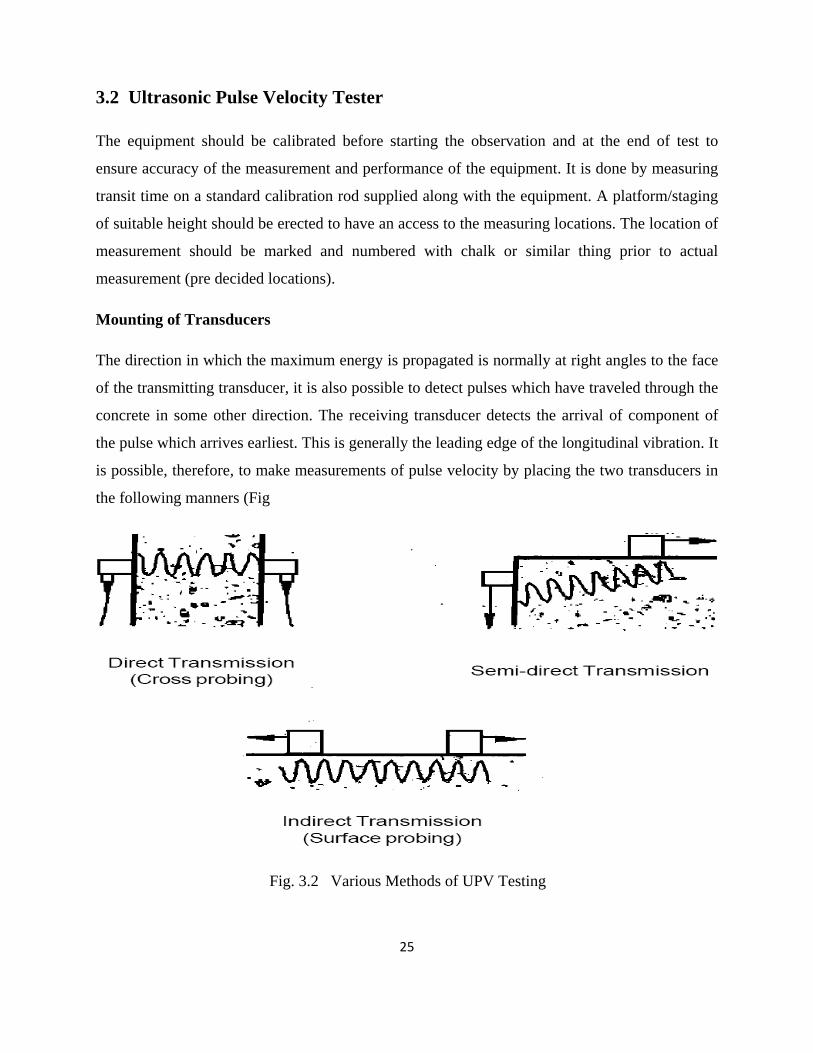
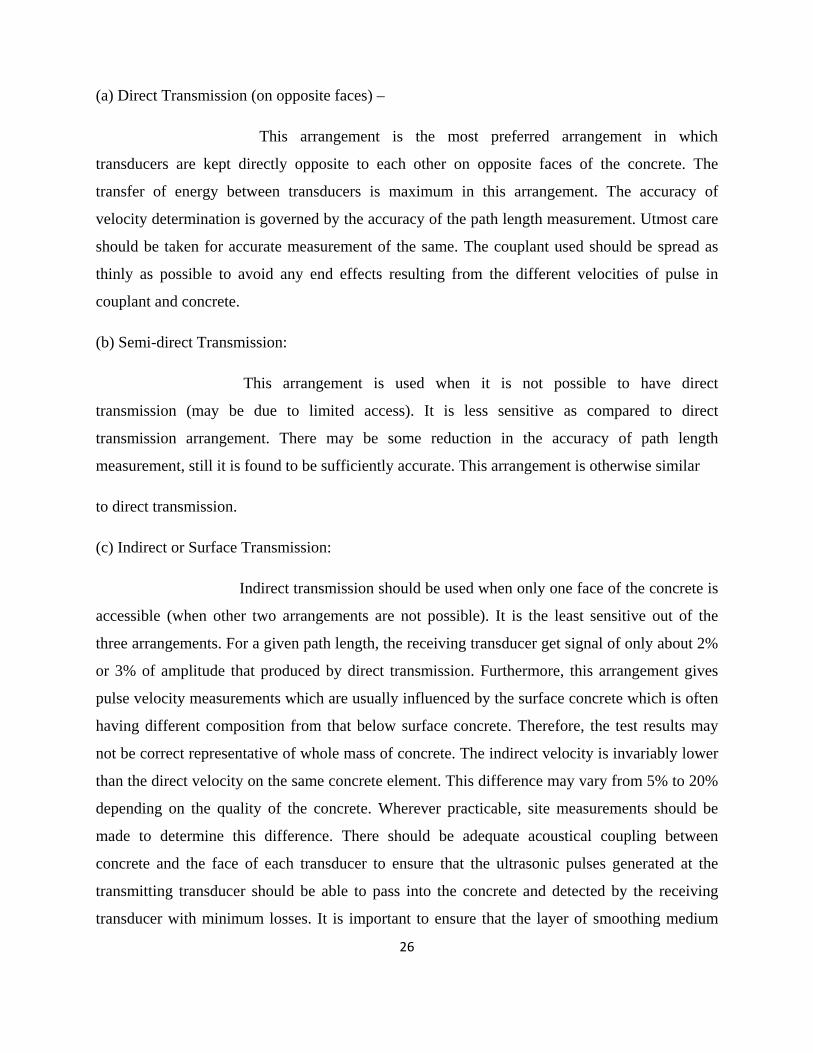
Mounting of Transducers
The direction in which the maximum energy is propagated is normally at right angles to the face
of the transmitting transducer, it is also possible to detect pulses which have traveled through the
concrete in some other direction. The receiving transducer detects the arrival of component of
the pulse which arrives earliest. This is generally the leading edge of the longitudinal vibration. It
is possible, therefore, to make measurements of pulse velocity by placing the two transducers in
the following manners (Fig
Fig. 3.2 Various Methods of UPV Testing
26
(a) Direct Transmission (on opposite faces) –
This arrangement is the most preferred arrangement in which
transducers are kept directly opposite to each other on opposite faces of the concrete. The
transfer of energy between transducers is maximum in this arrangement. The accuracy of
velocity determination is governed by the accuracy of the path length measurement. Utmost care
should be taken for accurate measurement of the same. The couplant used should be spread as
thinly as possible to avoid any end effects resulting from the different velocities of pulse in
couplant and concrete.
(b) Semi-direct Transmission:
This arrangement is used when it is not possible to have direct
transmission (may be due to limited access). It is less sensitive as compared to direct
transmission arrangement. There may be some reduction in the accuracy of path length
measurement, still it is found to be sufficiently accurate. This arrangement is otherwise similar
to direct transmission.
(c) Indirect or Surface Transmission:
Indirect transmission should be used when only one face of the concrete is
accessible (when other two arrangements are not possible). It is the least sensitive out of the
three arrangements. For a given path length, the receiving transducer get signal of only about 2%
or 3% of amplitude that produced by direct transmission. Furthermore, this arrangement gives
pulse velocity measurements which are usually influenced by the surface concrete which is often
having different composition from that below surface concrete. Therefore, the test results may
not be correct representative of whole mass of concrete. The indirect velocity is invariably lower
than the direct velocity on the same concrete element. This difference may vary from 5% to 20%
depending on the quality of the concrete. Wherever practicable, site measurements should be
made to determine this difference. There should be adequate acoustical coupling between
concrete and the face of each transducer to ensure that the ultrasonic pulses generated at the
transmitting transducer should be able to pass into the concrete and detected by the receiving
transducer with minimum losses. It is important to ensure that the layer of smoothing medium
27
should be as thin as possible. Couplant like petroleum jelly, grease, soft soap and kaolin/glycerol
paste are used as a coupling medium between transducer and concrete. Special transducers have
been developed which impart or pick up the pulse through integral probes having 6mm diameter
tips. A receiving transducer with a hemispherical tip has been found to be very successful. Other
transducer configurations have also been developed to deal with special circumstances. It should
be noted that a zero adjustment will almost certainly be required when special transducers are
used. Most of the concrete surfaces are sufficiently smooth. Uneven or rough surfaces, should be
smoothened using carborundum stone before placing of transducers. Alternatively, a smoothing
medium such as quick setting epoxy resin or plaster can also be used, but good adhesion between
concrete surface and smoothing medium has to be ensured so that the pulse is propagated with
minimum losses into the concrete. Transducers are then pressed against the concrete surface and
held manually. It is important that only a very thin layer of coupling medium separates the
surface of the concrete from its contacting transducer. The distance between the measuring
points should be accurately measured. Repeated readings of the transit time should be observed
until a minimum value is obtained.
Once the ultrasonic pulse impinges on the surface of the material, the
maximum energy is propagated at right angle to the face of the transmitting transducers and best
results are, therefore, obtained when the receiving transducer is placed on the opposite face of
the concrete member known as Direct Transmission. The pulse velocity can be measured by
Direct Transmission, Semi-direct Transmission and Indirect or Surface Transmission. Normally,
Direct Transmission is preferred being more reliable and standardized. (various codes gives
correlation between concrete quality and pulse velocity for Direct Transmission only). The size
of aggregates influences the pulse velocity measurement. The minimum path length should be
100mm for concrete in which the nominal maximum size of aggregate is 20mm or less and
150mm for aggregate size between 20mm and 40mm. Reinforcement, if present, should be
avoided during pulse velocity measurements, because the pulse velocity in the reinforcing bars is
usually higher than in plain concrete. This is because the pulse velocity in steel is 1.9 times of
that in concrete. In certain conditions, the first pulse to arrive at the receiving transducer travels
partly in concrete and partly in steel. The apparent increase in pulse velocity depends upon the
proximity of the measurements to the reinforcing bars, the diameter and number of bars and their

28
orientation with respect to the path of propagation. It is reported that the influence of
reinforcement is generally small if the bar runs in the direction right angle to the pulse path for
bar diameter less than12 mm. But if percentage of steel is quite high or the axis of the bars are
parallel to direction of propagation, then the correction factor has to be applied to the measured
values.
The zero time correction is equal to the travel time between the transmitting
and receiving transducers when they are pressed firmly together.

29
Determination of pulse velocity
A pulse of longitudinal vibration is produced by an electro acoustical
transducer, which is held in contact with one surface of the concrete member under test. After
traversing a known path length(L) in the concrete, the pulse of vibration is converted into an
electrical signal by a second electro-acoustical transducer, and electronic timing circuit enable
the transit time (T) of the pulse to be measured. The pulse velocity (V) is given by V = L / T
where,
V = Pulse velocity, L = Path length , T = Time taken by the pulse to traverse the path length
Fig.3.3 Testing of a beam by USPV Tester

30
Combined use of Rebound hammer and Ultrasonic Pulse Velocity Method
In view of the relative limitations of either of the two methods for
predicting the strength of concrete, both ultrasonic pulse velocity (UPV) and rebound hammer
methods are sometimes used in combination to alleviate the errors arising out of influence of
materials, mix and environmental parameters on the respective measurements. Relationship
between UPV, rebound hammer and compressive strength of concrete are available based on
laboratory test specimen. Better accuracy on the estimation of concrete strength is achieved by
use of such combined methods. However, this approach also has the limitation that the
established correlations are valid only for materials and mix having same proportion as used in
the trials. The intrinsic difference between the laboratory test specimen and in-situ concrete (e.g.
surface texture, moisture content, presence of reinforcement, etc.) also affect the accuracy of test
results.
Combination of UPV and rebound hammer methods can be used for the
assessment of the quality and likely compressive strength of in-situ concrete. Assessment of
likely compressive strength of concrete is made from the rebound indices and this is taken to be
indicative of the entire mass only when the overall quality of concrete judged by the UPV is
‘good’. When the quality assessed is ‘medium’, the estimation of compressive strength by
rebound indices is extended to the entire mass only on the basis of other collateral measurement
e.g. strength of controlled cube specimen, cement content of hardened concrete by chemical
analysis or concrete core testing. When the quality of concrete is ‘poor’, no assessment of the
strength of concrete is made from rebound indices.

31
Chapter 4
AIM OF THE PROJECT

32
AIM OF THE PROJECT
The aim of the project was to obtain the Calibration Graphs for Non
Destructive Testing Equipments viz., the Rebound Hammer and Ultrasonic pulse Velocity Tester
and to study the effect of reinforcement on the obtained results. These Non Destructive
Instruments were then used to test the columns, beams and slabs of two double storied
buildings viz., Hall No.2 and Hall no.7 ( a newly constructed hostel ) in N I T Rourkela.

33
Chapter 5
TEST RESULTS AND DISCUSSION
34
5.1 CALIBRATION TESTS
PROCEDURE:
The procedure that was followed during experiments consisted of the following steps:
1. Various concrete mixes were used to prepare standard cubes of 150-mm side length.
2. Concrete cubes of unknown history made under site conditions were also brought from various sites for testing.
3. All cubes were immersed under water for a minimum period of 24 h before testing.
4. Just before testing, the cubes were rubbed with a clean dry cloth in order to obtain a saturated surface dry sample.
5. Once drying was complete, each of the two opposite faces of the cube were prepared for the rebound hammer test as described in the specifications.
6. The cubes were positioned in the testing machine and a slight load was applied. The rebound number was obtained by taking three measurements on each of the four faces of the cube. The rebound hammer was horizontal in all measurements.
7. Once the rebound hammer test was complete, each of the two surfaces was prepared for the ultrasonic pulse velocity test as described in the specifications. Care was taken so that there was no effect of the notches produced by the hammer. The time was measured on each of the two opposing surfaces and the average was recorded.
8. Once nondestructive testing on each cube was completed, the cube was loaded to failure and the maximum load was recorded.
9. Results were plotted as shown in Figures.
35
5.2 REBOUND HAMMER TEST
PREPARATION OF SPECIMEN:
6 cubes were cast, targeting at different mean strengths. Further, the cubes were cured for
different number of days to ensure availability of a wide range of compressive strength
attained by these cubes. Size of each cube was 150×150×150 mm.
TESTING OF SPECIMEN:
10 readings (rebound numbers) were obtained for each cube, at different locations on the
surface of the specimen.
The cube was divided into grid blocks of equal spacing and 10 points were marked at
equal intervals for taking the Rebound Hammer test.
The cubes were then given a load of 7 N/mm^2 (as specified by the IS CODE 13311 ) in
the Compression Testing Machine and the Rebound Values were obtained.
The cubes were then loaded up to their ultimate stress and the Breaking Load was
obtained.
The following tables lists the Rebound numbers (rebound index), Mean Rebound Value,
Standard Deviation, the Dead Load on the specimen at the time of testing, the Breaking
Load, the Predicted Compressive Strength as predicted by the Rebound Hammer and the
actual Compressive Strength as obtained by the Compression Testing Machine.
36
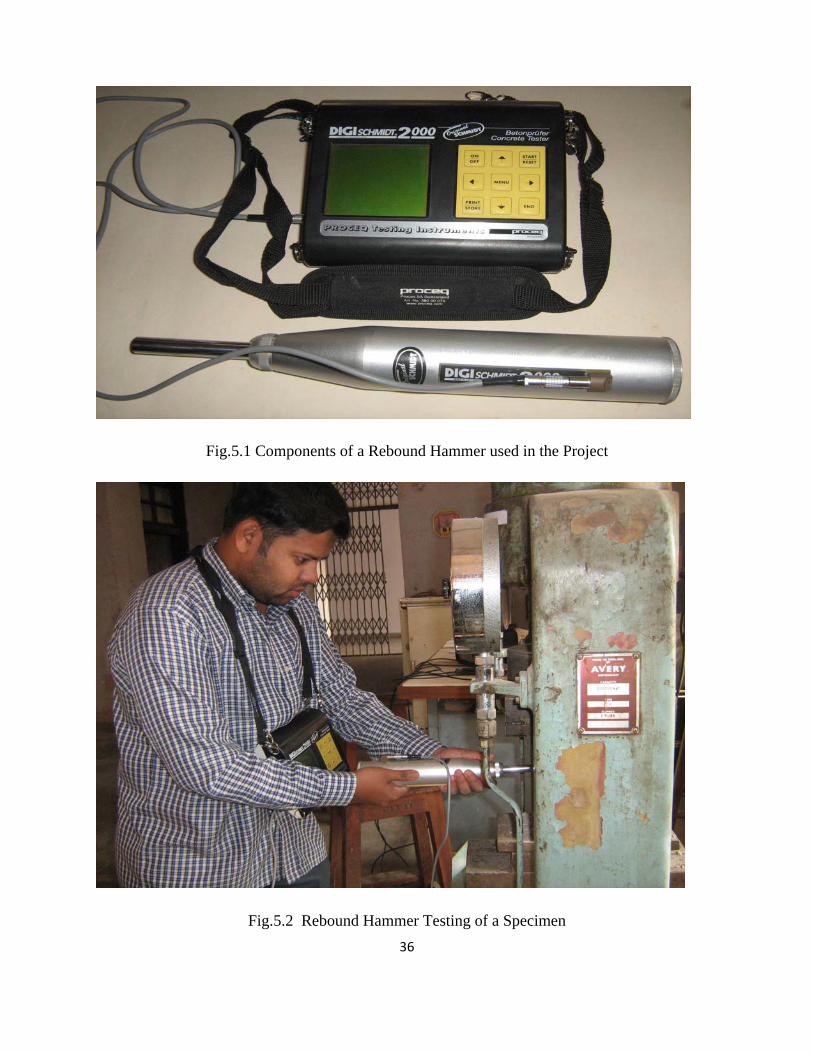
Fig.5.1 Components of a Rebound Hammer used in the Project
Fig.5.2 Rebound Hammer Testing of a Specimen
37
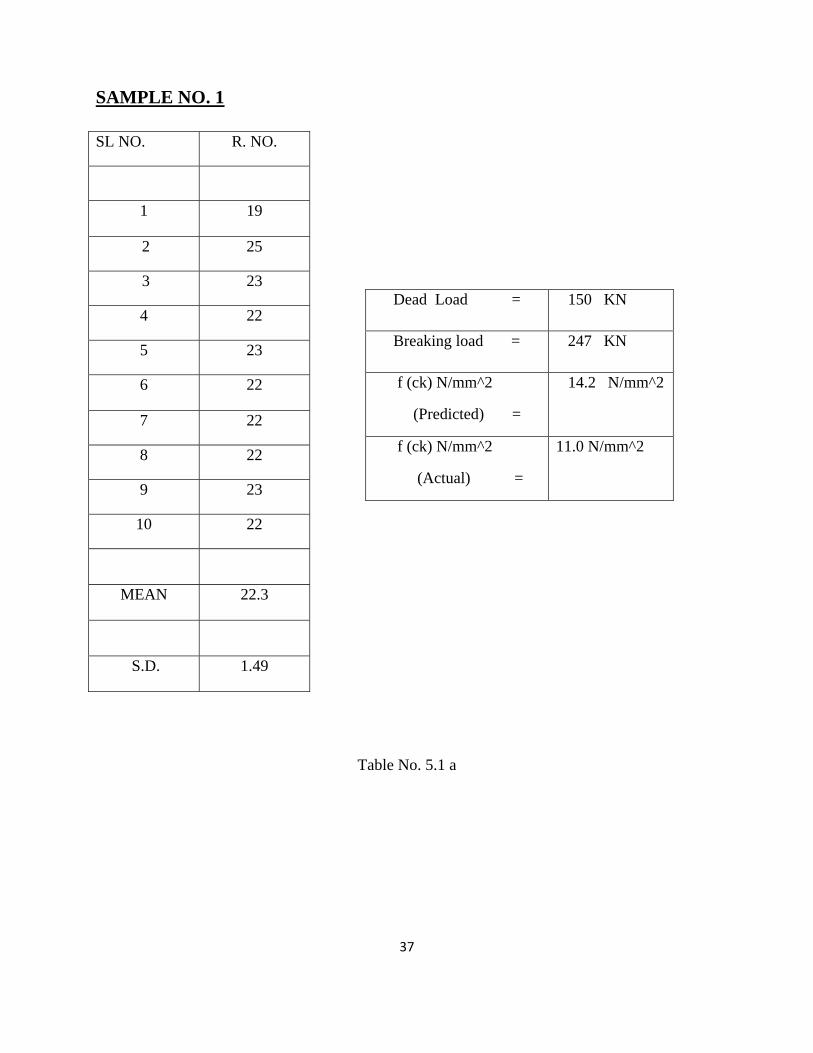
SAMPLE NO. 1
SL NO. R. NO.
1 19
2 25
3 23
4 22
5 23
6 22
7 22
8 22
9 23
10 22
MEAN 22.3
S.D. 1.49
Table No. 5.1 a
Dead Load = 150 KN
Breaking load = 247 KN
f (ck) N/mm^2
(Predicted) =
14.2 N/mm^2
f (ck) N/mm^2
(Actual) =
11.0 N/mm^2

38
SAMPLE NO. 2
SL NO. R. NO.
1 19
2 20
3 19
4 20
5 19
6 20
7 19
8 20
9 19
10 22
MEAN 19.7
S.D. 0.94
Table No. 5.1 b
Dead Load = 150 KN
Breaking load = 311.5 KN
f (ck) N/mm^2
(Predicted) =
13.2 N/mm^2
f (ck) N/mm^2
(Actual) =
13.8 N/mm^2
39
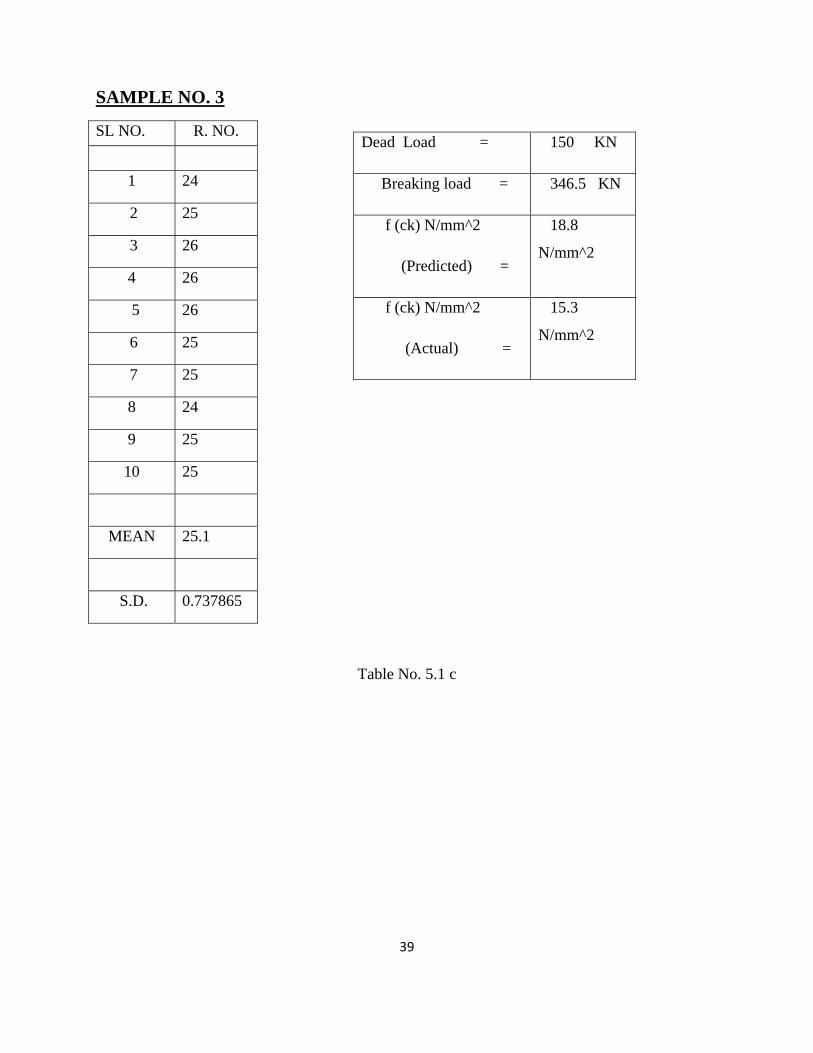
SAMPLE NO. 3
SL NO. R. NO.
1 24
2 25
3 26
4 26
5 26
6 25
7 25
8 24
9 25
10 25
MEAN 25.1
S.D. 0.737865
Table No. 5.1 c
Dead Load = 150 KN
Breaking load = 346.5 KN
f (ck) N/mm^2
(Predicted) =
18.8
N/mm^2
f (ck) N/mm^2
(Actual) =
15.3
N/mm^2

40
SAMPLE NO. 4
SL NO. R. NO.
1 42
2 42
3 41
4 42
5 42
6 42
7 43
8 43
9 43
10 42
MEAN 42.2
S.D. 0.63
Table No. 5.1 d
Dead Load = 150 KN
Breaking load = 830 KN
f (ck) N/mm^2
(Predicted) =
42.6 N/mm^2
f (ck) N/mm^2
(Actual) =
36.88 N/mm^2
41
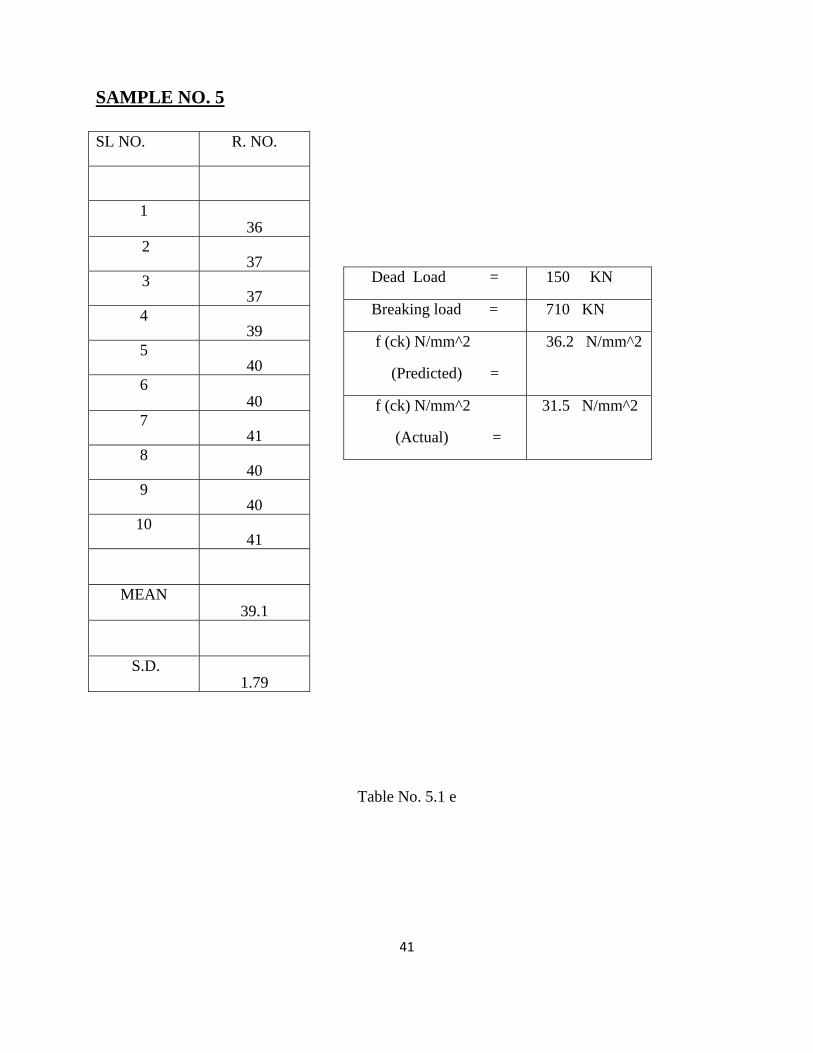
SAMPLE NO. 5
SL NO. R. NO.
1 36
2 37
3 37
4 39
5 40
6 40
7 41
8 40
9 40
10 41
MEAN 39.1
S.D. 1.79
Table No. 5.1 e
Dead Load = 150 KN
Breaking load = 710 KN
f (ck) N/mm^2
(Predicted) =
36.2 N/mm^2
f (ck) N/mm^2
(Actual) =
31.5 N/mm^2

42
SAMPLE NO. 6
SL NO. R. NO.
1 38
2 38
3 37
4 37
5 38
6 38
7 37
8 37
9 38
10 38
MEAN 37.6
S.D. 0.516398
Table No. 5.1 f
Dead Load = 150 KN
Breaking load = 760 KN
f (ck) N/mm^2
(Predicted) =
39.7 N/mm^2
f (ck) N/mm^2
(Actual) =
33.8 N/mm^2
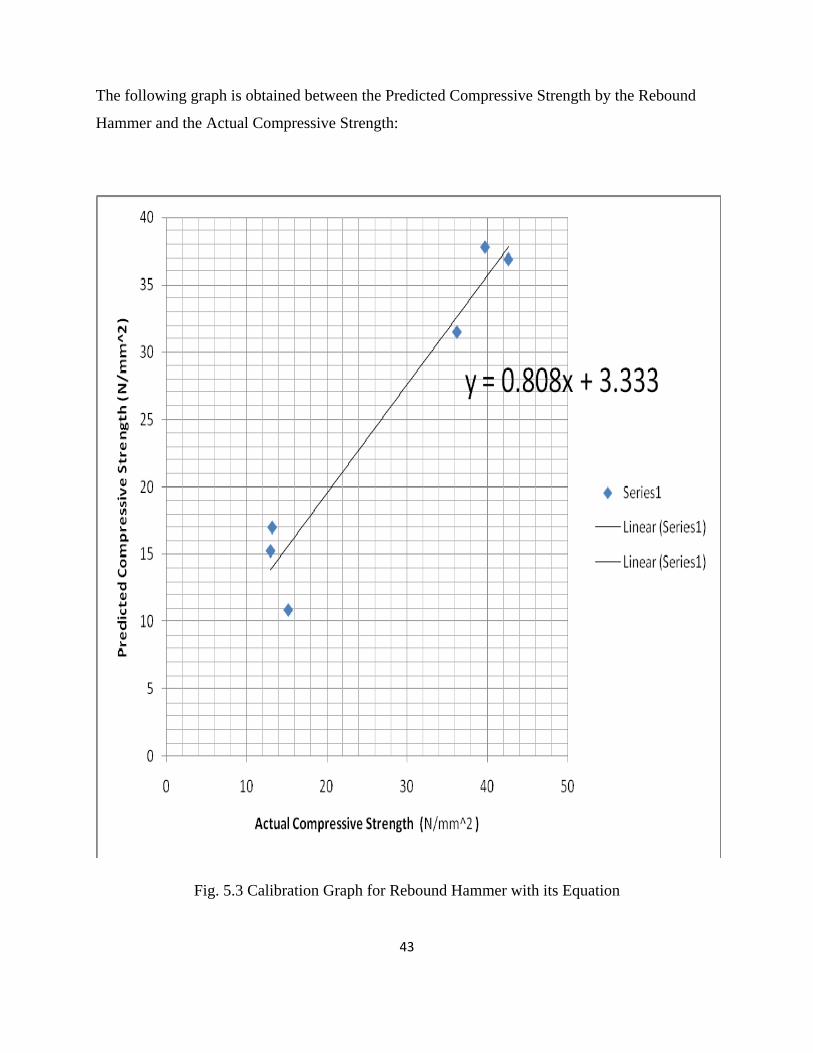
43
The following graph is obtained between the Predicted Compressive Strength by the Rebound
Hammer and the Actual Compressive Strength:
Fig. 5.3 Calibration Graph for Rebound Hammer with its Equation
44
Ultrasonic Velocity Testing Machine
PREPARATION OF SPECIMEN
9 cubes were cast, targeting at different mean strengths. Further, the cubes were cured for
different number of days to ensure availability of a wide range of compressive strength attained
by these cubes. Size of each cube was 150×150×150 mm.
TESTING OF SPECIMEN:
3 readings of Ultrasonic Pulse Velocity (USPV) were obtained for each cube.
The cubes were then given a load of 7 N/mm^2 (as specified by the IS CODE 13311 ) in the
Compression Testing Machine and the USPV were obtained.
The cubes were then loaded up to their ultimate stress and the Breaking Load was obtained.
The following table lists the USPV in each specimen with their mean velocity, the Dead Load,
the Breaking Load and the actual Compressive Strength as obtained by the Compression Testing
Machine.
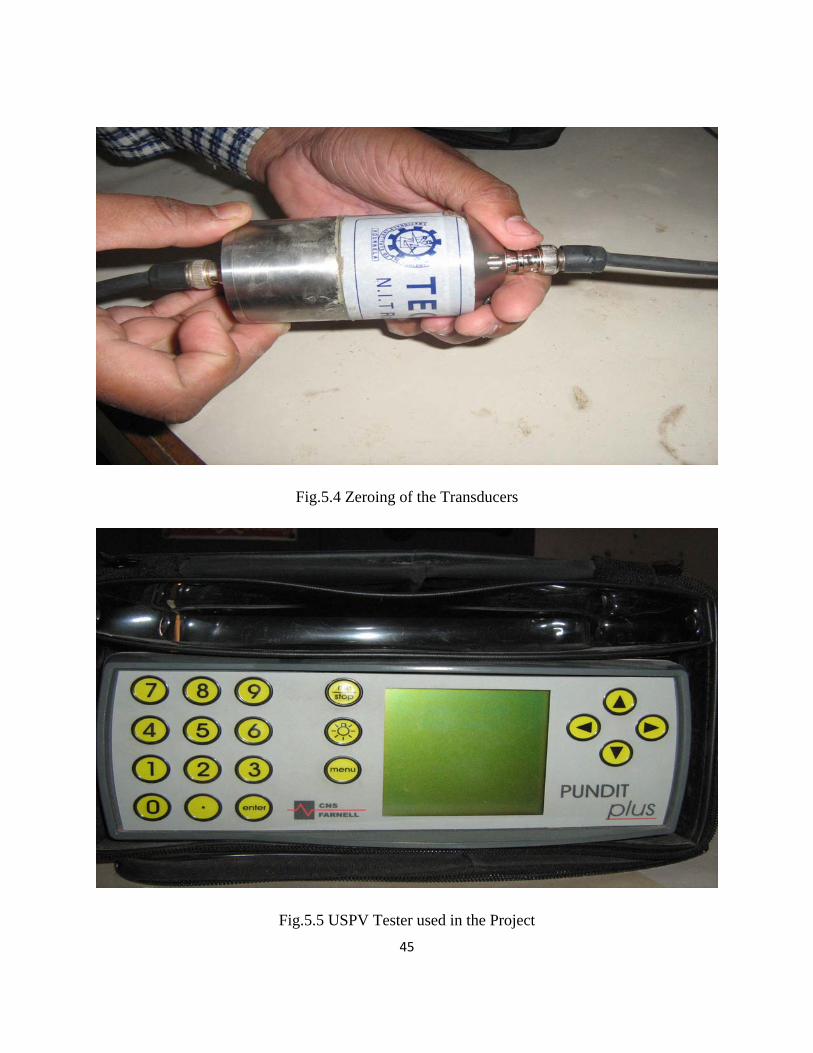
45
Fig.5.4 Zeroing of the Transducers
Fig.5.5 USPV Tester used in the Project
46
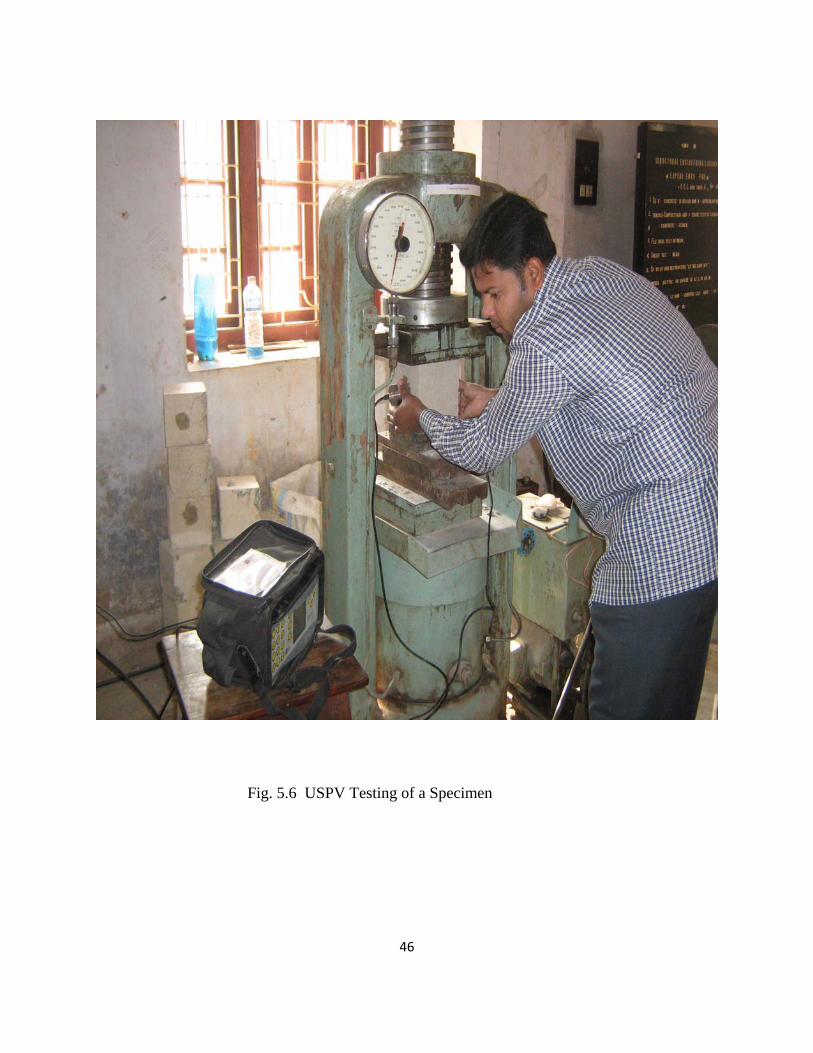
Fig. 5.6 USPV Testing of a Specimen

47
OBSERVATIONS
SAMPLE NO. V1 V2 V3 V
BREAKING f (ck) N/mm^2
(m/sec) (m/sec) (m/sec) (m/sec) I R LOAD LOAD (Actual)
(Avg) KN KN 1 2825 2916 2913 2884.667 150 562.5 25
2 3350 3585 3218 3384.333 150 669.8 29.77
3 3625 3632 3218 3491.667 150 720 32
4 4219 4213 4007 4146.333 150 841.5 37.4
5 4411 4444 4117 4324 150 875.2 38.9
6 4625 4525 4417 4522.333 150 893.2 39.7
Table 5.2 USPV Testing Results

48
The following graph is obtained between the Compressive Strength and the Ultrasonic Pulse
Velocity:
Fig. 5.7 Graph obtained for USPV Testing
This graph can now also be used to approximately predict the Compressive Strength of Concrete.
Although it gives fairly approximate results but it should be verified with some other tests like
the Rebound Hammer test.
49
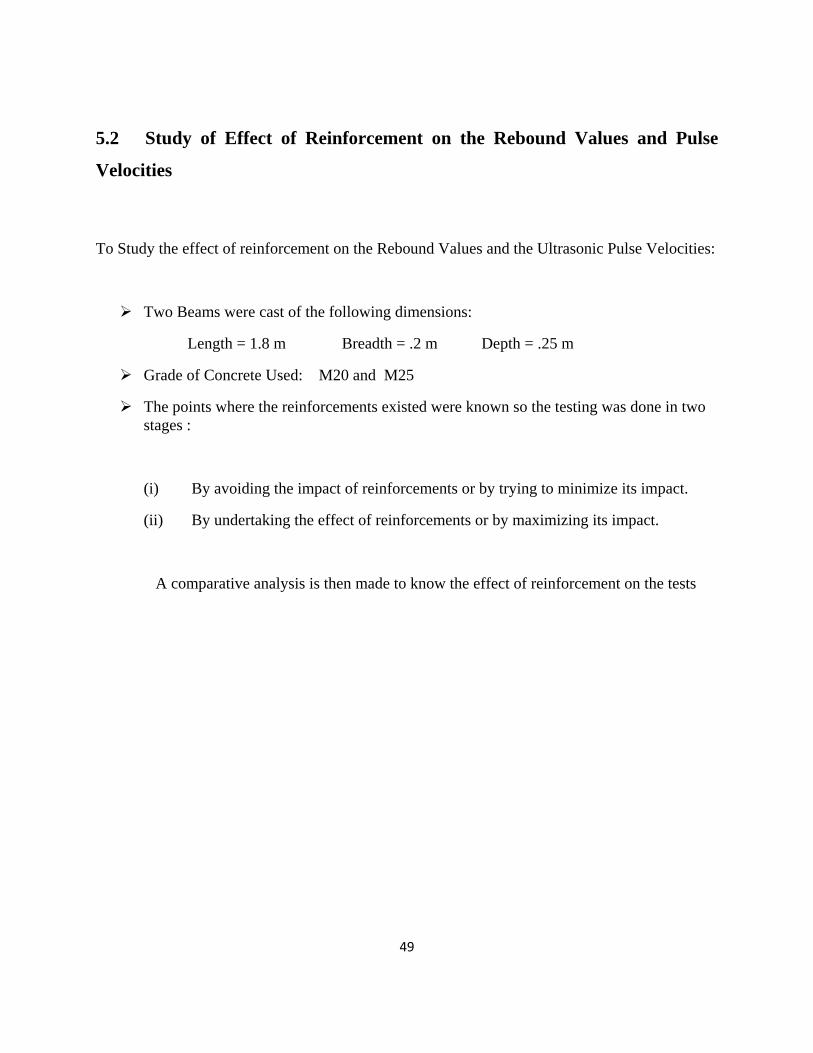
5.2 Study of Effect of Reinforcement on the Rebound Values and Pulse
Velocities
To Study the effect of reinforcement on the Rebound Values and the Ultrasonic Pulse Velocities:
Two Beams were cast of the following dimensions:
Length = 1.8 m Breadth = .2 m Depth = .25 m
Grade of Concrete Used: M20 and M25
The points where the reinforcements existed were known so the testing was done in two stages :
(i) By avoiding the impact of reinforcements or by trying to minimize its impact.
(ii) By undertaking the effect of reinforcements or by maximizing its impact.
A comparative analysis is then made to know the effect of reinforcement on the tests
50
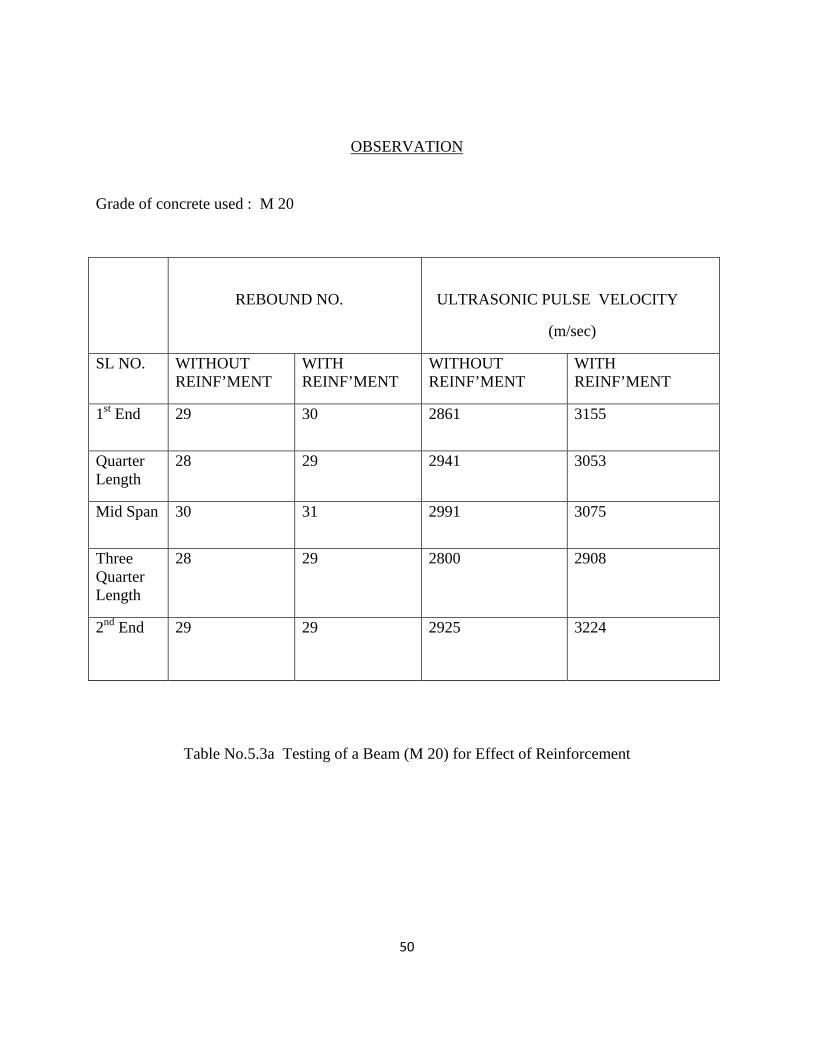
OBSERVATION
Grade of concrete used : M 20
REBOUND NO.
ULTRASONIC PULSE VELOCITY
(m/sec)
SL NO. WITHOUT REINF’MENT
WITH REINF’MENT
WITHOUT REINF’MENT
WITH REINF’MENT
1st End 29 30 2861 3155
Quarter Length
28 29 2941 3053
Mid Span 30 31 2991 3075
Three Quarter Length
28 29 2800 2908
2nd End 29 29 2925 3224
Table No.5.3a Testing of a Beam (M 20) for Effect of Reinforcement
51
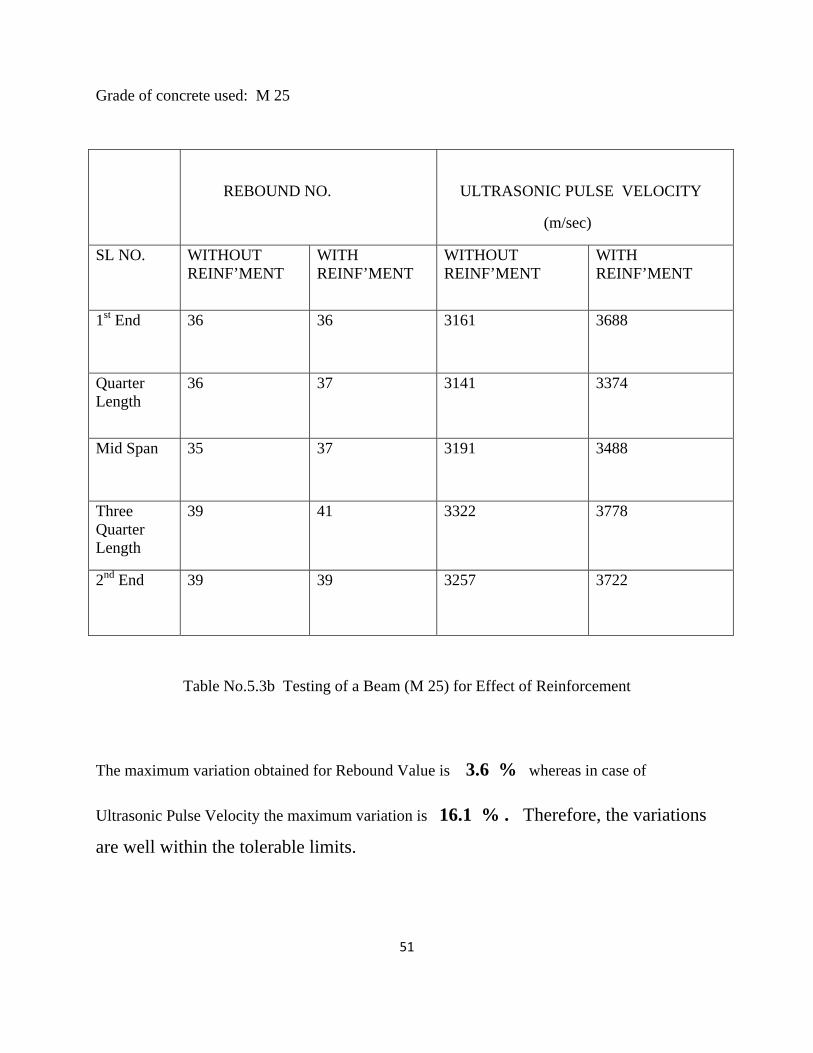
Grade of concrete used: M 25
REBOUND NO.
ULTRASONIC PULSE VELOCITY
(m/sec)
SL NO. WITHOUT REINF’MENT
WITH REINF’MENT
WITHOUT REINF’MENT
WITH REINF’MENT
1st End 36 36 3161 3688
Quarter Length
36 37 3141 3374
Mid Span 35 37 3191 3488
Three Quarter Length
39 41 3322 3778
2nd End 39 39 3257 3722
Table No.5.3b Testing of a Beam (M 25) for Effect of Reinforcement
The maximum variation obtained for Rebound Value is 3.6 % whereas in case of
Ultrasonic Pulse Velocity the maximum variation is 16.1 % . Therefore, the variations
are well within the tolerable limits.
52
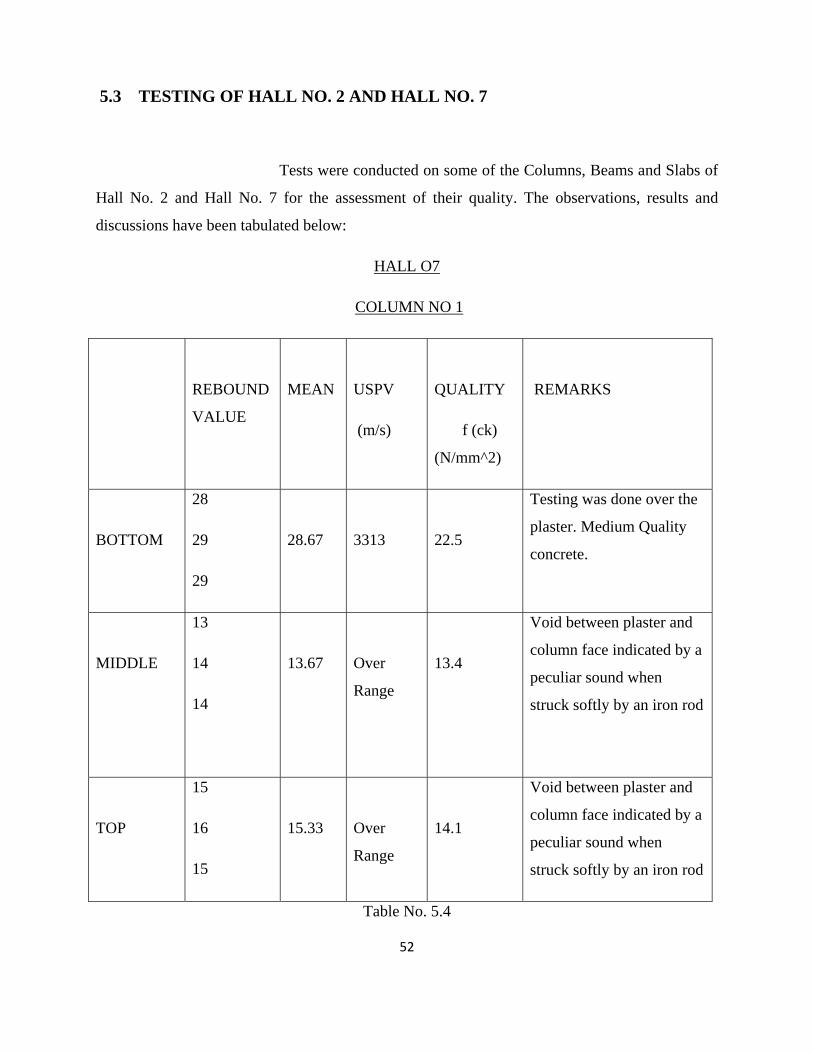
5.3 TESTING OF HALL NO. 2 AND HALL NO. 7
Tests were conducted on some of the Columns, Beams and Slabs of
Hall No. 2 and Hall No. 7 for the assessment of their quality. The observations, results and
discussions have been tabulated below:
HALL O7
COLUMN NO 1
REBOUND
VALUE
MEAN
USPV
(m/s)
QUALITY
f (ck)
(N/mm^2)
REMARKS
BOTTOM
28
29
29
28.67
3313
22.5
Testing was done over the
plaster. Medium Quality
concrete.
MIDDLE
13
14
14
13.67
Over
Range
13.4
Void between plaster and
column face indicated by a
peculiar sound when
struck softly by an iron rod
TOP
15
16
15
15.33
Over
Range
14.1
Void between plaster and
column face indicated by a
peculiar sound when
struck softly by an iron rod
Table No. 5.4
53
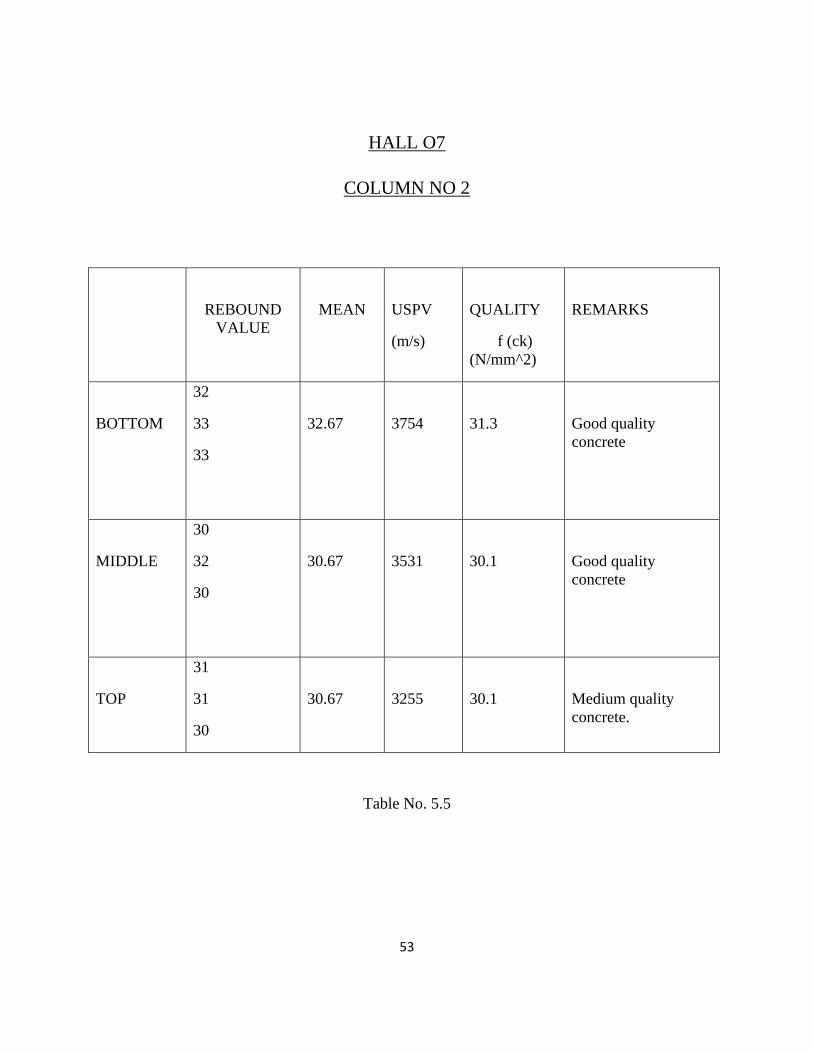
HALL O7
COLUMN NO 2
REBOUND VALUE
MEAN
USPV
(m/s)
QUALITY
f (ck) (N/mm^2)
REMARKS
BOTTOM
32
33
33
32.67
3754
31.3
Good quality concrete
MIDDLE
30
32
30
30.67
3531
30.1
Good quality concrete
TOP
31
31
30
30.67
3255
30.1
Medium quality concrete.
Table No. 5.5
54
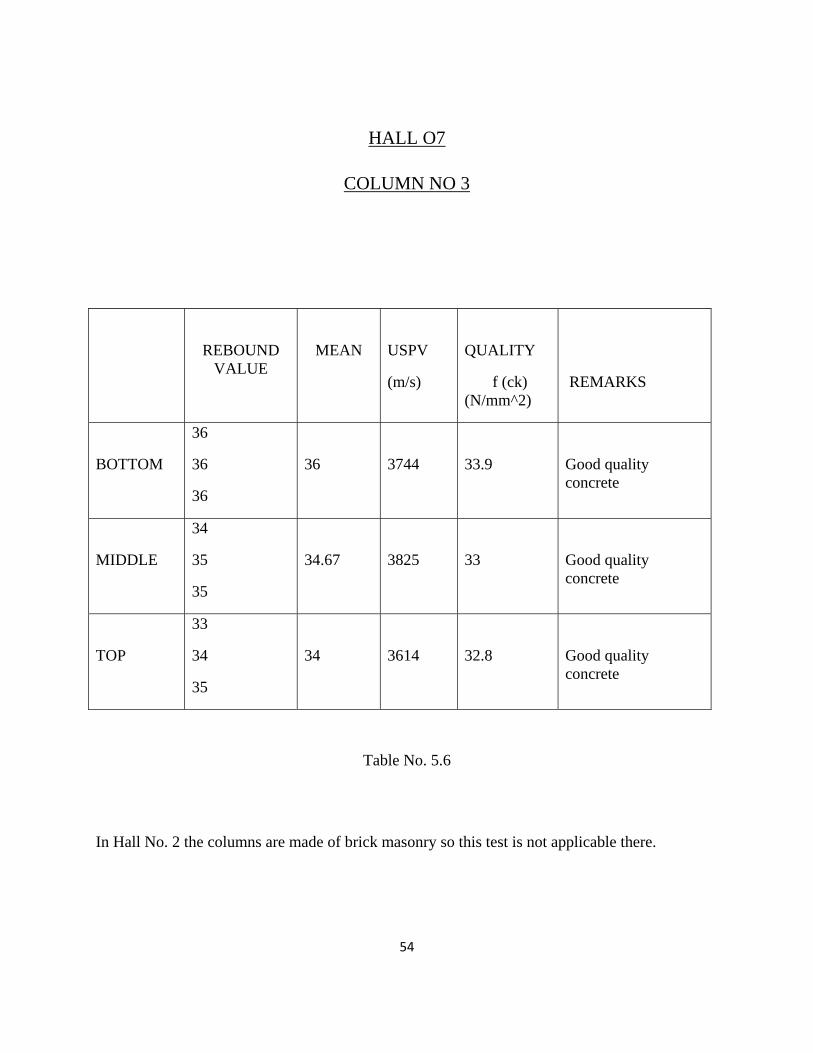
HALL O7
COLUMN NO 3
REBOUND VALUE
MEAN
USPV
(m/s)
QUALITY
f (ck) (N/mm^2)
REMARKS
BOTTOM
36
36
36
36
3744
33.9
Good quality concrete
MIDDLE
34
35
35
34.67
3825
33
Good quality concrete
TOP
33
34
35
34
3614
32.8
Good quality concrete
Table No. 5.6
In Hall No. 2 the columns are made of brick masonry so this test is not applicable there.
55
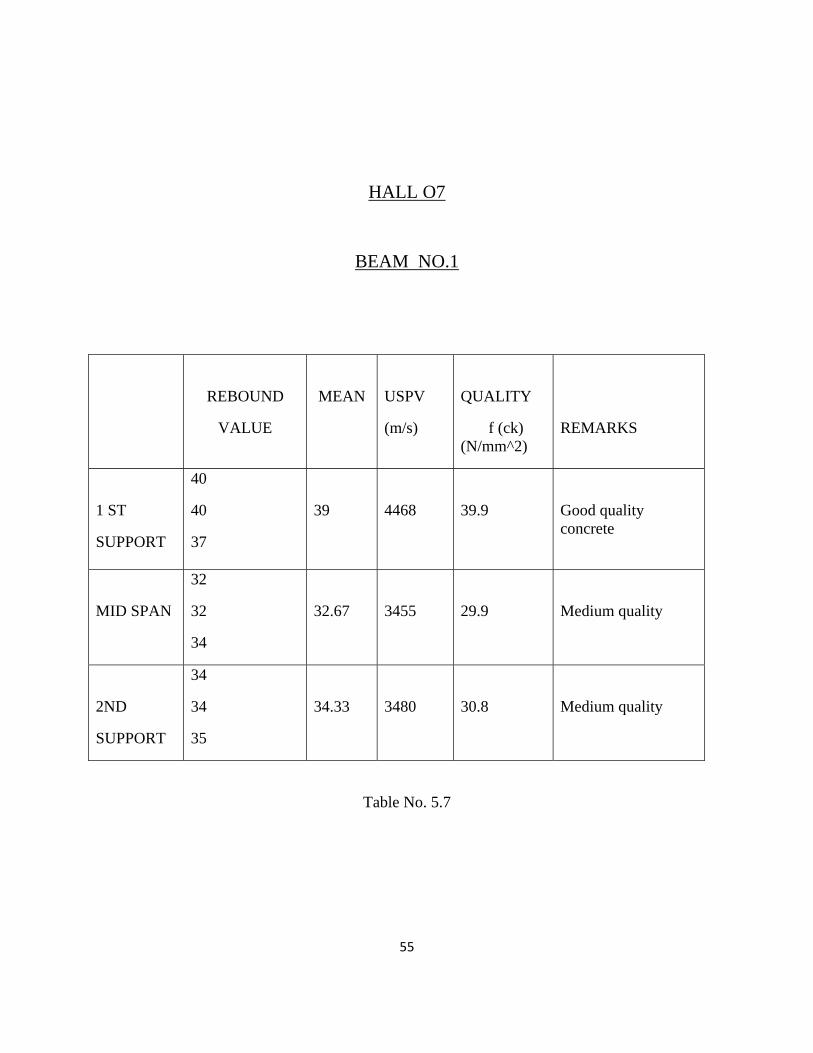
HALL O7
BEAM NO.1
REBOUND
VALUE
MEAN
USPV
(m/s)
QUALITY
f (ck) (N/mm^2)
REMARKS
1 ST
SUPPORT
40
40
37
39
4468
39.9
Good quality concrete
MID SPAN
32
32
34
32.67
3455
29.9
Medium quality
2ND
SUPPORT
34
34
35
34.33
3480
30.8
Medium quality
Table No. 5.7
56
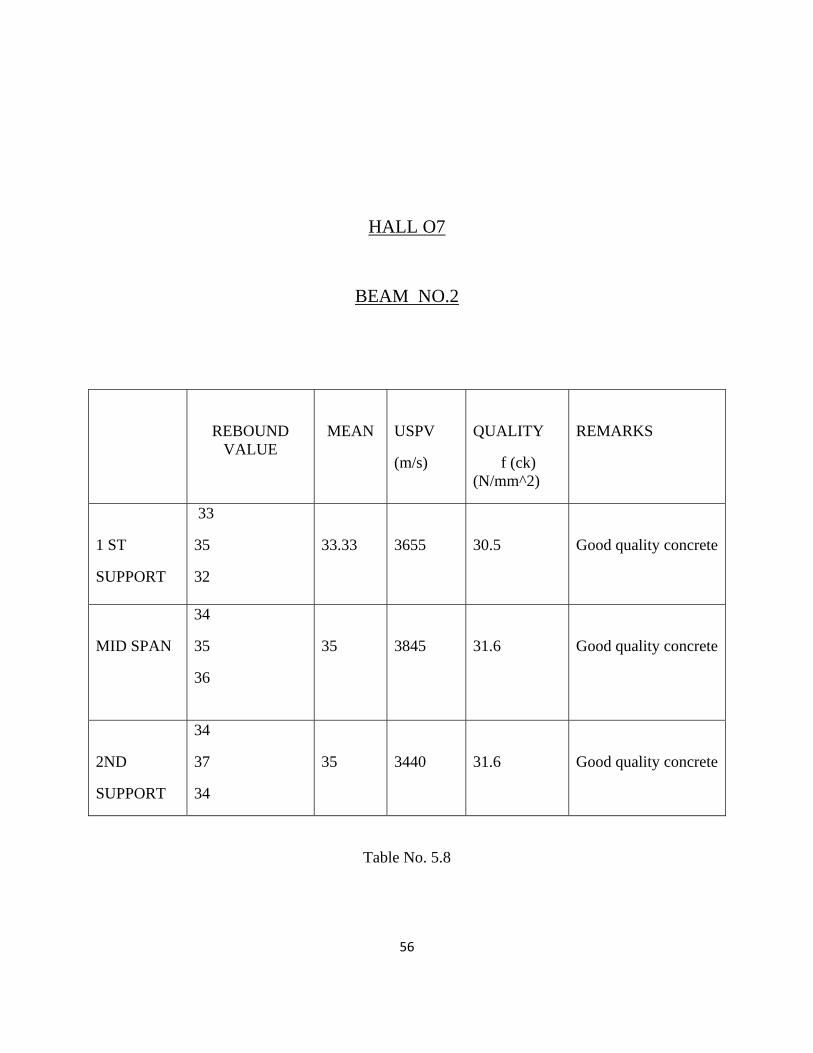
HALL O7
BEAM NO.2
REBOUND VALUE
MEAN
USPV
(m/s)
QUALITY
f (ck) (N/mm^2)
REMARKS
1 ST
SUPPORT
33
35
32
33.33
3655
30.5
Good quality concrete
MID SPAN
34
35
36
35
3845
31.6
Good quality concrete
2ND
SUPPORT
34
37
34
35
3440
31.6
Good quality concrete
Table No. 5.8
57
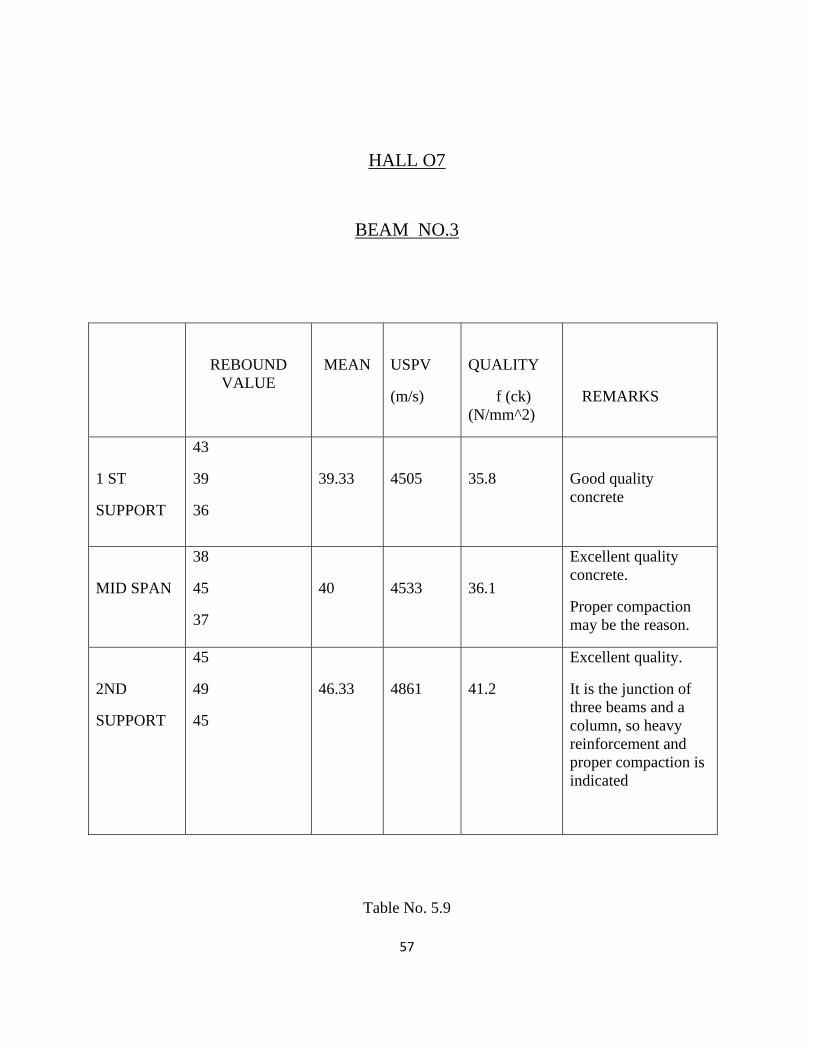
HALL O7
BEAM NO.3
REBOUND VALUE
MEAN
USPV
(m/s)
QUALITY
f (ck) (N/mm^2)
REMARKS
1 ST
SUPPORT
43
39
36
39.33
4505
35.8
Good quality concrete
MID SPAN
38
45
37
40
4533
36.1
Excellent quality concrete.
Proper compaction may be the reason.
2ND
SUPPORT
45
49
45
46.33
4861
41.2
Excellent quality.
It is the junction of three beams and a column, so heavy reinforcement and proper compaction is indicated
Table No. 5.9

58
HALL O2
BEAM NO.1
REBOUND VALUE
MEAN
USPV
(m/s)
QUALITY
f (ck) (N/mm^2)
REMARKS
1 ST
SUPPORT
26
28
27
27
2620
20.3
Doubtful Quality.
Requires attention
MID SPAN
25
27
27
26.33
2729
20
Doubtful Quality.
Requires attention
2ND
SUPPORT
29
28
24
27
2645
20.3
Doubtful Quality.
Requires attention
Table No. 5.10

59
HALL O2
BEAM NO.2
REBOUND VALUE
MEAN
USPV
(m/s)
QUALITY
f (ck) (N/mm^2)
REMARKS
1 ST
SUPPORT
31
31
34
32
3422
29.8
Medium quality concrete
MID SPAN
33
32
32
32.33
3871
29.8
Medium quality concrete
2ND
SUPPORT
35
34
37
35.33
3750
31.1
Good quality concrete
Table No. 5.11
60
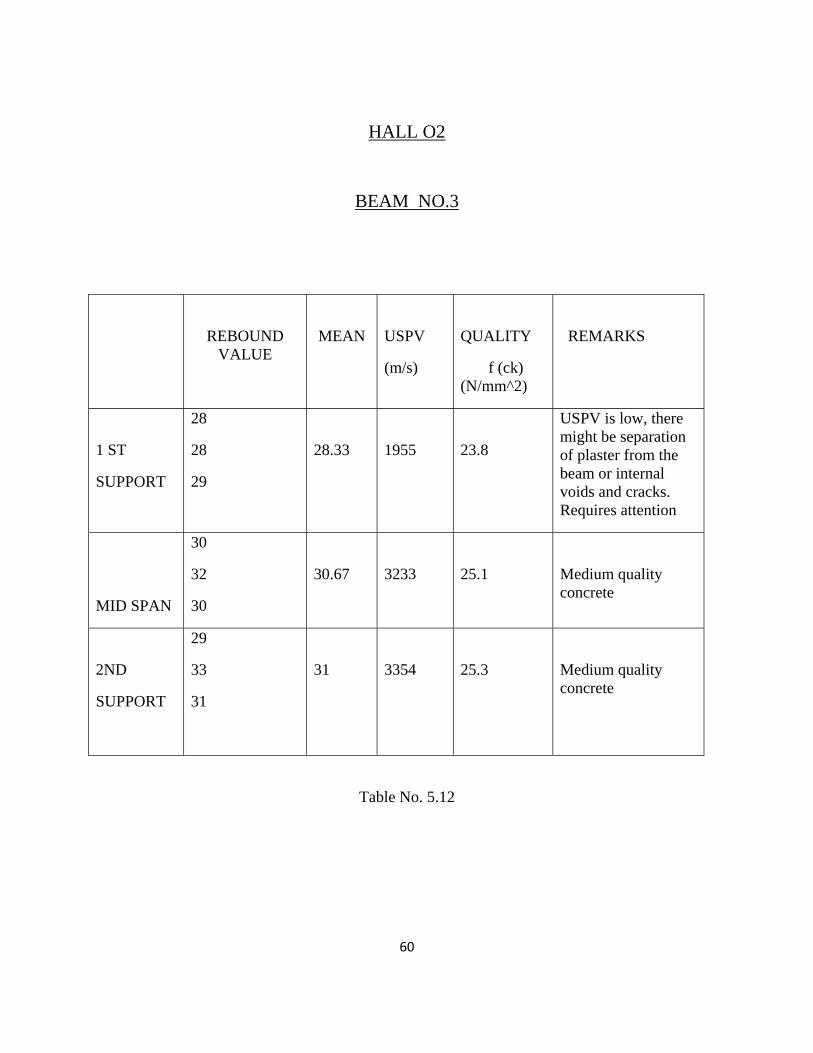
HALL O2
BEAM NO.3
REBOUND VALUE
MEAN
USPV
(m/s)
QUALITY
f (ck) (N/mm^2)
REMARKS
1 ST
SUPPORT
28
28
29
28.33
1955
23.8
USPV is low, there might be separation of plaster from the beam or internal voids and cracks. Requires attention
MID SPAN
30
32
30
30.67
3233
25.1
Medium quality concrete
2ND
SUPPORT
29
33
31
31
3354
25.3
Medium quality concrete
Table No. 5.12
61
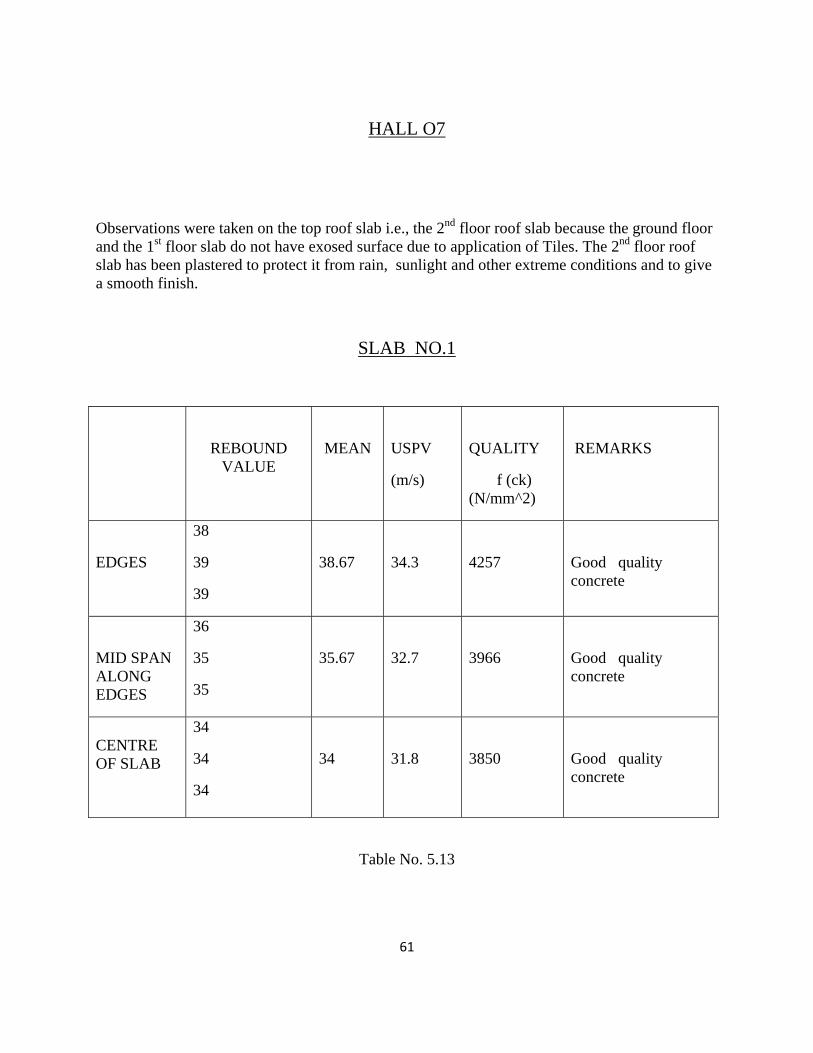
HALL O7
Observations were taken on the top roof slab i.e., the 2nd floor roof slab because the ground floor and the 1st floor slab do not have exosed surface due to application of Tiles. The 2nd floor roof slab has been plastered to protect it from rain, sunlight and other extreme conditions and to give a smooth finish.
SLAB NO.1
REBOUND VALUE
MEAN
USPV
(m/s)
QUALITY
f (ck) (N/mm^2)
REMARKS
EDGES
38
39
39
38.67
34.3
4257
Good quality concrete
MID SPAN ALONG EDGES
36
35
35
35.67
32.7
3966
Good quality concrete
CENTRE OF SLAB
34
34
34
34
31.8
3850
Good quality concrete
Table No. 5.13

62
HALL O7
SLAB NO.2
REBOUND VALUE
MEAN
USPV
(m/s)
QUALITY
f (ck) (N/mm^2)
REMARKS
EDGES
33
30
28
30.33
4122
26.5
High USPV may be due to heavy Torsion Reinforcements.
Overall good quality concrete.
MID SPAN ALONG EDGES
32
31
31
31.33
3890
27.2
Good quality concrete.
CENTRE OF SLAB
29
30
30
29.67
2855
25.0
Little low. May be due to improper shuttering of slabs and improper compaction.
Table No. 5.14
63
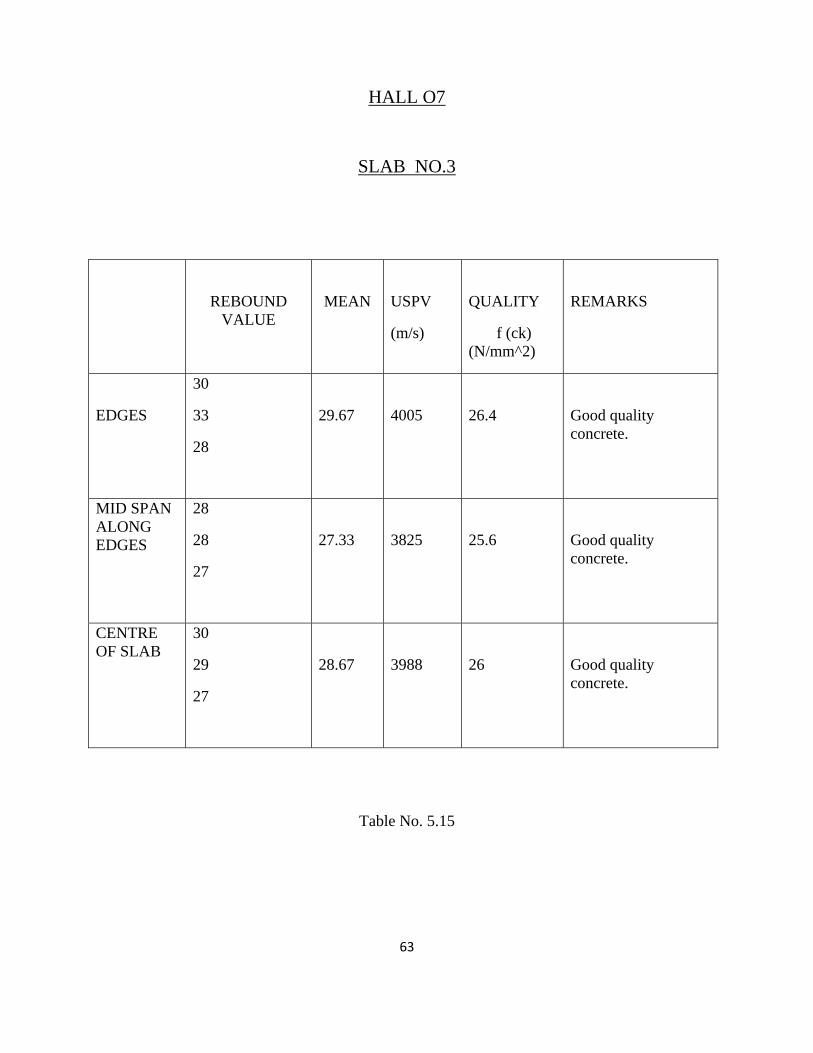
HALL O7
SLAB NO.3
REBOUND VALUE
MEAN
USPV
(m/s)
QUALITY
f (ck) (N/mm^2)
REMARKS
EDGES
30
33
28
29.67
4005
26.4
Good quality concrete.
MID SPAN ALONG EDGES
28
28
27
27.33
3825
25.6
Good quality concrete.
CENTRE OF SLAB
30
29
27
28.67
3988
26
Good quality concrete.
Table No. 5.15
64
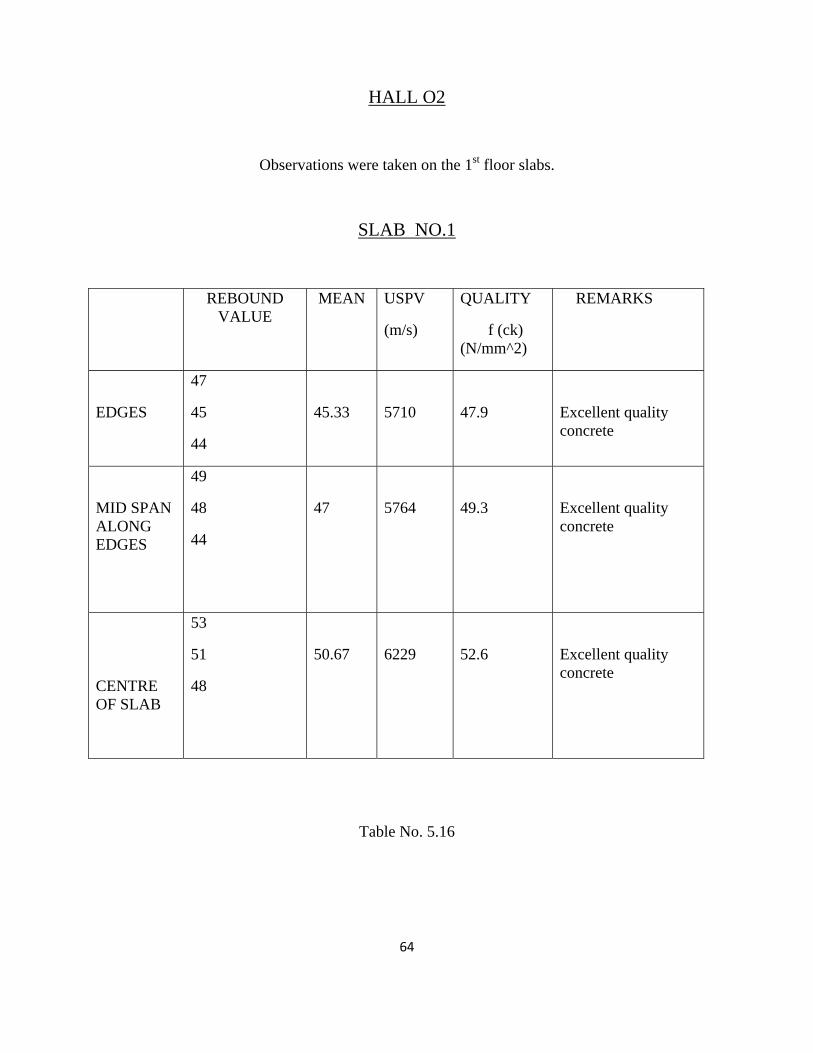
HALL O2
Observations were taken on the 1st floor slabs.
SLAB NO.1
REBOUND VALUE
MEAN USPV
(m/s)
QUALITY
f (ck) (N/mm^2)
REMARKS
EDGES
47
45
44
45.33
5710
47.9
Excellent quality concrete
MID SPAN ALONG EDGES
49
48
44
47
5764
49.3
Excellent quality concrete
CENTRE OF SLAB
53
51
48
50.67
6229
52.6
Excellent quality concrete
Table No. 5.16
65
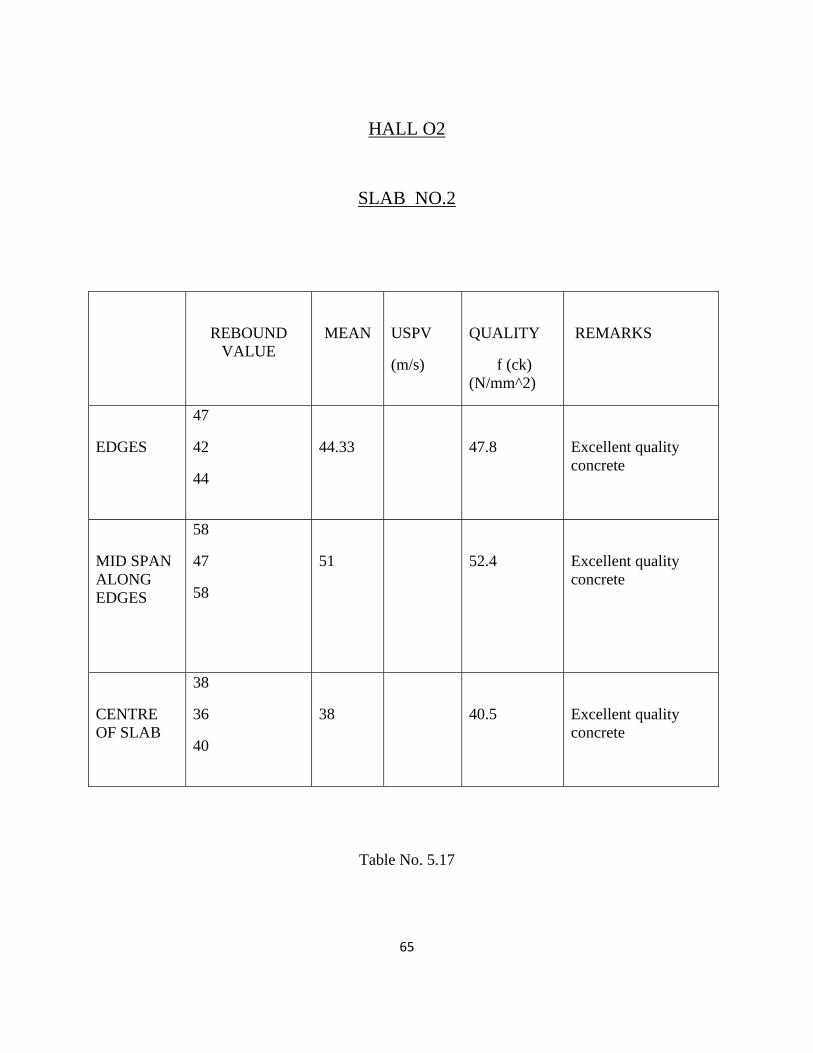
HALL O2
SLAB NO.2
REBOUND VALUE
MEAN
USPV
(m/s)
QUALITY
f (ck) (N/mm^2)
REMARKS
EDGES
47
42
44
44.33
47.8
Excellent quality concrete
MID SPAN ALONG EDGES
58
47
58
51
52.4
Excellent quality concrete
CENTRE OF SLAB
38
36
40
38
40.5
Excellent quality concrete
Table No. 5.17
66
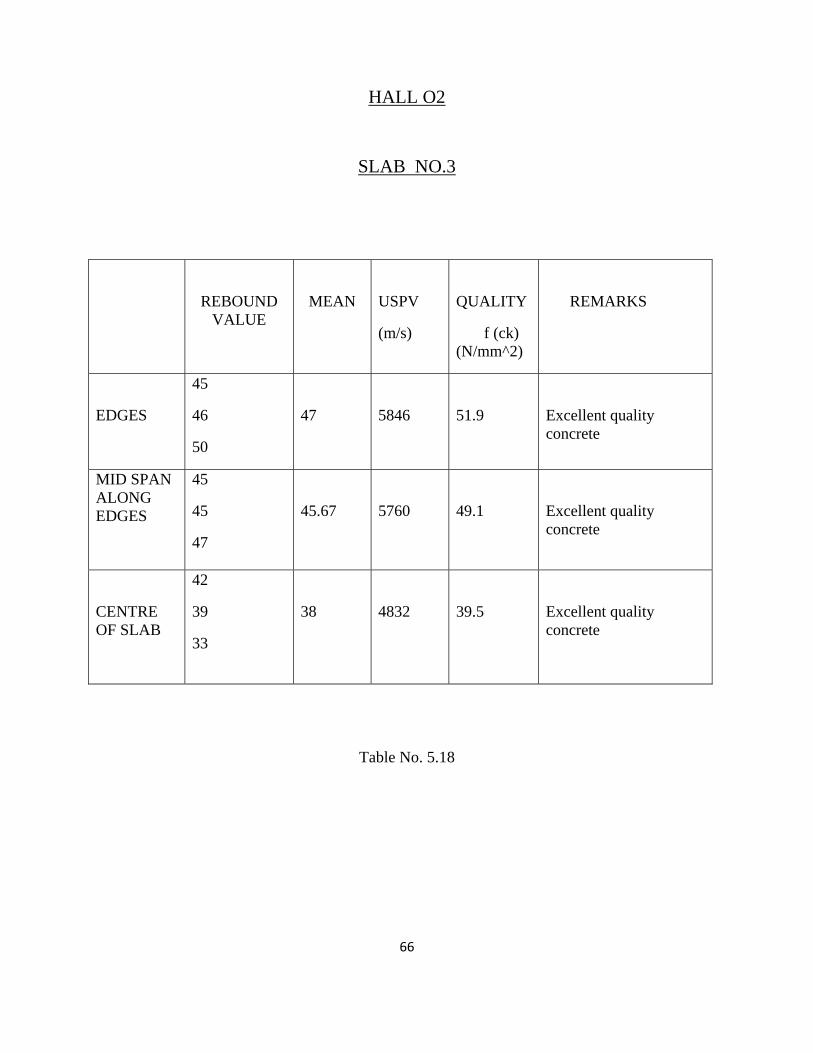
HALL O2
SLAB NO.3
REBOUND VALUE
MEAN
USPV
(m/s)
QUALITY
f (ck) (N/mm^2)
REMARKS
EDGES
45
46
50
47
5846
51.9
Excellent quality concrete
MID SPAN ALONG EDGES
45
45
47
45.67
5760
49.1
Excellent quality concrete
CENTRE OF SLAB
42
39
33
38
4832
39.5
Excellent quality concrete
Table No. 5.18
67
Fig No. 5.8 Rebound Hammer Testing of a Column in Hall No.7
Fig No. 5.9 Rebound Hammer Testing of a Slab in Hall No.7
68
Fig No. 5.10 USPV Testing of a Slab in Hall No. 7
Fig No.5.10 USPV Testing of a Column Hall No. 7
69
5.4 Interpretation of Results
REBOUND HAMMER:
After obtaining the correlation between compressive strength and rebound
number, the strength of structure can be assessed. In general, the rebound number increases as
the strength increases and is also affected by a number of parameters i.e. type of cement, type of
aggregate, surface condition and moisture content of the concrete, curing and age of concrete,
carbonation of concrete surface etc. Moreover the rebound index is indicative of compressive
strength of concrete up to a limited depth from the surface. The internal cracks, flaws etc. or
heterogeneity across the cross section will not be indicated by rebound numbers.
As such the estimation of strength of concrete by rebound hammer method
cannot be held to be very accurate and probable accuracy of prediction of concrete strength in a
structure is ± 25 percent. If the relationship between rebound index and compressive strength can
be found by tests on core samples obtained from the structure or standard specimens made with
the same concrete materials and mix proportion, then the accuracy of results and confidence
thereon gets greatly increased.
The Rebound hammer showed erratic result when the compressive
strength was below 15 N/mm^2. Above 15 N/mm^2 the predicted compressive strength varied
almost linearly with the actual compressive strength.
70
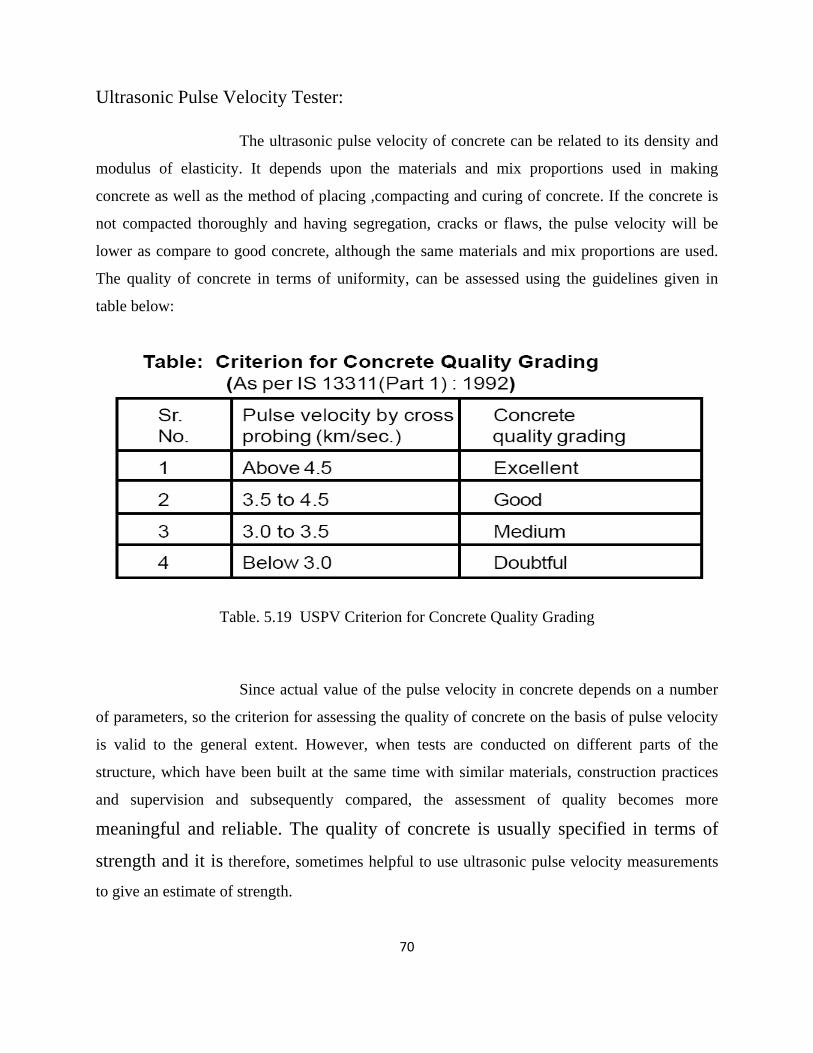
Ultrasonic Pulse Velocity Tester:
The ultrasonic pulse velocity of concrete can be related to its density and
modulus of elasticity. It depends upon the materials and mix proportions used in making
concrete as well as the method of placing ,compacting and curing of concrete. If the concrete is
not compacted thoroughly and having segregation, cracks or flaws, the pulse velocity will be
lower as compare to good concrete, although the same materials and mix proportions are used.
The quality of concrete in terms of uniformity, can be assessed using the guidelines given in
table below:
Table. 5.19 USPV Criterion for Concrete Quality Grading
Since actual value of the pulse velocity in concrete depends on a number
of parameters, so the criterion for assessing the quality of concrete on the basis of pulse velocity
is valid to the general extent. However, when tests are conducted on different parts of the
structure, which have been built at the same time with similar materials, construction practices
and supervision and subsequently compared, the assessment of quality becomes more
meaningful and reliable. The quality of concrete is usually specified in terms of
strength and it is therefore, sometimes helpful to use ultrasonic pulse velocity measurements
to give an estimate of strength.
71
The relationship between ultrasonic pulse velocity and strength is affected
by a number of factors including age, curing conditions, moisture condition, mix proportions,
type of aggregate and type of cement. The assessment of compressive strength of concrete from
ultrasonic pulse velocity values is not accurate because the correlation between ultrasonic pulse
velocity and compressive strength of concrete is not very clear. Because there are large number
of parameters involved, which influence the pulse velocity and compressive strength of concrete
to different extents. However, if details of material and mix proportions adopted in the particular
structure are available, then estimate of concrete strength can be made by establishing suitable
correlation between the pulse velocity and the compressive strength of concrete specimens made
with such material and mix proportions, under environmental conditions similar to that in the
structure. The estimated strength may vary from the actual strength by ± 20 percent. The
correlation so obtained may not be applicable for concrete of another grade or made with
different types of material.
At some places over plaster in rounded columns USPV gave no results or
indicated that the velocity was out of range. In such a place the rebound value was also very low.
This place gave a unique sound on striking softly with a hard material like iron which clearly
indicated a void between the concrete of pillar and its plastering.

72
A general trend was obtained in the columns. The trend was such that
towards the base of the column the tests always showed a higher quality of concrete i.e., higher
compressive strength. The compressive strength went on decreasing as we go up towards the
roof .
A graph has been plotted with increasing height against the predicted
compressive strength. It is evident from the graph that the compressive strength goes on
decreasing with increase in height of column.
The reason for this variation is better compaction at the base. Since all the
weight of the column acts at the base higher compaction is achieved and also better compaction
facilities are available near the base and process compaction becomes difficult as we go up.
No such regular trend was observed for beams or slabs.
Fig No. 5.11 Variation of Strength with increase in Height of Column

73
Chapter 6
CONCLUSION

74
CONCLUSION
Considerable engineering judgment is needed to properly evaluate a
measurement. Misinterpretation is possible when poor contact is made. For example, in some
cases it may not be possible to identify severely corroded reinforcing bar in poor quality
concrete. However, it is possible to identify poor quality concrete which could be the cause of
reinforcing bar problems. The poor quality concrete allows the ingress of moisture and oxygen to
the reinforcing bars, and hence corrosion occurs. Presently the system is limited to penetration
depths of 1 ft. Research is ongoing to develop a system that can penetrate to a depth of 10 ft or
more.
When variation in properties of concrete affect the test results, (especially
in opposite directions), the use of one method alone would not be sufficient to study and evaluate
the required property. Therefore, the use of more than one method yields more reliable results.
For example, the increase in moisture content of concrete increases the ultrasonic pulse velocity
but decreases the rebound number . Hence, using both methods together will reduce the errors
produced by using one method alone to evaluate concrete. Attempts have been done to relate
rebound number and ultrasonic pulse velocity to concrete strength. Unfortunately, the equation
requires previous knowledge of concrete constituents in order to obtain reliable and predictable
results.
The Schmidt hammer provides an inexpensive, simple and quick method of
obtaining an indication of concrete strength, but accuracy of ±15 to ±20 per cent is possible only
for specimens cast cured and tested under conditions for which calibration curves have been
established. The results are affected by factors such as smoothness of surface, size and shape of
specimen, moisture condition of the concrete, type of cement and coarse aggregate, and extent of
carbonation of surface.
75
The pulse velocity method is an ideal tool for establishing whether
concrete is uniform. It can be used on both existing structures and those under construction.
Usually, if large differences in pulse velocity are found within a structure for no apparent reason,
there is strong reason to presume that defective or deteriorated concrete is present. Fairly good
correlation can be obtained between cube compressive strength and pulse velocity. These
relations enable the strength of structural concrete to be predicted within ±20 per cent, provided
the types of aggregate and mix proportions are constant.
In summary, ultrasonic pulse velocity tests have a great potential for
concrete control, particularly for establishing uniformity and detecting cracks or defects. Its use
for predicting strength is much more limited, owing to the large number of variables affecting the
relation between strength and pulse velocity.
The deviation between actual results and predicted results may be
attributed to the fact that samples from existing structures are cores and the crushing compressive
cube strength was obtained by using various corrections introduced in the specifications. Also,
measurements were not accurate and representative when compared to the cubes used to
construct the plots. The use of the combined methods produces results that lie close to the true
values when compared with other methods. The method can be extended to test existing
structures by taking direct measurements on concrete elements.
Unlike other work, the research ended with two simple chart that requires
no previous knowledge of the constituents of the tested concrete. The method presented is
simple, quick, reliable, and covers wide ranges of concrete strengths. The method can be easily
applied to concrete specimens as well as existing concrete structures. The final results were
compared with previous ones from literature and also with actual results obtained from samples
extracted from existing structures.

76
Chapter 7
LIST OF FIRMS DEALING WITH NDT EQUIPMENTS

77
7.1 LIST OF FIRMS DEALING WITH NDT EQUIPMENTS
1. M/s AIMIL LTD., A-8, MOHAN COOPERATIVIE INDUSTRIAL ESTATE, MATHURA
ROAD, NEW DELHI.
2. M/s HILTI INDIA PVT. LTD.,8 LSC PUSHPA VIHAR COMMUNITY CENTRE, NEW
DELHI
3. M/s ULTRA TECHNOLOGIES PVT. LTD, B-85, KALKAJI, NEW DELHI.
4. M/s. ENCARDIO RITES, LUCKNOW
5. M/s. JAMES INSTRUMENTS LUC. 3727, NORTH AEDZIE AVENUE, CHICAGO
ILLINOIS 60618, U.S.A.
6. PROSEQ U.S.A., RIESHASH STRASSE 57 CH - 8034 ZURICH, SWITZERLAND.
7. ELE INTERNATIONAL LTD., EAST MAN WAY, HEMEL HAMPSTEAD
HERTFORDSHIRE, HP2 7HB, ENGLAND.

78
Chapter 8
REFERENCES
79
8.1 REFERENCES
1. IS-1311 (Part-1): 1992 Non-Destructive Testing of Concrete -methods of test, Part-I,
Ultrasonic Pulse Velocity.
2. IS 13311 (Part-2): 1992, Non-Destructive Testing of Concrete –methods of test, Part 2,
Rebound hammer.
3. RDSO Report No.BS-53: Guidelines on use of ultrasonic instruments for monitoring of
concrete structures.
4. Handbook on Non Destructive Testing of Concrete” (second edition) by V.M. Malhotra and
N.J. Carino
5. “Non destructive testing” by Louis Cartz.
6. “Concrete Technology” by M L Gambhir.
7. “Concrete Technology” by M S Shetty
8. Civil Engineering Construction Review, August 1998 Edition ( Non Destructive Testing of
Concrete ).
9. Concrete strength by combined nondestructive methods simply and reliably predicted
Hisham Y. Qasrawi , Civil Engineering Department, College of Engineering, Applied Science
University, Amman 11931, Jordan
10. Non-destructive testing of concrete material properties and concrete structures
Christiane Maierhofer Federal Institute for Materials Research and Testing (BAM), D-12205
Berlin, Germany .
11. The use of USPV to anticipate failure in concrete under compression Hisham Y. Qasrawi ,
and Iqbal A. Marie Civil Engineering Department, Faculty of Engineering, Hashemite
University, Zarqa 13115, Jordan .
80
8.2 RELATED BOOKS , JOURNALS AND ARTICLES
1. V. Malhotra, Editor, Testing Hardened Concrete: Non-destructive Methods, ACI, Detroit, US
(1976) monograph No. 9.
2. A. Leshchinsky, Non-destructive methods Instead of specimens and cores, quality control of
concrete structures. In: L. Taerwe and H. Lambotte, Editors, Proceedings of the International
Symposium held by RILEM, Belgium, E&FN SPON, UK (1991), pp. 377–386.
3. ASTM C 805-85, Test for Rebound Number of Hardened Concrete, ASTM, USA (1993).
4. BS 1881: Part 202, 1986: Recommendations for Surface Hardness Tests by the Rebound
Hammer, BSI, UK (1986).
5. In Place Methods for Determination of Strength of Concrete; ACI Manual of Concrete
Practice, Part 2: Construction Practices and Inspection Pavements, ACI 228.1R-989, Detroit,
MI (1994) 25 pp..
6. T. Akashi and S. Amasaki, Study of the stress waves in the plunger of a rebound hammer at
the time of impact. In: V.M. Malhotra, Editor, In situ/Nondestructive Testing of Concrete, ACI
SP-82, Detroit (1984), pp. 19–34.
7. S. Amasaki, Estimation of strength of concrete structures by the rebound hammer. CAJ Proc
Cem Conc 45 (1991), pp. 345–351.
8. W. Grieb. In: Use of the Swiss Hammer for Estimating the Compressive Strength of Hardened
Concrete, FHWA Public Roads 30 (1958), pp. 45–50 Washington, DC, No. 2, June.
9. C. Willetts. Investigation of Schmidt Concrete Test Hammer, Miscellaneous Paper No. 6-267,
U.S. Army Engineer Waterways Experiment Station, Vicksburg, MS (1958) June.
10. A. Neville and J. Brooks. Concrete Technology, Longman, UK (1994).
81
11. G. Teodoru, The use of simultaneous nondestructive tests to predict the compressive strength
of concrete. In: H.S. Lew, Editor, Nondestructive Testing vol. 1, ACI, Detroit (1988), pp. 137–
148 ACI SP-112.
12. A. Neville. Properties of Concrete, Addison-Wesley Longman, UK (1995).
13. ASTM C 597-83 (Reapproved 1991), Test for Pulse Velocity Through Concrete, ASTM, USA
(1991).
14. BS 1881: Part 203: 1986: Measurement of Velocity of Ultrasonic Pulses in Concrete, BSI,
UK (1986).
15. A. Nilsen and P. Aitcin, Static modulus of elasticity of high strength concrete from pulse
velocity tests. Cem Concr Aggregates 14 1 (1992), pp. 64–66.
16. R. Philleo, Comparison of results of three methods for determining Young's modulus of
elasticity of concrete. J Am Concr Inst 51 (1955), pp. 461–469 January.
17. M. Sharma and B. Gupta, Sonic modulus as related to strength and static modulus of high
strength concrete. Indian Concr J 34 4 (1960), pp. 139–141.
18. ACI 318-95, Building Code Requirements for Structural Concrete (ACI 318-95) and
Commentary-ACI 318R-95, ACI, USA (1995) 369 pp..
19. E. Whitehurst, Soniscope tests concrete structures. J Am Concr Inst 47 (1951), pp. 433–444
Feb..
20. R. Jones and E. Gatfield. Testing Concrete by an Ultrasonic Pulse Technique, DSIR Road
Research Tech. Paper No. 34, HMSO, London (1955).
21. C. Yun, K. Choi, S. Kim and Y. Song, Comparative evaluation of nondestructive test
methods for in-place strength determination. In: H.S. Lew, Editor, Nondestructive Testing, ACI
SP-112, ACI, Detroit (1988), pp. 111–136.
82
22. V. Sturrup, F. Vecchio and H. Caratin, Pulse velocity as a measure of concrete compressive
strength. In: V.M. Malhotra, Editor, In situ/Nondestructive Testing of Concrete, ACI SP-82,
Detroit (1984), pp. 201–227.
23. G. Kheder, Assessment of in situ concrete strength using combined nondestructive testing.
In: Proceedings of the First international Arab Conference on Maintenance and Rehabilitation
of Concrete Structures, Cairo (1998), pp. 59–75.
24. M. El Shikh, Very high strength of special concrete evaluated by pulse velocity. In:
Proceedings of the 1st international Arab Conference on Maintenance and Rehabilitation of
Concrete Structures, Cairo (1998), pp. 79–105.
25. U. Bellander, Concrete strength in finished structures: Part 3. Nondestructive testing
methods. Investigation in laboratory in-situ research. Swed Cem Concr Res Inst 3 (1977), p. 77.
26. I.R. De Almeida, Non-destructive testing of high strength concretes: Rebound (Schmidt
hammer and ultrasonic pulse velocity), quality control of concrete structures. In: L. Taerwe and
H. Lambotte, Editors, Proceedings of the International Symposium held by RILEM, Belgium,
E&FN SPON, UK (1991), pp. 387–397.
27. H. Qasrawi, Quality control of concrete at site. Civ Eng J, Association of Engineers, Jordan
(1995) December.
28. D. Montgomery and G. Runger. Applied Statistics and Probability for Engineers (2nd edn.
ed.),, Wiley (1999).
29. BS 1881: Part 120: 1983, Method for Determination of Compressive Strength of Concrete
Cores, BSI, UK (1983).
------------------------------------------------------------------