structural health monitoring in a buckled beam using
TRANSCRIPT

HAL Id: hal-01022991https://hal.inria.fr/hal-01022991
Submitted on 11 Jul 2014
HAL is a multi-disciplinary open accessarchive for the deposit and dissemination of sci-entific research documents, whether they are pub-lished or not. The documents may come fromteaching and research institutions in France orabroad, or from public or private research centers.
L’archive ouverte pluridisciplinaire HAL, estdestinée au dépôt et à la diffusion de documentsscientifiques de niveau recherche, publiés ou non,émanant des établissements d’enseignement et derecherche français ou étrangers, des laboratoirespublics ou privés.
Structural Health Monitoring in a Buckled Beam UsingVolterra Series
Cristian Hansen, Sidney Bruce Shiki, Samuel da Silva
To cite this version:Cristian Hansen, Sidney Bruce Shiki, Samuel da Silva. Structural Health Monitoring in a BuckledBeam Using Volterra Series. EWSHM - 7th European Workshop on Structural Health Monitoring,IFFSTTAR, Inria, Université de Nantes, Jul 2014, Nantes, France. �hal-01022991�

STRUCTURAL HEALTH MONITORING IN A BUCKLED BEAM USINGVOLTERRA SERIES
Cristian Hansen1, Sidney Bruce Shiki1, Samuel da Silva1
1 UNESP - Univ Estadual Paulista, Faculdade de Engenharia de Ilha Solteira, Departamento deEngenharia Mecanica, Av. Brasil 56, 15385-000, Ilha Solteira, SP, Brasil
[email protected], [email protected], [email protected]
ABSTRACT
This paper proposes a new method to detect damages in structures vibrating with non-linear behavior. The approach proposed is based on Volterra series and can separate thelinear and nonlinear contributions of the responses. An alert of damage is given basedon level of contribution of the difference between the linear and nonlinear behavior iden-tified using experimental time-series. Tests are performed involving a buckled clampedbeam to illustrate the steps and the advantages of the approach to detect damages usingvibrating in nonlinear regime of motion.
KEYWORDS : Volterra series, nonlinear dynamics, damage detection, buckled beam.
INTRODUCTION
Normally, the occurrence of structural damage is well associated with the nonlinear behavior, forinstance, cracks, delamination, post-buckling, etc. [1, 2]. If the system is monitored for structuralhealth using some linear metric, the detection of damage is obtained only by identifying nonlinearbehavior in the response. However, nonlinearities in health conditions is a common practical situationdue to the inherent nonlinear effects, as jump, gaps, super harmonics, cycle limit, discontinuities,beyond others that appear frequently in the responses of structures [3]. This behavior is caused mainlydue to excitation condition, large displacement, geometric effects, nonlinear constitutive equations ofthe stress-strain, etc [1,3,4]. Thus, the conventional linear procedures for structural health monitoringcan fail when the system monitored is highly nonlinear in the healthy state [5, 6].
In this context, the present paper propose a contribution to detect and quantify damages in non-linear systems using Volterra series. Volterra series is a nonlinear representation using multiple con-volutions that can separate the linear and nonlinear contributions [7–11]. To illustrate the results, anexperimental application is performed in a buckled clamped beam with a thin beam connected. Afteridentifying the discrete-time Volterra kernels in the reference condition (healthy state), the predictionerrors from linear and nonlinear contributions are monitored. Damages are simulated by load appliedin the joint point of the beam to change the stress. The structural integrity of the system, consideringthe inherent nonlinear behavior associated, is monitored using damage-sensitive metrics based on pre-diction errors computed by Volterra series. These indexes are also used to quantify the severity of thedamage in the structure and to decide if the changes are caused by damage or nonlinear regime.
DAMAGE DETECTION USING DISCRETE-TIME VOLTERRA SERIES
The discrete-time Volterra series can represent appropriately the output y(k) of nonlinear systemsusing a generalization of convolution [7, 12]:
y(k) =∞
∑η=1
N1
∑n1=0
. . .Nη
∑nη=0
Hη(n1, . . . ,nη)η
∏i=1
u(k−ni) = y1(k)+ y2(k)+ y3(k)+ · · · (1)
7th European Workshop on Structural Health MonitoringJuly 8-11, 2014. La Cité, Nantes, France
Copyright © Inria (2014) 2282
where u(k) is the excitation signal, Hη(n1, . . . ,nη) are the Volterra kernel of η-th order, y1(k), y2(k)and y3(k) are the linear, quadratic and cubic components of y(k), and so on. The most part of nonlinearsystems with polynomials nonlinearities can been described with order η = 3.
A great drawback of Volterra series is the difficult to obtain convergence using a large numberof terms N1, ...,Nη . Fortunately, the Volterra kernels expansion in any orthonormal basis can reducethis problem. In particular, to describe vibrating systems, the orthonormal basis ψi j(n j) with Kautzfunctions can be useful [13–15]. Thus, the Volterra kernel can be given by:
Hη(n1, . . . ,nη)≈J1
∑i1=1
. . .Jη
∑iη=1
Bη (i1, . . . , iη)η
∏j=1
ψi j(n j) (2)
where Bη (i1, . . . , iη) is the projection of Volterra kernels in the basis ψi j(n j) of Kautz functions andJ1, ...,Jη is the number of samples used in the Volterra kernel projection. With this approach, Volterraseries can be rewritten by multiple convolutions between orthonormal kernels Bη (i1, . . . , iη) and thesignal li j(k):
y(k)≈∞
∑η=1
J1
∑i1=1
. . .Jη
∑iη=1
Bη (i1, . . . , iη)η
∏j=1
li j(k) (3)
where li j(k) is the input signal u(k) filtered by Kautz functions ψi j(n j):
li j(k) =V−1
∑ni=0
ψi j(ni)u(k−ni) (4)
where V = max{J1, . . . ,Jη}.The terms of orthonormal kernels Bη (i1, . . . , iη) can be now arranged in a vector ΦΦΦ and estimated
by:ΦΦΦ = (ΓΓΓT
ΓΓΓ)−1ΓΓΓ
T y (5)
where the matrix ΓΓΓ contains the input signal filtered li j(k) and the input y = [y(1) · · ·y(K)] with K thenumber of samples used. More details can be found in [8, 9].
If a healthy state is known, the Volterra kernels can be identified and used as reference based onthe output measured in this condition. So, the reference state can be estimated by:
yre f ≈3
∑η=1
Bη(k) = y1,re f︸ ︷︷ ︸linear
+y2,re f + y3,re f︸ ︷︷ ︸nonlinear
(6)
where 3 kernels were considered. If we compare the prediction error between the experimental outputyexp with the reference estimated by Equation (6), given by:
ere f = yexp− yre f (7)
is expected that the statistical difference should be not significant. Now, if an unknown structuralcondition is measured, given by yexp, the same Volterra model can be used to try to estimate it:
yunk ≈3
∑η=1
Bη(k) = y1,unk + y2,unk + y3,unk (8)
If there is no damage in the system, the reference Volterra model can be able to estimate correctlythe behavior. So, the prediction error:
eunk = yexp− yunk (9)
should be low and close to the reference error given by Equation (7). A feature index for damagedetection can be extracted through [11, 16]:
λη =σ(eη ,unk)
σ(eη ,re f ), η = 1,2,3 (10)
EWSHM 2014 - Nantes, France
2283
where σ (◦) is the standard derivation operator. The prediction errors at reference condition, eη ,re f ,and in unknown conditions, eη ,unk, are given by:
eη ,re f = yexpre f −
η
∑m=1
ym,re f , η = 1,2,3 (11)
eη ,unk = yexpunk−
η
∑m=1
ym,unk, η = 1,2,3 (12)
The prediction errors are residues that can consider the nonlinearities contained in the systemdepending on the η considered. This represents an evolution when compared as others methods basedon residues using linear models, for example used by [17, 18].
APPLICATION IN A NONLINEAR HARDENING BEAM
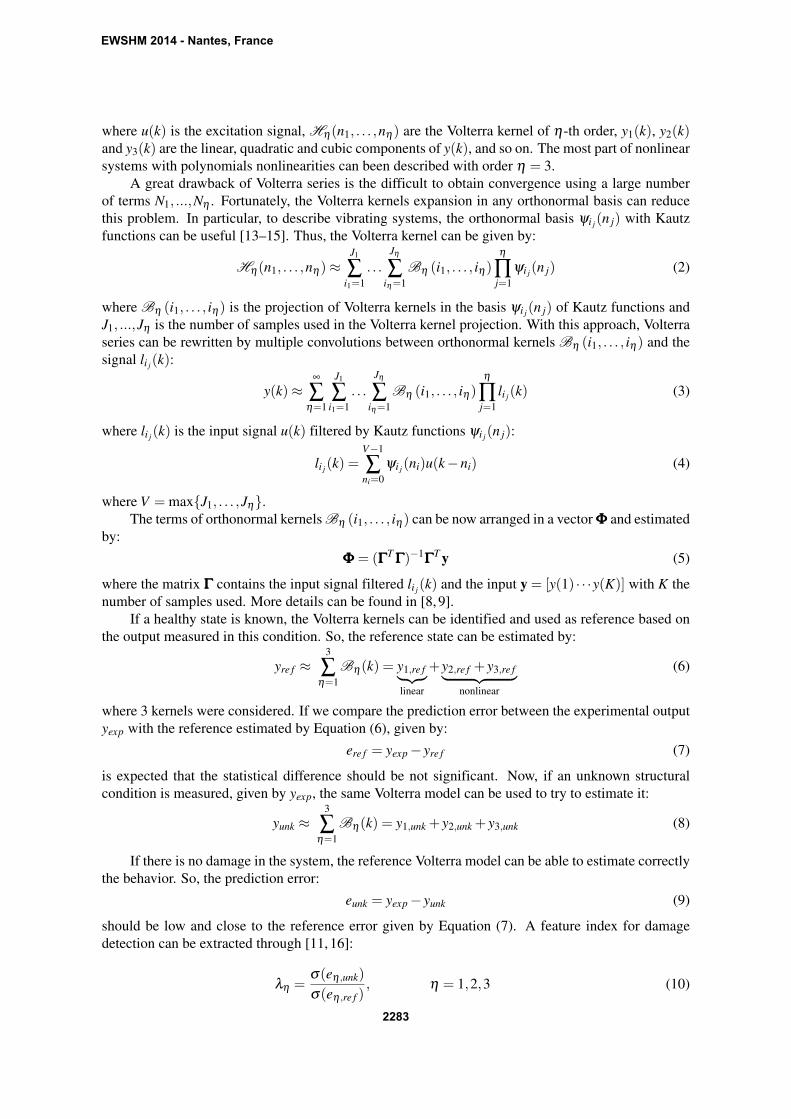
Figure 1 shows the experimental setup used to illustrate the approach of damage detection proposedbased on Volterra series. An aluminum beam with 300× 18× 3 mm of length, width and thickness,respectively, is connected to a steel beam with 120× 18× 0.5 mm of length, width and thickness,respectively. The excitation was applied using a shaker attached to the aluminum beam at 50 mm fromclamped end. A preload is applied in the connection between the beams to include geometrical effectsthat cause nonlinear vibrating regime with hardening stiffness effect. The structure is monitored usingsix accelerometers and a laser vibrometer to measure the velocity in the joint between the beams. Aforce sensor is also used to measure the excitation force applied. All signals measured were sampledwith 1024 Hz and 8192 samples.
(a) Experimental setup with axial load ap-plied.
(b) Schematic diagram.
Figure 1 : View of the experimental setup.
Detection of the nonlinearities
The first test was done using a chirp input applied during 4 seconds with three different levels ofamplitude to excite the first mode range from 20 to 100 Hz. Figure 2(a) shows the frequency responsefunction (FRF) plots. Clearly the FRF presents some changes caused by nonlinear effects and drop outin function of level of force applied by the shaker. A controlled stepped sine test was also performed toshow the jump of the frequency response when the level of force amplitude is high, Figure 2(b). Theseresults show clearly that the structure contains nonlinear regime associated with hardening stiffness.
Identification of the Volterra kernels
The identification of the Volterra kernels is performed using the chirp input signal in two steps [10]. Inthe first step is used the low amplitude to identify the first Volterra kernel H1(n1) that corresponds tolinear contribution. In the next step is applied a high level of force amplitude to excite nonlinearities
EWSHM 2014 - Nantes, France
2284

10−2
10−1
100
20 30 40 50 60 70 80 90 100
Mob
ility
[(m
/s)/
N]
Frequency [Hz]
(a) FRF - chirp input.
100
50 55 60 65 70 75 80
Am
plitu
de[(
m.s−
1 )/V
]
Frequency [Hz]
(b) Stepped sine with jump phenomena for high ampli-tudes of excitation.
Figure 2 : The continuous line−−− represents an amplitude of 0.01 V applied in the signal generator, the line with4 is the medium amplitude (0.10 V), and the line with ◦ is the high level of amplitude (0.20 V).
and to extract the high order Volterra kernels H2(n1,n2) and H3(n1,n2,n3). All parameters in theKautz functions are used based on optimization procedure [8, 10].
The Volterra model identified is validated using a sinusoidal excitation with frequency close tothe first natural. Figure 3(a) shows a good concordance between the power spectral density (PSD) ofthe output experimental y(k) and the output estimated by the Volterra models. Figure 3(b) shows thespectral contribution of each kernel in the total frequency response. The contribution of the secondkernel is essentially caused by shaker-structure interaction.
10−6
10−5
10−4
10−3
10−2
10−1
50 100 150 200 250
PSD
[(m
.s−
1 )/H
z]
Frequency [Hz]
(a) PSD of the Volterra model ◦ and experimental signalrepresented by continuous line −−−.
10−9
10−8
10−7
10−6
10−5
10−4
10−3
10−2
10−1
50 100 150 200 250
PSD
[(m
.s−
1 )/H
z]
Frequency [Hz]
(b) Frequency contribution of each Volterra kernel. Thecontinuous line −−− is the experimental validation signal,the line with4 is the frequency response of the first ker-nel H1(n1), the line � is the response frequency of theH2(n1,n2) and the line ◦ is the response frequency ofthe H3(n1,n2,n3).
Figure 3 : PSD of the Volterra model and experimental validation output when is applied a high amplitude level(0.20 V).
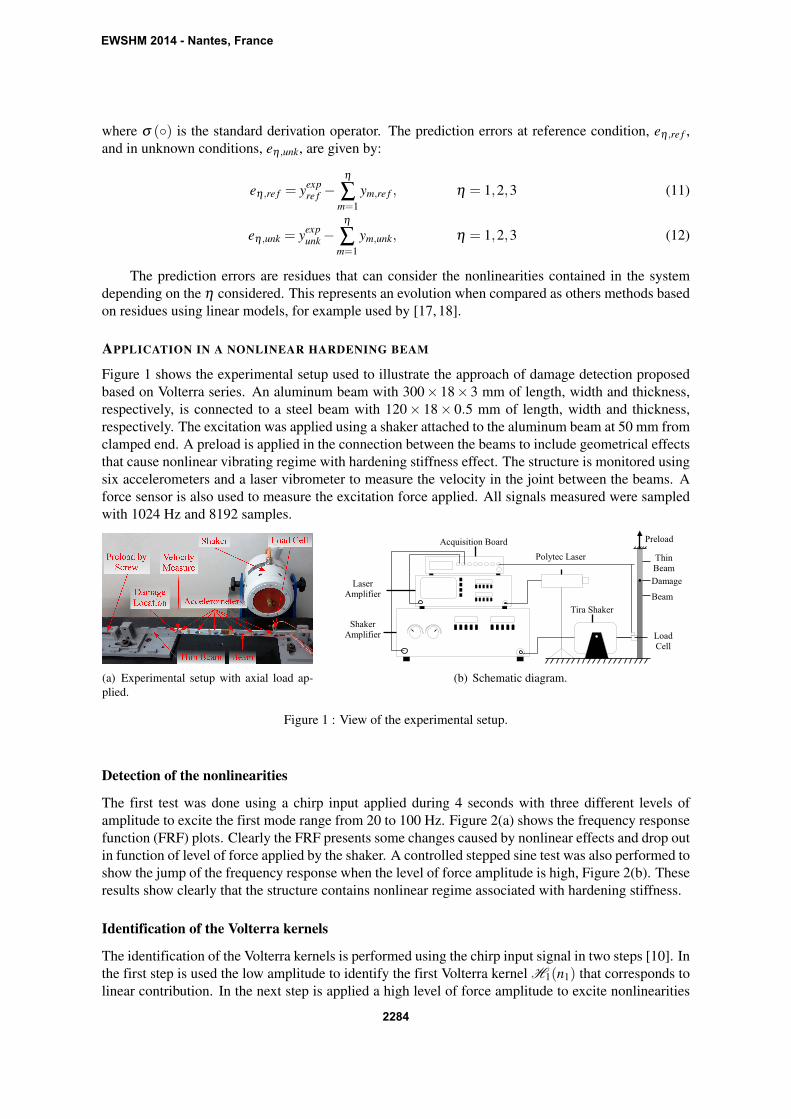
Figure 4(a) shows the output obtained by the multiple convolution computed using the Volterrakernels H1(n1) and H3(n1,n2,n3). The second kernel H2(n1,n2) is not used because the experi-mental response is perfectly symmetric and the importance of these kernel is due to shaker-structureinteraction. The prediction error computed by Equation (7) is shown in Figure 4(b).
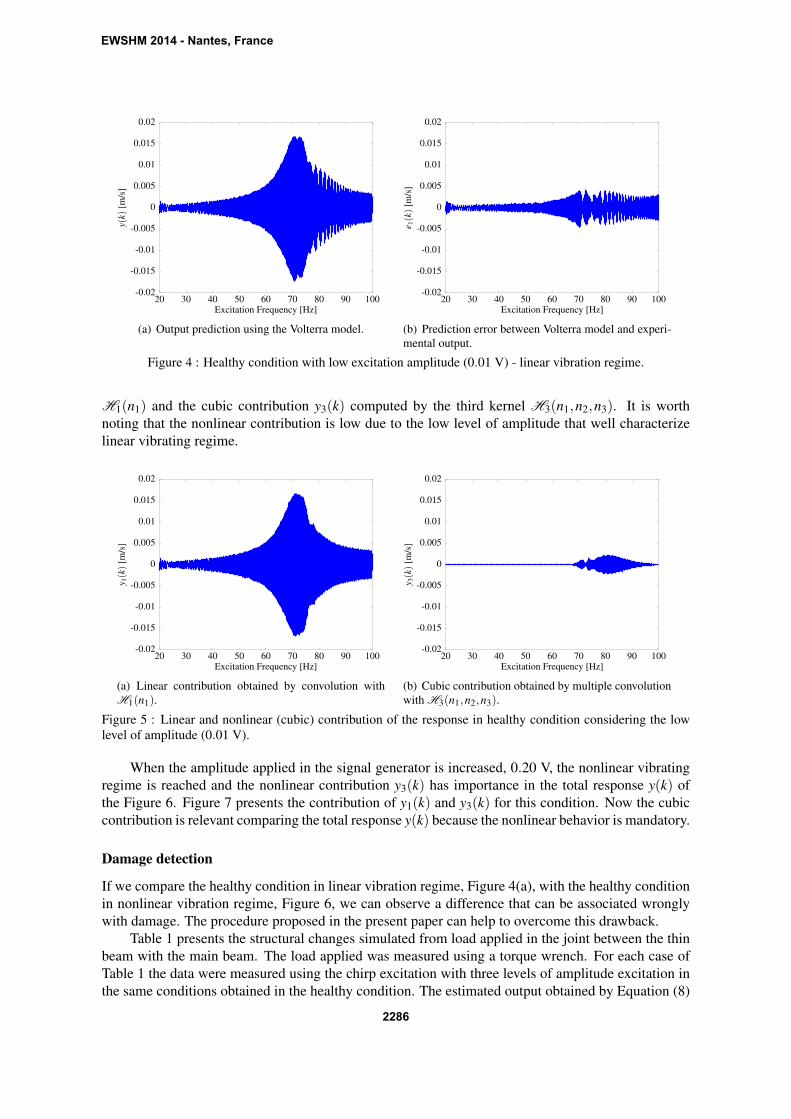
Figure 5 shows the linear contribution y1(k) obtained by the convolution using the first kernel
EWSHM 2014 - Nantes, France
2285
-0.02
-0.015
-0.01
-0.005
0
0.005
0.01
0.015
0.02
20 30 40 50 60 70 80 90 100
y(k)
[m/s
]
Excitation Frequency [Hz]
(a) Output prediction using the Volterra model.
-0.02
-0.015
-0.01
-0.005
0
0.005
0.01
0.015
0.02
20 30 40 50 60 70 80 90 100
e 1(k)
[m/s
]
Excitation Frequency [Hz]
(b) Prediction error between Volterra model and experi-mental output.
Figure 4 : Healthy condition with low excitation amplitude (0.01 V) - linear vibration regime.
H1(n1) and the cubic contribution y3(k) computed by the third kernel H3(n1,n2,n3). It is worthnoting that the nonlinear contribution is low due to the low level of amplitude that well characterizelinear vibrating regime.
-0.02
-0.015
-0.01
-0.005
0
0.005
0.01
0.015
0.02
20 30 40 50 60 70 80 90 100
y 1(k)
[m/s
]
Excitation Frequency [Hz]
(a) Linear contribution obtained by convolution withH1(n1).
-0.02
-0.015
-0.01
-0.005
0
0.005
0.01
0.015
0.02
20 30 40 50 60 70 80 90 100
y 3(k)
[m/s
]
Excitation Frequency [Hz]
(b) Cubic contribution obtained by multiple convolutionwith H3(n1,n2,n3).
Figure 5 : Linear and nonlinear (cubic) contribution of the response in healthy condition considering the lowlevel of amplitude (0.01 V).
When the amplitude applied in the signal generator is increased, 0.20 V, the nonlinear vibratingregime is reached and the nonlinear contribution y3(k) has importance in the total response y(k) ofthe Figure 6. Figure 7 presents the contribution of y1(k) and y3(k) for this condition. Now the cubiccontribution is relevant comparing the total response y(k) because the nonlinear behavior is mandatory.
Damage detection
If we compare the healthy condition in linear vibration regime, Figure 4(a), with the healthy conditionin nonlinear vibration regime, Figure 6, we can observe a difference that can be associated wronglywith damage. The procedure proposed in the present paper can help to overcome this drawback.
Table 1 presents the structural changes simulated from load applied in the joint between the thinbeam with the main beam. The load applied was measured using a torque wrench. For each case ofTable 1 the data were measured using the chirp excitation with three levels of amplitude excitation inthe same conditions obtained in the healthy condition. The estimated output obtained by Equation (8)
EWSHM 2014 - Nantes, France
2286

-0.6
-0.4
-0.2
0
0.2
0.4
0.6
20 30 40 50 60 70 80 90 100
y(k)
[m/s
]
Excitation Frequency [Hz]
(a) Output prediction using the Volterra model.
-0.6
-0.4
-0.2
0
0.2
0.4
0.6
20 30 40 50 60 70 80 90 100
e 3(k)
[m/s
]
Excitation Frequency [Hz]
(b) Prediction error between Volterra model and experi-mental output.
Figure 6 : Healthy condition with high excitation amplitude (0.20 V) - nonlinear vibration regime.
-0.6
-0.4
-0.2
0
0.2
0.4
0.6
20 30 40 50 60 70 80 90 100
y 1(k)
[m/s
]
Excitation Frequency [Hz]
(a) Linear contribution obtained by convolution withH1(n1).
-0.6
-0.4
-0.2
0
0.2
0.4
0.6
20 30 40 50 60 70 80 90 100
y 3(k)
[m/s
]
Excitation Frequency [Hz]
(b) Cubic contribution obtained by multiple convolutionwith H3(n1,n2,n3).
Figure 7 : Linear and nonlinear (cubic) contribution of the response in healthy condition considering the highlevel of amplitude (0.20 V).
were computed and the indexes λη calculated by Equation (10) were evaluated using the predictionerrors from Equation (9).
Table 1 : Structural condition simulated.
Structural Condition Load [N] Structural Condition Load [N]0 0 IV 4I 1 V 5II 2 R 0III 3 - -
Figure 8 shows the indexes to three amplitude levels. Figure 8(a) shows the results when η = 1in Equation (10). If the level of amplitude is low, only the linear contribution y1(k) is relevant and thelinear index can associate the change in the output with structural change. However, if the level of
EWSHM 2014 - Nantes, France
2287

amplitude is high, the nonlinear contribution y3(k) is relevant and does not appear in the linear indexλ1. Thus, if the level of amplitude is high the index λ1 will fail. Figure 8(b) presents when η = 2 inEquation (10) and the results is similar to the case when η = 1 because the quadratic contribution islow and the index λ2 considers the levels y1(k) and y2(k).
The unique index that is able to detect structural changes in all conditions is the λ3 because whenη = 3 we can consider the prediction error considering the sum of all linear and nonlinear contributionsin the total response. Figure 8(c) shows clearly this condition when the structural changes are detectedwhen the system presents nonlinear regime of vibration motion. Figure 8(d) illustrates a zoom to seethat when the level of amplitude is low, the cubic index can also detect the structural changes becausethe third Volterra kernel has contribution of the first harmonic, as seen in Figure 3(b).
0
1
2
3
4
5
6
0 I II III IV V R
λ1
State(a) Linear index, λ1.
0
1
2
3
4
5
6
0 I II III IV V R
λ2
State(b) Quadratic index, λ2.
0
500
1000
1500
2000
0 I II III IV V R
λ3
State(c) Cubic index, λ3.
0
5
10
15
20
0 I II III IV V R
λ3
State
(d) Cubic index, λ3 (zoom).
Figure 8 : Damage indexes for three different amplitude levels. The symbol ◦ corresponds to the low amplitude(0.01 V),4 corresponds to medium amplitude (0.10 V) and ��� corresponds to high amplitude (0.20 V).
FINAL REMARKS
The results obtained have shown that the use of discrete-time Volterra series can be useful to separatethe linear and nonlinear contributions of the output. Additionally, the damage sensitive-index pro-posed, λ3, considering the high order Volterra kernels contribution is much more efficient to detectstructural changes when the structure vibrates in nonlinear regime.
EWSHM 2014 - Nantes, France
2288

ACKNOWLEDGEMENTS
The authors acknowledge the financial support provided by Research Foundation of Sao Paulo(FAPESP, Brasil) by the grant number 12/09135-3 and the National Council for Scientific and Tech-nological Development (CNPq, Brasil) by the grant number 470582/2012-0. The first and the secondauthor are thankful to FAPESP for their scholarships grant number 13/09008-4 and 13/25148-0, re-spectively. The authors also thank the CNPq and FAPEMIG for partially funding the present researchwork through the National Institute of Science and Technology in Smart Structures in Engineering(INCT-EIE).
REFERENCES
[1] K. Worden and G. R. Tomlinson. Nonlinearity in Structural Dynamics. Institute of Physics Publishing,2001.
[2] L. Bornn, C. R. Farrar, and G. Park. Damage detection in initially nonlinear systems. InternationalJournal of Engineering Science, 48(10):909 – 920, 2010. Structural Health Monitoring in the Light ofInverse Problems of Mechanics.
[3] G. Kerschen, K. Worden, A. F. Vakakis, and J.-C. Golinval. Past, present and future of nonlinear systemidentification in structural dynamics. Mechanical Systems and Signal Processing, 20(3):505 – 592, 2006.
[4] L. N. Virgin. Introduction to Experimental Nonlinear Dynamics. Cambridge University Press, 2000.[5] C. R. Farrar, K. Worden, M. Todd, G. Park, J. Nichols, D. E. Adams, M. T. Bement, and K. Farinholt.
Nonlinear system identification for damage detection. Technical Report LA-14353, Los Alamos NationalLaboratory (LANL), 2007.
[6] K. Worden, C. R. Farrar, J. Haywood, and M. Todd. A review of nonlinear dynamics applications tostructural health monitoring. Structural Control and Health Monitoring, 15(4):540–567, 2008.
[7] W. J. Rugh. Nonlinear System Theory - The Volterra/Wiener Approach. The Johns Hopkins UniversityPress, 1991.
[8] S. da Silva, S. Cogan, and E. Foltete. Nonlinear identification in structural dynamics based on wienerseries and kautz filters. Mechanical Systems and Signal Processing, 24(1):52–58, January 2010.
[9] S. da Silva. Non-linear model updating of a three-dimensional portal frame based on Wiener series.International Journal of Non-Linear Mechanics, 46(1):312 – 320, 2011.
[10] S. B. Shiki, V. Lopes Jr, and S. Silva. Identification of nonlinear structures using discrete-time volterraseries. Journal of the Brazilian Society of Mechanical Sciences and Engineering, pages 1–10, 2013.
[11] S. B. Shiki, S. da Silva, and V. Lopes Jr. Damage detection in nonlinear structures using discrete-timevolterra series. Key Engineering Materials, 569:876–883, 2013.
[12] M. Schetzen. The Volterra and Wiener Theories of Nonlinear Systems. Wiley, 1980.[13] W. H. Kautz. Transient synthesis in the time domain. IRE Transactions on Circuit Theory, (1):29 – 39,
1954.[14] P. S. C. Heuberger, P. M. J. Van den Hof, and B. Wahlberg. Modelling and identification with rational
orthogonal basis functions. Springer, 2005.[15] S. da Silva. Non-parametric identification of mechanical systems by Kautz filter with multiple poles.
Mechanical Systems and Signal Processing, 25(4):1103 – 1111, 2011.[16] S. da Silva. Damage detection in a 2 dof nonlinear mechanical systems using Volterra series and Kautz
filter. In 20th International Congress of Mechanical Engineering (COBEM 2009), Gramado, RS, Brasil,2009. ABCM, UFRGS.
[17] S. da Silva, V. Lopes Jr, and M. Dias Jr. Structural health monitoring in smart structures through timeseries analysis. Structural Health Monitoring, 7(3):231–244, 2008.
[18] E. Figueiredo, K. M. Farinholt, J.-. Lee, C. R. Farrar, and G. Park. Use of time-series predictive modelsfor piezoelectric active-sensing in structural health monitoring applications. Journal of Vibration andAcoustics, 134(4):041014–041014, 06 2012.
EWSHM 2014 - Nantes, France
2289