structural durability design optimization …web.mae.ufl.edu/nkim/papers/conf22.pdf · reliability...
TRANSCRIPT

1 Copyright © 2003 by ASME
Proceedings of DETC’03 ASME 2003 Design Engineering Technical Conferences and Computers and
Information in Engineering Conference Chicago, ILLINOIS, September 2-6, 2003
DETC2003/DAC-48711
STRUCTURAL DURABILITY DESIGN OPTIMIZATION AND ITS RELIABILITY ASSESSMENT
Kyung K. Choi, Byeng D. Youn, Jun Tang Center for Computer-Aided Design and
Department of Mechanical & Industrial Engineering College of Engineering The University of Iowa
Iowa City, IA 52242, USA [email protected], [email protected], [email protected]
Namho Kim PO Box 116250
Department of Mechanical & Aerospace Engineering
The University of Florida Gainesville, FL 32611, USA
ABSTRACT Mechanical fatigue subject to external and inertia
transient loads in the service life of mechanical systems often leads a structural failure due to accumulated damage. Structural durability analysis that predicts the fatigue life of mechanical components subject to dynamic stresses and strains is a compute intensive multidisciplinary simulation process, since it requires an integration of several computer-aided engineering tools and large amount of data communication and computation. Uncertainties in geometric dimensions due to manufacturing tolerances cause the indeterministic nature of fatigue life of the mechanical component. Due to the fact that uncertainty propagation to structural fatigue under transient dynamic loading is not only numerically complicate but also extremely expensive, it is a challenging task to develop structural durability-based design optimization process and reliability analysis to ascertain whether the optimal design is reliable. The objective of this paper is development of an integrated CAD-based computer-aided engineering process to effectively carry out the design optimization for a structural durability, yielding a durable and cost-effectively manufacturable product. In addition, a reliability analysis is executed to assess the reliability for the deterministic optimal design.
NOMENCLATURE
( , )a • • Energy bilinear form
( )•! Load bilinear form
z Displacement vector L Crack initiation fatigue life W Weight for design optimization
b Design parameter; b = [b1, b2,…, bn]T
g(d) design constraint of design parameters
,l ub b Lower and upper bound of design parameter d X Random vector; X = [X1, X2,…, Xn]
T x Realization of X; x = [x1, x2,…, xn]
T G(X) Constraint of random parameters Pf Probability of failure fX Probability density function µµµµ Mean of random vector X; µµµµ = [µ1, µ2,…, µn]
T β Reliability index
fK Fatigue-strength reduction factor
tK Stress intensification factor
q Notch sensitivity factor 1. INTRODUCTION
Components of machines, vehicles, and structures are frequently subject to transient dynamic loadings, and the resultant fluctuating stresses can lead to microscope physical damage to the materials involved. Since one of common mechanical failures is a structural fatigue due to damage accumulation through transient dynamic loadings applied during the service life of mechanical systems, fatigue failure continues to be a major concern in engineering design. It is a complicated metallurgical process that is difficult to accurately describe and quantify fatigue damage for components of mechanical systems, since it requires a multidisciplinary integration of several computer-aided engineering tools, such as multibody dynamics, finite element analysis (FEA), and durability analysis, and large amount of data communication and computation. Moreover, uncertainties in geometric

2 Copyright © 2003 by ASME
dimensions due to manufacturing tolerances cause indeterministic nature of fatigue life of the mechanical components. Given the capability of durability analysis considering damage accumulation, effective durability-based design and reliability assessment tools need to be developed to yield an optimized design for durability and ascertain if the deterministic optimal design is reliable.
At present, there are three major approaches [1-3] to analyzing and designing against fatigue failures: stress-life (S-N) method, strain-life method, and fracture mechanics approach. Traditional approach for durability analysis was based on the stress-life method, which relates applied stresses directly to the total life. One of the major drawbacks of the stress-life approach is that it ignores true stress-strain behavior and treats all strains as elastic. The strain-life method is based on the observation that damage is dependant on plastic deformation or strain, which is used in this paper. Finally, there is the fracture mechanics approach, which specifically treats growing cracks using the methods of fracture mechanics. Some attempts [4-6] were made for durability and safety design approach and, in addition, uncertainty issue was addressed to estimate the reliability for fatigue of mechanical components.
The objective of this paper is to develop effective design optimization process and reliability analysis for large-scale structural durability with sizing and shape design parameters. A durability analysis takes a role of predicting a crack initiation fatigue life considered as a performance requirement. The integration of structural design sensitivity analysis (DSA) [7] and design optimization entails the parameterization of CAD model; life prediction through durability analysis; computation of design velocity field to define material point movement due to shape change in the CAD model; DSA of the fatigue life with respect to sizing and shape design parameters; iterative design optimization of the parameterized CAD model and consistent finite element mesh update. For efficient design optimization process, a preliminary fatigue analysis identifies critical regions that experience short life in the mechanical system. As well, uncertainties due to manufacturing tolerances are addressed at the end of the design optimization process in order to quantify the reliability of the optimized design.
A durability model of an Army trailer is employed to demonstrate numerical feasibility and effectiveness of the integrated CAD-based process for structural durability optimization and reliability analysis.
2. DURABILITY DESIGN OPTIMIZATION The Army trailer shown in Fig. 1(a) is used to perform
durability design optimization, since damage accumulation leads to structural fatigue failure at the drawbar assembly, as shown in Fig. 1(b). Thus, it is proposed to predict critical regions in terms of fatigue life, to improve design through durability design optimization, and to assess the reliability of
the optimized design. A dynamic model is created to drive the trailer on the Perryman course #3 at a constant speed of 15 miles per hour forward. A 30-second dynamic simulation is performed with a maximum integration time step of 0.005-second using the dynamic analysis package DADS.
( a ) Army Trailer and Drawbar Assembly
( b ) Fatigue Failure at Drawbar
Figure 1. Army Trailer and Its Structural Failure Durability analysis is carried out using Durability Analysis
and Reliability Workspace (DRAW) developed at the University of Iowa [8]. A preliminary durability analysis is executed to estimate the fatigue life of the army trailer and predict critical regions that experience low fatigue life. As shown in Fig. 2, the drawbar assembly contains the critical region, excluding the fictitious critical regions for the modeling imperfection due to the applied boundary conditions. Accordingly, only the drawbar assembly is considered in the design optimization process.
The integrated design optimization process involves (a) design parameterization, (b) DSA, and (c) design optimization. Design parameters of the drawbar assembly are carefully defined for consideration of geometric and manufacturing restrictions. Based on the shape design parameterization, design velocity field is computed to describe shape perturbation. DSA of stress influence coefficient (SIC), perturbed transient dynamic stress, and perturbed fatigue life are used to compute the design sensitivity of fatigue life [4-6, 8]. Durability design optimization is carried out, using the result of durability analysis, design parameterization, and

3 Copyright © 2003 by ASME
design sensitivity analysis. Notch effect for the optimized design is considered for computation of the fatigue life at rivet holes. Finally, a reliability analysis is carried out to quantify reliability of the optimal design.
Figure 2. Fatigue Life Contour of the HMT Drawbar 2.1 Durability Analysis for Crack Initiation Fatigue Life
For durability analysis, fatigue life for crack initiation is calculated at critical regions that experience short life in the mechanical system. The fatigue life computation consists of two primary computations, as shown in Fig. 3: dynamic stress computation and fatigue life computation. The dynamic stress can be obtained either from hardware prototype experiment (mounting sensors or transducers on the physical component) or from numerical simulation. Using simulation, SIC obtained from quasi-static FEA are superposed with the dynamic analysis results, including external forces, accelerations, and angular velocities, to compute the dynamic stress history.
Figure 3. Computation Process for Fatigue Life Since dynamic stress histories contain very large amount
of data, it is generally necessary to reduce or condense the amount of data using peak-valley editing before computing the crack initiation fatigue life. The edited dynamic stress
histories are then used to perform a cycle counting in order to transform variable amplitude stress or strain histories into a number of constant amplitude stress or strain histories. These histories are finally used to compute crack initiation fatigue life of the component.
2.2 Design Parameterization
The design parameterization task for the drawbar is to define design parameters that need to be considered in the design optimization formulation. For this, a CAD-based model of the drawbar assembly is parameterized for iterative design optimization. Two types of design parameters are considered for the drawbar: sizing and shape. To describe shape perturbation, the design velocity field is computed in term of perturbation of shape design parameters. For the design velocity, an iso-parametric mapping method is used to minimize FE distortion for large shape design perturbation [7]. 2.1.1 Design Parameterization and Velocity Computation for Drawbar
As shown in Fig. 4, the drawbar assembly is composed of one central bar, two side bars, six side angles, two side attachments, and top/bottom plates. The optimum design of the drawbar assembly needs to be symmetric, and thus design parameterization is made to yield a symmetric design. The thicknesses of bars and attachments at the initial design are uniform. However, the thicknesses of the drawbar assembly that could be changed during the design optimization process are modeled as sizing design parameters. While maintaining the rectangular shape of the central and side bars, its height and width are considered as shape design parameters.
Figure 4. Design Parameters of Drawbar and Attachments
As shown in Table 1, seven design parameters are defined for the drawbar assembly. The first five are sizing design parameters, which are the thicknesses of the drawbar, angles,
Due to Boundary Condition The Most
Critical Region
t3
t2
t4
t5
t1
w
h
Dynamic Analysis
External Forces Accelerations, and Velocities
FE Model
Quasi-static Loading
FE Analysis
Stress Influence Coeff.
Super- Position
Dynamic Stress History
Local Stress and Strain
Peak/Valley Editing
Rainflow Counting
Crack Initiation Life Prediction

4 Copyright © 2003 by ASME
and attachments. The shape design parameters are defined as the width and height of the cross-sectional geometry of the drawbar. It is decided that the same cross-sectional geometry be used for all drawbar assembly (even though their thicknesses might be different). The design parameterization process is carried out by using of a CAD model.
Table 1. Design Parameters
Design Symbol Description b1 t1 Thickness of six side angles b2 t2 Thickness of two side bars b3 t3 Thickness of center bar b4 t4 Thickness of two side attachments b5 t5 Thickness of top and bottom plates b6 w Cross-section width of three bars b7 h Cross-section height of three bars
2.1.2 Design Velocity Field Computation for Drawbar
The process of deforming shape design may be viewed as a dynamic process of deforming a continuum design, which can be described by design velocity field over the design domain. The design velocity field can be characterized by a mapping between the undeformed and deformed designs. Since a FE method is used as the analysis tool, it is desirable to use a design velocity that can yield a regular mesh distribution after shape perturbation. This paper employed the iso-parametric mapping to compute design velocity field for the shape design parameters defined on the CAD model.
2.3 Design Sensitivity Analysis for Fatigue Response
The sensitivity computational procedure for fatigue life is shown in Fig. 5. First, quasi-static loadings need to be computed, which are consisted of inertia force and reaction force. For this problem, there are a total of 114 quasi-static loading cases. The 114 loading cases are applied to the drawbar assembly to perform FE analyses to obtain the stress influence coefficients (SICs), which are used to compute dynamics stress history of the current design. This dynamic stress history is used to predict fatigue life of the perturbed design. Also, continuum-based DSA of SICs are carried out, which are then used to predict dynamic stress history of the perturbed design. This perturbed dynamic stress history is then used to predict fatigue life of the perturbed design. Finally, the design sensitivity of fatigue life is computed by taking a finite difference of original and perturbed fatigue life. 2.2.1 Computation of Quasi-static Loading and Stress Influence Coefficient (SIC) FE Analysis
To compute SICs, the quasi-static analyses are carried out, which include inertia forces due to gross body motion (IFGBM), inertia forces due to elastic deformation (IFED), and external & joint reaction forces. Among these forces,
IFGBM and external & joint reaction forces are assumed to be independent of design changes of the drawbar. Under this assumption, vehicle dynamic analysis need not to be carried out for the new drawbar design obtained during the design optimization iteration. On the other hand, IFED depends on the elastic deformation, which was computed using the mode synthesis method. Since mode shapes depend on the design variables, IFED depends on the sizing and shape design parameters. 2.2.2 Continuum DSA of SIC
The direct differentiation method [7] is used for DSA of SICs. Since there are seven design parameters and 114 loading cases, the direct differentiation method requires 798 FE re-analyses to calculate the fatigue life sensitivity. One major challenge is that this requires a significant memory to store the analyses results. To alleviate the problem, separate analyses per design parameter are performed to reduce the required computer memory. There is an additional option to further reduce the size of memory. That is, since the design change is limited to the drawbar and attachments, only a small portion of FEA results is necessary for use in the design sensitivity calculation. To understand such possibility further, consider the following form of sensitivity equation [7] ( , ) ( ) ( , ), for allu ua a Zδ δ′ ′ ′= − ∈z z z z z z! (1)
In the discretized FE matrix form, this equation corresponds to
[ ] a′ = −K z F F! (2)
From the assumption that mass and inertia characteristics of the trailer do not change significantly due to the sizing and shape design change occurred locally, the dynamic properties of the trailer will remain unchanged. Thus, the contribution
( )uδ′ z! from the applied load to the design sensitivity in Eq.
(1) vanishes. The contribution ( , )uaδ′ z z from the structural
stiffness involves numerical integration over finite elements that are affected by design changes. Thus, it is possible to carry out the design sensitivity computation using FEA results at the drawbar only, which will significantly reduce the amount of required data storage.
The solution of Eq. (2) is the design sensitivity ′z of the
displacement z . From this design sensitivity, the design
sensitivity of the stress can be calculated using a chain rule of differentiation as
ii
bb
σ σδ∂ ∂ ′= ⋅∂ ∂
zz
(3)
Computation of design sensitivity using Eq. (3) is straightforward if /σ∂ ∂z is available. The grid point stress in NASTRAN is used for the stress measure in Eq. (3), where the grid point stress calculation involves in non-standard interpolation and averaging scheme between elements surrounding the node (or grid) [9,10], which is considered in the stress sensitivity calculation of Eq. (3).

5 Copyright © 2003 by ASME
Figure 5. Design Sensitivity Computational Procedure for Flexible Structural Systems
2.4 Formulation for Durability Design Optimization
The design object is to increase the fatigue life of the drawbar, while minimizing the weight (cost function) of the Army trailer drawbar assembly. Due to restrictions in manufacturing and assembling processes, side constraints are generally imposed on design parameters. Therefore, the design optimization problem can be formulated as
min
Minimize ( )
Subject to 1 ( ) 0, 1, ,
,
i i
l u NDV
W
g L L i NCT
R
= − ≤ =
≤ ≤ ∈
b
b
b b b b
… (4)
where W(b) is the weight of the drawbar assembly, Li(b) is the fatigue life at the ith node, Lmin is the required minimum fatigue life, gi is the ith design constraint, and bl and bu are lower and upper bounds of design parameters, respectively. In Eq. (4), NCT is the number of design constraints, and NDV is the number of design parameters.
For seven design parameters (NDV=7) defined in Table 1, the base design and design bounds are shown in Table 2. The side constraints need to be set by considering the restriction of manufacturing and assembling processes. That is, it is not possible for any upper bound of the sizing design parameter to
Quasic-Static Loading
( )P P T P P
r 0 0
P P p
d
( )
2
m AInertia Forces due to Gross Body Motion (IFGBM)
Inertia Forces due to Elastic Deformation (IFED) m
External & Joint Reaction Forces
= − + ωω + ω
= − ωω + ω +
f r s s
f a
### $ $ $#$ $ $ ΦΦΦΦ P P
P
j 1.0, where is eigenmode
ωΦ +
=
a a
f
$ # ##ΦΦΦΦ
ΦΦΦΦ
Stress Influence Coefficient (SIC) FE Analysis
Continuum DSA of SIC
( ) ( )' '
vm, ,u ud aσ δ δΩ′ψ = δ Ω + −∫ u λ λλ λλ λλ λ!u z
Where: ( )λ! is design dependant (IFGBM is
through mass and IFED is through mass and eigenmodes). Hence eigenmodes DSA is introduced to compute ( )'
uδ λ! .
Dynamic Stress History σσσσ(t,b)
Dynamic Parameters ( , , , , ,rω ωa a a#$ $ # ## ##)
Assumed no changes with small local design changes to improve the fatigue life
Perturbed Dynamic Stress History σσσσ p(t,b)= σσσσ(t,b)+δσσσσ
Design Perturbation δb
Perturbed Life Prediction Lp(b)=L(b)+δL
Original Life Prediction L(b)
Fatigue Life DSA
( b ) ( )( )
b b
p
i
i i
L LL + δ −∂=
∂ δb bb

6 Copyright © 2003 by ASME
have larger than half of the lower bound of the corresponding shape design parameter in the same cross-section.
For optimization, it will be extremely difficult to define fatigue life constraints over the entire drawbar assembly in continuum manner, since there could be an infinitely many constraints. It is desirable to define a finite number of fatigue life constraints over only critical regions. If this design formulation is used, since the optimization is carried out with only critical regions under consideration, the resulting optimum design must be rechecked whether the fatigue life over the whole optimized drawbar assembly exceeds the required minimum fatigue life. As shown in Fig. 6 and Table 3, it is found that the critical region is located at the central bar. Using the symmetry, ten critical nodes (NCT=10) are selected along the center of top and bottom of the central bar. The required minimum fatigue life is set to be 3.0×10⁸ cycles, which is more than 30 times of shortest life at the base design, which is 9.425×10⁶ cycles.
Table 2. Base Design and Its Bounds for Drawbar, (Unit: in)
Design Type
Design bj
Lower
Bound lb Base
Design Upper
Bound ub b1 0.100 0.250 0.500 b2 0.100 0.250 0.500 b3 0.100 0.250 0.500
Sizing Designs
b4 0.100 0.250 0.500 b5 0.100 0.250 0.500
b6 1.000 2.000 5.000 Shape Designs b7 1.000 3.000 5.000
Table 3. Critical Nodes at Base Design (Unit: Cycle)
Constraint ID Node ID Fatigue Life 1 425 9.425×10⁶ 2 424 7.148×10⁷ 3 426 1.115×10¹⁰ 4 368 4.927×10⁹ 5 369 3.595×10⁹ 6 370 3.056×10¹⁰ 7 4056 9.775×10¹¹ 8 4077 2.161×10¹¹ 9 4095 5.581×10⁹
10 4099 6.137×10⁹
As shown in Table 3, the fatigue life is widely varied in the range of 107 to 1012 cycles, resulting in large differences (even in order of magnitudes) in design constraints during the design optimization process. Therefore, the design constraints are normalized by the required minimum fatigue life, as shown
in Eq. (4). For design optimization, a modified feasible direction method is used [11,12].
( a ) Life Contour on Top of Drawbar at Base Design
( b ) Life Contour on Bottom of Drawbar at Base Design Figure 6. Fatigue Life Contour on Drawbar at Base Design
It is noted that, at the base design, another seemingly critical region appeared at the tip of the drawbar, which is fictitious due to the boundary condition at the tip of the drawbar. This kind modeling for the base design was done since the fatigue failure was known to be at near the region where three bars met. The fictitious critical region at the tip of the drawbar is magnified as shown in Fig. 7. The fatigue lives at two nodes (Lnode=344 = 3.25×10⁶ and Lnode=386 = 7.89×10⁶) are very low. However, it is obviously incorrect due to the boundary conditions applied at the tip. In FEA, the tip area is complex to model properly, since it has a surgebrake and its complicate attachment to the trailer drawbar. A close-up of the surgebrake and its attachment to the trailer drawbar is shown in Fig. 8. The surgebrake assembly is mounted on the top of drawbar; however they are not included in the FE model. In addition, three bolts through the drawbar to attach the surgebrake are simulated as a rigid beam in the FE model, which are located at three fourth of the height from the bottom. It is noted that the fictitious critical region is near where the 1st
370
368
369
4077 4095
426
424
425
4056
4099

7 Copyright © 2003 by ASME
bolt is located, as shown in Fig. 8. If short fatigue life is suspected in this region, more detailed FE modeling will be required in flexible dynamic analysis and fatigue prediction.
Figure 7. Fictitious Fatigue Life Contour at the Tip of Drawbar Base Design
Figure 8. Surge Brake and Its Attachments Mounted on Drawbar Assembly
3. RELIABILITY ASSESSMENT FOR DURABILITY-
BASED OPTIMUM DESIGN For computation of the reliability (or probability of
failure) of the mechanical component, the probabilistic fatigue life performance measure is defined as min( ) ( ) 1i iG L L= −X X (5)
where X is a random vector, and a failure event is defined as ( ) 0iG ≤X . Thus, the probability of failure Pf is defined as
( ) 0
( ( ) 0)
( ) ,
f
NRV
G
P P G
f d R≤
= ≤
= ∈∫ ∫ XX
X
x x x% (6)
where NRV is the number of random variables. In Eq. (6), ( )fX x is the joint probability density function of the random
variable X and the evaluation of the probability of failure involves a multiple-integration.
It is difficult to evaluate the probability of failure, since multiple-integral in Eq. (6) is impossible to compute over an implicit failure function of the random vector X. Some approximate probability integration methods have been developed to provide efficient solutions, while maintaining a reasonable level of accuracy, such as the first-order reliability method (FORM) or the asymptotic second-order reliability method (SORM) with a rotationally invariant reliability measure [13,14]. FORM often provides adequate accuracy, and the HL-RF method is widely used for the reliability analysis [14].
Due to manufacturing tolerances, geometric dimensions in the trailer drawbar are considered as uncertainties. After deterministic optimization, the optimum design is considered as the mean of random parameters. It has been studied in the ref. [15] that geometric uncertainties for probabilistic fatigue life prediction can be modeled as normal distribution with less than 5% coefficient of variation (COV). In this paper, random parameters are characterized with normal distribution 10% and COV as a worst-case, as shown in Table 4.
Table 4. Design and Random Parameters in Bracket
Random Variable µµµµ (Mean) COV
Distribution Type
1 0.1000 10.0 Normal 2 0.1000 10.0 Normal 3 0.3375 10.0 Normal 4 0.2269 10.0 Normal 5 0.2272 10.0 Normal 6 1.7994 10.0 Normal 7 2.4937 10.0 Normal
4. RESULTS OF DURABILITY DESIGN OPTIMIZATION
4.1 Results of Design Sensitivity Analysis In Table 5, the design sensitivity results of the weight and
ten fatigue life constraints with respect to seven design parameters for the base design are listed. It can be seen that the weight is more sensitive with respect to first two design parameters, since six side angles and two side bars take the largest portion of the weight in the drawbar assembly, as shown in Fig. 4. Thus, in order to minimize the weight of the drawbar, the first two design parameters will be reduced, whereas the fourth and fifth design parameters have smallest effects.
As for fatigue life constraints, the second and third design parameters influence more significantly, whereas the seventh design parameter does not affect fatigue life at all. Since the central bar turns out to be the weakest link in the drawbar assembly, it is natural that the change in the thickness of the central bar affects fatigue life more than others. On the other
386
344
1st bolt 2nd bolt
3rd bolt

8 Copyright © 2003 by ASME
hand, the seventh design parameter does not help to improve the fatigue life.
As a consequence, it is expected that the third design parameter will increase to correct the violated constraints (g1 and g2), whereas the first and second design parameters are expected to decrease to reduce the weight of the drawbar. The
rest of design parameters are expected to change somewhat because they have a relatively smaller contribution to both weight and fatigue life in the drawbar. However, it is not at all clear what should be the optimum design, unless an optimization algorithm is used.
Table 5. Design Sensitivity of Fatigue Life at the Base Design
Sizing Designs Shape Designs
∂/∂b1 ∂/∂b2 ∂/∂b3 ∂/∂b4 ∂/∂b5 ∂/∂b6 ∂/∂b7
Weight 8.32×101 7.86×101 5.25×101 1.32×101 1.33×101 5.69×101 4.90×101 L1 −1.39×10⁶ −7.86×10⁸ 1.10×10¹⁰ 1.23×10⁸ 1.52×10⁸ 2.79×10⁶ 0.00×100 L2 −6.20×10⁶ 8.97×10⁸ 1.01×10¹¹ 1.22×10⁹ –4.63×10⁸ 7.64×10⁷ 0.00×100 L3 0.00×100 3.58×10¹¹ 7.87×10¹² 1.53×10¹¹ 1.00×10⁸ 7.83×10⁹ 0.00×100 L4 −2.20×10⁸ 2.43×10¹¹ 9.13×10¹² 9.89×10¹⁰ –3.59×10¹⁰ 7.00×10⁹ 0.00×100 L5 −1.39×10⁹ 7.80×10¹² 6.86×10¹² 7.18×10¹⁰ 4.87×10¹⁰ 2.59×10⁹ 0.00×100 L6 8.00×10⁸ 1.05×10¹² 2.31×10¹³ 3.36×10¹¹ 2.58×10¹⁰ 3.06×10¹⁰ 0.00×100 L7 −4.97×10¹² –5.53×10¹³ 2.28×10¹⁵ 1.29×10¹³ 4.22×10¹³ 1.07×10¹² 0.00×100 L8 −2.75×10¹¹ 2.82×10¹³ 4.13×10¹⁴ 3.40×10¹² 1.15×10¹³ 1.94×10¹¹ 0.00×100 L9 0.00×100 2.18×10¹¹ 6.66×10¹² 1.01×10¹¹ –2.45×10¹⁰ 7.84×10⁹ 0.00×100 L10 0.00×100 3.05×10¹¹ 7.21×10¹² 1.25×10¹¹ –3.14×10¹⁰ 6.78×10⁹ 0.00×100
4.2 Results of Design Optimization
As shown in Tables 6 and 7, the optimum design is obtained in four design iterations (18 line searches in the second column). At the optimum design, the total mass is reduced by about 40% of the original mass (from 58.401 to 35.198 lb), while all fatigue life constraints are satisfied. Although the mass reduction of the drawbar assembly seems not to be important, the current design methodology in this study is supposed to be applied to other heavy military materiel. As shown in Fig. 6, the critical region at the base design is spread over the front of the central bar. Among ten design constraints, only the first and second constraints (at nodes 425 and 424) are violated or active at the base design. On the other hand, at the optimum design, the first, third, and sixth design constraints (nodes 425, 426, and 370) turn out to be active, as shown in Table 7.
At the optimum design, all thicknesses are decreased except for the central bar, and the width and height of all bars become smaller. Due to decrease of some sizing design parameters and both shape parameters, the mass is saved about 40%. The first two design parameters b1 and b2 begin to decrease slowly in the beginning of the optimization iterations and then rapidly decreased to the lower bound, since more rigid side bars and angles penalize the central bar so that fatigue life is decreased in the central bar. Moreover, increasing its thickness by 35% (b3: from 0.25 to 0.3375 in) further reinforces the central bar, resulting in a longer fatigue life in the central bar. At the optimum design, the fourth and fifth design parameters (triangle plates and side attachments) are reduced by about 9% since the weight can be effectively
reduced while the fatigue lives at the critical regions are not reduced significantly. Regarding to the shape design parameters, the width and height are reduced by about 10% and 17%, respectively. Design changes are summarized in Table 8.
Since optimization is carried out by considering only critical regions, the optimized design must be confirmed through reanalysis whether fatigue life over the entire drawbar assembly exceeds the required minimum fatigue life. As shown in Fig. 9, the original critical region (nodes 425 and 424) at the base design seems to be bifurcated into the original region (node 425) and around node 426 at the optimum design. Except the tip of central bar shown in Fig. 9(a), all other areas satisfy the required minimum fatigue life. Similar to the base design, the fictitious critical region is detected at the tip of the drawbar. As explained earlier in Section 2.3.1, it is suspected that the boundary condition at the tip caused the fictitious short fatigue life.
4.3 Results of Design Optimization Considering Notch Effects Having identified the region near node 425 on the trailer drawbar as the location of shortest fatigue life, it is now judicious to apply the fatigue-strength reduction factor (Kf) to account for the effect of geometric discontinuities located in the critical region, as shown in Table 9. The incorporation of a fatigue-strength reduction factor in the analysis reduces the predicted fatigue life in a manner proportional to the severity of the geometric discontinuity. In the critical region of the drawbar with short fatigue life, there are connection points

9 Copyright © 2003 by ASME
where other mechanical components are attached to the drawbar by rivets. Application of a fatigue-strength reduction
Table 6. Design History in Optimization for HMT DRAW Durability Model
Iteration W b1 b2 b3 b4 b5 b6 b7 0 58.401 0.2500 0.2500 0.2500 0.2500 0.2500 2.0000 3.0000 1 59.464 0.2494 0.2476 0.2762 0.2502 0.2503 1.9992 2.9966 2 61.186 0.2485 0.2437 0.3186 0.2506 0.2507 1.9980 2.9910 3 65.660 0.2462 0.2334 0.4297 0.2514 0.2519 1.9950 2.9764
1
4 60.865 0.2487 0.2444 0.3107 0.2505 0.2506 1.9982 2.9920 0 65.6560 0.2462 0.2334 0.4297 0.2514 0.2519 1.9950 2.9764 1 35.712 0.1000 0.1011 0.3424 0.2283 0.2286 1.8110 2.5226
2
2 24.990 0.1000 0.1000 0.2012 0.1910 0.1910 1.5134 1.7882 0 35.712 0.1000 0.1011 0.3424 0.2283 0.2286 1.8110 2.5226 1 35.578 0.1000 0.1000 0.3417 0.2281 0.2284 1.8092 2.5183 2 35.473 0.1000 0.1000 0.3405 0.2278 0.2281 1.8066 2.5115 3 35.198 0.1000 0.1000 0.3375 0.2269 0.2272 1.7994 2.4937 4 34.486 0.1000 0.1000 0.3297 0.2245 0.2248 1.7804 2.4471
3
5 35.402 0.1000 0.1000 0.3405 0.2278 0.2281 1.8066 2.5115 0 35.198 0.1000 0.1000 0.3375 0.2269 0.2272 1.7994 2.4937 1 19.704 0.1000 0.1000 0.1275 0.1622 0.1623 1.2888 1.2340 2 24.044 0.1000 0.1000 0.1975 0.1837 0.1839 1.4590 1.6542 3 29.212 0.1000 0.1000 0.2676 0.2053 0.2056 1.6292 2.0740 4 32.190 0.1000 0.1000 0.3036 0.2164 0.2167 1.7168 2.2903 5 34.649 0.1000 0.1000 0.3315 0.2250 0.2253 1.7848 2.4577 6 34.713 0.1000 0.1000 0.3322 0.2252 0.2255 1.7864 2.4619
4
7 34.900 0.1000 0.1000 0.3369 0.2267 0.2269 1.7976 2.4896 OPTIMUM 35.198 0.1000 0.1000 0.3375 0.2269 0.2272 1.7994 2.4937
Table 7. Constraint History in Optimization for HMT DRAW Durability Model
Iter. L1 L2 L3 L4 L5 L6 L7 L8 L9 L10 0 9.42×10⁶ 7.15×10⁷ 1.11×10¹⁰ 4.93×10⁹ 3.59×10⁹ 3.06×10¹⁰ 9.77×10¹¹ 2.16×10¹¹ 5.58×10⁹ 6.14×10⁹ 1 2.09×10⁷ 9.47×10⁸ 3.26×10¹⁰ 2.16×10¹⁰ 1.88×10¹⁰ 1.28×10¹¹ 2.49×10¹² 4.51×10¹¹ 8.73×10⁸ 1.16×10¹⁰ 2 5.90×10⁷ 2.36×10⁹ 1.06×10¹¹ 4.68×10⁹ 1.07×10¹¹ 1.46×10¹⁰ 9.62×10¹² 4.05×10¹² 6.17×10¹⁰ 9.99×10¹⁹ 3 1.07×10⁹ 1.28×10¹⁰ 2.09×10¹¹ 2.10×10¹² 1.13×10¹³ 2.00×10¹² 2.08×10¹⁴ 2.57×10¹³ 8.48×10¹¹ 9.99×10¹⁹
1
4 5.18×10⁷ 3.37×10⁸ 4.56×10¹⁰ 9.00×10¹⁰ 3.67×10⁹ 4.80×10¹¹ 8.01×10¹² 3.38×10¹² 2.02×10⁹ 9.99×10¹⁹ 0 1.07×10⁹ 1.28×10¹⁰ 2.09×10¹¹ 2.10×10¹² 1.13×10¹³ 2.00×10¹² 2.08×10¹⁴ 2.57×10¹³ 8.48×10¹¹ 9.99×10¹⁹ 1 7.47×10⁹ 1.25×10¹³ 2.36×10⁹ 2.00×10¹³ 1.28×10¹² 9.76×10⁹ 1.62×10¹⁵ 1.00×10¹³ 9.73×10¹¹ 2.50×10¹¹
2
2 6.00×10⁴ 1.47×10⁹ 6.60×10⁵ 5.22×10⁸ 5.10×10⁶ 1.13×10⁹ 1.05×10⁹ 6.77×10⁸ 1.27×10¹⁰ 6.16×10⁸ 0 7.47×10⁹ 1.25×10¹³ 2.36×10⁹ 2.00×10¹³ 1.28×10¹² 9.76×10⁹ 1.62×10¹⁵ 1.00×10¹³ 9.73×10¹¹ 2.50×10¹¹ 1 5.08×10⁸ 6.75×10¹² 4.18×10⁸ 4.44×10¹³ 3.86×10¹⁰ 9.07×10¹¹ 5.79×10¹⁵ 2.91×10¹¹ 1.60×10¹³ 1.44×10¹¹ 2 2.11×10¹⁰ 1.00×10¹³ 2.70×10⁹ 3.99×10¹³ 1.75×10¹¹ 1.07×10¹⁰ 9.03×10¹⁴ 7.01×10¹² 4.15×10¹⁰ 1.97×10¹¹ 3 8.99×10⁸ 3.82×10¹² 1.19×10⁹ 1.12×10¹³ 3.05×10¹¹ 1.97×10⁹ 1.78×10¹⁴ 3.68×10¹¹ 7.43×10¹² 1.17×10¹¹ 4 2.06×10⁸ 1.74×10¹² 4.02×10⁸ 9.00×10¹² 1.64×10¹¹ 1.59×10¹¹ 4.53×10¹³ 1.49×10¹² 5.34×10¹² 6.98×10¹⁰
3
5 4.59×10⁸ 3.67×10¹² 3.66×10⁸ 2.69×10¹³ 6.23×10¹¹ 4.42×10¹¹ 1.87×10¹⁵ 2.81×10¹² 1.69×10¹³ 1.13×10¹¹ 0 8.99×10⁸ 3.82×10¹² 1.19×10⁹ 1.12×10¹³ 3.05×10¹¹ 1.97×10⁹ 1.78×10¹⁴ 3.68×10¹¹ 7.43×10¹² 1.17×10¹¹ 1 3.00×10⁴ 1.79×10⁸ 3.00×10⁴ 1.50×10⁵ 3.00×10⁴ 7.11×10⁷ 1.20×10⁵ 1.08×10⁶ 3.40×10⁷ 1.53×10¹⁰ 2 3.00×10⁴ 1.29×10⁹ 4.20×10⁵ 4.79×10⁸ 2.55×10⁶ 8.49×10⁸ 4.08×10⁸ 3.05×10⁸ 1.69×10¹⁰ 6.81×10⁸ 3 6.09×10⁶ 7.42×10¹⁰ 1.10×10⁷ 9.06×10¹⁰ 1.76×10⁹ 3.65×10¹⁰ 2.91×10¹¹ 8.49×10¹⁰ 7.88×10⁹ 1.10×10¹⁰ 4 6.58×10⁷ 4.04×10¹¹ 5.56×10⁷ 3.65×10¹² 2.11×10¹⁰ 7.27×10¹⁰ 7.89×10¹² 6.80×10¹⁰ 3.55×10¹² 2.02×10¹⁰ 5 2.22×10⁸ 1.84×10¹² 4.29×10⁸ 1.23×10¹³ 1.82×10¹¹ 1.43×10¹¹ 5.13×10¹³ 1.57×10¹² 5.88×10¹² 7.27×10¹⁰ 6 2.39×10⁸ 1.94×10¹² 4.48×10⁸ 7.19×10¹¹ 1.88×10¹¹ 1.54×10¹¹ 5.67×10¹³ 1.68×10¹² 5.52×10¹² 7.60×10¹⁰
4
7 3.24×10⁸ 2.21×10¹² 2.47×10⁸ 8.25×10¹¹ 2.87×10¹¹ 2.22×10¹¹ 1.22×10¹⁵ 6.30×10¹² 8.91×10¹² 7.30×10¹⁰ OPT. 8.99×10⁸ 3.82×10¹² 1.19×10⁹ 1.12×10¹³ 3.05×10¹¹ 1.97×10⁹ 1.78×10¹⁴ 3.68×10¹¹ 7.46×10¹² 1.17×10¹¹

10 Copyright © 2003 by ASME
factor accounts for the reduction in the fatigue life that results from the presence of the rivet holes in the drawbar structure. Kf is calculated from the stress intensification factor, Kt, and the notch sensitivity factor, q. Based on references in the literature, values of Kt and q were estimated, and the associated Kf values were calculated to be 2.6. Using this Kf, the fatigue life on Perryman #3 course is estimated to be 9,580 miles, which means that a fatigue crack will not initiate and grow to a 2 mm length until the trailer traverses 9,580 miles of Perryman course #3 at 15 mph, or 638 hours of continuous running. While the fatigue life of the base design was 180 miles or 12 hours. This means that the fatigue life of the optimum design is 53.2 times more than the base design. Therefore, the fatigue life of trailer drawbar is significantly improved through the design optimization, while reducing the weight by 40%.
Table 8. Design and Weight Change between Base and
Optimal Designs
Design Base
Design, [in] Optimal
Design, [in] Change,
[%] t1 0.2500 0.1000 −60.0 t2 0.2500 0.1000 −60.0 t3 0.2500 0.3375 +35.0 t4 0.2500 0.2269 −9.24 t5 0.2500 0.2272 −9.12 h 2.0000 1.7994 −10.0 w 3.0000 2.4937 −16.9
Cost Base
Design, [lb] Optimal
Design, [lb] Change,
[%] Weight 58.401 35.198 −39.7
( a ) Life Contour on Top of Drawbar at Optimum Design
( b ) Life Contour on Bottom of Drawbar at Optimal Design
Figure 9. Life Contour on Drawbar at Optimal Design
Table 9. Fatigue Life w/o and w/ Considering Notch Effects
Predicted Fatigue Life w/o
Considering Notch Effects
w/ Considering
Notch EffectsDriving Cycle,
[block] 9.42×10⁶ 1.44×10³
Driving Mile, [mile] 1.18×10⁶ 180 Bas
e D
esig
n
Driving Time, [hour] 78500 12 Driving Cycle,
[block] 8.99×10⁸ 7.66×10⁴
Driving Mile, [mile] 1.12×10⁸ 9580
Opt
imal
D
esig
n
Driving Time, [hour] 7.49×10⁶ 638 Life Extension, [times] 95.4 53.2
4.4 Results of Reliability Analysis for Durability-Based Optimal Design
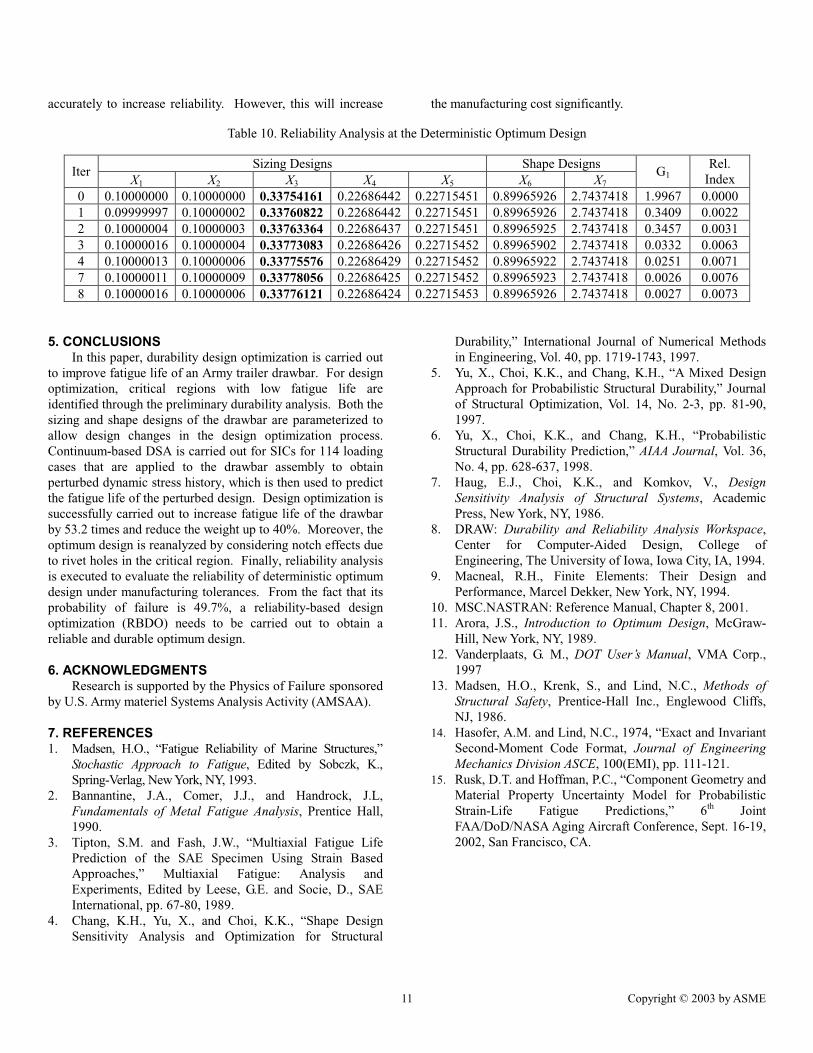
The reliability analysis of the durability-based optimum design is carried out to estimate the reliability. The result of reliability analysis highlights the need of a reliability-based design, since, in general, well-optimized deterministic design is supposed to be located near some design constraint boundaries and have 50% reliability.
As shown in Table 10, the optimal design turns out to be unreliable with 49.7% (β=0.073) of probability of failure, since the most probable point obtained from FORM are very close to the optimal design. Due to the fact that the deterministic optimal design is unreliable, it is necessary to perform a reliability-based design optimization (RBDO) for reliable and durable design. Among all random parameters, uncertainty of 3rd random parameter (central bar thickness) influences the probability of failure most significantly. Thus, unless a new reliability-based optimum design is obtained, the thickness of the central bar needs to be manufactured
426
424
425
4056
4099
370
368
369
4077
4095
11 Copyright © 2003 by ASME
accurately to increase reliability. However, this will increase the manufacturing cost significantly.
Table 10. Reliability Analysis at the Deterministic Optimum Design
Sizing Designs Shape Designs Iter
X1 X2 X3 X4 X5 X6 X7 G1
Rel. Index
0 0.10000000 0.10000000 0.33754161 0.22686442 0.22715451 0.89965926 2.7437418 1.9967 0.0000 1 0.09999997 0.10000002 0.33760822 0.22686442 0.22715451 0.89965926 2.7437418 0.3409 0.0022 2 0.10000004 0.10000003 0.33763364 0.22686437 0.22715451 0.89965925 2.7437418 0.3457 0.0031 3 0.10000016 0.10000004 0.33773083 0.22686426 0.22715452 0.89965902 2.7437418 0.0332 0.0063 4 0.10000013 0.10000006 0.33775576 0.22686429 0.22715452 0.89965922 2.7437418 0.0251 0.0071 7 0.10000011 0.10000009 0.33778056 0.22686425 0.22715452 0.89965923 2.7437418 0.0026 0.0076 8 0.10000016 0.10000006 0.33776121 0.22686424 0.22715453 0.89965926 2.7437418 0.0027 0.0073
5. CONCLUSIONS
In this paper, durability design optimization is carried out to improve fatigue life of an Army trailer drawbar. For design optimization, critical regions with low fatigue life are identified through the preliminary durability analysis. Both the sizing and shape designs of the drawbar are parameterized to allow design changes in the design optimization process. Continuum-based DSA is carried out for SICs for 114 loading cases that are applied to the drawbar assembly to obtain perturbed dynamic stress history, which is then used to predict the fatigue life of the perturbed design. Design optimization is successfully carried out to increase fatigue life of the drawbar by 53.2 times and reduce the weight up to 40%. Moreover, the optimum design is reanalyzed by considering notch effects due to rivet holes in the critical region. Finally, reliability analysis is executed to evaluate the reliability of deterministic optimum design under manufacturing tolerances. From the fact that its probability of failure is 49.7%, a reliability-based design optimization (RBDO) needs to be carried out to obtain a reliable and durable optimum design.
6. ACKNOWLEDGMENTS
Research is supported by the Physics of Failure sponsored by U.S. Army materiel Systems Analysis Activity (AMSAA).
7. REFERENCES 1. Madsen, H.O., “Fatigue Reliability of Marine Structures,”
Stochastic Approach to Fatigue, Edited by Sobczk, K., Spring-Verlag, New York, NY, 1993.
2. Bannantine, J.A., Comer, J.J., and Handrock, J.L, Fundamentals of Metal Fatigue Analysis, Prentice Hall, 1990.
3. Tipton, S.M. and Fash, J.W., “Multiaxial Fatigue Life Prediction of the SAE Specimen Using Strain Based Approaches,” Multiaxial Fatigue: Analysis and Experiments, Edited by Leese, G.E. and Socie, D., SAE International, pp. 67-80, 1989.
4. Chang, K.H., Yu, X., and Choi, K.K., “Shape Design Sensitivity Analysis and Optimization for Structural
Durability,” International Journal of Numerical Methods in Engineering, Vol. 40, pp. 1719-1743, 1997.
5. Yu, X., Choi, K.K., and Chang, K.H., “A Mixed Design Approach for Probabilistic Structural Durability,” Journal of Structural Optimization, Vol. 14, No. 2-3, pp. 81-90, 1997.
6. Yu, X., Choi, K.K., and Chang, K.H., “Probabilistic Structural Durability Prediction,” AIAA Journal, Vol. 36, No. 4, pp. 628-637, 1998.
7. Haug, E.J., Choi, K.K., and Komkov, V., Design Sensitivity Analysis of Structural Systems, Academic Press, New York, NY, 1986.
8. DRAW: Durability and Reliability Analysis Workspace, Center for Computer-Aided Design, College of Engineering, The University of Iowa, Iowa City, IA, 1994.
9. Macneal, R.H., Finite Elements: Their Design and Performance, Marcel Dekker, New York, NY, 1994.
10. MSC.NASTRAN: Reference Manual, Chapter 8, 2001. 11. Arora, J.S., Introduction to Optimum Design, McGraw-
Hill, New York, NY, 1989. 12. Vanderplaats, G. M., DOT User’s Manual, VMA Corp.,
1997 13. Madsen, H.O., Krenk, S., and Lind, N.C., Methods of
Structural Safety, Prentice-Hall Inc., Englewood Cliffs, NJ, 1986.
14. Hasofer, A.M. and Lind, N.C., 1974, “Exact and Invariant Second-Moment Code Format, Journal of Engineering Mechanics Division ASCE, 100(EMI), pp. 111-121.
15. Rusk, D.T. and Hoffman, P.C., “Component Geometry and Material Property Uncertainty Model for Probabilistic Strain-Life Fatigue Predictions,” 6th Joint FAA/DoD/NASA Aging Aircraft Conference, Sept. 16-19, 2002, San Francisco, CA.