strømme foundation’s speed school program in burkina faso
TRANSCRIPT

Fafo-report2018:27
Tewodros Aragie Kebede
Strømme Foundation’s Speed School Program in Burkina Faso, Mali and NigerEvaluation report


Tewodros Aragie Kebede
Strømme Foundation’s Speed School Program in Burkina Faso, Mali and Niger
Evaluation Report
Fafo-report 2018:27

2
© Fafo 2018 ISBN 978-82-324-0459-9 ISSN 2387-6859

3
Table of contents
Preface ..................................................................................................................................................... 5
Executive Summary ................................................................................................................................. 7
Key findings ......................................................................................................................................... 7
Key recommendations ....................................................................................................................... 10
1. Introduction ...................................................................................................................................... 12
2. Methods ............................................................................................................................................. 14
2.1 Long-term impact of the Speed School program ......................................................................... 14
2.2 Tracer study ........................................................................................................................... 16
2.3 Value for money analysis ...................................................................................................... 16
3. Overview of the Speed School program in West Africa ..................................................................... 21
4. Impacts of the Speed School Program ............................................................................................... 23
4.1 Providing access to out-of-school children ................................................................................. 23
4.2 Evidence on achievement of outcomes ....................................................................................... 24
4.3 Engaging households and communities ...................................................................................... 30
4.4 Capacity of education systems .................................................................................................... 31
4.5 Lessons from tracer study ............................................................................................................ 35
5. Value for money ................................................................................................................................ 38
5.1 Economy ...................................................................................................................................... 38
5.2 Efficiency and cost-efficiency ...................................................................................................... 38
5.3 Effectiveness and cost effectiveness ........................................................................................... 39
5.4 Equity ........................................................................................................................................... 40
6. Summary and recommendations ....................................................................................................... 41
Key findings ....................................................................................................................................... 41
Key recommendations ....................................................................................................................... 44
Annex 1. Summary of data collection activities .................................................................................... 46
Annex 2. Terms of reference ................................................................................................................. 47
Annex 2. Overview of Speed School Results ......................................................................................... 53

4
5
Preface
This report presents an evaluation of the Speed School program implemented by Strømme Foundation in three West African countries: Mali, Burkina Faso and Niger. The Speed School program is a nine-month accelerated learning program that provides three years’ worth of primary education to children who have never been to school or who have dropped out of school and wish to reintegrate back into the formal education system. The main purpose of this evaluation, commissioned by Strømme Foundation, is to document the long-term impact of the Speed School program and assess the return on investment that the program offers with the aim of improving program efficiency and effectiveness (value for money). The evaluation further serves to develop recommendations for adjustments that will improve the program as Strømme Foundation enters into a new strategic period.
This report is the product of its author, and responsibility for the accuracy of data included in the report rests with the author alone. The findings, interpretations, and conclusions presented do not necessarily reflect the views of Strømme Foundation.
September 2018
Tewodros Aragie Kebede

6

7
Executive Summary
This report presents the findings, conclusions, lessons learned and recommendations of an evaluation of the Speed School program implemented by Strømme Foundation in three West African countries: Mali, Burkina Faso and Niger. In 2004, West African education experts designed the Speed School program in Mali, in partnership with Strømme Foundation (SF). The program is a nine-month1 accelerated learning program that provides three years’ worth of primary education to children who have never been to school or who have dropped out of school and wish to reintegrate back into the formal education system. The course follows a condensed primary school curriculum, with the aim of transferring successful graduates into the fourth grade of formal school. A unique feature of the program is that children are taught to read and write in their local language during the first two months, and then continue with an accelerated curriculum in French. Since the program’s beginning in 2004, more than 150,000 out-of-school children have completed the program.
The main purpose of this evaluation, commissioned by Strømme Foundation, is to document the long-term impact of the Speed School program and assess the return on investment that the program offers with the aim of improving program efficiency and effectiveness (value for money). The evaluation further serves to develop recommendations for adjustments that will improve the program as Strømme Foundation enters into a new strategic period.
Key findings
Overall, the Speed School program has provided access to education for children that were out of school in Burkina Faso, Mali and Niger. During its current strategy period (2014-2018), Strømme Foundation, in collaboration with local implementing partners, has provided access to education and enrolled 61,900 out-of-school children in its Speed School centers. Through Norad provision, the program has enrolled 23,634 out-of-school children and has exceeded its expected target of enrolling 20,650 children.
The Speed School program has provided opportunities for out-of-school children to return to the formal school system and continue their education. The program has a 90 percent efficiency rate in terms of the number of students who initially enrolled in the Speed Schools and then became eligible to transfer to formal primary schools. The limited percent of inefficiency (10 percent) is due to drop out from the Speed Schools.
Gender equality is an integral aspect of the Speed School program, ensuring that 50 percent of its enrolled students are female. In the context where achieving gender equity in education is challenging, the program managed to reach close to its target, where 48 percent of enrolled children were female. This is slightly higher than girls’ enrollment in formal primary schools (47 percent in 20162) across the three countries. This achievement was made possible through promotional efforts in intervention communities and recruitment of girls into schools. During the initial phase of Speed School establishment, Strømme Foundation and its implementing partners worked extensively with
1 One additional month is used for training the Speed School instructors. The actual learning program is 9 months, making the total program period 10 months.
2 Using data from UNESCO Institute of Statistics: http://uis.unesco.org/en/home#tabs-0-uis_home_top_menus-3

8
community and religious leaders to create awareness on the importance of girls attending school. Girls’ enrollment was complemented by the employment of female instructors3 in the Speed Schools, where 40 percent of the 1,154 instructors during the 2014-2018 strategy period were female. Among students who graduated from the Speed Schools, 69 percent of girls are currently in formal primary schools in Niger, while this percentage is 49 and 57 percent in Burkina Faso and Mali respectively.
Previous studies on the impact of the Speed School program using a randomized control trial in Mali (IPA4, 2014) have shown that boys and girls start at different levels in French and mathematics. Such initial discrepancies affect future performance and the studies called for teaching mechanisms that pay particular attention to the needs of girls in mathematics. The studies identified the need for innovative teaching methods that address gender-differentiated starting points when enrolling students in the Speed School.
An area of challenge for the Speed School program is to ensure that its enrolled students are in the target age group of 8-12 years old and that they are out-of-school children. Survey data collected for this evaluation showed that nine percent of the sampled children were still in school and did not meet the out-of-school criteria when they joined the Speed School. Key informant interviews made with school officials suggest that children older or younger than the targeted age group were enrolled in the Speed School centers. In some instances, this was due to the lack of documentation (e.g. birth certificates) to clearly determine the age of the children at the time of enrollment, while in other cases implementing partners and community members misidentified the age of their children in order to benefit from the perceived better quality and cost-free Speed Schools.
Using survey data collected for this evaluation, among those students who were reintegrated into the formal primary school in 2015, 53 percent are currently in school. Referring to the individual countries, 33 percent of children are currently in school in Niger while this figure is 56 and 71 percent in Burkina Faso and Mali, respectively. The low figure in Niger appears to be related to older children dropping out of school, pervious drop out history, and gender and associated challenges. After reintegration to formal schools, both demand and supply side issues caused the majority of students to drop out. Demand side causes of non-attendance included lack of interest, family objections, and problems with the child’s health. Child labor was often mentioned as a reason particularly when it comes to domestic work for girls and farm work for boys. Marriage and domestic work explains a large proportion of female dropouts, while boys often drop out to seek income generating activities in off-farm activities such as mining. On the supply side, the lack of nearby schools, poor school infrastructure, lack of qualified teachers, lack of discipline and abuse at school are common reasons cited by the sample of Speed School graduates.
Across the three countries, analyses on the effect of the Speed School program showed that households who have children that attended the Speed School program have a higher percentage of children (aged 7-13) currently attending formal school (55 percent) compared to those households that didn’t have children in Speed Schools. This demonstrates the longer-term impact of the Speed School program to
3 It is important to note that we refer to the Speed School ‘teachers’ as instructors throughout this report because they have not had formal teacher training. When the word ‘teacher’ is used, we are referring to a person who has had formal teacher training, such as the teachers at the formal schools.
4 Studies by Innovations for Poverty Action (IPA) (2014, 2018).

9
be a 5 percent increase in school enrollment among households whose children passed through the Speed School program.
While the longer-term effect of the Speed School program is encouraging, the percentage of out-of-school children in sampled intervention communities remains around 50 percent in the three countries5. About 42 percent of households in the sampled intervention communities have children within the age range of 8-12 years old that are not currently attending school. In these contexts, the Speed School program remains a relevant program and plays an important role in reducing the number of out-of-school children.
Strømme Foundation’s exemplary approach of active mobilization of local communities has been the key factor for the success and cost efficiency of its Speed School program. Communities played important roles in supporting the recruitment of learners; and the contribution of land, labor and materials for the construction and maintenance of educational facilities, and the provision of accommodation for Speed School instructors. The communities’ contribution has been instrumental for the establishment of Speed Schools at scale.
The recruitment and selection of Speed School instructors were conducted in a manner that does not affect the formal primary schools negatively. The instructors are recruited from the communities with certain transparent criteria; and receive periodical training, supervision and follow up that ensures the quality of the education provided in the Speed School centers. This evaluation found various examples through qualitative interviews where, after the closure of the Speed School centers, some instructors further developed their careers as educators and obtained employment in the formal school. As such, the program is contributing to the much-needed capacity development of the education sector in West Africa.
The Speed School program is implemented through active participation of the local education authorities and teachers and head teachers in formal primary schools. Although the extent of participation varies across different communities, the local authorities play a significant role in the identification of intervention areas, the monitoring and supervision of the Speed School centers, and the evaluation and accreditation of the Speed School students. Teachers and head teachers in primary schools generally receive transferred students from Speed Schools in a supportive manner. These actors play an important role in reintegrating Speed School graduates and ensuring greater acceptance and ownership of the Speed School program.
Strømme Foundation has been effective in its engagement with educational authorities, including the development of a curriculum for the Speed School program that is in line with the national curricula. The intervention covers key learning areas relevant at the primary level, adheres to standardized guidelines in its Speed School programming, and conducts assessments that allow the reintegration of Speed School students into formal primary schools by recognizing students’ completion of learning at Speed Schools.
The average total expenditure for establishing and running one Speed School center over a 10-month period during 2014-2016 was 3,431 US dollars at the level of an implementing partner. Taking into account the actual number of enrolled students in the 650 established Speed School centers through the provision of Norad funding during this period, the average cost per enrolled child over a 10-month period was 132 US dollars. Communities contribute to establishing a Speed School by providing materials and labor required for the construction of classrooms. An innovative aspect of the Speed 5 Using data from UNESCO Institute of Statistics: http://uis.unesco.org/en/home#tabs-0-uis_home_top_menus-3

10
School program is community mobilization efforts that keep capital costs to a minimum making the program cost efficient. These efforts also enable the program to be implemented on a large scale. The cost of enrolling one out-of-school child in a Speed School is 0.4 USD per day, much lower than the poverty line of 2 USD per day. The economic profile of the families of the Speed School graduates demonstrates the program’s equitable reach to the poor and often marginalized households in the three countries. With economic reasons often cited as the underlying reasons for dropping out or never attending school, the program contributes in reducing inequalities of opportunities for out-of-school children. The Speed School program appears to provide high value for money given that program-level administrative costs are kept low.
Key recommendations
- Within the broader goal of achieving sustainable effects, SF should revisit its decision-making and implementation processes in the selection of program intervention areas. These processes should include systematic examinations of high potential impact areas, spatial overview of intervention areas and the maintenance of its programming standards, such as the presence and capacity of primary schools within 5km of intervention areas.
- SF could develop better implementation mechanisms and processes that ensure adherence to the set criteria for recruitment of out-of-school children in intervention communities. Such mechanisms should ensure recruitment is grounded in verifiable information and include mechanisms of accountability.
- Based on several years of experience in Speed School programming, SF should be in a good position to consider engaging with not only the reintegration of out-of-school children into formal schools but also the factors that have led to children dropping out or their exclusion from participating in school in the first place. This would entail embarking on interventions aimed at addressing the fragile and weak education systems in West Africa. With SF’s increased focus on a holistic approach, improved synergies between SF’s existing thematic program areas such as community-managed microfinance and capacity building may need to occur around the shared goal of supporting children to stay in school.
- SF should engage in the overall improvement of the education sector and promote the development of enabling conditions to ensure quality education that increases learning outcomes for all children while addressing the reduction of the number of out-of-school children. Partnerships and collaborations with other international and national actors would be relevant to focus on more concerted efforts. Addressing an aspect of weak education systems, such as the lack of qualified primary school teachers, SF could consider encouraging instructors it employs in its program to enter into the formal school system as assistant teachers, without transgressing the national teacher training structures. This support could include facilitating certifications and providing trainings by coordinating with national training institutes and the ministries of education. The experience Speed School instructors could gain would be relevant in helping them to advance and become full-fledged teachers in formal school systems. This would in turn contribute to increasing the number of qualified teachers in formal primary schools, ensuring the sustainability of SF’s efforts.
- While SF reports on standardized indicators on outputs and outcomes based on the program’s results framework, there is potential for gathering and utilizing relevant data in a systematic manner. Given the scale of its interventions, opportunities for program-level learning are immense. Improved data collection, organization, and utilization at various levels of the program’s results chain could facilitate more learnings. Such data may include students’ background information at

11
the time of recruitment (e.g. reasons for non-attendance of school, school enrollment rates), their attendance and their end-year assessment data. Such data could be systematically organized, analyzed and used for program-level learning, as well as to assess results against the theory of change, and to identify areas of improvement in programming.
- While commending SF’s previous attempts in using digital technologies, improved systems that allow timely updates of information should be deployed in its programming activities. Well-developed digital technologies can be used to collect data while thematic programming activities are underway in the intervention communities. Data on the retention and progression of reintegrated children in primary schools and learning outcomes can be gathered at a minimal cost. Such data could inform advocacy efforts towards relevant stakeholders in order to strengthen the education systems

12
1. Introduction
This report presents the findings, conclusions, lessons learned and recommendations of an evaluation of the Speed School program implemented by Strømme Foundation in three West African countries: Mali, Burkina Faso and Niger. In 2004, West African education experts designed the Speed School program in Mali, in partnership with Strømme Foundation (SF). The program is a nine-month accelerated learning program that provides three years’ worth of primary education to children who have never been to school or who have dropped out of school and wish to reintegrate back into the formal education system. The course follows a condensed primary school curriculum, with the aim of transferring successful graduates into the fourth grade of formal school. Since the program’s beginning in 2004, more than 150,000 out-of-school children have completed the program.
Commissioned by Strømme Foundation (SF), the main purpose of this evaluation is to document the long-term impact of the Speed School program, its impact on Speed School graduates and intervention communities, and to assess the program’s return on investment with the aim of improving program efficiency and effectiveness. The evaluation further serves to develop recommendations for adjustments that will improve the program as SF enters into a new strategic period.
Building on existing studies of the Speed School program, the evaluation synthesizes key findings from previous evaluations and reports, and documents the long-term impact of the Speed School program on beneficiaries and key stakeholders. In addition to documenting results, the evaluation provides clear recommendations for improving the program, with a particular focus on the transition of Speed School graduates to primary schools and the role that local communities and authorities can and should play in this process. The evaluation informs SF’s constant striving towards improving the efficiency and impact of its interventions and demonstrates the results of the program to key development partners. The evaluation also contributes to Strømme Foundation’s current process of developing and implementing its new Strategic Plan for the period of 2019-2023.
This evaluation is divided into three components (shown in Box 1.1.)
Box 1.1 // Evaluation Components
1. Study of the long-term impact of the Speed School program on:
> Speed School graduates
> Households and community levels
> Host primary schools and local education systems
> National education systems
2. Tracer study of the 2011-2012 cohort of Speed School graduates in Mali to measure and assess the
longer-term impact of the Speed School program on students and their immediate families
3. Assessment of the “value for money” of the Speed Schools program in terms of economy, efficiency and
effectiveness

13
Implementation
The scope of this evaluation is the Speed School program since its inception and includes previous internal and external studies and evaluations to assess the long-term impact of the program. The impact study covers communities where the Speed School program centers were closed in June 2015.
The data for this evaluation was collected between February-May 2018 in two phases. In the first phase (February-March 2018), secondary materials such as previous documents and financial information were collected. In addition, consultations with SF staff in the three countries and SF’s implementing partners were conducted. Field visits to selected villages were conducted during this phase to carry out interviews with key informants and hold focus group discussions.
In the second phase (April-May 2018), primary data was collected using surveys in the three countries along with in-depth interviews with various stakeholders. Data analysis and report writing were conducted in the final phase of the evaluation (May-June 2018). The findings of the different assessment methods are triangulated where lessons and recommendations are drawn from the evidence, synthesizing the various findings of the evaluation.

14
2. Methods
2.1 Long-term impact of the Speed School program
The primary data collection was carried out on several units of analysis specified in the Terms of Reference (ToR) using a mixed-methods approach that includes key informant interviews, focus group discussions, and statistical surveys. In addition to documenting knowledge and evidence on the impact of Speed School programs from existing internal and external evaluations and program documents, the evaluation gathered primary material using a representative sample of households in Speed School (SS) communities from Mali, Burkina Faso and Niger.
Through consultations with Strømme Foundation during the inception phase of the evaluation, we selected communities where the Speed School program closed in June 2015, taking into account practical considerations such as budget, access and security issues.
Desk research: We collected and analyzed secondary data, literature, Speed School program documentation, monitoring data, reporting obtained from Strømme Foundation, previous evaluations, as well as other available studies and statistical data including from various country sources. This provided important context and knowledge for the evaluation and informed the design of the primary data collection.
In-depth interviews: We conducted in-depth interviews with key informants identified from primary schools’ administration; teachers and head teachers; local, regional and national level authorities. A total of 17 interviews were carried out in the three countries covering each of these stakeholders.
Focus group discussions: We carried out eight focus group discussions in the three countries among community leaders and school management committees (SMCs). A total of 40 persons participated in these discussions.
Sample survey-graduates: A total sample of 244 graduates was selected from the 2014/15 cohort of the Speed School program in the three countries. We developed a structured questionnaire to gather data on experiences and perceptions of SS graduates.
Sample survey-households: A total sample of 692 households were randomly selected from communities where the SS program has been implemented, representing each of the selected regions. These include the Plateau Central region in Burkina Faso; Sikasso in Mali; and Dosso in Niger. These randomly selected households included families of Speed School graduates from the 2014/15 cohort. We developed a structured questionnaire to collect information on demography, education, economy, and attitudes and perceptions on education. The specific indicators were based on the evaluation questions (See ToR in Annex 2) and Strømme Foundation’s Results Framework for the Speed School Program. Instruments for data collection were developed and discussed with Strømme Foundation before the survey was implemented. Using digital technologies (ODK and Kobo Toolbox), Fafo’s local partners implemented the survey in the three countries.

15
Table 1 Unit of analysis and data collection strategy
Unit of analysis Themes for evaluation Strategy for data collection
Teachers and head teachers in formal primary schools
- Absorption capacity - Consequences as a result of Speed Schools - Interactions with SS schools and related effects - Perception of SS program - Perception on SS graduates - Knowledge of SS curriculum and pedagogy
- 12 in-depth interviews
Local and national education authorities
- Collaboration on transfer of SS graduates - Perception on quality of teaching and learning of SS:
curriculum and pedagogy - Perception on quality and competence of SS graduates - Perception on adequacy and quality of training of
instructors - Level of ownership of SS program - Effects of SS approach on the issue of “out-of-school
children” - Capacity and responsibilities on provision of education for
all children - Aspects of SS program relevant for formal school system
(e.g. monitoring by and accountability to stakeholders: parents, community leaders, etc.)
- Ownership of SS program - Opportunities and barriers on government ownership - Elements of SS program reflected in out-of-school policies
and frameworks
- Document reviews - 5 key informant
interviews with national level officials
Community members and School management committees (SMCs)
- Attitude and perception of children’s education - Attitude and perception of girls’ education - Experience in advocacy of children’s rights to education - Success stories in lobbying for resources for education - Roles after closure of SS schools
- 8 focus group discussions
SS Program level
- Effect on enrollment and completion rates - Effect on reducing the number of out-of-school children in
intervention communities
- Sample survey: 692 in three countries
Households - School attendance status of siblings - Attitude and perception of children’s education - Attitude and perception of girls’ education
- Sample survey: 692 households in three countries
SS graduates - Learning environment - Areas of improvement - Difference in experience with that of formal school - Experience in transition to formal school (barriers/enabling
mechanisms) - Proportion still attending school - Effect on self-esteem and confidence - Perception and treatment in families
- Sample survey: 244 graduates of Speed School 2014/15 cohort

16
The summary of sample surveys used in this evaluation is shown in Table 2 .
Table 2 Summary of sample surveys
Units Status Burkina Faso Mali Niger Total
Speed School
graduates
Target sample size 90 74 80 244
Response rate (%) 66 81 78 74
Effective sample size 58 60 62 180
Households Target sample size 218 232 240 692
Response rate (%) 96 89 94 93
Effective sample size 210 207 225 642
2.2 Tracer study
Tracer studies are particularly relevant for Speed School program to assess the long-term effects of the program on its graduates. This evaluation traced the 2011-12 cohort in Sikasso region in Mali. For the purpose of documenting the long-term impact of the Speed School program on students and their families, we originally planned to interview a sample of 20 students from the 2011-2012 cohort in Mali to obtain insights into their experiences before and after the Speed School program. However, tracing past students without structured information about past students was found to be a very difficult and time-consuming exercise. Despite these challenges, we conducted the following data collection activities:
- A sample of 9 students were interviewed: 4 of them individually and the remaining 5 in a focus group setting
- All the graduates from the 2011-12 cohort were traced from 20 centers and information on their current status was obtained
2.3 Value for money analysis
The conceptual framework for the value for money analysis (VFM) includes three components: economy, efficiency and effectiveness as shown in the diagram below. These three elements are addressed in this evaluation. To conduct the VFM analysis, financial information obtained from Strømme Foundation is utilized to trace inputs, outputs and expected outcomes of the program. The VFM conceptual framework is based on a logical ‘results chain’, which explicitly sets out the results to be achieved by a given program. Figure 1 below presents the main elements of this results chain and shows where the main dimensions of VFM can be measured.

17
Figure 1 Speed School program results chain6
The results chain is composed of six main elements:
1 Costs – the financial costs of inputs;
2 Inputs – the resources used, in terms of finance and staff time (capital and labor);
3 Process – the process by which inputs are transformed into results. Such processes can be the object of a program evaluation (which would be useful as a source of qualitative assessment), but cannot be quantified through VFM analysis. Such processes, for example, engaging with local educational authorities to identify intervention areas, recruiting and training instructors, conducting community resource mobilization activities, and recruiting out-of-school children are essential processes to the establishment of Speed Schools. These processes provide valuable insights about the relevance of the program;
4 Outputs – the direct deliverables of the Speed School program (number of established Speed Schools, number of students enrolled in Speed Schools, etc.);
5 Sustained actual outcomes – the actual change as a result of the Speed School program, such as the number of out-of-school children that have graduated and transferred to formal primary schools. This captures the extent to which the outcomes have been achieved.
6 Impacts – the longer-term impacts of the Speed School program, including impacts at the individual, household, community and national levels, e.g. reduced number of out-of-school children in intervention communities, increased rate of primary school completion, etc.
Equity needs to be considered at several levels of the results chain, including at the level of inputs, outputs, outcomes and impacts. Depending on data availability, this would mean conducting standard VFM analysis for different groups. These groups can be defined in many ways, depending on how inequity manifests itself, i.e. through differences in income, gender or social groups. In our analysis,
6 Adapted from Analysing Value for Money of DFID-funded programs. http://vfm-wash.org/vfm-guidance-note/ Accessed December 2018
(e.g. reduced number of out-of-school children in intervention communities)
(e.g. established speed schools)
(e.g. construction of speed school centers through community mobilization)
Costs (€)
Inputs (capital, labour)
Process
Outputs
Sustained actual outcomes
(e.g. actual number of speed school students-graduated and transferred)
Impacts
Effectivenes
Efficiency
Economy
Cost-effectiveness
Cost-efficiency
Equity

18
we provide an indication of the equity using survey data gathered for this evaluation by presenting the profile of targeted children and their households to provide an indication of the reach of the Speed School program. This entailed examining the economic profile of households in the Speed School intervention communities.
Five key VFM dimensions can be analyzed in the context of the Speed School program: economy, efficiency, cost-efficiency, effectiveness and cost-effectiveness. Each of these dimensions is defined by a conceptual relationship between two of the elements in Figure 1, as shown by the arrows linking the different elements. Questions that need to be answered in order to characterize these five key dimensions are presented in Figure 2 below.
Figure 2 Five dimensions for assessing VFM of Speed School program7
7 Adapted from Analysing Value for Money of DFID-funded programs. http://vfm-wash.org/vfm-guidance-note/ Accessed December 2018
VFM
Economy Efficiency
Cost
effectiveness
Cost
efficiency
Effectiveness
• How well have inputs been converted to outputs?
• Have planned outputs been achieved?
• If not, why not? What were the main implementation challenges?
• What are the costs per output (e.g. to build a speed school)?
• How much funding was leveraged from other sources of finance?
• How effective has the program been in converting outputs into sustained actual outcomes?
• Are the services from the program sustainable over time?
• What are the program costs per child and over time?
• How cost-effective have the efforts been in increasing equity (e.g. reaching the marginalized children)?
• Unit costs of key inputs? • Were inputs bought at the right
quality and right price? Do costs match to budget and those of other organizations?
• Efficiency of procurement?

19
Table 3 Definitions of the five dimensions for assessing VFM of the Speed School program
Description Indicators Economy Economy relates to the price at which inputs are
purchased (desks, books, motorcycles, etc.) Assessing economy consists of evaluating whether the program is buying inputs of the appropriate quality at the right price. Economy in procurement is important where school materials and goods can represent a high proportion of costs.
- Units of school materials
- Staff costs for different staff
categories
Efficiency Efficiency relates to how well inputs are converted into specific outputs, such as the construction of Speed Schools, recruitment campaigns, number of children attending Speed School, etc.
- % original targeted outputs
achieved for budgeted amount
Effectiveness Effectiveness relates to how well outputs from an intervention are converted into sustained actual outcomes. In contrast to outputs, the implementer does not exercise direct control over whether actual outcomes materialize and whether they can be sustained.
- % of assumed outcomes
translated into actual outcomes
- % of out-of-school children in the
communities
Cost-efficiency Cost-efficiency compares the costs of the Speed School program and the number of outputs and/or assumed outcomes reached. Cost efficiency would be expressed as cost per unit of output generated.
- Cost per output (cost per Speed
School)
- Cost per Speed School student
(i.e. assumed outcome) Cost-effectiveness
Cost-effectiveness is the cost of achieving intended program actual outcomes (or impacts). This can be used to compare the costs of alternative ways of producing the same or similar outcomes.
- Cost per actual Speed School
student (enrolled, graduated,
transferred to formal school)
Cost categories for VFM analysis
The VFM analysis included all expenditures that have contributed to achieving outputs and actual outcomes in a sustainable manner, including expenditures on relevant activities by actors outside the program when they can be monetized (such as financial expenditure on staff costs, and contributions by local communities).
For the purpose of the VFM analysis, we categorize costs by types of inputs distinguishing between infrastructure and program support costs. These cost categories are defined in Table 4 below.

20
Table 4 Speed School program cost categories
Description
Infrastructure Initial capital costs to put the Speed School centers in place. This includes
equipment for Speed School centers, pedagogical material for instructors, books
and materials for students.
Transportation This includes costs related to purchase of transport equipment such as motorcycles,
fuel and other transportation costs. Program support Cost of planning and implementing the activities of the Speed School. This includes
salaries of instructors, supervisors and coordinators, community sensitization,
follow up and training of instructors and supervisors, school end evaluations, audits,
and administrative costs.

21
3. Overview of the Speed School program in West Africa
The Speed School program is a nine-month intervention designed to provide access to education for out-of-school children (OOSC) aged 8-12 and enable them to enroll in a local school to complete their primary education. It consists of a condensed curriculum covering the first three years of primary education, and teaching is provided in a temporary school to groups with an average size of 25 learners. Upon completing the program, children are able to enroll in grade 4 of formal primary schools. Children are taught to read and write in their local language during the first two months, and then continue with an accelerated curriculum in French. The pedagogical approach was designed to encourage children to actively participate in classroom, with instructors providing intensified learning support.
During 2014-2018, SF and its implementing partners established 2,351 Speed Schools and enrolled 61,900 out-of-school children in Burkina Faso, Mali and Niger. This includes financial resources mobilized from various sources. Figure 3 below gives an overview of the program in West Africa.
Figure 3 Overview of Speed School program (2014-2018) in West Africa
MALI
Number of Speed Schools: 1,230
Number of enrolled students: 32,887
NIGER
Number of Speed Schools: 570
Number of enrolled students: 15,019
BURKINA FASO
Number of Speed Schools: 551
Number of enrolled students: 13,994
22
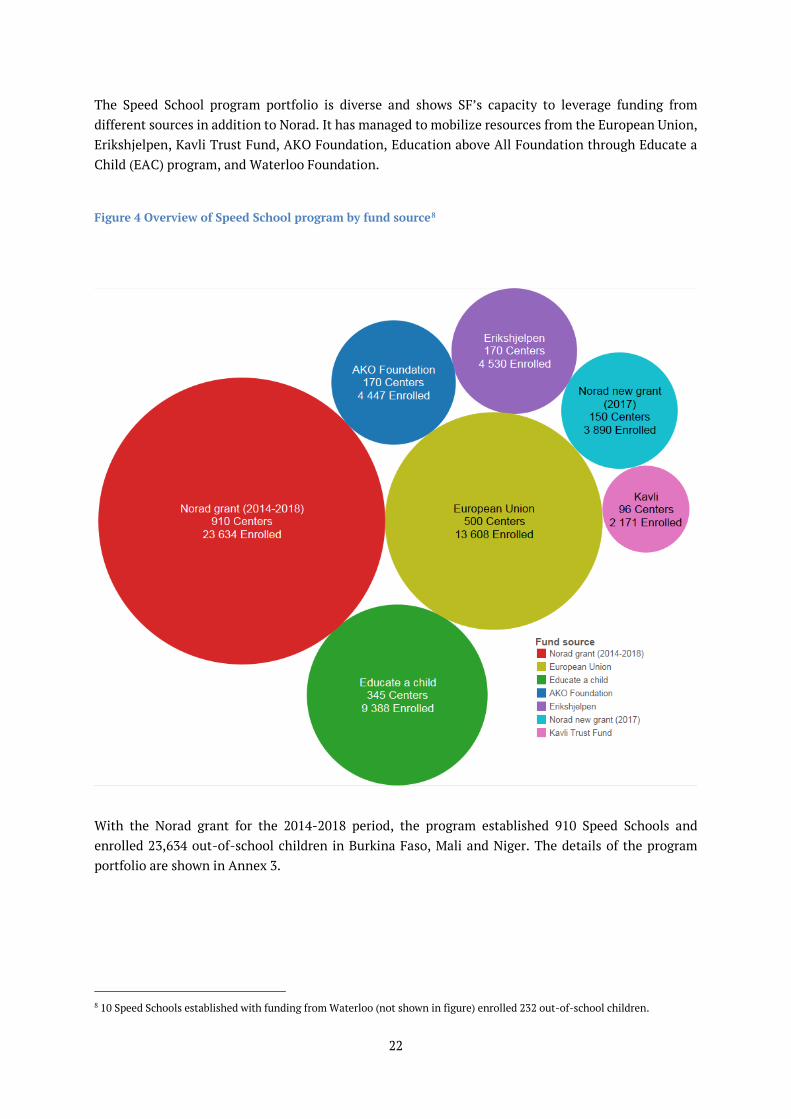
The Speed School program portfolio is diverse and shows SF’s capacity to leverage funding from different sources in addition to Norad. It has managed to mobilize resources from the European Union, Erikshjelpen, Kavli Trust Fund, AKO Foundation, Education above All Foundation through Educate a Child (EAC) program, and Waterloo Foundation.
Figure 4 Overview of Speed School program by fund source8
With the Norad grant for the 2014-2018 period, the program established 910 Speed Schools and enrolled 23,634 out-of-school children in Burkina Faso, Mali and Niger. The details of the program portfolio are shown in Annex 3.
8 10 Speed Schools established with funding from Waterloo (not shown in figure) enrolled 232 out-of-school children.

23
4. Impacts of the Speed School Program
This section addresses the impact of the Speed School program in terms of immediate outcomes as well as the longer-term perspective following the reintegration of children into the formal school system. It presents the evaluation findings related to the provision of education access to out-of-school children; achievement on outcomes (experience and performance in Speed Schools, reintegration in primary schools, longer-term outcomes); engagement of the Speed School program with households and communities, and the capacities of the education systems.
4.1 Providing access to out-of-school children
The Speed School program provided access to education for out-of-school children who have been left behind and may not have had the opportunity to go to school. The program established 2,351 Speed Schools and enrolled 61,900 out-of-school children during the 2014-2018 academic years across the three countries. With Norad funding, the program enrolled 23,634 out-of-school children and exceeded its enrollment target of 20,650 OOSC in the 2014-2018 program plans. The survey data collected showed that 69 percent of the Speed School graduates did not have any formal education while 22 percent had dropped out of school. Focusing on primary education, the program served children between 8-12 years old in line with SF’s Speed School programming.
An area of challenge for the Speed School program is to ensure that its enrolled students are in the target age group of 8-12 years old and that they are indeed out-of-school children. Survey data collected showed that nine percent of the sampled children were still in school and didn’t meet the out-of-school criteria when they joined the Speed School. Key informant interviews done with school officials suggest that children older or younger than this age group were enrolled in the Speed School centers. In some instances, this was due to the lack of documentation (e.g. birth certificates) to clearly determine the age of children at the time of enrollment. In other cases, it appears that implementing partners and community members misidentified the age of their children in order to benefit from the perceived better quality and cost-free Speed Schools.
While a limited number of children were already enrolled in primary schools, the general reasons for students to enroll in the Speed School program included: a lack of teachers in their existing primary school, the lack of a primary school in their village, low performance challenges, and transfer challenges due to children having to relocate. A student’s low level of performance in their primary school increases the risk that they will drop out of school and, as such, the Speed Schools provided opportunities to strengthen children’s school performance. In the context of existing mobility in the West African region, some children returning to their communities find it difficult to transfer to the formal primary school. For these students, the Speed School program served as a bridge to formal primary schools. Given the small number of students who reported joining the Speed Schools while already in primary school, coupled with the unintended positive consequences reported by the survey respondents, the Speed School program is not in direct competition with the formal primary schools and doesn’t undermine the formal school system.

24
Gender equality
Gender equality is an integral aspect of the Speed School program, ensuring that 50 percent of its enrolled students are female. In the contexts where achieving gender equity in education is challenging, the program managed to reach close to its target where 48 percent of enrolled children were female. This is slightly higher than girls’ enrollment in formal primary schools (47 percent in 20169) across the three countries. This achievement was possible due to the promotional efforts undertaken in intervention communities and the explicit recruitment of girls into schools. During the Speed School establishment phase, SF implementing partners worked extensively with community and religious leaders to provide messages on the importance of girls attending school. Employing female instructors in the Speed Schools also complemented girls’ enrollment. During the 2014-2018 strategy period, SF employed 1,154 teachers, of which 40 percent were female.
Inclusion of children with disabilities
There is limited evidence about the inclusion of children with disabilities in SF’s Speed School program for the 2014-2017 implementation period. However, through Norad provision spanning 2017-2021, SF has been giving particular attention to children with disabilities to establish a learning environment where children with disabilities are encouraged to be part of the Speed School program. The performance of this initiative could be a potential area for future exploration and learning.
4.2 Evidence on achievement of outcomes
The focus of SF’s Speed School program specified with in its Theory of Change is primarily to provide educational opportunities for out-of-school children and enable them (1) to reach 3rd grade level performance; that (2) depending on test scores, provide learners the opportunity to enroll at 3rd or 4th grade level; and eventually (3) complete primary school within the formal system. Children were taught to read and write in their mother tongue during the first two months, and then continue with an accelerated curriculum in French. The pedagogical approach was designed to encourage children to actively participate with teachers providing intensified learning support.
Evidence on experience and performance in Speed Schools
- How did Speed School graduates experience the learning environments in Speed Schools, including in terms of child protection/use of corporal punishment, gender equality and inclusion of children with disabilities, teachers’ attitudes towards students and availability of materials, etc.?
- What, if anything, could improve the Speed School experience for learners according to Speed School graduates?
- What, if any, impact did participation in the program have on the Speed School graduates’ self-esteem and confidence level?
The Speed School classrooms are temporary structures constructed by the communities using local building materials such as straw and wood. SF implementing partners equip the classrooms with chairs, desks, blackboard, and other necessary school materials. The program provides learning materials to
9 Using data from UNESCO Institute of Statistics: http://uis.unesco.org/en/home#tabs-0-uis_home_top_menus-3

25
students including textbooks, notebooks, pens and the like. The average number of students per classroom at each Speed School is 26 students.
When assessing the suitability of these classrooms, 73 percent of Speed School graduates reported that their classrooms are comfortable for learning. This however varies by country where 64 percent of SS graduates in Burkina Faso reported that their classrooms are comfortable, while it is 87 percent in Niger. Almost all respondents (97 percent) in the three countries reported that they have received school materials such as books, pens, notebooks, etc.
In the three countries, 54 percent of the Speed School graduates reported that they easily understood the lessons provided, while 36 percent of them reported that they had some difficulty. There are some differences in responses by gender. For example, girls in Burkina Faso reported a higher level of difficulty (58 percent) compared to boys (42 percent) in understanding the lessons provided.
Reviews of previous studies on the impact of the Speed School program, using a randomized control trial in Mali, have shown that boys and girls start at different levels in French and mathematics (IPA study, 2014). Such initial discrepancies affect future performance and the study called for implementing teaching mechanisms that focus on the needs of children with particular attention on the needs of girls in mathematics. The study identifies the need for innovative teaching methods that address gender-differentiated learning.
The majority of SS graduates assess the teaching provided by the instructor as good (61 percent) and very good (36 percent). Almost all students (98 percent) reported that the instructor was willing to provide guidance and support. With regards to participation in classrooms, 21 percent of the students across the three countries felt highly confident to participate in classroom activities such as answering or asking questions, while 54 percent of the students felt confident (Table 5). About 24 percent of the students reported that they felt less confident or afraid to speak up in class.
Table 5 Responses on confidence question item
Did you feel confident to participate in class (such as answering or asking questions) when you were at the Speed School?
Highly confident Confident
Less confident
Afraid to speak up in class Total
% % % % Total Sample
size Total 21 54 15 9 100 181 Burkina Faso
Total 10 61 15 14 100 59 Sex Female 11 68 11 11 100 28
Male 10 55 19 16 100 31
Mali Total 28 47 20 5 100 60 Sex Female 28 47 22 3 100 32
Male 29 46 18 7 100 28 Niger Total 24 55 11 10 100 62
Sex Female 27 51 16 5 100 37
Male 20 60 4 16 100 25
n=All sample graduates of Speed School program (2014/15 Cohort)

26
Across the three countries, SS graduates reported (54 percent) that the Speed School instructors punished students who were not “behaving properly”. The majority of the students across the three countries (61 percent) reported that they themselves were punished when they were not “behaving properly”. Punishment varies by gender where a higher percentage of boys in Burkina Faso (58 percent) reported that they were punished compared to 42 percent of girls. The types of reported punishments include verbal scolding, hitting with a stick or whip, staying on knees for some time, pounding rice, and being asked to write texts and not return to school until finished, etc.
It is important to understand the contextual realities in which the Speed School program is being implemented. In Burkina Faso, corporal punishment is illegal in primary schools but lawful in other schools such as at the secondary level. In Mali, corporal punishment is prohibited in schools. In Niger, corporal punishment is lawful in schools while there is a ministerial order against its use, but no prohibition in law10. While the legality of corporal punishment varies, it is rather a norm in public schools across the three countries and teachers (or instructors in the case of Speed Schools) are often perceived as being dedicated when they exercise ‘disciplinary’ measures. The task of transforming these traditional attitudes and practices is huge. The use of corporal punishment is common to many countries globally, and the countries which have achieved complete prohibition also implemented sustained educational measures to change beliefs and behavior11. To address this challenge, SF needs to institute the necessary measures prohibiting corporal punishment practices, including by improving the training of instructors it employs as well as the supervision and follow-up mechanisms.
Despite corporal punishment being used in the Speed Schools, 95 percent of the students reported that they feel safe in the school. This contrast may relate to the concept of safety as understood by the respondents, which does not necessarily include common practices of corporal punishment. The remaining five percent of the students reported that they don’t always feel safe due to the school environment. The roof and wall of the classrooms in the Speed Schools are made of straw and wood, with a dust floor. Some students reported that they don’t feel safe due to strong winds, rains, the reptiles that visit the rooms, the instructors who exercise punishments, and bullying by other students. Though the level of safety concern is rather low, improving the classroom conditions could be considered during the construction of the temporary physical infrastructures.
Overall, 97 percent of the students reported they learned how to read and write, and appreciated that lessons are provided in their own local language. The survey responses showed that the program enabled children to continue with their education through the provision of school materials and the regular presence of instructors; this is contrary to formal schools where teacher absence is a challenge.
In this evaluation, we examined the impact of the Speed School program on children’s self-esteem and found that 92 percent of the students felt confident about themselves after joining the Speed School. Self-confidence among girls is slightly higher than boys in Burkina Faso (89 percent), while for boys in Mali (96 percent) and Niger (94 percent), it was higher than girls by one percent. The program appears to be increasing self-esteem among children while affording them the opportunity to reintegrate into the formal school system.
10 Global Initiative to End Corporal All Punishment of Children: Country reports https://endcorporalpunishment.org/reports-on-every-state-and-territory/
11 Global Initiative to End Corporal All Punishment of Children: Regional reports www.endcorporalpunishment.org/wp-content/uploads/regional/West-Central-Africa-report-2014-EN.pdf www.endcorporalpunishment.org/wp-content/uploads/regional/WCA-briefing-2017-EN.pdf

27
While most students appreciate the opportunity to attend school, they reported that some aspects of the Speed School could be improved. These include improving the physical infrastructure of the classrooms (67 percent), creating simpler lessons (34 percent), increasing the provision of books and other school materials (20 percent), and employing more dedicated and engaged instructors (24 percent).
Evidence on reintegration into formal primary schools
The Speed School program has provided out-of-school children ages 8-12 years old with the opportunity to return to the formal school system and continue their education. Program-level data obtained from SF shows that the program has a 90 percent efficiency rate in terms of the number of students who initially enrolled in the Speed Schools and then became eligible to transfer to formal primary schools. The efficiency rate is slightly lower than SF’s program-level target of a 95 percent reintegration rate. A previous evaluation study that Innovation for Poverty Action (IPA) conducted in Mali found a similar rate of efficiency (89 percent)12. The reintegration efficiency rates are similar across the three countries during the 2014/15 - 2016/17 academic years, except the 2014/15 academic year in Niger where the reintegration rate was reported to be 75 percent.
It should be noted that these figures refer to children who are eligible for reintegration to the formal school system and may not reflect the actual number of children who physically attend primary schools. Using the survey data collected in the three countries, 86 percent of Speed School graduates from the 2014/15 cohort reported that they reintegrated into primary school and resumed their education in 2015. The remaining 14 percent of Speed School graduates did not continue with their education in the formal primary schools despite their eligibility. Furthermore, there are country-level differences: 24 percent of eligible students did not reintegrate into primary schools in Niger, while 5 and 12 percent of children did not resume their education in Burkina Faso and Mali, respectively.
Despite successfully completing the Speed School program, these students did not return to the formal education for a number of reasons. The survey results showed that this is often due to farm work for boys, domestic work for girls, a lack of interest from parents and children, the lack of nearby primary schools, and a concern about the difference in the quality of conditions in formal primary schools. SF needs to examine these concerns systematically when implementing the Speed School programs and strengthen its intervention by providing reintegration support to individual students and their families, as well as the receiving formal primary schools.
The efficacy of the Speed School program, in terms of retaining children and ensuring a smooth transition to the formal education system, needs to be reexamined in the contexts where the program is being implemented.
How did the Speed School graduates find the transition to primary school? Did they experience any barriers in transitioning and/or staying in school and what factors helped them do so?
How did the Speed School experience compare to the Speed School graduates’ experience once transferred to the formal sector?
12 Innovation for Poverty Action (2014) Speed School for Out of School Children in Mali: Evaluation Report

28
Speed School graduates (92 percent across the three countries) reported that they were well-received by teachers in the formal primary schools when they transferred. Some of the remaining students reported that their teachers initially doubted their skills when they joined the formal school and advised them to study hard; the teachers also offered them some follow up support.
The majority of the SS graduates (91 percent) reported that they were well-received by existing students in the formal school. Most of the students describe their experience as:
“I was very happy to see my friends. They invited me to play with them”.
“The students helped me by explaining the lessons I did not understand”.
The majority of the students (56 percent) found the lessons provided in the formal primary school more difficult than those at the Speed School. Students reported that the primary schools they transferred to were worse in terms of class size (50 percent), school infrastructure (44 percent), and teaching style (32 percent). Despite these challenges which they needed to adapt to, 94 percent of the students reported that they received encouragement from their parents to continue their education. Similarly, 88 percent received encouragement from their siblings, 86 percent from other family members, 91 percent from their teachers, and 83 percent from fellow students. SS graduates reported that they liked the school they transferred to (92 percent). However, some of the least favorable aspects of the formal primary schools included corporal punishment, difficult lessons, a lack of water and sanitation facilities, congested classes, joint teaching for different grade levels, and a lack of desks and chairs.
Evidence on longer-term outcomes
- What proportion of Speed School graduates (interviewed for the evaluation) are still in school? - To what extent has the Speed School program contributed to raising the primary school enrollment and
completion rates in intervention communities? How does this rate differ from comparable rural areas? - To what extent has the Speed School program been effective in reducing the number of out-of-school
children in the intervention communities?
The target sample of the survey was 244 graduates. During fieldwork, we located and interviewed 180 children. However, the data collection teams managed to obtain information from the parents and the schools on the school enrollment status of all 244 sampled children. We utilized the information on 243 children to determine their school enrollment status. One child was reported to have died and hence excluded from the estimation of school enrollment rates.
Currently, 53 percent of Speed School graduates in the 2014-15 cohort sampled for the survey across the three countries are attending formal primary school. There is a stark difference in school enrollment across the countries: only 33 percent of Speed School graduates are attending primary school in Niger, while enrollment rates in Burkina Faso and Mali are 56 and 71 percent respectively. The reported reasons for such low enrollment rates in Niger included repeated failures, bad treatment in schools, lack of school facilities, lack of interest, household chores and marriage for the girls.
The country differences can be explained by the characteristics of the cohorts. In Niger, the 2014-15 Speed School cohort is composed of relatively older children compared to Mali and Burkina Faso. It appears that older children are highly likely to drop out of school compared to their younger counterparts. In addition to the age factor, those students who dropped out of school before they joined the Speed School program have a higher chance of dropping out of school again after they integrated

29
into a formal primary school. This is in comparison to those students who had never been to school before they joined the Speed School program. Among previous drop outs who joined the Speed School program, 29 percent of them are currently in formal primary school in Niger, in contrast to 80 and 83 percent in Burkina Faso and Mali respectively. This finding, peculiar to the sample communities in Niger, show the persistence of the underlying reasons for dropping out of school after the program period.
With regards to gender, 65 percent of girls who attended the Speed School program are currently in school in Niger. In Burkina Faso and Mali respectively, 49 and 57 percent of girls who attended the Speed School program are currently in school. On the other hand, this shows that boys are more likely to drop out of formal primary school in Niger and Mali.
Based on qualitative observations during the field visits, the school conditions in the survey villages are relatively poor in Niger compared to those in Mali and Burkina Faso. For instance, schools in Burkina Faso have feeding programs while food availability was a main concern highlighted during focus group discussions in Niger. While discussing the conditions of schools, one elderly man participating in the focus group discussion in Niger stated the communities’ concern saying: “If the schools start feeding programs, we, the adults will attend school”. Such structural and systemic issues remain to be significant challenges explaining the continued dropout of children from school. While the Speed School program offers opportunities for OOSC to continue their education, the underlying factors that influence whether children remain in school were not addressed as they are beyond the scope of the program.
With regards to grade levels in primary schools, 73 percent of the students transferred to the expected 4th grade or above while the remaining 27 percent transferred to lower than 4th grade levels. The 2014/15 graduates of the Speed School program are currently expected to be in the 6th grade level at primary school. The progress of the students show that 50 percent of the graduates are in the expected grade level while 2 percent are currently attending middle school. The remaining students are attending 5th grade level (32 percent), while the rest (16 percent) are in fourth grade or lower grade levels. This shows that students’ progression is impeded as they were repeating grade levels, which may indicate the limited quality of learning in formal primary schools.
One of the main challenges for the Speed School program is generating evidence on whether and how the graduates of the program complete primary school. Tracking students once they leave the program remains the biggest challenge in this regard due to a lack of resources and available data. The Speed School program runs in an intervention area for a duration of 10 months. In order to provide more coverage and avoid that the Speed Schools become permanent structures that compete with formal school systems, the intervention areas vary year to year. As a result, information on medium and long-term outcomes is limited without a systematic collection of data through tracer study activities.
Across the three countries, additional analyses on the effect of the Speed School program show that households who have children that attended the Speed School program have a higher percentage of children (aged 7-13) currently attending formal school (55 percent) compared to those households that didn’t have a child in the Speed Schools. This shows the longer-term impact of the Speed School program to be a 5 percent increase in school enrollment among households whose children attended the Speed School program.
While the longer-term effect of the Speed School program is encouraging, the percentage of out-of-school children in sampled intervention communities remains around 50 percent in the three

30
countries13. About 42 percent of households in the sampled intervention communities have children within the age range of 8-12 years old that are not currently attending school. In these contexts, the Speed School program remains a relevant program and plays an important role in reducing the number of out-of-school children.
4.3 Engaging households and communities
- Do parents of Speed School graduates now send younger siblings to school?
- What examples are there of School Management Committees (SMCs) successfully advocating for a
children’s right to education in the intervention communities, including lobbying for new classrooms to
be built, new schools, more resources for education, etc.? What, if any, role do the SMCs play in the
intervention communities once the Speed School centers are closed?
A substantial number of households in the intervention communities (89 percent) reported that their attitudes towards their children’s education has improved favorably as a result of the Speed School program (Table 6). A large percentage (61 percent) of households in Mali reported that their attitudes have also improved a lot.
Table 6 Responses on attitudes question item
Has your attitude towards your children’s education favorably changed as a result of the Speed School program?
Total (%)
No, remained the same
(%) Yes, a little
(%) Yes, changed
some (%) Yes, changed
a lot (%)
Sample size (#)
Burkina Faso 11 8 39 42 100 201
Mali 11 13 15 61 100 198
Niger 13 11 32 45 100 183
Total in percent 11 11 29 49 100 582
Sample size 66 62 166 288 582
The strength of SF’s Speed School program has been the active mobilization of local communities in its programming where the communities serve as a critical resource for effective implementation at scale. Speed School Management Committees (SMCs) are made up of local leaders, parents and caregivers as part of the Speed School programming, where engagement with other community and religious leaders is recognized for their influence in overcoming existing beliefs and practices. SMCs monitor and follow up on instructor and student attendance at Speed Schools. Ideally, SMCs are also expected to continue following up with students in their communities once they are reintegrated into formal primary schools. However, focus group discussions showed that their roles seem to diminish after the closure of the Speed Schools. In cases where SMC members are also part of the formal primary school management committees, they continued to engage in this role.
13 Using data from UNESCO Institute of Statistics: http://uis.unesco.org/en/home#tabs-0-uis_home_top_menus-3

31
Communities contribute materials and resources to construct the classrooms, including labor, straw and wood. The classrooms are temporary in that during the rainy season and after the SS schools close, the classrooms are disassembled and the materials are returned to the community. SF implementing partners equip the classrooms with chairs, desks, blackboards, and other necessary school materials for students as earlier mentioned.
4.4 Capacity of education systems - To what extent are primary schools capable of absorbing the Speed School graduates upon transfer to the
formal system? What, if any, are the positive and/or negative consequences for formal primary schools receiving Speed School graduates?
In general, transferred Speed School graduates do find a place in formal primary schools. However, it is important to recognize that the capacities of the schools vary in the three countries and in some settings, it is not uncommon to find schools with no desks. For example, Mondeleize Primary school in the Dosso region of Niger has five classrooms and none of them have desks for children. Three of the classrooms have one desk (not in good condition) for the teachers. Otherwise, students have to sit on the dusty floor, which is covered with materials normally used for packing grains.
In some instances, the Speed Schools serve as the catalyst for the establishment of formal school schools in some villages. For example, the primary school in the village of Bia (Ecole Nampaga Coulibaly) in the Sikasso region of Mali was established after the Speed School center opened.
While this is a positive consequence of the Speed Schools, some Speed School graduates could not transfer to a formal school due to the lack of schools in their villages. For example, none of the graduates in the Ngolona Zanso village in Mali transferred to the primary school that is reported to be 8km away from the village. Parents of the Speed School graduates also did not want to send their children to the primary school 8km away because they thought that a school would then not be opened in their own village. Their demand to have a primary school established in their village is a significant enough reason not to send their children to the nearby school. Furthermore, they argued that due to the distance of the primary school, their children would need to live in the nearby village in order to attend. Meanwhile, they also feared that their children would end up having to do farm work for their host families instead of attending school.
The case of Ngolona Zanso exemplifies some of the limitations during the implementation of the Speed School program. SF existing guidelines are clear with regards to the requirements on the placement of the Speed School centers - that they should be placed within 5km of existing primary schools. Focus group discussions and key informant interviews indicate this standard is not always adhered to. While the evaluation has not assessed the full extent of the locations of Speed School centers relative to formal primary schools, it is important to emphasize the point of ensuring standards are maintained during implementation by SF’s local partners.

32
- How do primary school teachers and head teachers perceive the Speed School program and the Speed School graduates?
Teachers and directors of primary schools interviewed for this evaluation perceived the Speed School program as an important undertaking that addresses the issue of out-of-school children. The program is perceived as providing a second chance for older children that would otherwise have no chance of attending school. Furthermore, the program’s unique approach of introducing the local language in its curriculum is perceived as a good approach that increases learning outcomes for children. Interviews with teachers and head teachers in formal primary school show that graduates of the Speed School program are performing as well as other students in the receiving primary schools. A study conducted by IPA on the performance of students found similar results14.
- Where Speed Schools are located in close proximity to formal schools, are there negative impacts on the host formal school? Does the Speed School attract pupils and/or teachers/other staff from the host school?
This evaluation did not find any negative impacts on the host formal school. Instead of attracting teachers from the nearby primary schools, it is reported that some of the Speed School instructors have eventually become teachers and school directors. As such, the Speed Schools have served as a stepping stone towards formal employment in primary schools. The Speed School is therefore contributing to the ecosystem as an intermediary mechanism for producing teachers, an unintended positive effect.
- What knowledge and understanding do primary school teachers and head teachers have of the Speed School program, in particular its curriculum and pedagogy?
The teachers and directors interviewed have a general knowledge about the program. However, the extent of knowledge on the program is limited to the purpose of the program and not necessarily on its curriculum and pedagogy. This is due to the fact that some of the interviewed primary school teachers were relatively new to their schools and the Speed School program no longer exists in the villages. In some instances, the teachers have no idea about the program, despite being in the school during the time when the SS school was running
- Do local education authorities work with formal schools to prepare them for the transfer of Speed School graduates?
In the three countries, the local education authorities are instrumental in the transfer of the Speed School graduates. Local education authorities carry out the evaluations of the Speed School students with the participation of the primary school directors or teachers who conduct the assessments of the students before they transfer to the formal school system. This shows that, without the local education authorities, the implementation of the SS program would be unsustainable.
14 Innovation for Poverty Action (IPA): Etude complémentaire de l’évaluation d’impact de la Stratégie de Scolarisation Accélérée / Passerelle, Strømme Foundation, March 2018.

33
- How do the local education authorities view the Speed School program in terms of quality of teaching and learning, in particular the curriculum and pedagogy? How do they perceive the quality and competence of Speed School instructors? Is the training that the Speed School instructors provide perceived to be adequate and of good quality?
Based on the key informant interviews, the quality of the Speed School program in terms of teaching and learning is generally perceived as good. The aspect of the program that informants consistently appreciate is that teaching is done in the local language to increase learning outcomes. The Speed School program enables a smooth transition into school by incorporating the local language in its curriculum. The general assessment of the quality and competence of the Speed Schools by the various informants is that the instructors are generally competent.
- What is the extent of ownership of the program by local education authorities?
The Speed School program is primarily run by SF’s local implementing partners including the administration of the Speed School centers, the recruitment of instructors, supervision and follow up of the centers. The local education authorities provide the necessary permits for the SS centers and participate in the decision-making process of where the centers are setup. Furthermore, local authorities participate in the recruitment and training of instructors and supervision of the Speed School centers in collaboration with the local partners. The local education authorities also conduct the assessment of the Speed School students at the end of the 9-month of school with the participation of the primary school staff such as directors and teachers. Hence, indirect ownership of the program is ensured through the participation of local education authorities in the planning and implementation aspects of the program.
- Has the implementation of the Speed School program led to any change in how the local education authorities address the issue of out-of-school children?
The high number of out-of-school children in the three countries presents a significant challenge to educational authorities. As such, the Speed School program plays an important supplemental role to broader efforts in providing education for all. The local education authorities struggle to provide education given challenges in finding and providing teachers, school materials and infrastructure. While the positive role of the Speed School program is highly recognized in addressing out-of-school children, local education authorities’ capabilities are limited to maintaining the rather fragile and weak education system due to capacity and resource limitations.
- To what extent do the local education authorities recognize their responsibility as duty bearers in providing access to education for all children?
Local authorities generally recognize their responsibility as duty bearers in providing access to education for all children. However, service delivery in Mali, Niger and Burkina Faso is generally carried out by civil society actors. The local authorities we interviewed emphasized the importance of civil society’s continued engagement in providing education for children while pointing to limited financing from the state. While the capabilities of the three states around providing education for all relatively varies from one another, the states do remain weak and generally dependent on civil society actors such as SF and its implementing partners.
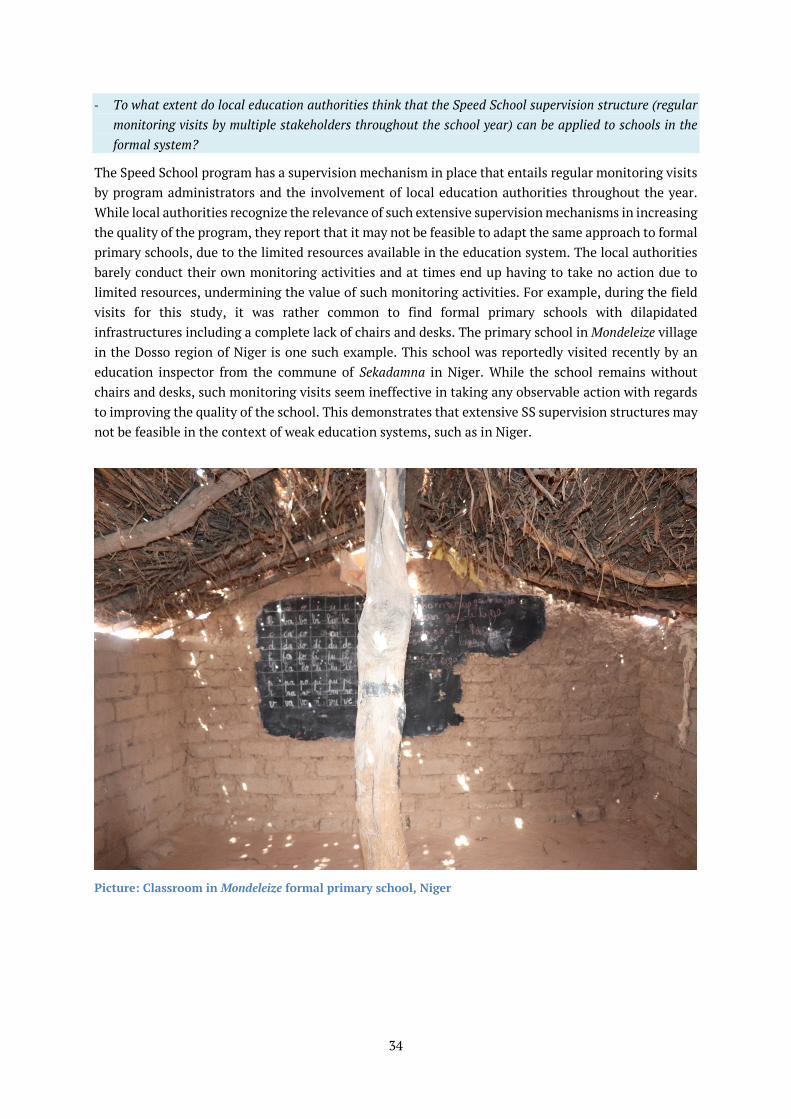
34
- To what extent do local education authorities think that the Speed School supervision structure (regular monitoring visits by multiple stakeholders throughout the school year) can be applied to schools in the formal system?
The Speed School program has a supervision mechanism in place that entails regular monitoring visits by program administrators and the involvement of local education authorities throughout the year. While local authorities recognize the relevance of such extensive supervision mechanisms in increasing the quality of the program, they report that it may not be feasible to adapt the same approach to formal primary schools, due to the limited resources available in the education system. The local authorities barely conduct their own monitoring activities and at times end up having to take no action due to limited resources, undermining the value of such monitoring activities. For example, during the field visits for this study, it was rather common to find formal primary schools with dilapidated infrastructures including a complete lack of chairs and desks. The primary school in Mondeleize village in the Dosso region of Niger is one such example. This school was reportedly visited recently by an education inspector from the commune of Sekadamna in Niger. While the school remains without chairs and desks, such monitoring visits seem ineffective in taking any observable action with regards to improving the quality of the school. This demonstrates that extensive SS supervision structures may not be feasible in the context of weak education systems, such as in Niger.
Picture: Classroom in Mondeleize formal primary school, Niger

35
4.5 Lessons from tracer study
This evaluation attempted to trace past graduates from the 2011-12 cohort of the Speed School program in the Sikasso region of Mali. The graduates are expected to be at middle school level and the tracer exercise was carried out by visiting the middle schools to which the students were transferred. The status of each student was determined using information provided by the directors of the middle schools and fellow students in visited classrooms. Out of a total of 441 graduates, 44 percent are currently in school while 36 percent are reported to have dropped out of school. About 5 percent of the students, all of them girls, are reported to have been married and left school. Due to a lack of information, the tracer exercise could not determine the school status of 15 percent of the graduates (Table 7).
Table 7 Status of 2011/12 graduates of Speed School students in Mali
Current school status Number Percent
Dropped out of school 160 36
Deceased 1 -
In school 194 44
Married 20 5
Could not be traced /status unknown 66 15
Total 441 100
Despite the lack of a structured database of past students which made the tracer exercise difficult, we managed to identify 9 students who consented to sharing their experiences. The experiences of some of the students presented in this section provides insights on the relevance and impact of the Speed School program. As the stories of the following four students show, the Speed School program has provided positive, impactful opportunities to out-of-school children who are now aspiring to achieve various careers.
Modibo Dembele is a 16-year old boy who is currently attending middle school in Sikasso, Mali. He had never been to school and got an opportunity to attend school after he joined the Speed School program. He was very happy to have joined the Speed School center and appreciated that the lessons were provided in the local language, Bambara. His father Mr. Dembele was the secretary of the school management committee for the Speed School and helps Modibo with homework. Modibo has five sisters and one brother. On the days when there is no school, Modibo works in a small factory that packages water and helps his family with farming activities, such as planting ginger. With his literate father as his role model, Mobidbo aspires to be an electrician. He values education as he believes it will help him achieve his life ambitions.
Pictured: Modibo (right) with his father

36
Mariam Dembele is 16 years old and joined the Speed School program in 2011/12. She is currently in 8th grade. Mariam has six siblings and they moved to Sikasso, Mali in 2011. Finding a school was difficult and the Speed School program provided an opportu-nity for her to continue her education after the family’s relocation. The Speed School center has been useful for girls like her who are often busy selling produce at the market than attending school. She would
like to join a professional school to learn administration and accounting. She expresses the value of education as: “Without education, you cannot stand for yourself”.
Assitan Bissan joined the Speed School program in 2011 and is currently in 8th grade. Assitan is 16 years old and comes from a large extended family with 15 members. Before she joined the Speed School, she was attending a primary school that didn’t have a sufficient number of teachers. During the time, she was older than the rest of her classmates and her teacher recommended the Speed School as a mechanism to transfer to a level suitable for her age. The Speed School center was good and she enjoyed learning in the local language, Bambara. She plans to continue her
education in high school and aspires to become a nurse. She gets help in her school activities from her brother Salifou who attends high school.
Pictured: Assitan (left) with her father and sister
Pictured: Mariam (left) with her mother

37
Zoumana Deno is 16 years old and has two brothers and four sisters. He lives with his mother and his father has passed away. Before he joined the Speed School program, Zoumana had never been to school. He is the only one in his family that is currently attending school. He is in 8th grade and aspires to be a pharmacist.
Pictured: Zoumana (right) with his mother and sister

38
5. Value for money
5.1 Economy
We assessed the overall economy of the Speed School program by examining whether inputs were purchased at the appropriate quality and at the right price. Qualitative information obtained from discussions with the SF’s Regional office staff was used to assess the economy dimension of VFM at the level of input costs. The Speed School program requires purchase of inputs such as chairs and desks for students, school materials (books, pens, etc.), transportation equipment (motorcycles), etc. Interviews with SF and implementing partners show that inputs are purchased at standardized costs in reference to budget. The procurement process has primarily been carried out at the implementing partner level and with limited oversight from SF’s regional and country offices in Burkina Faso, Mali and Niger. Recognizing the need for accountability and accordance among implementing partners in line with SF’s global procurement policy, the SF Regional Office in Mali recently established procurement guidelines. They must also seek approval from the Regional Office at various steps of the procurement process, for example for material specifications, tendering, selecting providers and checking on the quality of purchased materials.
5.2 Efficiency and cost-efficiency
Assuming that plans and budgets have been appropriately drawn up and expenditure is in line with budgets, meeting planned targets can be used as a proxy indicator of efficiency. SF uses a standardized budget for the Speed School program with details on budget components relevant for the Speed School program. During 2014-2018, SF established 910 Speed Schools in Burkina Faso, Mali and Niger and enrolled 23,634 children in these schools. As such, the program achieved more than its expected target of 820 Speed Schools with the budget allocations from Norad.
It is important to note that Norad budget allocations were made on thematic areas and the Speed School program is under the education thematic area. The specific budget allocation for Speed Schools was not clear from the outset other than the specification of the target number of Speed Schools. Tracing expenditures related to the Speed School program follow-up and monitoring activities at the country, regional and head office levels was difficult for the years before 2017, as the accounting system did not separate costs for these activities. However, expenditures at implementing partner levels are fully accounted for and available from annual financial and audit reports.
The average total expenditure for establishing and running one Speed School center over a 10-month period during 2014-2016 was 27,637 NOK (3,431 US dollars) at the implementing partner level. During the 2014-2016 academic years, the Speed School program enrolled 16,950 out-of-school children. Taking into account the actual number of enrolled students in the 650 established Speed School centers from Norad funding during this period, the average cost per enrolled child over a 10-month period was 1,060 NOK (132 US dollars). Communities contribute to the establishment of Speed Schools by providing materials and labor required for the construction of classrooms. SF estimates show that community contributions for constructing classrooms are valued at 725 NOK (90 USD) and the same for food provision and accommodation for Speed School instructors (725 NOK/90 USD). These contributions make the program cost efficient and enable the implementation of the program at large scale.

39
XOF NOK EUR USD
Economy SF standard budget per Speed School 3 499 639 50 745 5249 6 299 Expenditure 1 238 893 043 17 963 949 1 858 340 2 230 007 Community contribution for class room constructions 50000 725 90 90
Community contributions for providing food and accommodation for Speed School instructors 50000 725 90 90
Cost Efficiency
Total cost per Speed School center 1 905 989 27 637 2 859 3431
Infrastructure cost 427 595 6 200 641 770
Transportation equipment and running 160 504 2 327 241 289
Program support 1 317 890 2 762 286 2372
Salary instructors 539 078 7 817 809 970
Salary supervisors/coordinators 379 094 5 497 569 682
Training 209 241 3 034 314 377
Other program support 190 476 2 762 286 343 Total cost per enrolled child in Speed School centers
73 091 1 060 110 132
Cost effectiveness Total cost per transferred child to formal primary school
81095 1 176 122 146
Infrastructure cost 18193 264 27 33
Transportation 6829 99 10 12
Program support 56073 813 84 101
Salary instructors 22936 333 34 41
Salary supervisors/coordinators 16130 234 24 29
Training 8903 129 13 16
Other program support 8104 118 12 15
Exchange rates to XOF 0.0145 0.0015 0.0018
5.3 Effectiveness and cost effectiveness
Effectiveness and cost-effectiveness assess how the Speed Schools retain enrolled children over the 10-month program period including one-month training for instructors, how they are evaluated at the end of the school year and then transferred to formal primary schools. As such, the actual number of transferred students is taken into account when assessing effectiveness. During the 2014-2016 academic years, the Speed School program evaluated and transferred 15,277 children into formal primary schools. The cost per transferred child during the 10-month period was 1,176 NOK (146 US dollars).
40
UNESCO estimates on government expenditure per primary school student in Burkina Faso and Mali is 272 purchasing power parity (PPP) USD, while it is 214 PPP USD in Niger for a school year15. The Speed School program provides out-of-school children with three years of equivalent education and hence the average expenditure becomes 49 USD per reintegrated student for a school year. The cost of enrolling one out-of-school child in a Speed School is 0.4 USD per day, which is much lower than the poverty line of 2 USD per day. The Speed School program offers high value for money when compared to national level benchmarks.
These assessments do not take into account program administrative costs at the level of Strømme Foundation and are only indicative of actual costs at the level of implementing partners. However, comparisons with benchmarks such as national level per student expenditure for primary education and poverty lines show that the program is cost effective, assuming program level follow up and administration costs are kept low.
5.4 Equity
In this evaluation, we assessed equity by examining the economic profile of households in the sample of the Speed School program intervention communities. Using the concept of the economic ladder where the poor are at the bottom of the ladder and the relatively well off on the top, respondents were asked to rank their households’ economic status on a scale of one to six. Using these subjective assessments, 49 percent of households in the intervention communities consider themselves as poor. Among households of children who attended the Speed School program, 50 percent of them consider themselves as poor, while 37 percent consider themselves as at the middle level and the remaining 13 percent ranked at the relatively higher level of economic ladder. This demonstrates the Speed School program’s equitable reach to the poor and often marginalized households in the three countries. With economic reasons often cited as the underlying reasons for dropping out or never attending school, the Speed School program contributes to reducing inequalities for out-of-school children in accessing opportunities.
15 UNESCO estimates of government expenditure in primary education in 2015. http://uis.unesco.org

41
6. Summary and recommendations
The main purpose of this evaluation, commissioned by Strømme Foundation, is to document the long-term impact of the Speed School program and assess the return on investment that the program offers, with the aim of improving program efficiency and effectiveness (value for money). The evaluation further serves to develop recommendations for adjustments that will improve the program as Strømme Foundation enters a new strategic period.
The Speed School program has supplemental roles in addressing the issue of out-of-school children rather than replacing formal schools on a permanent basis. The availability and quality of primary school systems are crucial enabling conditions for sustaining the effects of the Speed School program. The lack of schools, very poor school conditions, lack of school materials, and weak school systems exhibited in these countries, and particularly in Niger, are some of the underlying reasons for school dropouts and slower educational progress. Concerted efforts, better approaches and strategies that address weak school systems are needed in order to achieve sustainable impacts that effectively address the challenge of out-of-school children in West Africa. With SF embarking on a new five-year strategy, the evaluation findings provide useful lessons for reflections and devising better mechanisms and approaches for program implementation.
Key findings
Overall • The Speed School program has provided access to education for children that were out-of-school
in Burkina Faso, Mali and Niger. During its current strategy period (2014-2018), Strømme Foundation, in collaboration with local implementing partners, has provided access to education and enrolled 61,900 out-of-school children in its Speed School centers. Through Norad’s support, the program has enrolled 23,634 out-of-school children and has exceeded its expected target of enrolling 20,650 children.
• The Speed School program has provided opportunities for out-of-school children to return to the formal school system and continue their education. The program has a 90 percent efficiency rate in terms of the number of students who initially enrolled in the Speed Schools and then became eligible to transfer to formal primary schools.
• Across the three countries, analyses on the effect of the Speed School program showed that households who have children that attended the Speed School program have a higher percentage of children (aged 7-13) currently attending formal school (55 percent) compared to those households that didn’t have children in Speed Schools. This demonstrates the longer-term impact of the Speed School program to be a 5 percent increase in school enrollment among households whose children passed through the Speed School program.
Gender equality • Gender equality is an integral aspect of the Speed School program and in contexts where achieving
gender equity in education is challenging, the program managed to reach close to its target: 48 percent of enrolled children were female. This is slightly higher than girls’ enrollment in formal primary schools (47 percent in 201616) across the three countries. Girls’ enrollment is also
16 Using data from UNESCO Institute of Statistics: http://uis.unesco.org/en/home#tabs-0-uis_home_top_menus-3

42
complemented by the employment of female instructors, where 40 percent of the 1,154 instructors employed in the Speed Schools during 2014-2018 strategy period were female.
• Previous studies on the impact of the Speed School program, using a randomized control trial in Mali, have shown that boys and girls start at different levels in French and mathematics (IPA study, 2014). Such initial discrepancies affect future performance, and the study called for innovative teaching mechanisms that address gender-differentiated starting points when enrolling in Speed Schools.
• Parental attitudes towards girls’ education may also be negatively influencing school attendance and girls’ education performance. The survey data showed that 23 percent of households agreed with the statement “Education is more important for boys than girls”. Furthermore, 30 percent of respondents agree with the statement “School exposes adolescent girls to advances from boys and to indecent behavior”. Such strongly held attitudes towards girls’ education require interventions aimed at social change by actively engaging parents in school matters, awareness raising on the relevance of education, and providing safe and secure learning environment for girls.
In-school and out-of-school children • An area of challenge for Speed School programs is to ensure that its enrolled students are in
the target age group of 8-12 years old and that they are indeed out-of-school children. Key informant interviews with school officials suggested that children older or younger than this age group were enrolled in the Speed School centers. Survey data collected showed that 9 percent of the sample children in the intervention communities were still in school and didn’t meet the out-of-school criteria when they joined the Speed School.
• Using collected survey data, among those students who reintegrated into the formal primary schools in 2015, 53 percent of the children are still currently in school: 33 percent of children are currently in school in Niger, while this figure is 56 and 71 percent in Burkina Faso and Mali respectively. After reintegration to formal school, the majority of students dropped out for various reasons related to a variety. Of issues on the demand and supply sides.
• Across the three countries, analyses on the effect of the Speed School program show that households’ who have children that attended the Speed School program have a higher percentage of children (aged 7-13) currently attending formal school (55 percent) compared to those households that didn’t have a child in Speed Schools. This demonstrates the longer-term impact of the Speed School program to be a 5 percent increase in school enrollment among households whose children attended the Speed School program.
• While the longer-term effect of the Speed School program is encouraging, primary school enrollment remains rather low in the three countries. The percentage of children (6-17 years of age) currently enrolled in school is 46, 43 and 52 percent in Niger, Mali and Burkina Faso, respectively17. The percentage of OOSC in sampled intervention communities remains around 50 percent in all the countries.
• About 42 percent of households in the sampled intervention communities have children within the age range of 8-12 years old that are not currently attending school. In these contexts, the Speed School program remains a relevant program and plays an important role in reducing the number of out-of-school children.
17 Using data from UNESCO Institute of Statistics: http://uis.unesco.org/en/home#tabs-0-uis_home_top_menus-3

43
Full community involvement • Strømme Foundation’s exemplary approach of actively mobilizing local communities has been the
key factor for the success and cost efficiency of its Speed School program. Communities played a number of important roles: supporting student recruitment; contributing land, labor and materials for construction and maintenance of educational facilities, and in providing food and accommodation for Speed School instructors.
• The recruitment and selection of Speed School instructors were conducted in a manner that does not negatively affect the formal primary schools. The instructors are recruited from the communities with certain transparent criteria and receive periodical training, supervision and follow up that ensures better quality of education at the Speed School centers.
• This evaluation also found various examples where some instructors further developed their career as educators and obtained employment in the formal school after the Speed Schools closed. As such, the program is contributing to the much-needed capacity development in the education sector in West Africa.
• The Speed School program is furthermore implemented through the active participation of the local education authorities, and teachers and head teachers in formal primary schools. Although the extent of participation varies across different communities, the local authorities play a significant role in identifying intervention areas, monitoring and supervising the Speed School centers, and evaluating and accrediting the Speed School students.
• SF has been effective in engaging educational authorities including around the development of a curriculum that is in line with the national curricula. The intervention covers key learning areas relevant at the primary level, adhering to standardized guidelines in its Speed School programming, and conducting assessments that allow reintegration of Speed School students into formal primary schools.
Value for money • The average total expenditure for establishing and running one Speed School center over a 10-
month period during 2014-2016 was 3,431 US dollars at the implementing partner level. Taking into account the actual number of enrolled students in the 650 established Speed School centers through the provision of Norad funding during this period, the average cost per enrolled child over a 10-month period was 132 US dollars. The cost of enrolling one out-of-school child in Speed School is 0.4 USD per day much lower than the poverty line of 2 USD per day.
• The economic profile of the families of the Speed School graduates demonstrates the program’s equitable reach to the poor and often marginalized households in the three countries. With economic reasons often cited as the underlying reasons for dropping out or never attending school, the Speed School program contributes in reducing inequalities of opportunities for out-of-school children. The Speed School program appears to provide high value for money given program level administrative costs are kept low.

44
Key recommendations • Within the broader goal of achieving sustainable effects, SF should revisit its decision-making and
implementation processes in the selection of program intervention areas. These processes should include systematic examinations of high potential impact areas, spatial overview of intervention areas and the maintenance of its programming standards, such as the presence and capacity of primary schools within 5km of intervention areas.
• SF could develop better implementation mechanisms and processes that ensure adherence to the set criteria for recruitment of out-of-school children in intervention communities. Such mechanisms should ensure recruitment is grounded in verifiable information and include mechanisms of accountability.
• Based on several years of experience in Speed School programming, SF should be in a good position to consider engaging with not only the reintegration of out-of-school children into formal schools but also the factors that have led to children dropping out or their exclusion from participating in school in the first place. This would entail embarking on interventions aimed at addressing the fragile and weak education systems in West Africa. With SF’s increased focus on a holistic approach, improved synergies between SF’s existing thematic program areas such as community-managed microfinance and capacity building may need to occur around the shared goal of supporting children to stay in school.
• SF should engage in the overall improvement of the education sector and promote the development of enabling conditions to ensure quality education that increases learning outcomes for all children while addressing the reduction of the number of out-of-school children. Partnerships and collaborations with other international and national actors would be relevant to focus on more concerted efforts. Addressing an aspect of weak education systems, such as the lack of qualified primary school teachers, SF could consider encouraging instructors it employs in its program to enter into the formal school system as assistant teachers, without transgressing the national teacher training structures. This support could include facilitating certifications and providing trainings by coordinating with national training institutes and the ministries of education. The experience Speed School instructors could gain would be relevant in helping them to advance and become full-fledged teachers in formal school systems. This would in turn contribute to increasing the number of qualified teachers in formal primary schools, ensuring the sustainability of SF’s efforts.
• While SF reports on standardized indicators on outputs and outcomes based on the program’s results framework, there is potential for gathering and utilizing relevant data in a systematic manner. Given the scale of its interventions, opportunities for program-level learning are immense. Improved data collection, organization, and utilization at various levels of the program’s results chain could facilitate more learning. Such data may include students’ background information at the time of recruitment (e.g. reasons for non-attendance of school, school enrollment rates), their attendance and their end-year assessment data. Such data could be systematically organized, analyzed and used for program-level learning, as well as to assess results against the theory of change, and to identify areas of improvement in programming.
• While commending SF’s previous attempts in using digital technologies, improved systems that allow timely updates of information should be deployed in its programming activities. Well-developed digital technologies can be used to collect data while thematic programming activities are underway in the intervention communities. Data on the retention and progression of reintegrated children in primary schools and learning outcomes can be gathered at a minimal cost.

45
Such data could inform advocacy efforts towards relevant stakeholders in order to strengthen the education systems.

46
Annex 1. Summary of data collection activities
Units Activities
Households - Sample survey of - 232 households in 19 villages in Mali (Sikasso region) - 218 households in 16 villages in Burkina Faso (Central Plateau region) - 240 households in 20 villages in Niger (Dosso region)
SS graduates - Sample survey of - 80 graduates in Mali - 80 graduates in Niger - 90 graduates in Burkina Faso
Teachers and Head
teachers in primary
schools;
- In-depth interviews with Directors and Teachers in Niger - Gafiadey primary school - Baro Koira - Bakodey - Farka Hanga
- In-depth interviews with Directors and Teachers in Burkina Faso - Kougdoughin - Tanghin 2 - Kabounda - Tempelese
- In-depth interviews with Directors and Teachers in Mali - Dovong - Zekoun - Bia - Bia Hameau
Local and National
education authorities
- In-depth interviews with - Direction provinciale de l’Education nationale et de l’Alphabétisation
(Burkina Faso) - Direction Generale de l’Alphabétisation et de l’Education Non Formelle
(Niger)
Community members;
School Management
commitees
- Focus group discussions in: - Wangal Kaina (Niger) - Bangofada Siddo (Niger) - Almou Koara (Niger) - Mondeleizey (Niger) - Tempelese (Burkina Faso) - Tanghin 2 (Burkina Faso) - Bia Hameau (Mali) - Ngolona Zanso (Mali)
SF staff-West Africa office
and local implementing
partners
- Consultation with SF Permanent Secretariat - In-depth discussion with Regional Director of West Africa SF office - In-depth discussion and information exchange with
- Finance Manager, SF West Africa - Monitoring and Evaluation team - Program Manager - Education Coordinator - Country Director, Niger - Country Director, Burkina Faso - ONEN, Niger - GRAADECOM, Mali - FDC, Burkina Faso

47
Annex 2. Terms of reference
EXTERNAL EVALUATION OF STRØMME FOUNDATION’S SPEED SCHOOL PROGRAM IN MALI, BURKINA FASO AND NIGER
BACKGROUND AND CONTEXT OF EVALUATION
Strømme Foundation (SF) is a Norwegian NGO with a mission to eradicate poverty through a rights-based approach. Through interventions in the sectors of education and microfinance, SF works with local communities to provide primarily women and children with the knowledge, skills and tools to move out of poverty. SF has worked in West Africa since 1984 and is currently implementing programs in Mali, Burkina Faso and Niger. SF has a decentralised structure with four regional offices. In West Africa, the Regional Office in Bamako oversees the activities in Mali as well as the Country Offices in Burkina Faso and Niger. Local partners are responsible for implementing activities on the ground. SF currently has 17 implementing partners across the West Africa region: 10 in Mali, five in Burkina Faso and two in Niger.
Designed in Mali in 2004 by West African education experts in partnership with Strømme Foundation, the Speed School model is a nine-month accelerated learning program that provides three years’ worth of primary education to children who have never been to school or who have dropped out-of-school and wish to reintegrate back into the formal education system. The course follows a condensed primary school curriculum, with the aim of transferring successful graduates into the fourth grade of formal school. Since the program started in 2004, around 150 000 out-of-school children (OOSC) have completed the program.
There have been a number of studies and evaluations, both internal and external, of the Speed School program over the years. Most recently, an independent impact study, in the form of a randomized controlled trial (RCT), was carried out in Mali by Innovations for Poverty Action (IPA) in 2012-14. It found that 89% of enrolled children completed the program. Most of the graduates transferred into grade 4 of primary school and adapted well to their new school environment.
Yet, there has been little systematic research on the long-term impact of the program on learners, their families and communities. Over time, with the expansion of the program, internal SF reports and evaluations have found that the transfer of Speed School graduates poses a challenge for the receiving primary schools, particularly when it comes to accommodating the large increase in children enrolled. A recent review that assessed a sample of Speed Schools, also found incidents of negative attitudes towards transferred Speed School children among teachers in formal schools.
In order to address gaps in the evidence-base and improve documentation of the Speed School program’s impact, Strømme Foundation is commissioning a comprehensive external evaluation consisting of three main components: impact study, tracer study and value for money analysis. The main purpose of this evaluation is to document the long-term impact of the program and assess the return of investment that the program offers with the aim of improving program efficiency and effectiveness. To this end, the evaluation focuses particularly on gathering evidence on the long-term impact on Speed School graduates and intervention communities, and the cost-efficiency and cost-effectiveness of the program. The evaluation further serves to develop recommendations for adjustments that will improve the program as SF enters into a new strategic period.
MAIN OBJECTIVES AND KEY QUESTIONS
The main objective of the evaluation is to assess the long-term impact of the Speed School program on its graduates, communities and local education systems and conduct a Value for Money analysis of the program. Building on existing studies of the Speed School program, the evaluation should synthesise key findings from previous evaluations and reports and document the long-term impact of the Speed School program on beneficiaries and key stakeholders. In addition to documenting results, the evaluation should include clear recommendations

48
for improvement of the program, with a particular focus on the transition of Speed School graduates to primary schools and the role that local communities and authorities can and should play in this process.
The evaluation will be used to document the results of the program to key donors, as an input in SF’s constant strive for improving the efficiency and impact of its interventions. The findings will also feed into Strømme Foundation’s on-going process to develop a new Strategic Plan in 2018.
The evaluation should include three main components:
1. Study of the long-term impact of the Speed School program on students, households, communities,
local and national education systems
The objective of this study is to examine the impact of the Speed School program on the Speed School graduates, their families and the communities that have hosted Speed School centres. The study should include a representative sample of communities from Mali, Burkina Faso and Niger and should be carried in communities where the Speed School centres closed in June 2015. Strømme Foundation and local partners will support the process of identifying the sample. The consultants are expected to take the counter-factual18 into account. The study should look more in detail at the following issues:
I. Host primary schools and local education systems
a) To what extent are primary schools capable of absorbing the Speed School graduates upon transfer to the
formal system? What, if any, are the positive and/or negative consequences for formal primary schools of
receiving Speed School graduates?
b) How do primary school teachers and head teachers perceive the Speed School program and the Speed
School graduates?
c) Where Speed Schools are located in close proximity to formal schools, are there negative impacts to the
host formal school? Does the Speed School attract pupils and/or teachers/other staff from the host school?
d) What knowledge and understanding do primary school teachers and head teachers have of the Speed
School program, in particular its curriculum and pedagogy?
e) Do local education authorities work with formal schools to prepare them for the transfer of Speed School
graduates?
f) How do the local education authorities view the Speed School program in terms of quality of teaching and
learning, in particular the curriculum and pedagogy? How do they perceive the quality and competence
of Speed School instructors? Is the training that the Speed School instructors received to be adequate and
of good quality?
g) What is the extent of ownership of the program by local education authorities?
h) Has the implementation of the Speed School program lead to any change in how the local education
authorities address the issue of out-of-school children?
i) To what extent do the local education authorities recognise their responsibility as duty bearers in
providing access to education for all children?
j) To what extent do local education authorities think that the Speed School supervision structure (regular
monitoring visits by multiple stakeholder throughout the school year) can be applied to schools in the
formal system?
k) To what extent has the Speed School program contributed to raising the primary school enrolment and
completion rates in intervention communities? How does this rate differ from comparable rural areas?
l) To what extent has the Speed School program been effective in reducing the number of out-of-school
children in the intervention communities?
18 Subtracting from the program’s results any changes that would likely have taken place in absence of the intervention – such as the contribution of other NGOs working in the same community, government investment in education etc.

49
II. Speed School graduates
a) How did Speed School graduates experience the learning environments in Speed Schools, , including in
terms of child protection/use of corporal punishment, gender equality and inclusion of children with
disabilities, teachers’ attitudes towards students and availability of materials etc,? Is there a difference
between the experience of boys and girls or children in other marginalised groups (children with
disabilities, internally displaced children, orphans, child labourers etc.)?
b) What, if anything, could improve the Speed School experience for learners according to Speed School
graduates?
c) How did the Speed School experience compare to the Speed School graduates’ experience once transferred
to the formal sector? Is there a difference between the experience of boys and girls or children in other
marginalised groups (children with disabilities, internally displaced children, orphans, child labourers
etc.)?
d) How did the Speed School graduates find the transition to primary school? Did they experience any
barriers in transitioning and/or staying in school and what factors helped them do so? Is there a difference
between the experience of boys and girls or children in other marginalised groups (children with
disabilities, internally displaced children, orphans, child labourers etc.)?
e) What proportion of Speed School graduates (interviewed for the evaluation) are still in school? Is there a
difference between the experience of boys and girls or children in other marginalised groups (children
with disabilities, internally displaced children, orphans, child labourers etc.)?
f) What, if any, impact did participation in the program have on the Speed School graduates’ self-esteem
and confidence level? Is there a difference between the experience of boys and girls or children in other
marginalised groups (children with disabilities, internally displaced children, orphans, child labourers
etc.)?
g) To what extent did participation in the Speed School program change the way that the Speed School
graduates were perceived and treated in their families? Is there a difference between the experience of
boys and girls or children in other marginalised groups (children with disabilities, internally displaced
children, orphans, child labourers etc.)?
III. Households and community levels
a) Do parents of Speed School graduates now send younger siblings to school? Is there a difference between
boys and girls or children in other marginalized groups (children with disabilities, internally displaced
children, orphans, child labourers etc.)?
b) To what extent has the attitude to children’s education and specifically girls’ education, changed in the
intervention communities after the implementation of the Speed School program? What, if any, effect
has the Speed School program had on the perception of girls in families of Speed School graduates and in
the intervention communities?
c) What examples are there of School Management Committees (SMCs) successfully advocating for
children’s right to education in the intervention communities, including lobbying for new classrooms to
be built, new schools, more resources for education etc?
d) What, if any, role do the SMCs play in the intervention communities once the Speed School centres are
closed?
IV. National education system
a) To what extent do the national ministries of education in Mali, Burkina Faso and Niger have ownership
of the Speed School program? What opportunities and/or barriers exist for deepening government
ownership of the program?

50
b) To what extent is the Speed School program reflected in national education policies and frameworks, in
particularly out-of-school policies in Mali, Burkina Faso and Niger?
2. Tracer study of the 2011-2012 cohort of Speed School graduates in Mali;
a) The objective of this study is to measure and assess the longer-term impact of the Speed School program
on students and their immediate family. The component will focus on Mali only, and the key objective is
tracing a sample of students from the 2011-2012 cohort, getting insights into their experiences before,
during and after Speed School. More specifically:
b) Demographic information (income level, relationship status, disability status etc.)
c) Information on the educational level the respondent attained/is working towards
d) Information on current employment status if relevant
e) Opinions on how the knowledge acquired at Speed School is impacting on daily life and school (if
applicable)
f) Identify gaps in the program and recommendations for future program implementation
g) Strømme Foundation and local partners will support the process of identifying the sample. The tracer
study should be complemented by in-depth interviews with 20 Speed School graduates (with an even mix
of boys and girls), a selection of interviews which should be filmed.
The data for the tracer study should be disaggregated and analysed by gender.
3. Assess the “value for money” of the Speed Schools program in terms of efficiency and effectiveness, looking at:
a) The cost per student enrolled in Speed Schools
b) The cost per student graduating from/completing Speed Schools
c) The cost per Speed School graduate registered in (and physically showing up to) formal school
And:
a) Comparing these costs to the cost of similar programs and/or formal school in Mali, Burkina Faso and
Niger
b) Undertaking a social cost-benefit analysis, using a standard metric such as the value of an additional year
of schooling
METHODOLOGY
The evaluation should utilise a mixed methods approach, combining quantitative and qualitative methodologies and use a participatory and child-friendly approach (including established child protection frameworks during consultations with children). Separate research frameworks need to be developed for the three components and should all include a gender perspective.
EVALUATION TEAM
As the evaluation is composed of three distinct components and requires field work in rural areas of Mali, Burkina Faso and Niger, SF strongly encourage prospective applicants to propose a team combined of both international and local consultants with a strong record in conducting evaluations to carry out the task. The team is expected to be able to demonstrate:
- Extensive experience working in West-Africa in general, and in Burkina Faso, Mali and Niger specifically, with
strong knowledge of the local context
- Significant experience in producing high-quality, credible research and reports in English for clients and
organisations in the development sector, including research and evaluation of education programs

51
- Examples of previous work are required. Proven experience in conducting tracer studies and Value for Money
analysis is highly desirable
- A team member with strong economic background, preferably in the economics of education, to lead on the
Value for Money study
- Relevant educational qualifications, and strong background in education for development and assessment of
learning outcomes
- Professional expertise and experience in monitoring and evaluation
- Relevant quantitative and qualitative research skills, demonstrable experience with participatory child-friendly
methodologies
- Fluency in French and English
- Local consultants should have fluency in relevant local languages
- Sound knowledge of and commitment to rights based approaches
- A high standard of professionalism
Applicants are encouraged to include both male and female researchers at both local and international levels.
The team is expected to carry out field work in Mali, Burkina Faso and Niger. Applicants should note that the security situation in West Africa is unstable and unpredictable and the evaluation team will have to make their own risk assessment when it comes to security. Strømme Foundation will work closely with our local partners to help facilitate the field work, including logistical support. In addition, SF will make work space in country and regional offices available for the consultant(s).
OUTPUTS AND DELIVERABLES
The evaluation report should be no more than 30 pages long with an executive summary of max four pages with a focus on key findings and recommendations. The report should be available in English and French. The final report should be supplemented by a power point presentation.
Deliverables:
- Inception report, including a detailed work plan for the assignment
- Workshop/skype call to validate methodology and tools
- Draft report
- Validation workshop/skype call to discuss draft report, key findings and recommendations
- Final report in English and French, including an executive summary
- Donor-friendly evaluation brief of max four pages
- Power point presentation with key findings and recommendations
- Cleaned version of all the data used for the analysis, including data on respondent level

52
TIMEFRAME
The work is expected to take 10 weeks between November 2017 and April 2018. The final report should be submitted to Strømme Foundation by 23rd April 2018. Proposed timeframe:
Activities Deadline Responsible Deadline for submission of proposals 6th November 2017 Consultant Inception report 8th December 2017 Consultant Meeting/skype call to validate methodology and tools
December 2017 Working group
Finalization of tools for data collection 15th January Consultant Data collection in the field January-February 2018 Consultant Data analysis and draft report March 2018 Consultant Deadline for draft report 16th March 2018 Consultant Workshop/skype call to validate draft Early April 2018 Working group Submission of final report 23rd April 2018 Consultant
APPLICATION SPECIFICATIONS
We will consider proposals from individual consultants and companies/organisations. To register interest in this consultancy, please send the following documentation to [email protected] by 6th November 2017, specifying ‘Speed School evaluation’ in the subject line.
o A proposal responding to the ToR, with specific focus on addressing the Main Objectives and Key Questions,
timeline and methodology to be used
o An Initial work plan based on methodology outlined, and confirming availability of the applicant
o Company or organisation profile (where applicable) and CVs of consultant(s) who would deliver the work
o A minimum of three references (organization or individual consultant as appropriate)
o Sample of a recent education program evaluations/research produced by Consultant/Company within the last
three years (if available). Examples of Tracer Studies and Value for Money analysis are highly desirable.
o Budget breakdown based on expected daily rates and initial work plan

53
Annex 2. Overview of Speed School Results
Country Year Funder Partner NGO
Speed
Schools
(#)
Enrolled
boys (#)
Enrolled
girls (#)
Total
Enrolled
(#)
Evaluated
boys (#)
Evaluated
girls (#)
Total
Evaluated
(#)
Transferred
boys (#)
Transferred
girls (#)
Total
transferred
(#)
Burkina
Faso
2014/15 AKO Foundation ANTBA 20 268 275 543 211 161 372 208 161 369
Total 20 268 275 543 211 161 372 208 161 369
Kavli FDC 48 552 538 1 090 395 391 786 395 391 786
Total 48 552 538 1 090 395 391 786 395 391 786
Norad grant
(2014-2018)
ADEFAD 20 261 228 489 230 215 445 229 216 445
Total 20 261 228 489 230 215 445 229 216 445
Total 88 1 081 1 041 2 122 836 767 1 603 832 768 1 600
2015/16 AKO Foundation ANTBA 20 203 304 507 160 253 413 155 248 403
Total 20 203 304 507 160 253 413 155 248 403
Kavli FDC 48 547 534 1 081 512 506 1 018 512 506 1 018
Total 48 547 534 1 081 512 506 1 018 512 506 1 018
Norad grant
(2014-2018)
ADEFAD 20 252 249 501 230 229 459 222 224 446
AFDR 40 550 535 1 085 482 480 962 482 480 962
Total 60 802 784 1 586 712 709 1 421 704 704 1 408
Total 128 1 552 1 622 3 174 1 384 1 468 2 852 1 371 1 458 2 829
2016/17 AKO Foundation ANTBA 20 232 277 509 207 243 450 207 243 450
Total 20 232 277 509 207 243 450 207 243 450
Educate a child ADEFAD 20 309 231 540 272 193 465 272 193 465
SOS Enfants 20 220 324 544 185 280 465 185 280 465
Total 40 529 555 1 084 457 473 930 457 473 930
Norad grant
(2014-2018)
ADEFAD 20 275 249 524 250 222 472 250 222 472
AFDR 40 526 519 1 045 477 472 949 477 472 949
Total 60 801 768 1 569 727 694 1 421 727 694 1 421

54
Country Year Funder Partner NGO
Speed
Schools
(#)
Enrolled
boys (#)
Enrolled
girls (#)
Total
Enrolled
(#)
Evaluated
boys (#)
Evaluated
girls (#)
Total
Evaluated
(#)
Transferred
boys (#)
Transferred
girls (#)
Total
transferred
(#)
WATERLOO FDC 10 132 100 232 115 91 206 115 91 206
Total 10 132 100 232 115 91 206 115 91 206
Total 130 1 694 1 700 3 394 1 506 1 501 3 007 1 506 1 501 3 007
2017/18 AKO Foundation ANTBA 20 241 282 523 - - - - - -
Total 20 241 282 523 - - - - - -
Educate a child ADEFAD 35 472 442 914 - - - - - -
SOS Enfants 30 389 414 803 - - - - - -
Total 65 861 856 1 717 - - - - - -
Norad grant
(2014-2018)
ADEFAD 20 264 267 531 - - - - - -
AFDR 40 549 478 1 027 - - - - - -
Total 60 813 745 1 558 - - - - - -
Norad new grant
(2017)
AFDR 30 371 390 761 - - - - - -
ANTBA 10 120 127 247 - - - - - -
FDC 20 276 222 498 - - - - - -
Total 60 767 739 1 506 - - - - - -
Total 205 2 682 2 622 5 304 - - - - - -
Mali 2014/15 Norad grant
(2014-2018)
AMSS 50 649 656 1 305 503 516 1 019 503 516 1 019
APSM 20 263 282 545 220 255 475 220 255 475
GRADECOM 20 236 266 502 227 248 475 227 248 475
Total 90 1 148 1 204 2 352 950 1 019 1 969 950 1 019 1 969
Total 90 1 148 1 204 2 352 950 1 019 1 969 950 1 019 1 969
2015/16 Norad grant
(2014-2018)
AMSS 20 256 252 508 237 237 474 237 216 453
APSM 40 537 505 1 042 515 474 989 503 474 977
GRADECOM 40 554 509 1 063 503 503 1 006 503 491 994
Total 100 1 347 1 266 2 613 1 255 1 214 2 469 1 243 1 181 2 424
Total 100 1 347 1 266 2 613 1 255 1 214 2 469 1 243 1 181 2 424
2016/17 Educate a child GRAADECOM 20 273 255 528 256 253 509 256 253 509

55
Country Year Funder Partner NGO
Speed
Schools
(#)
Enrolled
boys (#)
Enrolled
girls (#)
Total
Enrolled
(#)
Evaluated
boys (#)
Evaluated
girls (#)
Total
Evaluated
(#)
Transferred
boys (#)
Transferred
girls (#)
Total
transferred
(#)
RAC 20 254 305 559 251 304 555 251 304 555
Total 40 527 560 1 087 507 557 1 064 507 557 1 064
Erikshjelpen AEDM 20 225 297 522 225 297 522 225 297 522
AMPDR 20 337 226 563 327 215 542 327 215 542
APSM 20 284 251 535 273 240 513 273 240 513
ODES 30 363 349 712 326 319 645 326 319 645
Total 90 1 209 1 123 2 332 1 151 1 071 2 222 1 151 1 071 2 222
European Union ACEF 50 720 632 1 352 675 582 1 257 675 582 1 257
AMPDR 50 661 659 1 320 652 653 1 305 652 653 1 305
APSM 30 407 386 793 396 357 753 396 357 753
CAEB 50 688 718 1 406 674 683 1 357 674 683 1 357
RAC 40 554 551 1 105 488 514 1 002 488 514 1 002
STOP SAHEL 30 368 440 808 331 420 751 331 420 751
Total 250 3 398 3 386 6 784 3 216 3 209 6 425 3 216 3 209 6 425
Norad grant
(2014-2018)
AMSS 40 261 261 522 244 232 476 244 232 476
APSM 20 477 532 1 009 452 514 966 452 514 966
GRADECOM 40 550 500 1 050 520 475 972 497 452 972
Total 100 1 288 1 293 2 581 1 216 1 221 2 414 1 193 1 198 2 414
Total 480 6 422 6 362 12 784 6 090 6 058 12 125 6 067 6 035 12 125
2017/18 Educate a child GRAADECOM 40 543 593 1 136 - - - - - -
RAC 40 531 582 1 113 - - - - - -
Total 80 1 074 1 175 2 249 - - - - - -
Erikshjelpen AEDM 20 315 242 557 - - - - - -
AMPDR 20 335 211 546 - - - - - -
APSM 20 279 261 540 - - - - - -
ODES 20 278 277 555 - - - - - -
Total 80 1 207 991 2 198 - - - - - -

56
Country Year Funder Partner NGO
Speed
Schools
(#)
Enrolled
boys (#)
Enrolled
girls (#)
Total
Enrolled
(#)
Evaluated
boys (#)
Evaluated
girls (#)
Total
Evaluated
(#)
Transferred
boys (#)
Transferred
girls (#)
Total
transferred
(#)
European Union ACEF 50 678 648 1 326 - - - - - -
AMPDR 50 661 604 1 265 - - - - - -
APSM 30 428 406 834 - - - - - -
CAEB 50 704 702 1 406 - - - - - -
RAC 40 556 596 1 152 - - - - - -
STOP SAHEL 30 363 478 841 - - - - - -
Total 250 3 390 3 434 6 824 - - - - - -
Norad grant
(2014-2018)
AMSS 20 233 267 500 - - - - - -
APSM 40 510 506 1 016 - - - - - -
GRADECOM 40 550 505 1 055 - - - - - -
Total 100 1 293 1 278 2 571 - - - - - -
Norad new grant
(2017)
APSM 20 274 231 505 - - - - - -
GRAADECOM 30 341 450 791 - - - - - -
Total 50 615 681 1 296 - - - - - -
Total 560 7 579 7 559 15 138 - - - - - -
Niger 2014/15 Norad grant
(2014-2018)
ATPF 20 362 174 536 241 106 347 241 106 347
ONEN 20 220 258 478 181 204 385 181 204 385
Total 40 582 432 1 014 422 310 732 422 310 732
Total 40 582 432 1 014 422 310 732 422 310 732
2015/16 AKO Foundation ATPF 30 471 340 811 450 334 784 450 334 784
Total 30 471 340 811 450 334 784 450 334 784
Norad grant
(2014-2018)
ATPF 40 609 444 1 053 581 416 997 581 416 997
CAD 20 314 253 567 274 237 511 274 237 511
ONEN 40 566 423 989 535 396 931 528 403 931
Total 100 1 489 1 120 2 609 1 390 1 049 2 439 1 383 1 056 2 439
Total 130 1 960 1 460 3 420 1 840 1 383 3 223 1 833 1 390 3 223
2016/17 AKO Foundation ATPF 30 445 336 781 405 309 714 405 309 714

57
Country Year Funder Partner NGO
Speed
Schools
(#)
Enrolled
boys (#)
Enrolled
girls (#)
Total
Enrolled
(#)
Evaluated
boys (#)
Evaluated
girls (#)
Total
Evaluated
(#)
Transferred
boys (#)
Transferred
girls (#)
Total
transferred
(#)
Total 30 445 336 781 405 309 714 405 309 714
Educate a child ATPF/Birni 20 322 218 540 294 196 490 294 196 490
ATPF/Torodi 20 272 268 540 264 251 515 264 251 515
Total 40 594 486 1 080 558 447 1 005 558 447 1 005
Norad grant
(2014-2018)
ATPF 40 559 487 1 046 535 473 1 008 535 473 1 008
ONEN 40 628 463 1 091 571 446 1 017 571 446 1 017
Total 80 1 187 950 2 137 1 106 919 2 025 1 106 919 2 025
Total 150 2 226 1 772 3 998 2 069 1 675 3 744 2 069 1 675 3 744
2017/18 AKO Foundation ATPF 30 427 346 773 - - - - - -
Total 30 427 346 773 - - - - - -
Educate a child ATPF/Birni 40 661 429 1 090 - - - - - -
ATPF/Torodi 40 568 513 1 081 - - - - - -
Total 80 1 229 942 2 171 - - - - - -
Norad grant
(2014-2018)
ATPF 40 560 466 1 026 - - - - - -
Halassaye 20 272 229 501 - - - - - -
ONEN 40 540 488 1 028 - - - - - -
Total 100 1 372 1 183 2 555 - - - - - -
Norad new grant
(2017)
CDR 20 302 244 546 - - - - - -
ONEN 20 305 237 542 - - - - - -
Total 40 607 481 1 088 - - - - - -
Total 250 3 635 2 952 6 587 - - - - - -
Grand Total 2 351 31 908 29 992 61 900 16 329 15 395 31 724 16 316 15 337 31 653
* Number of evaluated and transferred students are not included for 2017/18 as the academic year is currently underway.

Strømme Foundation’s Speed School Program in Burkina Faso, Mali and Niger
This report presents an evaluation of the Speed School program implemented by Strømme Foundation in three West African countries: Mali, Burkina Faso and Niger. The evaluation is commissioned by Strømme Foundation with financing from the Norwegian Agency for Development Cooperation (Norad). The evaluation is led by Tewodros Aragie Kebede, Fafo Research foundation.
Borggata 2BP.O. Box 2947 TøyenN-0608 Oslowww.fafo.no
Fafo-report 2018:27ISBN 978-82-324-0459-9ISSN 2387-6859Order no. 20676