strategies and challenges in measuring protein abundance using stable isotope labeling and
TRANSCRIPT

11
Strategies and Challenges in Measuring Protein Abundance Using Stable Isotope Labeling and
Tandem Mass Spectrometry
Kolbrun Kristjansdottir, Satoe Takahashi, Samuel L. Volchenboum and Stephen J. Kron
The University of Chicago, Chicago, IL USA
1. Introduction
Mass spectrometry (MS) is a powerful method for identifying proteins, and modern mass spectrometers are capable of remarkable speed, resolution and sensitivity. A single tandem mass spectrometry experiment can now lead to the identification and quantitation of thousands of proteins down to sub-femtomolar concentrations. Tandem mass spectrometry experiments generally involve extraction of proteins from cells, biofluid, or tissue followed by digestion of proteins to peptides, separation of peptides on an HPLC, and direct injection into a mass spectrometer (LC-MS/MS). The mass spectrometer measures the mass of each peptide ion (MS1) and selected ions are fragmented (MS/MS or MS2). Mass and fragmentation spectra of each peptide are compared against predicted peptide fragmentation spectra from the known proteome by database search engines (reviewed in Aebersold and Mann 2003). LC-MS/MS instruments also record peptide ion intensities, offering the potential for direct measurement of peptide concentration and thereby protein abundance. However, the extent of ionization of peptides by electrospray ionization is dependent on peptide sequence and modification, elution conditions, complexity of the sample, and other factors. As a result, the absolute intensities of ions derived from non-identical peptides cannot provide accurate or direct quantitation. Approaches such as peptide ion chromatogram extraction and spectral counting have been developed to obtain relative quantitation of protein abundance (Ono et al. 2006; Fischer et al. 2006; Tang et al. 2006; Paoletti et al. 2006; Listgarten and Emili 2005; Wiener et al. 2004; Wang, Wu, Zeng, et al. 2006). Collectively termed “label-free” quantitation, these approaches require extensive analysis of reference samples and/or significant data redundancy, often requiring many hours of mass spectrometry time per sample. Although highly promising, label-free approaches remain impractical for users lacking access to dedicated mass spectrometry instrumentation and advanced informatic approaches. Stable isotope labeling provides an attractive alternative to label-free approaches. Stable
isotopes are sufficiently stable to be non-radioactive. They have equal numbers of protons as
their parental element but they differ in mass by the difference in the number of neutrons.
Carbon, hydrogen, oxygen, nitrogen and sulfur have two or more isotopes with measurable
abundance in Nature. For example, carbon is found as the predominant “light” isotope 12C
www.intechopen.com
Tandem Mass Spectrometry – Applications and Principles
236
(98.89%), a stable “heavy” isotope of 13C (1.11%) and a radioactive “heavy” isotope of 14C
(trace amounts) in Nature. Other stable isotopes relevant to protein mass spectrometry
include Hydrogen 2H (0.02%), also called deuterium, Nitrogen 15N (0.37%), Oxygen 17O
(0.04%) and 18O (0.02%), and Sulfur 33S (0.76%), 34S (4.29%), and 36S (0.02%). Carbon and
nitrogen are the most common atoms in peptides resulting in 13C and 15N being the
predominant isotopes present in all naturally occurring proteins, and to a lesser extent,
oxygen and sulfur isotopes. As a result, instead of each tryptic peptide injected into the mass
spectrometer having a single mass, each peptide is represented as a collection of different
masses in proportions that reflect the natural abundance of the stable isotopes. This
collection of masses present in the mass spectrum is termed the “isotopic envelope” of a
peptide (Fig. 3).
A stable isotope labeled peptide and its unlabeled counterpart have the same chemical
formula and structure and thus nearly identical chemical properties, such that they are
expected to elute together from reverse phase chromatography. Despite their similar
chemical properties, the presence of the stable isotope facilitates independent assessment
because of the mass difference. Combining the light (unlabeled) and heavy isotope labeled
peptides in one sample allows for direct comparison of ion intensities. In principle, this
offers highly accurate relative quantitation and avoids the need for significant data
redundancy. With these and other advantages, stable isotope labeling would appear to
satisfy the criteria for an ideal quantitative mass spectrometry strategy. However, challenges
remain before stable isotope quantitation becomes a straightforward, robust, and reliable
approach accessible both to non-experts and users of service laboratories. Here, we provide
an up-to-date and critical review of stable isotope labeling methodologies, available
software for data analysis, and emerging new applications of these powerful approaches.
2. Absolute versus relative quantitation
Stable isotope labeling can provide either absolute or relative quantitation. Absolute
quantitation is obtained by comparing a known amount of added stable isotope labeled
peptide and comparing directly with the unlabeled peptide counterpart, an expensive and
laborious methodology for large proteomic studies. However, relative quantitation of
proteins and peptides from complex samples can be performed by labeling the sample with
stable isotope(s) and comparing to an unlabeled control. The levels are directly compared,
providing a fold-change. Because the sample is compared to a control, changes due to the
perturbation can be identified. Therefore, complex samples can be analyzed without any
prior knowledge of the identity of peptides and proteins.
2.1 Using stable isotopes to achieve absolute quantitation
Stable isotopes can be incorporated into synthetic standards to obtain absolute quantitation. Isotope dilution and related approaches have been used in the small molecule field for decades (Baillie 1981). A known amount of stable isotope labeled analog of the compound of interest (internal standard) is spiked into a sample containing the unlabeled compound (Fig. 1). The intensity of the unlabeled molecule is compared directly to the intensity of the stable isotope labeled molecule, and the peak ratio is calculated. For optimal performance, a standard curve is generated from a range of concentrations of the internal standard. Some of the earliest peptide- and protein-based applications of mass spectrometry for tracking and
www.intechopen.com

Strategies and Challenges in Measuring Protein Abundance Using Stable Isotope Labeling and Tandem Mass Spectrometry
237
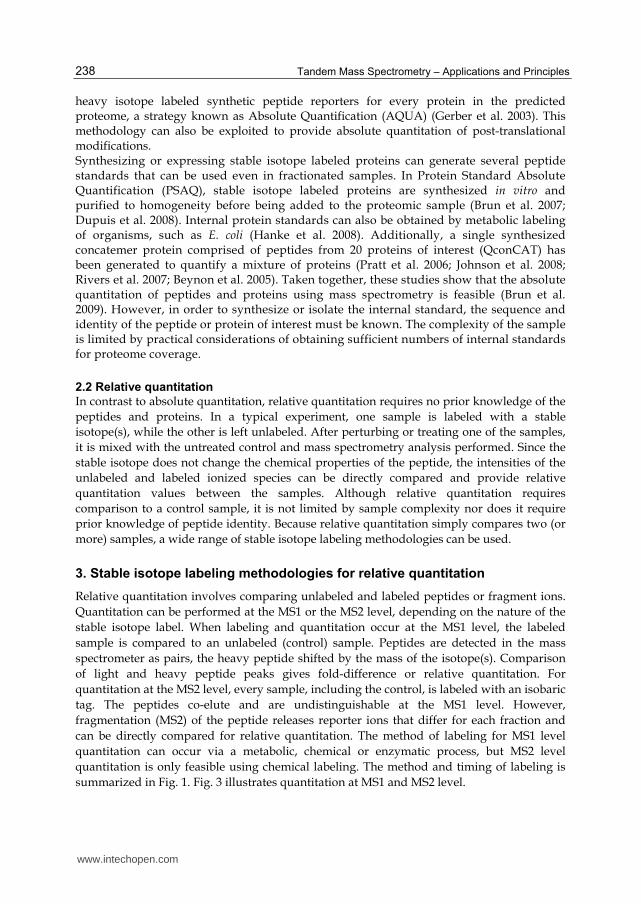
Fig. 1. Methods for stable isotope labeling. Stable isotope labeling for relative quantitation can occur through metabolic, chemical and enzymatic methods. Metabolic labeling is performed during cell culture growth or by feeding or growing organisms such as yeast and flies in stable isotope labeled food or media. An example of metabolic labeling is SILAC. Chemical labeling is possible at the protein level with methods such as ICAT, HysTag and acrylamide labeling and at the peptide level with iTRAQ and TMT. Finally, enzymatic labeling is performed at the peptide level by trypsin catalyzed 18O labeling. Absolute quantitation involves spiking synthetic stable isotope labeled proteins or peptides (red arrows) into unlabeled samples.
quantitation were the use of enzymatically labeled peptides generated via trypsin 18O-exchange (Desiderio and Kai 1983), peptides synthesized using 13C, 2H-labeled amino acids (Barr et al. 1996), and 15N labeled peptide hormones (Kippen et al. 1997). To study pigments in the eye, a deuterium-containing peptide from rhodopsin was used as an internal peptide standard for determining the absolute amount present in rod outer segments (Barnidge et al. 2003). Taken to its logical extreme, it would be feasible to spike a sample with one or more
www.intechopen.com
Tandem Mass Spectrometry – Applications and Principles
238
heavy isotope labeled synthetic peptide reporters for every protein in the predicted proteome, a strategy known as Absolute Quantification (AQUA) (Gerber et al. 2003). This methodology can also be exploited to provide absolute quantitation of post-translational modifications. Synthesizing or expressing stable isotope labeled proteins can generate several peptide standards that can be used even in fractionated samples. In Protein Standard Absolute Quantification (PSAQ), stable isotope labeled proteins are synthesized in vitro and purified to homogeneity before being added to the proteomic sample (Brun et al. 2007; Dupuis et al. 2008). Internal protein standards can also be obtained by metabolic labeling of organisms, such as E. coli (Hanke et al. 2008). Additionally, a single synthesized concatemer protein comprised of peptides from 20 proteins of interest (QconCAT) has been generated to quantify a mixture of proteins (Pratt et al. 2006; Johnson et al. 2008; Rivers et al. 2007; Beynon et al. 2005). Taken together, these studies show that the absolute quantitation of peptides and proteins using mass spectrometry is feasible (Brun et al. 2009). However, in order to synthesize or isolate the internal standard, the sequence and identity of the peptide or protein of interest must be known. The complexity of the sample is limited by practical considerations of obtaining sufficient numbers of internal standards for proteome coverage.
2.2 Relative quantitation
In contrast to absolute quantitation, relative quantitation requires no prior knowledge of the
peptides and proteins. In a typical experiment, one sample is labeled with a stable
isotope(s), while the other is left unlabeled. After perturbing or treating one of the samples,
it is mixed with the untreated control and mass spectrometry analysis performed. Since the
stable isotope does not change the chemical properties of the peptide, the intensities of the
unlabeled and labeled ionized species can be directly compared and provide relative
quantitation values between the samples. Although relative quantitation requires
comparison to a control sample, it is not limited by sample complexity nor does it require
prior knowledge of peptide identity. Because relative quantitation simply compares two (or
more) samples, a wide range of stable isotope labeling methodologies can be used.
3. Stable isotope labeling methodologies for relative quantitation
Relative quantitation involves comparing unlabeled and labeled peptides or fragment ions.
Quantitation can be performed at the MS1 or the MS2 level, depending on the nature of the
stable isotope label. When labeling and quantitation occur at the MS1 level, the labeled
sample is compared to an unlabeled (control) sample. Peptides are detected in the mass
spectrometer as pairs, the heavy peptide shifted by the mass of the isotope(s). Comparison
of light and heavy peptide peaks gives fold-difference or relative quantitation. For
quantitation at the MS2 level, every sample, including the control, is labeled with an isobaric
tag. The peptides co-elute and are undistinguishable at the MS1 level. However,
fragmentation (MS2) of the peptide releases reporter ions that differ for each fraction and
can be directly compared for relative quantitation. The method of labeling for MS1 level
quantitation can occur via a metabolic, chemical or enzymatic process, but MS2 level
quantitation is only feasible using chemical labeling. The method and timing of labeling is
summarized in Fig. 1. Fig. 3 illustrates quantitation at MS1 and MS2 level.
www.intechopen.com

Strategies and Challenges in Measuring Protein Abundance Using Stable Isotope Labeling and Tandem Mass Spectrometry
239
3.1 Quantitation at the MS1 level 3.1.1 Metabolic labeling
Metabolic labeling for protein quantitation was demonstrated in yeast grown on commercial rich media derived from 15N-enriched algal hydrolysate. The relative abundances of phosphopeptides in the light and heavy samples were then determined by MALDI mass spectrometry (Oda et al. 1999). Analogous approaches have been applied to a number of organisms including worms and flies, culminating with the metabolic labeling of a rat, accomplished through feeding with 15N-enriched algae to produce tissue-specific internal standards for global quantitative proteomic analysis (Wu et al. 2004). While metabolic labeling with 15N is inexpensive and simple to perform, the distribution of isotopic forms for each peptide depends on the amino acid composition, complicating quantitative analysis and manual validation. Currently, the most widely used metabolic labeling approach for protein quantitation is stable isotope labeling with amino acids in cell culture (SILAC) (Ong, Kratchmarova, and Mann 2003; Ong et al. 2002; de Godoy et al. 2006; Amanchy et al. 2005). When cells are grown for several doublings in tissue culture with a stable isotope labeled form of an essential amino acid (e.g. lysine) as the sole source and at a small excess, this amino acid is incorporated into newly synthesized proteins until all are homogeneously labeled. Although any of the 20 naturally occurring amino acids could be used as a precursor for labeling, lysine, arginine and leucine are commonly used, with serine, glycine, histidine, methionine, valine, and tyrosine to a lesser extent (reviewed in (Beynon and Pratt 2005). The most common isotopes in SILAC are 13C and 15N, since they demonstrate less kinetic isotope effect than 2H and do not change the elution profiles of labeled peptides in reverse phase HPLC chromatography (Zhang and Regnier 2002; Zhang et al. 2001; Zhang et al. 2002). Trypsin is the most frequently used enzyme protease in proteomics, cleaving on the carboxyl-terminal side of lysine and arginine residues. Therefore, each non-C-terminal tryptic peptide is predicted to contain either a single carboxyl-terminal lysine or arginine. With a mass difference of 4 to 10 Da, due to labeling of the single terminal lysine or arginine, most pairs of peptides can be easily recognized by their offset envelopes of isotopic species (Fig. 3). The advantages of SILAC using lysine and arginine as the labeled amino acids include the
ease of complete labeling and that every peptide is labeled, with the exception of the C-
terminal peptide. Although trypsin fails to cleave at some post-translationally modified
lysine and arginine residues, this does not prevent quantitation. Stable isotope labeled
amino acids (Cambridge Isotopes Laboratories) and several types of SILAC tissue culture
media including DMEM, RPMI and IMEM (Thermo Scientific Pierce, Invitrogen) are
commercially available.
SILAC is limited to organisms that can be grown on defined media. While this is straightforward for cell lines, bacteria, and yeast cells, it precludes most whole animal and patient studies. Super-SILAC, a method for quantitative proteomics of human tissues was recently described (Geiger et al. 2010). Here, unlabeled tissue samples are mixed with SILAC labeled human cell lines (Super-SILAC mix) and relative quantitation is performed. Examining several tissue samples mixed with the same internal control, the Super-SILAC mix, allows for relative comparison between different tumor samples. Similarly, stable isotope labeled mouse tissue (Mouse Express) is available from Cambridge Isotope Laboratories and can be used in combination with unlabeled mouse tissue for relative quantitation.
www.intechopen.com

Tandem Mass Spectrometry – Applications and Principles
240
Finally, SILAC experiments usually consist of two samples, a control (heavy) and treatment
(light) or vice versa. However, increased availability of labeled amino acids, now allows for
comparisons of three (Blagoev et al. 2004; Andersen et al. 2005) to five samples (Molina et al.
2009).
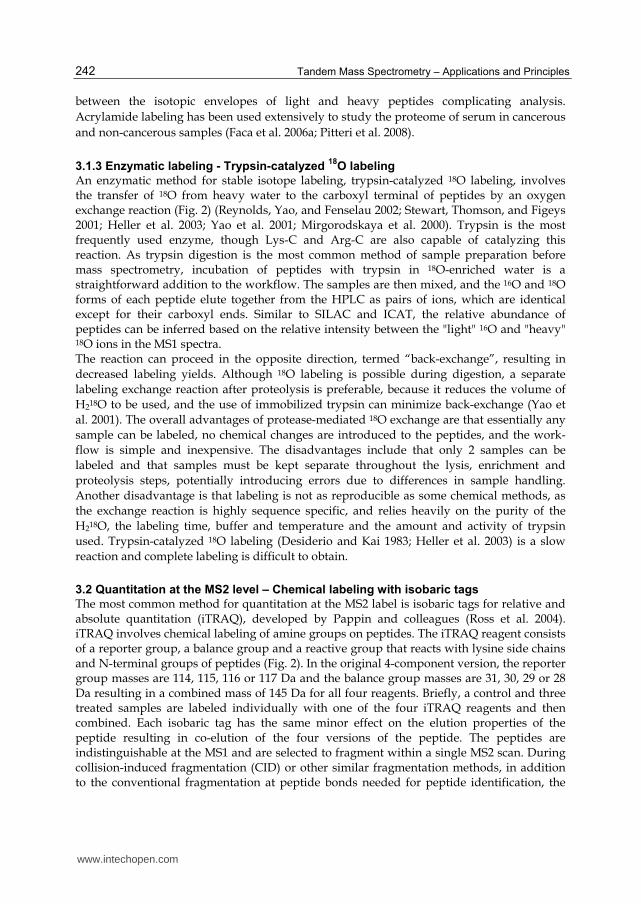
Fig. 2. Structure of 18O, ICAT and iTRAQ labeling reagents. The figure shows the structure of several stable isotope labeling reagents. In 18O labeling, tryptic preptides are incubated in H218O water and trypsin catalyzes an oxygen exchange reaction at the C-terminus of the peptide (two 18O molecules incorporated). The sample is then mixed with an unlabeled sample and quantitation performed. In ICAT, a thiol reactive group reacts with the cysteine amino acids attaching the ICAT reagent, which includes a linker and biotin tag. Two samples are labeled, one with an ICAT reagent with a light linker, the other with a heavy linker. Biotinylated peptides are purified via the biotin tag and quantitation is performed. Finally, in iTRAQ, four (or eight) samples are labeled with isobaric reagents, all weighting 145 Da total but having different reporter and balance group. For example, a 114 Reporter and a 31 Da balance group or a 117 Da Reporter and 28 Da balance group all add up to 145 Da. The four labeled samples are mixed and fragmented together. The Reporter group is released and quantitation is performed by comparing the 114, 115, 116 and 117 peaks.
3.1.2 Chemical labeling
3.1.2.1 Isotope-coded affinity tag (ICAT)
One of the first commercialized stable isotope tagging reagents was isotope-coded affinity tag (ICAT) (Gygi et al. 1999). Since its introduction in 1999, the ICAT approach has been
www.intechopen.com

Strategies and Challenges in Measuring Protein Abundance Using Stable Isotope Labeling and Tandem Mass Spectrometry
241
widely used (Gygi et al. 1999; Griffin et al. 2002; Zhou et al. 2002), and ICAT reagents are commercially available from Applied Biosystems. In ICAT, a pair of light and heavy reagents targets cysteine residues, adding a linker and a biotin tag for affinity purification (Fig. 2). While the linker region of the heavy reagent contains stable isotopes, the light reagent does not. Proteins are denatured, reduced and then labeled with heavy or light reagents, mixed and digested. The biotinylated peptides are purified using avidin affinity reagents, allowing for stringent washing that minimizes background binding. The main advantage of this method is that it leads to the enrichment of peptides containing cysteines, which are relatively rare, thereby significantly reducing the complexity of the peptide mixture and increasing the dynamic range of mass spectrometry analysis. But because only peptides and proteins containing cysteines are identified, the overall proteome coverage is low, resulting in less accurate quantitation. Finally, ICAT is limited to comparing two samples. Several global quantitation experiments have been performed using the ICAT approach, such as a comparison of protein expression in yeast using ethanol or galactose as a carbon source (Gygi et al. 1999). Other ICAT studies include identification of proteins regulated by the Myc oncoprotein (Shiio et al. 2002) by comparing the protein expression patterns between myc-null and myc-expressing cells and identification of proteins regulated by interferon treatment in human liver cells (Yan et al. 2004).
3.1.2.2 Other cysteine-targeted methods
Several other methods have been developed for chemical labeling of cysteines, including
HysTag (Olsen et al. 2004) and acrylamide labeling (Faca et al. 2006b). HysTag is a 10-mer
derivatized peptide consisting of an affinity ligand (His6-tag), a tryptic cleavage site, an Ala-
9 residue that contains either four (D4) or no (D0) deuterium atoms, and a thiol-reactive
group that targets cysteines. The HysTag peptide is preserved in Lys-C digestion of proteins
and allows subsequent charge-based selection of cysteine-containing peptides. To remove
the HysTag, subsequent tryptic digestion reduces the labeling group to a dipeptide, which
does not hinder effective MS2 fragmentation (Olsen et al. 2004). HysTag has many of the
same advantages and disadvantages as ICAT.
Another method involves the alkylation of cysteines of intact proteins with acrylamide (Faca
et al. 2006b). While cysteine alkylation with acrylamide via Michael addition is an undesired
reaction that frequently occurs during polyacrylamide gel electrophoresis (Patterson 1994),
several features make it a useful tagging approach for quantitative analysis with stable
isotopes. First, because of its small size and hydrophilic nature, the acrylamide moiety does
not introduce significant mass shift or charge changes in the protein and does not negatively
affect protein solubility. Second, cysteine labeling is facile, allowing for complete labeling.
Finally, the reagents are relatively inexpensive, making it practical to perform experiments
starting with large amounts of protein as needed for extensive fractionation and in-depth
analysis (Faca et al. 2006b). The acrylamide method does not include a cysteine peptide
enrichment step. Since any peptide can be identified, protein coverage is increased, dynamic
range is decreased. However, only cystein containing peptides are stable isotope labeled and
can be quantified. protein coverage is increased, dynamic range decreased and quantitation
is limited to cysteine containing peptides. A recent study used a combination of acrylamide
label cysteines and succinic anhydride labeled lysines to increase the quantitative coverage
(Wang et al. 2009). However, the mass shift is small (3 Da), resulting in frequent overlap
www.intechopen.com
Tandem Mass Spectrometry – Applications and Principles
242
between the isotopic envelopes of light and heavy peptides complicating analysis.
Acrylamide labeling has been used extensively to study the proteome of serum in cancerous
and non-cancerous samples (Faca et al. 2006a; Pitteri et al. 2008).
3.1.3 Enzymatic labeling - Trypsin-catalyzed 18
O labeling
An enzymatic method for stable isotope labeling, trypsin-catalyzed 18O labeling, involves the transfer of 18O from heavy water to the carboxyl terminal of peptides by an oxygen exchange reaction (Fig. 2) (Reynolds, Yao, and Fenselau 2002; Stewart, Thomson, and Figeys 2001; Heller et al. 2003; Yao et al. 2001; Mirgorodskaya et al. 2000). Trypsin is the most frequently used enzyme, though Lys-C and Arg-C are also capable of catalyzing this reaction. As trypsin digestion is the most common method of sample preparation before mass spectrometry, incubation of peptides with trypsin in 18O-enriched water is a straightforward addition to the workflow. The samples are then mixed, and the 16O and 18O forms of each peptide elute together from the HPLC as pairs of ions, which are identical except for their carboxyl ends. Similar to SILAC and ICAT, the relative abundance of peptides can be inferred based on the relative intensity between the "light" 16O and "heavy" 18O ions in the MS1 spectra. The reaction can proceed in the opposite direction, termed “back-exchange”, resulting in
decreased labeling yields. Although 18O labeling is possible during digestion, a separate
labeling exchange reaction after proteolysis is preferable, because it reduces the volume of
H218O to be used, and the use of immobilized trypsin can minimize back-exchange (Yao et
al. 2001). The overall advantages of protease-mediated 18O exchange are that essentially any
sample can be labeled, no chemical changes are introduced to the peptides, and the work-
flow is simple and inexpensive. The disadvantages include that only 2 samples can be
labeled and that samples must be kept separate throughout the lysis, enrichment and
proteolysis steps, potentially introducing errors due to differences in sample handling.
Another disadvantage is that labeling is not as reproducible as some chemical methods, as
the exchange reaction is highly sequence specific, and relies heavily on the purity of the
H218O, the labeling time, buffer and temperature and the amount and activity of trypsin
used. Trypsin-catalyzed 18O labeling (Desiderio and Kai 1983; Heller et al. 2003) is a slow
reaction and complete labeling is difficult to obtain.
3.2 Quantitation at the MS2 level – Chemical labeling with isobaric tags
The most common method for quantitation at the MS2 label is isobaric tags for relative and absolute quantitation (iTRAQ), developed by Pappin and colleagues (Ross et al. 2004). iTRAQ involves chemical labeling of amine groups on peptides. The iTRAQ reagent consists of a reporter group, a balance group and a reactive group that reacts with lysine side chains and N-terminal groups of peptides (Fig. 2). In the original 4-component version, the reporter group masses are 114, 115, 116 or 117 Da and the balance group masses are 31, 30, 29 or 28 Da resulting in a combined mass of 145 Da for all four reagents. Briefly, a control and three treated samples are labeled individually with one of the four iTRAQ reagents and then combined. Each isobaric tag has the same minor effect on the elution properties of the peptide resulting in co-elution of the four versions of the peptide. The peptides are indistinguishable at the MS1 and are selected to fragment within a single MS2 scan. During collision-induced fragmentation (CID) or other similar fragmentation methods, in addition to the conventional fragmentation at peptide bonds needed for peptide identification, the
www.intechopen.com

Strategies and Challenges in Measuring Protein Abundance Using Stable Isotope Labeling and Tandem Mass Spectrometry
243
reporter group ions (114,115, 116 and 117 Da) also break away from the backbone peptides (Fig. 3). Relative quantitation for each of the treatment conditions being studied is obtained by comparing the intensities of the reporter group fragments. 4- and 8-component iTRAQ kits are available from Applied Biosystems.
Fig. 3. Quantitation at MS1 and MS2 level. Upper panel illustrates quantitation at MS1 level as a result of labeling by SILAC or trypsin catalyzed 18O labeling. One sample is labeled with heavy isotope while the other is not labeled. The samples are mixed and in the MS1 spectra each peptide is represented as a peptide pair with an unlabeled or “light” peptide (blue) and a labeled or “heavy” peptide (red). Each peptide can be subjected to fragmentation resulting in MS2 spectra with identical b-ions but y-ions are shifted by the weight of the heavy isotope (not shown). Lower panel illustrates labeling with iTRAQ reagents, which requires quantitation at MS2 level. In iTRAQ all samples are labeled, typically four or eight total. The samples are mixed and because the iTRAQ reagent is isobaric, the peptides all co-elute and overlap, resulting in a single peptide envelope (purple). The peptides are fragmented together and the MS2 spectra contains the conventional fragment ions that overlap for all peptides and also, unique reporter ions for each sample, which are used for quantitation (114, 115, 116, 117).
Tandem Isobaric Mass Tag (TMT) kits with two or six components that work by a similar principle are available from Thermo Scientific (Thompson et al. 2003). Recently, Cystein-Reactive TMT reagents (cys-TMT) became available from Thermo Scientific. These cys-TMT
www.intechopen.com

Tandem Mass Spectrometry – Applications and Principles
244
reagents, like ICAT, target cysteines on proteins and allow for enrichment of cysteine containing peptides. As in iTRAQ and the conventional TMT, the reagents are isobaric and quantitation is performed at the MS2 level. Another type of isobaric method is Isobaric Peptide Termini Labeling (IPTL) (Koehler et al. 2011; Koehler et al. 2009). In IPTL two non-isobaric reagents are used. In one sample, the C-terminal lysine residues are labeled with 2-methoxy-4,5-dihydro-1H-imidazole (MDHI) followed by N-terminal derivatization with tetradeuterated succinic anhydride (SA-d4). In the second sample, the C-terminal lysines are labeled with tetradeuterated MDHI-d4 and the N-terminal derivatized with SA. Thus the peptides are isobaric, each peptide is 4 Da heavier than an unlabeled peptide, with the stable isotopes on the C-terminal in the first group and N-terminal in the second group of peptides. Quantitation is then performed directly on the fragment ions at the MS2 level. Each fragment ion will have a 4 Da heavier counterpart, with deuterated C-terminal or y-ions from the first set of peptides deuterated N-terminal ions or b-ions from the second set. In IPTL each fragment ions provides a quantitative value. Isobaric methods can be used to label any type of sample, including biofluids and tissue,
and up to 8 samples/conditions can be compared concurrently. However, iTRAQ and TMT
is limited to instruments that can provide good MS2 spectra in the 100-120 Da range, such as
the QSTAR Quadrupole Time-of-Flight instrument (ABI). Pulsed Q dissociation (PQD) and
higher energy C-trap dissociation (HCD) recently made it possible to detect the low mass
isobaric tag reagent fragments on linear ion trap instruments including the LTQ-Orbitrap
(Thermo Scientific) (Meany et al. 2007; Armenta, Hoeschele, and Lazar 2009; Kocher et al.
2009). The disadvantages of this type of chemical labeling are the presence of potential side
reactions, the extra steps required to remove excess reagents and derivatization byproducts
resulting in difficulty in achieving complete labeling. The iTRAQ approach has been used
for several large scale proteomic quantitative studies including time resolved monitoring of
kinase reactions (Zhang et al. 2005), comparison of organelle proteomes (Yan, Hwang, and
Aebersold 2008) and monitoring of protein expression changes as cancer cells acquire
increasing metastatic potential (Ho et al. 2009). Combining quantitation with
phosphoproteomics, Aebersold and colleagues (Pflieger et al. 2008) recently described an
iTRAQ method to simultaneously identify components and phosphorylation sites of protein
complexes.
3.3 Considerations for designing stable isotope experiments
Factors to consider when choosing which stable isotope to work with include price and increased complexity by chromatographic seperation of 2H (Ong, Kratchmarova, and Mann 2003). The most commonly used isotopes are 15N, 13C, and, to a lesser extent, 2H and 18O. A critical component to stable isotope labeling using chemical, enzymatic, or metabolic methods is achieving complete labeling. In metabolic labeling approaches, such as SILAC, stable isotopes are incorporated into proteins as they are expressed making complete labeling easily attainable. However, use of the method is limited to cultured cells or organisms that can be grown in the presence of heavy isotope. It is worth the effort to spend time optimizing and testing a labeled sample before starting an experiment, especially for non-metabolic labeling methods to achieve high levels of labeling. Although calculations can be done to normalize samples to extent of labeling, downstream analysis will be greatly simplified if labeling is complete. Unfortunately, even with optimization to achieve stoichiometric labeling of the majority of peptides, each of the methods is subject to one or
www.intechopen.com
Strategies and Challenges in Measuring Protein Abundance Using Stable Isotope Labeling and Tandem Mass Spectrometry
245
more artifacts, resulting in a subset of peptides that display partial or unexpected labeling, thereby confounding analysis. The timing of labeling is important in any quantitative experiment. The earlier the label is introduced and the sample can be mixed for downstream analysis, the better. Metabolic labeling methods allow for mixing of samples immediately following cell growth and before any protein and peptide enrichment methods. Protein labeling reagents such as ICAT and acrylamide allow for intermediate timing of labeling. In peptide labeling methods, such as iTRAQ, TMT and trypsin catalyzed 18O labeling, the sample is not mixed until several steps including cell lysis, protein separation (if any) and digestion have been performed. This can lead to introduction of sample handling errors. However, these reagents also allow for labeling of samples that metabolic labeling reagents cannot, including a wide range of clinical samples such as urine and tissue. Thus selection of labeling method should take into account type of sample and enrichment methods. If the label is introduced at a late stage in sample preparation care should be taken to minimize any difference in sample handling. All of the abovementioned methods of labeling, except for isobaric tags, result in generation
of peptide pairs at the MS1 level, where the light and heavy peptides are separated by a
predictable number of mass units. This allows background peaks to be readily distinguished
from “real” peptides insofar as the “real” peptides are represented by both light and heavy
forms with a characteristic mass offset. If the mass difference is small, the natural isotope
distribution of the light form will overlap with the monoisotopic peak of heavy form,
frustrating quantitiation. Trypsin-mediated 18O exchange yields a 4 Da mass difference that
leads to challenging quantitation of higher charged peptides and peptides over 20 residues,
particularly if the labeling is incomplete. Indeed, incorporation of a single 18O is common,
leading to a mass difference of only 2 Da. In turn, even though acrylamide labeling is
typically complete, it offers as little as a 3 Da mass shift. Although it is possible to
deconvolute such overlapping distributions and quantify the heavy and light peaks, this is a
complex and iterative process, requires high quality data, and is tedious. Thus, most
commercial labeling reagents including SILAC and ICAT are generated to have ≥ 4 Da mass
difference and avoid this complication. In addition, because increased number of peptide
species results in more complexity at the MS1 level and mass spectrometers are limited in
MS2 fragment scan speed and number, this can result in fewer protein identifications,
especially when more than two samples are analyzed together.
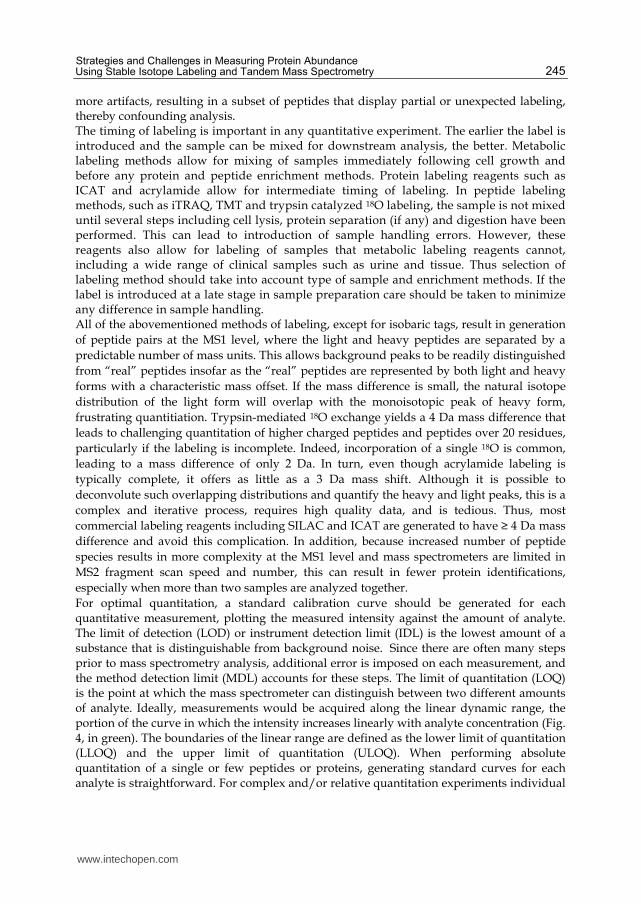
For optimal quantitation, a standard calibration curve should be generated for each quantitative measurement, plotting the measured intensity against the amount of analyte. The limit of detection (LOD) or instrument detection limit (IDL) is the lowest amount of a substance that is distinguishable from background noise. Since there are often many steps prior to mass spectrometry analysis, additional error is imposed on each measurement, and the method detection limit (MDL) accounts for these steps. The limit of quantitation (LOQ) is the point at which the mass spectrometer can distinguish between two different amounts of analyte. Ideally, measurements would be acquired along the linear dynamic range, the portion of the curve in which the intensity increases linearly with analyte concentration (Fig. 4, in green). The boundaries of the linear range are defined as the lower limit of quantitation (LLOQ) and the upper limit of quantitation (ULOQ). When performing absolute quantitation of a single or few peptides or proteins, generating standard curves for each analyte is straightforward. For complex and/or relative quantitation experiments individual
www.intechopen.com

Tandem Mass Spectrometry – Applications and Principles
246
standard curves are often not feasible. When validating quantitation from complex samples, one should consider that peptide measurements outside of the linear range may underestimate the change in abundance.
Fig. 4. An example of a standard curve showing the limits of detection and quantitation. The lowest amount of a peptide that can be detected in a mass spectrometer is defined as the limit of detection (LOD). Although the intensity of a peptide is dependent on the amount (number of moles present), this relationship is only linear over a certain range. This is the optimal range for quantitative measurements (in green) and its boundaries are defined as the lower limit of quantitation (LLOQ) and the upper limit of quantitation (ULOQ).
One of the most critical considerations for mass spectrometry analysis is the inclusion of replicate analyses and follow-up biological validation. Replicates allow the researcher to evaluate reproducibility in identification and quantitation and statistical significance of any identified proteome changes. Although technical replicates are helpful to identify variations due to mass spectrometry analysis, biological replicates should be performed for any proteomic experiment. The variations in sample handling, cell growth, labeling procedure can be high. This becomes vital in the case of clinical samples where biological variation can be very high. The exact number of replicates and statistical considerations vary between sample types, origin and type of experiment. An optimal experiment would involve consultation with a statistician before the experiment is started such that sufficient sample numbers and replicates can be included in the analysis.
4. Data analysis tools and suggestions to improve data quality
4.1 Quantitation software for MS1 level data
Selection of quantitation software depends on several factors including the stable isotope labeling method, the level of quantitation (MS1 versus MS2), the type of instrument used to obtain the data (ion traps versus Q-TOFs) and the availability of software (commercial
www.intechopen.com

Strategies and Challenges in Measuring Protein Abundance Using Stable Isotope Labeling and Tandem Mass Spectrometry
247
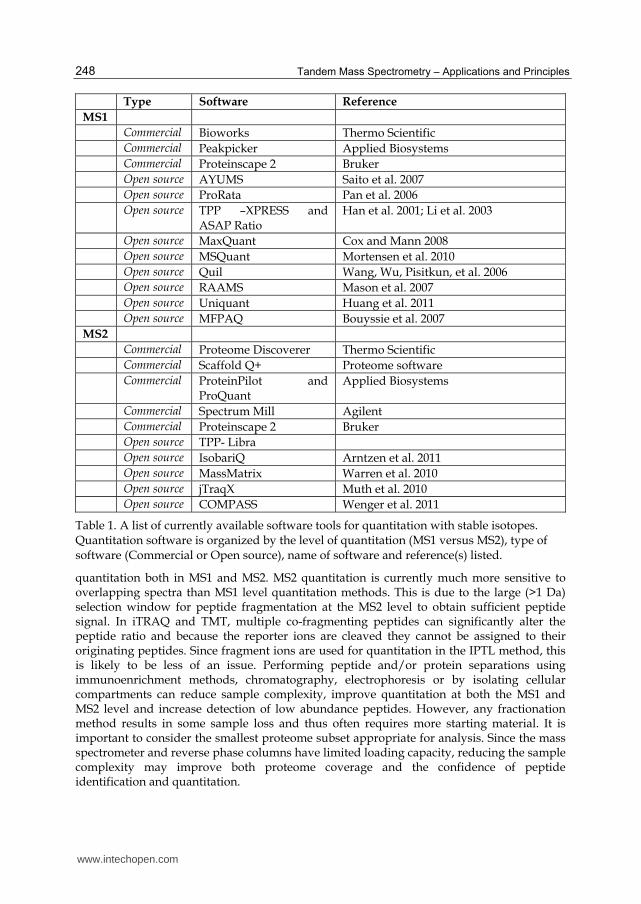
versus open source) (Table 1). Additional problems arise when the stable isotope label results in a mass shift small enough to allow overlap of the resulting isotopic envelopes, but specialized software is available to compensate for this overlap. Mass spectrometry manufacturers often provide proprietary software solutions for
quantitation. Examples include Bioworks (Thermo Scientific), Peakpicker (Applied
Biosystems) and WARP-LC™ 1.1 (Bruker). A large number of open-source software tools
are available including AYUMS (Saito et al. 2007), ProRata (Pan et al. 2006), Mascot File
Parsing and Quantification (MFPaQ) (Bouyssie et al. 2007), QUIL (Wang, Wu, Pisitkun, et al.
2006), MSQuant (Mortensen et al. 2010) and Uniquant (Huang et al. 2011). Compilations of
software are available including Trans Proteomic Pipeline (TPP) developed at the Institute
for Systems Biology (ISB) in Seattle (reviewed in (Deutsch et al. 2010). Modules for
quantitation include XPRESS (Han et al. 2001) and ASAPratio (Li et al. 2003). The ISB tools
have been incorporated into Computational Proteomics Analysis System (CPAS), a suite of
database and analysis tools for managing proteomics based experimental workflows and
integrating database search algorithms (Rauch et al. 2006). CPAS was originally developed
in the Fred Hutchinson Cancer Research Center but is now distributed as part of Labkey
Server, an open-source project managed by the Labkey Software Foundation. Another open-
source integrated suite of algorithms, termed MaxQuant, was developed by Matthias
Mann’s group and was specifically developed for quantitation of high-resolution MS data
(Cox and Mann 2008).
Separate software packages have been developed to account for the difficulties in interpreting spectra from isotopically labeled samples. An algorithm called regression analysis applied to mass spectrometry (RAAMS) corrects for partial 18O labeling as well as incorporation of naturally occurring isotopes (Mason et al. 2007).
4.2 Quantitation software for MS2 level (isobaric) data
Quantitation software for isobaric tags include commercially available solutions such as ProteinPilot and ProQuant from Applied Biosystems, Spectrum Mill from Agilent, Proteome Discoverer from Thermo Scientific and Scaffold Q+ from Proteome Software (Table 1). Open-source software includes Libra, a software module used within the Trans Proteomic Pipeline (TPP), MassMatrix, a search engine that performs quantitation of TMT and iTRAQ (Warren et al. 2010), IsobariQ which was designed for IPTL, iTRAQ and TMT (Arntzen et al. 2011) and jTraqX, a platform independent tool for isobaric tag quantitation (Muth et al. 2010). COMPASS is an integrated suite of pre- and post-search proteomics software tools specific to the OMSSA database search engine (Wenger et al. 2011).
4.3 Common concerns and how to achieve high quality quantitation
Despite the available software packages for peptide and protein identification and quantitation, manual validation is often required for confirmation. Inaccurate or ambiguous results are common when too few peptides can be quantified from a protein or where the standard deviation or p-value between multiple quantified peptides from a protein is not statistically significant. High-abundance proteins that yield ratios close to 1:1 have the highest confidence levels but provide little or no biological insight. As with any mass spectrometry experiment, low-abundance proteins are difficult to study because of the limited dynamic range. In addition, if the sample is too complex (too many peptides are in the sample), overlapping peptide spectra can occur and bring about errors in peptide
www.intechopen.com
Tandem Mass Spectrometry – Applications and Principles
248
Type Software Reference
MS1
Commercial Bioworks Thermo Scientific
Commercial Peakpicker Applied Biosystems
Commercial Proteinscape 2 Bruker
Open source AYUMS Saito et al. 2007
Open source ProRata Pan et al. 2006
Open source TPP –XPRESS and ASAP Ratio
Han et al. 2001; Li et al. 2003
Open source MaxQuant Cox and Mann 2008
Open source MSQuant Mortensen et al. 2010
Open source Quil Wang, Wu, Pisitkun, et al. 2006
Open source RAAMS Mason et al. 2007
Open source Uniquant Huang et al. 2011
Open source MFPAQ Bouyssie et al. 2007
MS2
Commercial Proteome Discoverer Thermo Scientific
Commercial Scaffold Q+ Proteome software
Commercial ProteinPilot and ProQuant
Applied Biosystems
Commercial Spectrum Mill Agilent
Commercial Proteinscape 2 Bruker
Open source TPP- Libra
Open source IsobariQ Arntzen et al. 2011
Open source MassMatrix Warren et al. 2010
Open source jTraqX Muth et al. 2010 Open source COMPASS Wenger et al. 2011
Table 1. A list of currently available software tools for quantitation with stable isotopes. Quantitation software is organized by the level of quantitation (MS1 versus MS2), type of software (Commercial or Open source), name of software and reference(s) listed.
quantitation both in MS1 and MS2. MS2 quantitation is currently much more sensitive to overlapping spectra than MS1 level quantitation methods. This is due to the large (>1 Da) selection window for peptide fragmentation at the MS2 level to obtain sufficient peptide signal. In iTRAQ and TMT, multiple co-fragmenting peptides can significantly alter the peptide ratio and because the reporter ions are cleaved they cannot be assigned to their originating peptides. Since fragment ions are used for quantitation in the IPTL method, this is likely to be less of an issue. Performing peptide and/or protein separations using immunoenrichment methods, chromatography, electrophoresis or by isolating cellular compartments can reduce sample complexity, improve quantitation at both the MS1 and MS2 level and increase detection of low abundance peptides. However, any fractionation method results in some sample loss and thus often requires more starting material. It is important to consider the smallest proteome subset appropriate for analysis. Since the mass spectrometer and reverse phase columns have limited loading capacity, reducing the sample complexity may improve both proteome coverage and the confidence of peptide identification and quantitation.
www.intechopen.com

Strategies and Challenges in Measuring Protein Abundance Using Stable Isotope Labeling and Tandem Mass Spectrometry
249
Accurate quantitation requires consideration of naturally occurring isotopes present in peptides, especially when small differences are measured using 13C stable isotopes. For MS1 labeling, calculating the peptide ratio using the whole isotopic envelope is more accurate than performing quantitation on only the monoisotopic peak. For a given peptide sequence, the isotopic envelope can be calculated and correlated to the measured distribution, and the isotope enrichment can be measured. An overall enrichment correlation factor can ensure consistent metabolic labeling. This calculation needs to be performed for each quantitative measurement when using trypsin catalyzed 18O labeling, which can vary with peptide sequence. This algorithm has been incorporated into quantitative software. RAAMS uses a method to estimate the isotopic envelope based on “averagine”, the isotopic distribution in an average amino acid (C4.9384H7.7583N1.3577O1.4773S0.0417) (Mason et al. 2007). In MS2 level quantitation, including iTRAQ, TMT and IPTL, quantitative measurements cannot be determined over the elution time of a peptide, only for single fragmentation spectra. Instead, replicate measurement should be performed to increase confidence in quantitation. Finally, for both MS1 and MS2 labeling, the measurements are performed at the peptide level and not protein level. Proteins are inferred from peptides. The peptide ratios from what appears to be a single protein can differ for several reasons including that peptides can be identical in several proteins and that peptides could be post-translationally modified and not visible in the mass spectrometry data. Thus the protein value is a weighted average of all protein forms and not a single protein ratio.
5. Harnessing the information obtained from stable isotope labeling
With the exception of isobaric methods, the MS1 spectra will contain isotopic peptide pairs consisting of an unlabeled and a labeled peptide. Optimally, the mass spectrometer would recognize these pairs and preferentially select only "light" monoisotopic ions of pairs for fragmentation, thereby avoiding background and/or contaminating ions and offsetting the added complexity in the sample. This is particularly important for the analysis of complex stable isotope labeled samples where the number of peptide pairs far exceeds the number of possible fragmentation scans. In principle, the existing user-defined, data-dependent scanning software provided on commercial mass spectrometers can be adapted to direct the mass spectrometer to flag ions that are separated by a pre-defined mass and subject only these to fragmentation. For example, such a setting is called “mass tag” in Xcalibur software for Orbitraps and FT-ICR mass spectrometers (Thermo Scientific). However, as of the writing of this review, "mass tag" remains to be fully implemented.
5.1 Other uses for stable isotope labeling
Stable isotope labeling has been used to distinguish contaminants from bona fide interactors in immunopurifications (I-DIRT) (Tackett et al. 2005). Yeast cells containing an affinity-tagged protein were grown in light SILAC media and control yeast cells in heavy media. After isolation of the affinity tagged protein complex, specific protein interactions were identified by mass spectrometry as a single unlabeled peptide (light), but background contaminant proteins present in both the control (heavy) and affinity-tag protein expressing cells (light) were identified as peptide pairs. Another clever use of stable isotope quantitation is to examine dynamic protein-protein complexes and protein-DNA complexes (Pflieger et al. 2008; Mittler, Butter, and Mann 2009) by combining affinity purification approaches with stable isotope tagging. Quantification of component stoichiometry of
www.intechopen.com
Tandem Mass Spectrometry – Applications and Principles
250
multiprotein complexes has also been performed using a peptide-concatenated standard (PCS) strategy (Kito et al. 2007). In this strategy, tryptic peptides suitable for quantification are selected from each component of the multiprotein complex and concatenated into a single synthetic protein, resulting in equimolar amounts of each "heavy" reference peptide. Other uses for stable isotope labeling include measuring the rate of protein turnover (Pratt et al. 2002) and identifying phosphorylation sites (Pflieger et al. 2008).
5.2 Use of stable isotopes to obtain faster and more accurate protein identification
A complementary advantage of stable isotope labeling is that when both heavy and light forms are subjected to fragmentation, mass shifts are observed in the MS2 spectra that facilitate deconvolution and peptide sequence analysis. When only the carboxyl terminus is labeled as in lysine/arginine SILAC or 18O labeling, comparing the two fragmentation patterns reveals ions that derive from the carboxyl terminus (y-type ions) as those display characteristic mass shifts (e.g. 8 or 4 Da). Accordingly, comparison of spectra of labeled and unlabeled peptide fragments allows for assignment of peaks as shifting or non-shifting, facilitating de novo peptide sequence analysis (Hunt et al. 1986; Schnolzer, Jedrzejewski, and Lehmann 1996; Takao et al. 1991; Gray, Wojcik, and Futrell 1970; Rose et al. 1983). Peak assignment for validation of peptide identifications obtained by database search has been automated in the Validator software suite (Volchenboum et al. 2009), which recognizes isotopic peptide pairs from searched MS data and compares their identifications and fragmentation patterns. Because database search algorithms do not utilize the embedded information from comparison of labeled and unlabeled peptides, Validator software provides a direct and independent means to validate peptide identifications from database search algorithms.
6. Conclusions
Stable isotopes have become a versatile and useful tool in quantitative mass spectrometry. This review has described chemical, enzymatic and metabolic stable isotope labeling techniques while highlighting the advantages and disadvantages of each method. A wide variety of sample types can be labeled and analyzed from single proteins and complexes to bacteria, yeast, mammalian cells, biofluids and tissues. For optimal absolute quantitation, each peptide to be measured requires a labeled counterpart, making it a costly and laborious methodology for large proteomic studies. Complex samples are better suited to relative quantitation where fold-change is calculated by comparing peptide levels to a fully labeled control sample. Stable isotope labeling is also useful for identifying components and measuring the stoichiometry of protein-protein and protein-DNA complexes. Stable isotopes can also facilitate identification of posttranslational modifications and background contamination and to aid in peptide identification and validation. The advent of modern mass spectrometers has allowed for precise quantitation of sub-
femtomolar samples with their remarkable sensitivity, resolution, reproducibility and speed.
However, many challenges remain, affecting the quality of results and resulting in pitfalls
for experienced and naïve users alike. No isotopic method is free of the wide range of
artifacts that arise due to biological variation, human error, design and implementation of
instrumentation control and poorly written and implemented data analysis software.
Confounding the situation, proteomics experiments provide spurious answers side-by-side
with highly reliable results, often with no clear distinction among them.
www.intechopen.com

Strategies and Challenges in Measuring Protein Abundance Using Stable Isotope Labeling and Tandem Mass Spectrometry
251
Nonetheless, some common principles apply that will enhance the quality of every experiment. Achieving the most complete and consistent labeling feasible greatly simplifies downstream data analysis. Decreasing sample complexity to improve peptide statistics for each protein facilitates high confidence in identifications and the ready discovery of quantitation artifacts. Despite advantages in software design, manual validation through visual inspection of mass spectrometry spectra remains a critical step. Therefore, stable isotope labeling for protein quantitation by mass spectrometry is still an emerging technology and care must be taken to use appropriate controls, including biological and/or technical replicates, in order to identify potential problems with labeling, sample handling and/or data analysis.
7. References
Aebersold, R., and M. Mann. 2003. "Mass spectrometry-based proteomics." Nature no. 422
(6928):198-207. doi: 10.1038/nature01511.
Amanchy, R., D. E. Kalume, A. Iwahori, J. Zhong, and A. Pandey. 2005. "Phosphoproteome
analysis of HeLa cells using stable isotope labeling with amino acids in cell culture
(SILAC)." J Proteome Res no. 4 (5):1661-71. doi: 10.1021/pr050134h.
Andersen, J. S., Y. W. Lam, A. K. Leung, S. E. Ong, C. E. Lyon, A. I. Lamond, and M. Mann.
2005. "Nucleolar proteome dynamics." Nature no. 433 (7021):77-83.
Armenta, J. M., I. Hoeschele, and I. M. Lazar. 2009. "Differential protein expression analysis
using stable isotope labeling and PQD linear ion trap MS technology." J Am Soc
Mass Spectrom no. 20 (7):1287-302. doi: S1044-0305(09)00140-8 [pii]
10.1016/j.jasms.2009.02.029.
Arntzen, M. O., C. J. Koehler, H. Barsnes, F. S. Berven, A. Treumann, and B. Thiede. 2011.
"IsobariQ: software for isobaric quantitative proteomics using IPTL, iTRAQ, and
TMT." J Proteome Res no. 10 (2):913-20. doi: 10.1021/pr1009977.
Baillie, T. A. 1981. "The use of stable isotopes in pharmacological research." Pharmacol Rev
no. 33 (2):81-132.
Barnidge, D. R., E. A. Dratz, T. Martin, L. E. Bonilla, L. B. Moran, and A. Lindall. 2003.
"Absolute quantification of the G protein-coupled receptor rhodopsin by
LC/MS/MS using proteolysis product peptides and synthetic peptide standards."
Anal Chem no. 75 (3):445-51.
Barr, J. R., V. L. Maggio, D. G. Patterson, G. R. Cooper, L. O. Henderson, W. E. Turner, S. J.
Smith, W. H. Hannon, L. L. Needham, and E. J. Sampson. 1996. "Isotope dilution--
mass spectrometric quantification of specific proteins: model application with
apolipoprotein A-I." Clin Chem no. 42 (10):1676-82.
Beynon, R. J., M. K. Doherty, J. M. Pratt, and S. J. Gaskell. 2005. "Multiplexed absolute
quantification in proteomics using artificial QCAT proteins of concatenated
signature peptides." Nat Methods no. 2 (8):587-9.
Beynon, R. J., and J. M. Pratt. 2005. "Metabolic labeling of proteins for proteomics." Mol Cell
Proteomics no. 4 (7):857-72. doi: 10.1074/mcp.R400010-MCP200.
Blagoev, B., S. E. Ong, I. Kratchmarova, and M. Mann. 2004. "Temporal analysis of
phosphotyrosine-dependent signaling networks by quantitative proteomics." Nat
Biotechnol no. 22 (9):1139-45. doi: 10.1038/nbt1005 nbt1005 [pii].
www.intechopen.com

Tandem Mass Spectrometry – Applications and Principles
252
Bouyssie, D., A. Gonzalez de Peredo, E. Mouton, R. Albigot, L. Roussel, N. Ortega, C.
Cayrol, O. Burlet-Schiltz, J. P. Girard, and B. Monsarrat. 2007. "Mascot file parsing
and quantification (MFPaQ), a new software to parse, validate, and quantify
proteomics data generated by ICAT and SILAC mass spectrometric analyses:
application to the proteomics study of membrane proteins from primary human
endothelial cells." Mol Cell Proteomics no. 6 (9):1621-37.
Brun, V., A. Dupuis, A. Adrait, M. Marcellin, D. Thomas, M. Court, F. Vandenesch, and J.
Garin. 2007. "Isotope-labeled protein standards: toward absolute quantitative
proteomics." Mol Cell Proteomics no. 6 (12):2139-49. doi: M700163-MCP200 [pii]
10.1074/mcp.M700163-MCP200.
Brun, V., C. Masselon, J. Garin, and A. Dupuis. 2009. "Isotope dilution strategies for absolute
quantitative proteomics." J Proteomics no. 72 (5):740-9. doi: S1874-3919(09)00107-9
[pii] 10.1016/j.jprot.2009.03.007.
Cox, J., and M. Mann. 2008. "MaxQuant enables high peptide identification rates,
individualized p.p.b.-range mass accuracies and proteome-wide protein
quantification." Nat Biotechnol no. 26 (12):1367-72. doi: nbt.1511 [pii]
10.1038/nbt.1511.
de Godoy, L. M., J. V. Olsen, G. A. de Souza, G. Li, P. Mortensen, and M. Mann. 2006. "Status
of complete proteome analysis by mass spectrometry: SILAC labeled yeast as a
model system." Genome Biol no. 7 (6):R50.
Desiderio, D. M., and M. Kai. 1983. "Preparation of stable isotope-incorporated peptide
internal standards for field desorption mass spectrometry quantification of
peptides in biologic tissue." Biomed Mass Spectrom no. 10 (8):471-9.
Deutsch, E. W., L. Mendoza, D. Shteynberg, T. Farrah, H. Lam, N. Tasman, Z. Sun, E.
Nilsson, B. Pratt, B. Prazen, J. K. Eng, D. B. Martin, A. I. Nesvizhskii, and R.
Aebersold. 2010. "A guided tour of the Trans-Proteomic Pipeline." Proteomics no. 10
(6):1150-9. doi: 10.1002/pmic.200900375.
Dupuis, A., J. A. Hennekinne, J. Garin, and V. Brun. 2008. "Protein Standard Absolute
Quantification (PSAQ) for improved investigation of staphylococcal food poisoning
outbreaks." Proteomics no. 8 (22):4633-6. doi: 10.1002/pmic.200800326.
Faca, V., M. Coram, D. Phanstiel, V. Glukhova, Q. Zhang, M. Fitzgibbon, M. McIntosh, and
S. Hanash. 2006a. "Quantitative analysis of acrylamide labeled serum proteins by
LC-MS/MS." J Proteome Res no. 5 (8):2009-18. doi: 10.1021/pr060102+.
Faca, V., M. Coram, D. Phanstiel, V. Glukhova, Q. Zhang, M. Fitzgibbon, M. McIntosh, and
S. Hanash. 2006b. "Quantitative analysis of acrylamide labeled serum proteins by
LC-MS/MS." Journal of proteome research no. 5 (8):2009-18. doi: 10.1021/pr060102+.
Fischer, B., J. Grossmann, V. Roth, W. Gruissem, S. Baginsky, and J. M. Buhmann. 2006.
"Semi-supervised LC/MS alignment for differential proteomics." Bioinformatics no.
22 (14):e132-40.
Geiger, T., J. Cox, P. Ostasiewicz, J. R. Wisniewski, and M. Mann. 2010. "Super-SILAC mix
for quantitative proteomics of human tumor tissue." Nat Methods no. 7 (5):383-5.
doi: nmeth.1446 [pii] 10.1038/nmeth.1446.
www.intechopen.com
Strategies and Challenges in Measuring Protein Abundance Using Stable Isotope Labeling and Tandem Mass Spectrometry
253
Gerber, S. A., J. Rush, O. Stemman, M. W. Kirschner, and S. P. Gygi. 2003. "Absolute
quantification of proteins and phosphoproteins from cell lysates by tandem MS."
Proc Natl Acad Sci U S A no. 100 (12):6940-5.
Gray, W. R., L. H. Wojcik, and J. H. Futrell. 1970. "Application of mass spectrometry to
protein chemistry. II. Chemical ionization studies on acetylated permethylated
peptides." Biochem Biophys Res Commun no. 41 (5):1111-9. doi: 0006-291X(70)90200-7
[pii].
Griffin, T. J., S. P. Gygi, T. Ideker, B. Rist, J. K. Eng, L. Hood, and R. Aebersold. 2002.
"Complementary profiling of gene expression at the transcriptome and proteome
levels in Saccharomyces cerevisiae." Mol Cell Proteomics no. 1 (4):323-33.
Gygi, S. P., B. Rist, S. A. Gerber, F. Turecek, M. H. Gelb, and R. Aebersold. 1999.
"Quantitative analysis of complex protein mixtures using isotope-coded affinity
tags." Nat Biotechnol no. 17 (10):994-9.
Han, D. K., J. K. Eng, H. Zhou, and R. Aebersold. 2001. "Quantitative profiling of
differentiation-induced microsomal proteins using isotope-coded affinity tags and
mass spectrometry." Nat Biotechnol no. 19 (10):946-51.
Hanke, S., H. Besir, D. Oesterhelt, and M. Mann. 2008. "Absolute SILAC for accurate
quantitation of proteins in complex mixtures down to the attomole level." J
Proteome Res no. 7 (3):1118-30. doi: 10.1021/pr7007175.
Heller, M., H. Mattou, C. Menzel, and X. Yao. 2003. "Trypsin catalyzed 16O-to-18O exchange
for comparative proteomics: tandem mass spectrometry comparison using MALDI-
TOF, ESI-QTOF, and ESI-ion trap mass spectrometers." J Am Soc Mass Spectrom no.
14 (7):704-18. doi: S1044030503002071 [pii].
Ho, J., J. W. Kong, L. Y. Choong, M. C. Loh, W. Toy, P. K. Chong, C. H. Wong, C. Y. Wong,
N. Shah, and Y. P. Lim. 2009. "Novel Breast Cancer Metastasis-Associated Proteins."
J Proteome Res no. 8 (2):583-594. doi: 10.1021/pr8007368 10.1021/pr8007368 [pii].
Huang, X., A. V. Tolmachev, Y. Shen, M. Liu, L. Huang, Z. Zhang, G. A. Anderson, R. D.
Smith, W. C. Chan, S. H. Hinrichs, K. Fu, and S. J. Ding. 2011. "UNiquant, a
program for quantitative proteomics analysis using stable isotope labeling." J
Proteome Res no. 10 (3):1228-37. doi: 10.1021/pr1010058.
Hunt, D. F., J. R. Yates, 3rd, J. Shabanowitz, S. Winston, and C. R. Hauer. 1986. "Protein
sequencing by tandem mass spectrometry." Proc Natl Acad Sci U S A no. 83
(17):6233-7.
Johnson, H., S. C. Wong, D. M. Simpson, R. J. Beynon, and S. J. Gaskell. 2008. "Protein
quantification by selective isolation and fragmentation of isotopic pairs using FT-
ICR MS." Journal of the American Society for Mass Spectrometry no. 19 (7):973-7. doi:
10.1016/j.jasms.2008.03.012.
Kippen, A. D., F. Cerini, L. Vadas, R. Stocklin, L. Vu, R. E. Offord, and K. Rose. 1997.
"Development of an isotope dilution assay for precise determination of insulin, C-
peptide, and proinsulin levels in non-diabetic and type II diabetic individuals with
comparison to immunoassay." J Biol Chem no. 272 (19):12513-22.
Kito, K., K. Ota, T. Fujita, and T. Ito. 2007. "A synthetic protein approach toward accurate
mass spectrometric quantification of component stoichiometry of multiprotein
complexes." J Proteome Res no. 6 (2):792-800. doi: 10.1021/pr060447s.
www.intechopen.com

Tandem Mass Spectrometry – Applications and Principles
254
Kocher, T., P. Pichler, M. Schutzbier, C. Stingl, A. Kaul, N. Teucher, G. Hasenfuss, J. M.
Penninger, and K. Mechtler. 2009. "High precision quantitative proteomics using
iTRAQ on an LTQ Orbitrap: a new mass spectrometric method combining the
benefits of all." J Proteome Res no. 8 (10):4743-52. doi: 10.1021/pr900451u.
Koehler, C. J., M. O. Arntzen, M. Strozynski, A. Treumann, and B. Thiede. 2011. "Isobaric
peptide termini labeling utilizing site-specific N-terminal succinylation." Anal Chem
no. 83 (12):4775-81. doi: 10.1021/ac200229w.
Koehler, C. J., M. Strozynski, F. Kozielski, A. Treumann, and B. Thiede. 2009. "Isobaric
peptide termini labeling for MS/MS-based quantitative proteomics." J Proteome Res
no. 8 (9):4333-41. doi: 10.1021/pr900425n.
Li, X. J., H. Zhang, J. A. Ranish, and R. Aebersold. 2003. "Automated statistical analysis of
protein abundance ratios from data generated by stable-isotope dilution and
tandem mass spectrometry." Anal Chem no. 75 (23):6648-57. doi: 10.1021/ac034633i.
Listgarten, J., and A. Emili. 2005. "Statistical and computational methods for comparative
proteomic profiling using liquid chromatography-tandem mass spectrometry." Mol
Cell Proteomics no. 4 (4):419-34.
Mason, C. J., T. M. Therneau, J. E. Eckel-Passow, K. L. Johnson, A. L. Oberg, J. E. Olson, K. S.
Nair, D. C. Muddiman, and H. R. Bergen, 3rd. 2007. "A method for automatically
interpreting mass spectra of 18O-labeled isotopic clusters." Mol Cell Proteomics no. 6
(2):305-18. doi: M600148-MCP200 [pii] 10.1074/mcp.M600148-MCP200.
Meany, D. L., H. Xie, L. V. Thompson, E. A. Arriaga, and T. J. Griffin. 2007. "Identification of
carbonylated proteins from enriched rat skeletal muscle mitochondria using
affinity chromatography-stable isotope labeling and tandem mass spectrometry."
Proteomics no. 7 (7):1150-63. doi: 10.1002/pmic.200600450.
Mirgorodskaya, O. A., Y. P. Kozmin, M. I. Titov, R. Korner, C. P. Sonksen, and P. Roepstorff.
2000. "Quantitation of peptides and proteins by matrix-assisted laser
desorption/ionization mass spectrometry using (18)O-labeled internal standards."
Rapid Commun Mass Spectrom no. 14 (14):1226-32. doi: 10.1002/1097-
0231(20000730)14:14<1226::AID-RCM14>3.0.CO;2-V [pii] 10.1002/1097-
0231(20000730)14:14<1226::AID-RCM14>3.0.CO;2-V.
Mittler, G., F. Butter, and M. Mann. 2009. "A SILAC-based DNA protein interaction screen
that identifies candidate binding proteins to functional DNA elements." Genome Res
no. 19 (2):284-93. doi: gr.081711.108 [pii] 10.1101/gr.081711.108.
Molina, H., Y. Yang, T. Ruch, J. W. Kim, P. Mortensen, T. Otto, A. Nalli, Q. Q. Tang, M. D.
Lane, R. Chaerkady, and A. Pandey. 2009. "Temporal profiling of the adipocyte
proteome during differentiation using a five-plex SILAC based strategy." J Proteome
Res no. 8 (1):48-58. doi: 10.1021/pr800650r.
Mortensen, P., J. W. Gouw, J. V. Olsen, S. E. Ong, K. T. Rigbolt, J. Bunkenborg, J. Cox, L. J.
Foster, A. J. Heck, B. Blagoev, J. S. Andersen, and M. Mann. 2010. "MSQuant, an
open source platform for mass spectrometry-based quantitative proteomics." J
Proteome Res no. 9 (1):393-403. doi: 10.1021/pr900721e.
Muth, T., D. Keller, S. M. Puetz, L. Martens, A. Sickmann, and A. M. Boehm. 2010. "jTraqX: a
free, platform independent tool for isobaric tag quantitation at the protein level."
Proteomics no. 10 (6):1223-5. doi: 10.1002/pmic.200900374.
www.intechopen.com
Strategies and Challenges in Measuring Protein Abundance Using Stable Isotope Labeling and Tandem Mass Spectrometry
255
Oda, Y., K. Huang, F. R. Cross, D. Cowburn, and B. T. Chait. 1999. "Accurate quantitation of
protein expression and site-specific phosphorylation." Proc Natl Acad Sci U S A no.
96 (12):6591-6.
Olsen, J. V., J. S. Andersen, P. A. Nielsen, M. L. Nielsen, D. Figeys, M. Mann, and J. R.
Wisniewski. 2004. "HysTag--a novel proteomic quantification tool applied to
differential display analysis of membrane proteins from distinct areas of mouse
brain." Mol Cell Proteomics no. 3 (1):82-92.
Ong, S. E., B. Blagoev, I. Kratchmarova, D. B. Kristensen, H. Steen, A. Pandey, and M. Mann.
2002. "Stable isotope labeling by amino acids in cell culture, SILAC, as a simple and
accurate approach to expression proteomics." Mol Cell Proteomics no. 1 (5):376-86.
Ong, S. E., I. Kratchmarova, and M. Mann. 2003. "Properties of 13C-substituted arginine in
stable isotope labeling by amino acids in cell culture (SILAC)." J Proteome Res no. 2
(2):173-81.
Ono, M., M. Shitashige, K. Honda, T. Isobe, H. Kuwabara, H. Matsuzuki, S. Hirohashi, and
T. Yamada. 2006. "Label-free quantitative proteomics using large peptide data sets
generated by nanoflow liquid chromatography and mass spectrometry." Mol Cell
Proteomics no. 5 (7):1338-47.
Pan, C., G. Kora, W. H. McDonald, D. Tabb, N. C. VerBerkmoes, G. B. Hurst, D. A. Pelletier,
N. F. Samatova, and R. L. Hettich. 2006. "ProRata: A quantitative proteomics
program for accurate protein abundance ratio estimation with confidence interval
evaluation." Anal Chem no. 78 (20):7121-31. doi: 10.1021/ac060654b.
Paoletti, A. C., T. J. Parmely, C. Tomomori-Sato, S. Sato, D. Zhu, R. C. Conaway, J. W.
Conaway, L. Florens, and M. P. Washburn. 2006. "Quantitative proteomic analysis
of distinct mammalian Mediator complexes using normalized spectral abundance
factors." Proc Natl Acad Sci U S A no. 103 (50):18928-33.
Patterson, S. D. 1994. "From electrophoretically separated protein to identification: strategies
for sequence and mass analysis." Anal Biochem no. 221 (1):1-15. doi: S0003-
2697(84)71371-6 [pii] 10.1006/abio.1994.1371.
Pflieger, D., M. A. Junger, M. Muller, O. Rinner, H. Lee, P. M. Gehrig, M. Gstaiger, and R.
Aebersold. 2008. "Quantitative proteomic analysis of protein complexes: concurrent
identification of interactors and their state of phosphorylation." Mol Cell Proteomics
no. 7 (2):326-46. doi: M700282-MCP200 [pii] 10.1074/mcp.M700282-MCP200.
Pitteri, S. J., V. M. Faca, K. S. Kelly-Spratt, A. E. Kasarda, H. Wang, Q. Zhang, L. Newcomb,
A. Krasnoselsky, S. Paczesny, G. Choi, M. Fitzgibbon, M. W. McIntosh, C. J. Kemp,
and S. M. Hanash. 2008. "Plasma proteome profiling of a mouse model of breast
cancer identifies a set of up-regulated proteins in common with human breast
cancer cells." Journal of proteome research no. 7 (4):1481-9. doi: 10.1021/pr7007994.
Pratt, J. M., J. Petty, I. Riba-Garcia, D. H. Robertson, S. J. Gaskell, S. G. Oliver, and R. J.
Beynon. 2002. "Dynamics of protein turnover, a missing dimension in proteomics."
Mol Cell Proteomics no. 1 (8):579-91.
Pratt, J. M., D. M. Simpson, M. K. Doherty, J. Rivers, S. J. Gaskell, and R. J. Beynon. 2006.
"Multiplexed absolute quantification for proteomics using concatenated signature
peptides encoded by QconCAT genes." Nat Protoc no. 1 (2):1029-43.
www.intechopen.com

Tandem Mass Spectrometry – Applications and Principles
256
Rauch, A., M. Bellew, J. Eng, M. Fitzgibbon, T. Holzman, P. Hussey, M. Igra, B. Maclean, C.
W. Lin, A. Detter, R. Fang, V. Faca, P. Gafken, H. Zhang, J. Whiteaker, J. Whitaker,
D. States, S. Hanash, A. Paulovich, and M. W. McIntosh. 2006. "Computational
Proteomics Analysis System (CPAS): an extensible, open-source analytic system for
evaluating and publishing proteomic data and high throughput biological
experiments." Journal of proteome research no. 5 (1):112-21. doi: 10.1021/pr0503533.
Reynolds, K. J., X. Yao, and C. Fenselau. 2002. "Proteolytic 18O labeling for comparative
proteomics: evaluation of endoprotease Glu-C as the catalytic agent." J Proteome Res
no. 1 (1):27-33.
Rivers, J., D. M. Simpson, D. H. Robertson, S. J. Gaskell, and R. J. Beynon. 2007. "Absolute
multiplexed quantitative analysis of protein expression during muscle
development using QconCAT." Mol Cell Proteomics no. 6 (8):1416-27.
Rose, K., M. G. Simona, R. E. Offord, C. P. Prior, B. Otto, and D. R. Thatcher. 1983. "A new
mass-spectrometric C-terminal sequencing technique finds a similarity between
gamma-interferon and alpha 2-interferon and identifies a proteolytically clipped
gamma-interferon that retains full antiviral activity." Biochem J no. 215 (2):273-7.
Ross, P. L., Y. N. Huang, J. N. Marchese, B. Williamson, K. C. Parker, S. Hattan, N.
Khainovski, S. Pillai, S. Dey, S. Daniels, S. Purkayastha, P. Juhasz, S. Martin, M.
Bartlet-Jones, F. He, A. Jacobson, and D. J. Pappin. 2004. "Multiplexed protein
quantitation in Saccharomyces cerevisiae using amine-reactive isobaric tagging
reagents." Mol Cell Proteomics no. 3 (12):1154-69.
Saito, A., M. Nagasaki, M. Oyama, H. Kozuka-Hata, K. Semba, S. Sugano, T. Yamamoto, and
S. Miyano. 2007. "AYUMS: an algorithm for completely automatic quantitation
based on LC-MS/MS proteome data and its application to the analysis of signal
transduction." BMC Bioinformatics no. 8:15.
Schnolzer, M., P. Jedrzejewski, and W. D. Lehmann. 1996. "Protease-catalyzed incorporation
of 18O into peptide fragments and its application for protein sequencing by
electrospray and matrix-assisted laser desorption/ionization mass spectrometry."
Electrophoresis no. 17 (5):945-53. doi: 10.1002/elps.1150170517.
Shiio, Y., S. Donohoe, E. C. Yi, D. R. Goodlett, R. Aebersold, and R. N. Eisenman. 2002.
"Quantitative proteomic analysis of Myc oncoprotein function." EMBO J no. 21
(19):5088-96.
Stewart, I., T. Thomson, and D. Figeys. 2001. "18O labeling: a tool for proteomics." Rapid
Commun Mass Spectrom no. 15 (24):2456-65.
Tackett, A. J., J. A. DeGrasse, M. D. Sekedat, M. Oeffinger, M. P. Rout, and B. T. Chait. 2005.
"I-DIRT, a general method for distinguishing between specific and nonspecific
protein interactions." J Proteome Res no. 4 (5):1752-6. doi: 10.1021/pr050225e.
Takao, T., H. Hori, K. Okamoto, A. Harada, M. Kamachi, and Y. Shimonishi. 1991. "Facile
assignment of sequence ions of a peptide labelled with 18O at the carboxyl
terminus." Rapid Commun Mass Spectrom no. 5 (7):312-5. doi:
10.1002/rcm.1290050703.
Tang, H., R. J. Arnold, P. Alves, Z. Xun, D. E. Clemmer, M. V. Novotny, J. P. Reilly, and P.
Radivojac. 2006. "A computational approach toward label-free protein
www.intechopen.com

Strategies and Challenges in Measuring Protein Abundance Using Stable Isotope Labeling and Tandem Mass Spectrometry
257
quantification using predicted peptide detectability." Bioinformatics no. 22 (14):e481-
8.
Thompson, A., J. Schafer, K. Kuhn, S. Kienle, J. Schwarz, G. Schmidt, T. Neumann, R.
Johnstone, A. K. Mohammed, and C. Hamon. 2003. "Tandem mass tags: a novel
quantification strategy for comparative analysis of complex protein mixtures by
MS/MS." Anal Chem no. 75 (8):1895-904.
Volchenboum, S. L., K. Kristjansdottir, D. Wolfgeher, and S. J. Kron. 2009. "Rapid validation
of Mascot search results via stable isotope labeling, pair picking, and deconvolution
of fragmentation patterns." Mol Cell Proteomics no. 8 (8):2011-22. doi: M800472-
MCP200 [pii] 10.1074/mcp.M800472-MCP200.
Wang, G., W. W. Wu, T. Pisitkun, J. D. Hoffert, M. A. Knepper, and R. F. Shen. 2006.
"Automated quantification tool for high-throughput proteomics using stable
isotope labeling and LC-MSn." Anal Chem no. 78 (16):5752-61. doi:
10.1021/ac060611v.
Wang, G., W. W. Wu, W. Zeng, C. L. Chou, and R. F. Shen. 2006. "Label-free protein
quantification using LC-coupled ion trap or FT mass spectrometry: Reproducibility,
linearity, and application with complex proteomes." J Proteome Res no. 5 (5):1214-23.
Wang, H., C. H. Wong, A. Chin, J. Kennedy, Q. Zhang, and S. Hanash. 2009. "Quantitative
serum proteomics using dual stable isotope coding and nano LC-MS/MSMS." J
Proteome Res no. 8 (12):5412-22. doi: 10.1021/pr900158n.
Warren, C. M., D. L. Geenen, D. L. Helseth, Jr., H. Xu, and R. J. Solaro. 2010. "Sub-proteomic
fractionation, iTRAQ, and OFFGEL-LC-MS/MS approaches to cardiac proteomics."
J Proteomics no. 73 (8):1551-61. doi: S1874-3919(10)00109-0 [pii]
10.1016/j.jprot.2010.03.016.
Wenger, C. D., D. H. Phanstiel, M. V. Lee, D. J. Bailey, and J. J. Coon. 2011. "COMPASS: a
suite of pre- and post-search proteomics software tools for OMSSA." Proteomics no.
11 (6):1064-74. doi: 10.1002/pmic.201000616.
Wiener, M. C., J. R. Sachs, E. G. Deyanova, and N. A. Yates. 2004. "Differential mass
spectrometry: a label-free LC-MS method for finding significant differences in
complex peptide and protein mixtures." Anal Chem no. 76 (20):6085-96.
Wu, C. C., M. J. MacCoss, K. E. Howell, D. E. Matthews, and J. R. Yates, 3rd. 2004.
"Metabolic labeling of mammalian organisms with stable isotopes for quantitative
proteomic analysis." Anal Chem no. 76 (17):4951-9. doi: 10.1021/ac049208j.
Yan, W., D. Hwang, and R. Aebersold. 2008. "Quantitative proteomic analysis to profile
dynamic changes in the spatial distribution of cellular proteins." Methods Mol Biol
no. 432:389-401. doi: 10.1007/978-1-59745-028-7_26.
Yan, W., H. Lee, E. C. Yi, D. Reiss, P. Shannon, B. K. Kwieciszewski, C. Coito, X. J. Li, A.
Keller, J. K. Eng, T. Galitski, D. R. Goodlett, R. Aebersold, and M. G. Katze. 2004.
"System-based proteomic analysis of the interferon response in human liver cells."
Genome Biol no. 5 (8):R54.
Yao, X., A. Freas, J. Ramirez, P. A. Demirev, and C. Fenselau. 2001. "Proteolytic 18O labeling
for comparative proteomics: model studies with two serotypes of adenovirus." Anal
Chem no. 73 (13):2836-42.
www.intechopen.com

Tandem Mass Spectrometry – Applications and Principles
258
Zhang, R., and F. E. Regnier. 2002. "Minimizing resolution of isotopically coded peptides in
comparative proteomics." J Proteome Res no. 1 (2):139-47.
Zhang, R., C. S. Sioma, R. A. Thompson, L. Xiong, and F. E. Regnier. 2002. "Controlling
deuterium isotope effects in comparative proteomics." Anal Chem no. 74 (15):3662-9.
Zhang, R., C. S. Sioma, S. Wang, and F. E. Regnier. 2001. "Fractionation of isotopically
labeled peptides in quantitative proteomics." Anal Chem no. 73 (21):5142-9.
Zhang, Y., A. Wolf-Yadlin, P. L. Ross, D. J. Pappin, J. Rush, D. A. Lauffenburger, and F. M.
White. 2005. "Time-resolved mass spectrometry of tyrosine phosphorylation sites in
the epidermal growth factor receptor signaling network reveals dynamic modules."
Mol Cell Proteomics no. 4 (9):1240-50. doi: M500089-MCP200 [pii]
10.1074/mcp.M500089-MCP200.
Zhou, H., J. A. Ranish, J. D. Watts, and R. Aebersold. 2002. "Quantitative proteome analysis
by solid-phase isotope tagging and mass spectrometry." Nat Biotechnol no. 20
(5):512-5. doi: 10.1038/nbt0502-512 [pii].
www.intechopen.com

Tandem Mass Spectrometry - Applications and PrinciplesEdited by Dr Jeevan Prasain
ISBN 978-953-51-0141-3Hard cover, 794 pagesPublisher InTechPublished online 29, February, 2012Published in print edition February, 2012
InTech EuropeUniversity Campus STeP Ri Slavka Krautzeka 83/A 51000 Rijeka, Croatia Phone: +385 (51) 770 447 Fax: +385 (51) 686 166www.intechopen.com
InTech ChinaUnit 405, Office Block, Hotel Equatorial Shanghai No.65, Yan An Road (West), Shanghai, 200040, China
Phone: +86-21-62489820 Fax: +86-21-62489821
Tandem Mass Spectrometry - Applications and Principles presents comprehensive coverage of theory,instrumentation and major applications of tandem mass spectrometry. The areas covered range from theanalysis of drug metabolites, proteins and complex lipids to clinical diagnosis. This book serves multiple groupsof audiences; professional (academic and industry), graduate students and general readers interested in theuse of modern mass spectrometry in solving critical questions of chemical and biological sciences.
How to referenceIn order to correctly reference this scholarly work, feel free to copy and paste the following:
Kolbrun Kristjansdottir, Satoe Takahashi, Samuel L. Volchenboum and Stephen J. Kron (2012). Strategies andChallenges in Measuring Protein Abundance Using Stable Isotope Labeling and Tandem Mass Spectrometry,Tandem Mass Spectrometry - Applications and Principles, Dr Jeevan Prasain (Ed.), ISBN: 978-953-51-0141-3,InTech, Available from: http://www.intechopen.com/books/tandem-mass-spectrometry-applications-and-principles/strategies-and-challenges-in-measuring-protein-abundance-using-stable-isotope-labeling-and-tandem-ma

© 2012 The Author(s). Licensee IntechOpen. This is an open access articledistributed under the terms of the Creative Commons Attribution 3.0License, which permits unrestricted use, distribution, and reproduction inany medium, provided the original work is properly cited.