isotope-abundance variations of selected …ciaaw.org/pubs/snif.pdf · isotope-abundance variations...
TRANSCRIPT
Pure Appl. Chem., Vol. 74, No. 10, pp. 1987–2017, 2002.© 2002 IUPAC
1987
INTERNATIONAL UNION OF PURE AND APPLIED CHEMISTRY
INORGANIC CHEMISTRY DIVISIONCOMMISSION ON ATOMIC WEIGHTS AND ISOTOPIC ABUNDANCES*
SUBCOMMITTEE ON NATURAL ISOTOPIC FRACTIONATION**
ISOTOPE-ABUNDANCE VARIATIONS OF SELECTEDELEMENTS†
(IUPAC Technical Report)
Prepared for publication byT. B. COPLEN1,‡, J. K. BÖHLKE1, P. De BIÈVRE2, T. DING3, N. E. HOLDEN4, J. A. HOPPLE1,
H. R. KROUSE5, A. LAMBERTY2, H. S. PEISER1, K. RÉVÉSZ1, S. E. RIEDER1, K. J. R. ROSMAN6, E. ROTH7, P. D. P. TAYLOR2, R. D. VOCKE, JR.8, AND Y. K. XIAO9
1U.S. Geological Survey, 431 National Center, Reston, VA 20192, USA; 2Institute for ReferenceMaterials and Measurements, Commission of the European Communities Joint Research Centre, B-2440 Geel, Belgium; 3Institute of Mineral Deposits, Chinese Academy of Geological Sciences,
Beijing, 100037, China; 4Brookhaven National Laboratory, Upton, NY 11973, USA; 5The Universityof Calgary, Calgary, Alberta T2N 1N4, Canada; 6Curtin University of Technology, Perth, Western
Australia, 6001, Australia; 7103 Rue Brancas, 92310 Sèvres, France; 8National Institute of Standardsand Technology, Gaithersburg, MD 20899, USA; 9Qinghai Institute of Salt Lakes, Chinese Academy
of Sciences, Xining, Qinghai, 810008, China
*Membership of the Commission for the period 2000–2001 was as follows:Chairman: L. Schultz (Germany); Secretary: R. D. Loss (Australia); Titular Members: J. K. Böhlke (USA); T.Ding (China); M. Ebihara (Japan); G. I. Ramendik (Russia); P. D. P. Taylor (Belgium); Associate Members: M.Berglund (Belgium); C. A. M. Brenninkmeijer (Germany); H. Hidaka (Japan); D. J. Rokop (USA); T. Walczyk(Switzerland); S. Yoneda (Japan); National Representatives: J. R. de Laeter (Australia); P. De Bièvre (Belgium);C. L. do Lago (Brazil); Y. K. Xiao (China/Beijing).
**Membership of the Subcommittee on Natural Isotopic Fractionation for 1985–2001 was as follows:Chairman 2000–2001: T. B. Coplen (USA); Members: J. K. Böhlke (USA); C. A. M. Brenninkmeijer (Germany);P. De Bièvre (Belgium); T. Ding (China); K. G. Heumann (Germany); N. E. Holden (USA); H. R. Krouse (Canada);A. Lamberty (Belgium); H. S. Peiser (USA); G. I. Ramendik (Russia); E. Roth (France); M. Stiévenard (France);L. Turpin (France); R. D. Vocke, Jr. (USA).
†For use in the classroom, Microsoft PowerPoint® files of all figures are available at <http://isotopes.usgs.gov/publications.htm>.‡Corresponding author: E-mail: [email protected]
Republication or reproduction of this report or its storage and/or dissemination by electronic means is permitted without theneed for formal IUPAC permission on condition that an acknowledgment, with full reference to the source, along with use of thecopyright symbol ©, the name IUPAC, and the year of publication, are prominently visible. Publication of a translation intoanother language is subject to the additional condition of prior approval from the relevant IUPAC National AdheringOrganization.
Isotope-abundance variations of selectedelements
(IUPAC Technical Report)
Abstract: Documented variations in the isotopic compositions of some chemicalelements are responsible for expanded uncertainties in the standard atomic weightspublished by the Commission on Atomic Weights and Isotopic Abundances of theInternational Union of Pure and Applied Chemistry. This report summarizesreported variations in the isotopic compositions of 20 elements that are due tophysical and chemical fractionation processes (not due to radioactive decay) andtheir effects on the standard atomic-weight uncertainties. For 11 of those elements(hydrogen, lithium, boron, carbon, nitrogen, oxygen, silicon, sulfur, chlorine, cop-per, and selenium), standard atomic-weight uncertainties have been assigned val-ues that are substantially larger than analytical uncertainties because of commonisotope-abundance variations in materials of natural terrestrial origin. For 2 ele-ments (chromium and thallium), recently reported isotope-abundance variationspotentially are large enough to result in future expansion of their atomic-weightuncertainties. For 7 elements (magnesium, calcium, iron, zinc, molybdenum, pal-ladium, and tellurium), documented isotope variations in materials of natural ter-restrial origin are too small to have a significant effect on their standard atomic-weight uncertainties.
This compilation indicates the extent to which the atomic weight of an ele-ment in a given material may differ from the standard atomic weight of the ele-ment. For most elements given above, data are graphically illustrated by a diagramin which the materials are specified in the ordinate and the compositional rangesare plotted along the abscissa in scales of (1) atomic weight, (2) mole fraction ofa selected isotope, and (3) delta value of a selected isotope ratio.
INTRODUCTION
The standard atomic weights and their uncertainties tabulated by the International Union of Pure andApplied Chemistry (IUPAC) are intended to represent most normal materials encountered in terrestrialsamples and laboratory chemicals. During the meeting of the Commission on Atomic Weights andIsotopic Abundances (CAWIA) at the General Assembly of IUPAC in 1985, the Working Party onNatural Isotopic Fractionation (now named the Subcommittee on Natural Isotopic Fractionation) wasformed to investigate the effects of isotope-abundance variations of elements upon their standard atomicweights and atomic-weight uncertainties. The aims of the Subcommittee on Natural IsotopicFractionation were (1) to identify elements for which the uncertainties of the standard atomic weightsare larger than measurement uncertainties in materials of natural terrestrial origin because of isotope-abundance variations caused by fractionation processes (excluding variations caused by radioactivity),(2) to provide information about the range of atomic-weight variations in specific substances and chem-ical compounds of each of these elements, and (3) to examine critically the definitions and consistencyof use of the footnotes in the Table of Standard Atomic Weights [1] and annotations in the Table ofIsotopic Compositions of the Elements [2]. The purpose of this report is to compile ranges of isotope-abundance variations and corresponding atomic weights in selected materials containing 20 chemicalelements (H, Li, B, C, N, O, Mg, Si, S, Cl, Ca, Cr, Fe, Cu, Zn, Se, Mo, Pd, Te, and Tl) from publisheddata. The information in this report complements the bi-decadal Commission reviews of the atomic
T. B. COPLEN et al.
© 2002 IUPAC, Pure and Applied Chemistry 74, 1987–2017
1988
weights of the elements [3,4] and the “Isotopic Compositions of the Elements 1997” [2]. Because of itsfocus on extreme values, this report should not be viewed as a comprehensive compilation of stable iso-tope-abundance variations in the literature; rather, it is intended to illustrate ranges of variation that maybe encountered in natural and anthropogenic material.
The atomic weight of an element in a specimen can be determined from knowledge of the atomicmasses of the isotopes of that element and the isotope abundances of that element in the specimen. Theabundance of isotope i of element E in the specimen can be expressed as a mole fraction, x(iE). Forexample, the mole fraction of 34S is x(34S), which is n(34S)/[n(32S) + n(33S) + n(34S) + n(36S)] or moresimply n(34S)/∑n(iS) or n(34S)/n(S), where n(iE) is the amount of each isotope i of element E in unitsof moles. Thus, if element E is composed of isotopes iE, with mole fractions x(iE), the atomic weight,Ar(E), is the sum of the products of the atomic masses and mole fractions of the isotopes; that is,Ar(E) = ∑x(iE)·Ar(
iE). The atomic masses from the 1993 evaluation [5] have been used by CAWIA andare listed in this report. Isotope-abundance values that are free from all known sources of bias withinstated uncertainties are referred to as “absolute” isotope abundances, and they can be determined bymass spectrometry through use of synthetic mixtures of isotopes. For many elements, the abundancesof the isotopes are not invariant; thus, these elements have a range in atomic weight. This reportincludes data for 20 such elements in natural occurrences and in laboratory reagents.
Molecules, atoms, and ions in their natural occurrences contain isotopes in varying proportions,whereby they possess slightly different physical and chemical properties. This gives rise to partitioningof isotopes (isotope fractionation) during physical or chemical processes, and these fractionationscommonly are proportional to differences in the relevant isotope masses. Physical isotope-fractionationprocesses include those in which diffusion rates are mass-dependent, such as ultrafiltration or gaseousdiffusion of ions or molecules. Chemical isotope-fractionation processes involve redistribution of iso-topes of an element among phases, molecules, or chemical species. They either can be (1) equilibriumisotope fractionations, when forward and backward reaction rates for individual isotope-exchange reac-tions are equal, or (2) kinetic isotope fractionations caused by unidirectional reactions in which the for-ward reaction rates usually are mass-dependent. In equilibrium isotope reactions, in general, the heavyisotope will be enriched in the compound with the higher oxidation state, and commonly in the morecondensed state. Thus, for example, 13C is enriched in carbon dioxide relative to graphite, and ingraphite relative to methane, and 2H is enriched in liquid water relative to water vapor. In kineticprocesses, statistical mechanics predicts that the lighter (lower atomic mass) of two isotopes of an ele-ment will form the weaker and more easily broken bond. The lighter isotope is more reactive; therefore,it is concentrated in reaction products, enriching reactants in the heavier isotope. Examples of reactionsthat produce kinetic isotope fractionation include many biological reactions, treatment of limestonewith acid to liberate carbon dioxide, and the rapid freezing of water to ice. Sulfate reduction by bacte-ria in respiration is an example of a biologically mediated kinetic isotope-fractionation process. Kineticisotope fractionations of biological processes are variable in magnitude and may be in the directionopposite to that of equilibrium isotope fractionations for the same chemical species.
Isotopic equilibrium between two phases does not mean that the two phases have identical molefractions of each isotope (isotope abundances), only that the ratios of these mole fractions are constant.Water vapor in a closed container in contact with liquid water at a constant temperature is an exampleof a system with two phases in H and O isotopic equilibrium; in this case, the concentrations of theheavy isotopes (2H and 18O) are higher in the liquid than in the vapor.
The distribution of isotopes in two substances X and Y is described by the isotope-fractionationfactor αX,Y, defined by
(1)
© 2002 IUPAC, Pure and Applied Chemistry 74, 1987–2017
Isotope-abundance variations 1989
αX,YX X
Y Y
E E
E E=
n n
n n
i j
i j
( ) ( )( ) ( )
where nX(iE) and nX(jE) are the amounts of two isotopes, i and j, of chemical element E in substanceX, in units of moles. We equally well could have used NX(iE) and NX(jE), which are the number ofatoms of two isotopes, i and j, of chemical element E in substance X. In this document, the superscriptsi and j denote a heavier (higher atomic mass) and a lighter (lower atomic mass) isotope, respectively.The isotope pairs used to define n(iE)/n(jE) in this report are 2H/1H, 7Li/6Li, 11B/10B, 13C/12C, 15N/14N,18O/16O, 26Mg/24Mg, 30Si/28Si, 34S/32S, 37Cl/35Cl, 44Ca/40Ca, 53Cr/52Cr, 56Fe/54Fe, 65Cu/63Cu,66Zn/64Zn, 82Se/76Se, 98Mo/95Mo, 110Pd/104Pd, 130Te/122Te, or 205Tl/203Tl. In general, isotope-frac-tionation factors are near unity. For example, the value of the equilibrium n(18O)/n(16O) fractionationfactor α between water liquid and water vapor at 15 °C is 1.0102. Thus, 18O is enriched in liquid waterat 15 °C by 1.02 % relative to its concentration in water vapor.
Variations in stable isotope-abundance ratios typically are small. Stable isotope ratios commonlyare expressed as relative isotope ratios in δ(iE) notation (pronounced delta) according to the relation
(2)
where δ(iE) refers to the delta value of isotope number i of element E of sample X relative to the ref-erence ref, and nX(iE)/nX(jE) and nref(
iE)/nref(jE) are the ratios of the isotope amounts in unknown X
and a reference ref. A positive δ(iE) value indicates that the unknown is more enriched in the heavy iso-tope than is the reference. A negative δ(iE) value indicates that the unknown is depleted in the heavyisotope relative to the reference. In the literature, δ(iE) is commonly shortened to δ iE. In the literature,δ(iE) values of isotope ratios have been reported in parts per hundred (% or per cent), parts per thou-sand (‰ or per mill), and parts per ten thousand. In this report, δ (iE) values are given in per mill;thus, the expression can be written
(3)
because a per mill is 1/1000, and 1000·1/1000 = 1. Note that per mill also is spelled per mil, permil, andper mille in the literature. The International Organization for Standardization [6] spelling is used in thisreport.
A single isotopic reference material defines the isotope-ratio scale of most of the elements listedin this report; however, it has been recognized that a single isotopic reference material can define onlythe anchor point of an isotope-ratio scale and not the magnitude (expansion or contraction) of the scale.Two reference materials are required to calibrate both scale magnitude and anchor point, as is done forthe scales of H and O. Most isotopic reference materials are naturally occurring materials or are man-ufactured from materials of natural terrestrial origin; others have been produced from reagents whoseisotopes have been artificially fractionated.
For each element E in this report, the standard atomic weight, Ar(E), from “Atomic Weights of theElements 1999” [1] is listed with its estimated uncertainty (in parentheses, following the last significantfigure to which it is attributed). For zinc and molybdenum, the new standard atomic weights adopted atthe 41st IUPAC General Assembly in Brisbane in July 2001, based, respectively, on the work of Changet al. [7] and Wieser and de Laeter [8], are listed instead.
For most elements, data are graphically illustrated by a diagram in which the materials are spec-ified in the ordinate and the compositional ranges are plotted along the abscissa on three scales: atomicweight, Ar(E), mole fraction of a selected isotope, x(iE), and relative isotope ratio expressed as devia-tion from the isotope ratio reference, δ(iE). Mole fractions of the selected isotope are calculated fromthe relative isotope ratio by using the “absolute” isotope-abundance measurements of the reference for
T. B. COPLEN et al.
© 2002 IUPAC, Pure and Applied Chemistry 74, 1987–2017
1990
δ ii j
i j
n n
n n E
E E
E E
X X
ref ref( ) =
( ) ( )( ) ( )
– 1
δ ii j
i j=
n n
n n E
E E
E E‰
X X
ref ref( ) ( ) ( )
( ) ( )
⋅– 1 1000
the delta scale. Atomic-weight values are calculated from atomic masses and mole fractions of the iso-topes, assuming mass-dependent fractionation among the isotopes. The three scales are related exactlyfor elements with two isotopes for which “absolute” isotopic compositions of the references are known.However, the scales may be mismatched in some cases: (1) for some elements, the “absolute” isotopiccomposition of the reference may not be known to within the precision of the common relative isotope-ratio measurements; (2) calculations of atomic weights for polyisotopic elements are subject to addi-tional, usually negligible, adjustments based either on additional isotope-abundance measurements oron an assumption about the mass-dependent isotope fractionation of isotopes that commonly are notmeasured. The section for each element tabulates the isotopic composition of a real or hypotheticalmaterial with delta value of 0 ‰; commonly, this material has been used for the best “absolute” iso-tope measurement as reported by Rosman and Taylor [2]. For many elements, the atomic weightderived from the best measurement is significantly different from the standard atomic weight. This dif-ference results because (1) the standard atomic-weight uncertainty is limited to a single digit and thetwo cannot match exactly, or (2) Ar(E) was assigned to be in the center of a range of natural isotopicvariation—this is the case for H, Li, B, C, N, O, Si, and S—and may be greatly different from that ofthe best measurement material.
With the proliferation of microprobe techniques for isotope measurements, large variations in iso-topic composition have been found in source materials over distances of the order of 1 to 1000 µm [9].Such data are excluded from this compilation, as are data from extraterrestrial materials and from ele-ments exhibiting isotope variation caused by radioactivity.
Although the data presented in this report may allow reduction in the uncertainty in atomic weightof a material, the reader is warned that when critical work is undertaken, such as assessment of indi-vidual properties, samples with accurately known isotope abundances should be obtained or suitablemeasurements made.
VARIATIONS IN ISOTOPIC COMPOSITION OF SELECTED ELEMENTS
Hydrogen 1H Ar(H) = 1.007 94(7)
Isotope Atomic mass Mole fraction in VSMOW [2,10]
1H 1.007 825 0319(6) u 0.999 844 26(5)2H 2.014 101 7779(6) u 0.000 155 74(5)
Since 1993, the Commission has recommended [11] that stable H relative isotope ratios be reported rel-ative to the International Atomic Energy Agency (IAEA) reference water VSMOW [also distributed bythe National Institute of Standards and Technology (NIST) as RM 8535], which is assigned a δ(2H)value of 0 ‰ on a scale normalized by assigning a value of –428 ‰ to IAEA reference water SLAP(NIST RM 8537). One water (GISP), 1 oil (NBS 22), 1 biotite (NBS 30), 1 polyethylene foil (PEF1,renamed IAEA-CH-7), and 3 natural gases (NGS1, NGS2, and NGS3) are secondary reference materi-als distributed by IAEA and/or NIST (Fig. 1) [12]. In addition, IAEA distributes two reference watersenriched in 2H for medical and biological tracer studies [13]. Compilations of H isotope-ratio variationsand isotope-fractionation factors have been published [14–18]. Sometimes δ(2H) is designated δD inthe literature.
Variations in the δ(2H) values of surface waters, ground waters, and glacial ice generally are con-cordant with variations in δ(18O) values and are caused primarily by evaporation and condensationprocesses. In meteoric waters (waters that originate as precipitation), δ(2H) values range from –495 ‰in Antarctic ice [19] to +129 ‰ in evaporated lakes in equatorial regions [20]. An unusual occurrenceof water from a well in the Lacq natural gas field in France yielded δ (2H) values as high as +375 ‰[21]; a small amount of the water equilibrated at near-ambient temperature with a much larger amountof H2S with a δ(2H) value of –430 ‰. Agricultural food products contain meteoric waters with a range
© 2002 IUPAC, Pure and Applied Chemistry 74, 1987–2017
Isotope-abundance variations 1991

of δ (2H) values, which may be reflected in tissues and fluids of birds and other animals consumingthis food. The H isotope fractionation between plants and water in the local environment water isdependent upon evapotranspiration and species-specific variations during metabolic or biochemicalprocesses. For example, citrus trees found in subtropical climates may undergo extensive evapora-tion, resulting in 2H enrichment in cellular water—thus, 2H of orange juice, for example, may beenriched by as much as 40 ‰ relative to local meteoric water [22]. Commercial compressed tank H2produced by electrolysis is variable in isotopic composition, but commonly it is only slightly depletedin 2H relative to source water [e.g., δ(2H) = –56 ‰] [25]. H2 produced as a by-product in petrochemi-cal plants is depleted in 2H, and its δ(2H) value is as low as –813 ‰ [25].
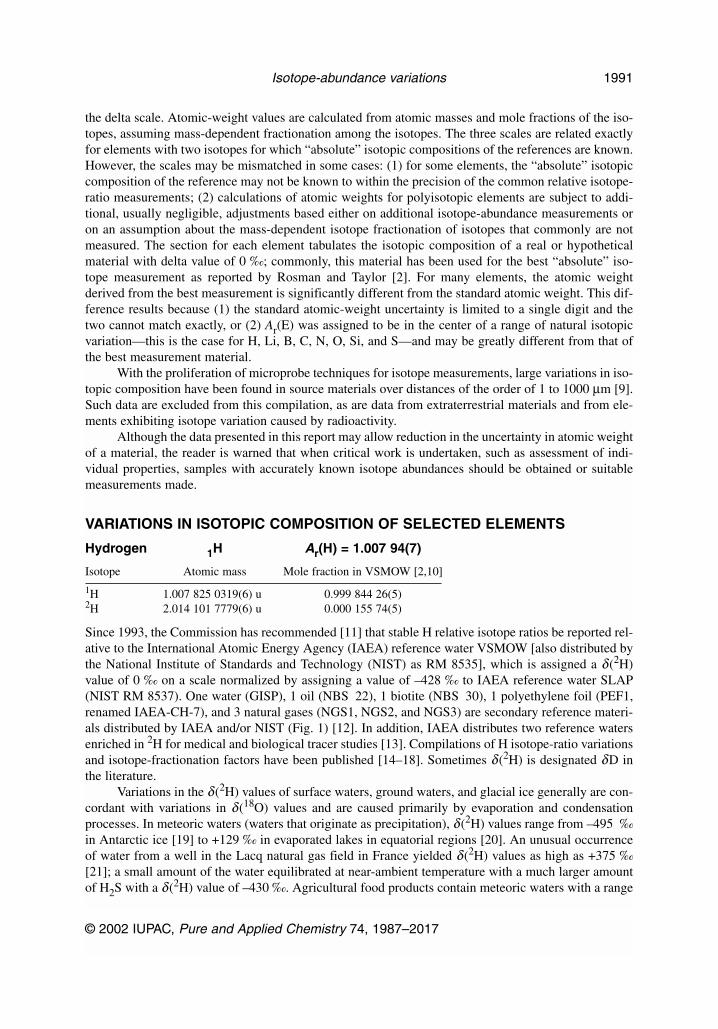
The lowest δ (2H) value found for a material of natural terrestrial origin reported in the literatureis –836 ‰ (Fig. 1), for gaseous H2 in natural gas from a Kansas (USA) well [23]. For this sample,Ar(H) = 1.007 851 and the mole fraction of 2H is 0.000 0255. The highest δ (2H) value reported for amaterial of natural terrestrial origin is +180 ‰ for atmospheric H2 [24]. For this sample, Ar(H) = 1.008010 and the mole fraction of 2H is 0.000 1838.
T. B. COPLEN et al.
© 2002 IUPAC, Pure and Applied Chemistry 74, 1987–2017
1992
Fig. 1 Hydrogen isotopic composition and atomic weight of selected hydrogen-bearing materials [25]. The δ(2H)scale and 2H mole-fraction scale were matched using the data of Hagemann et al. [10]; therefore, the uncertaintyin placement of the atomic-weight scale and the 2H mole-fraction scale relative to the δ(2H) scale is equivalent to±0.3 ‰.
Lithium 3Li Ar(Li) = 6.941(2)
Isotope Atomic mass Mole fraction in L-SVEC Li2CO3 [2,26]
6Li 6.015 1223(5) u 0.075 91(20)7Li 7.016 0041(5) u 0.924 09(20)
The basis for relative abundance measurements of Li isotopes is IAEA isotopic reference materialL-SVEC (NIST RM 8545) Li2CO3 with an assigned δ(7Li) value of 0 ‰. In accordance with the rec-ommendation of IUPAC [27], δ(7Li) values are reported herein, though δ(6Li) values commonly arefound in the literature. Two additional Li2CO3 reference materials are available from the Institute ofReference Materials and Measurements (IRMM) in Geel, Belgium. IRMM–015 is highly depleted in7Li, and IRMM–016 is essentially identical in isotopic composition to L-SVEC [26].
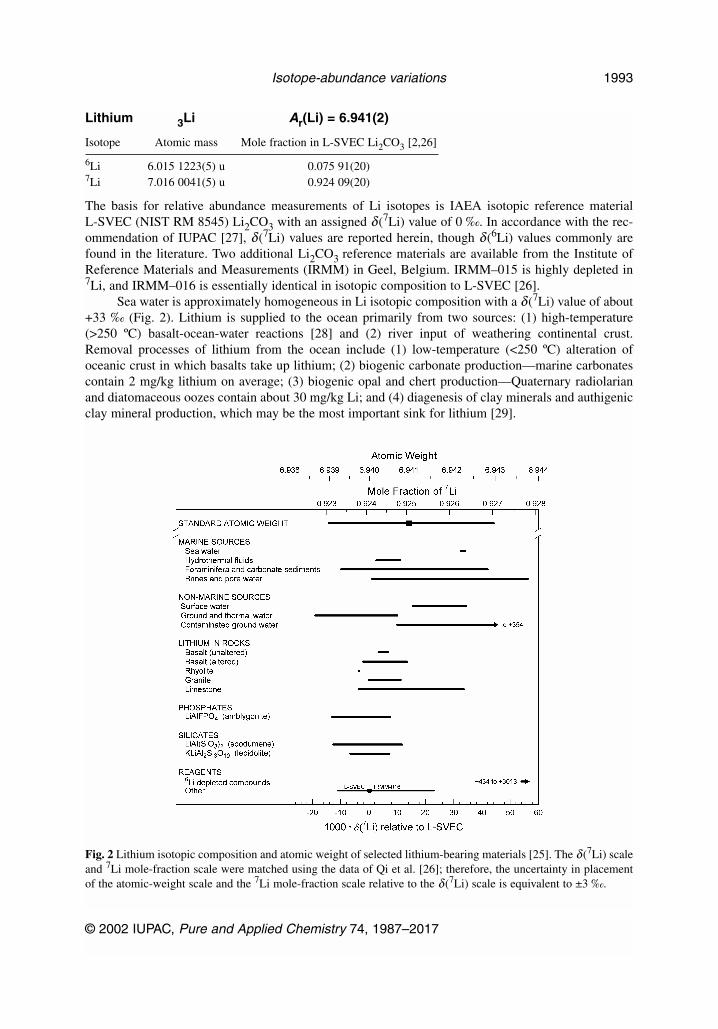
Sea water is approximately homogeneous in Li isotopic composition with a δ(7Li) value of about+33 ‰ (Fig. 2). Lithium is supplied to the ocean primarily from two sources: (1) high-temperature(>250 ºC) basalt-ocean-water reactions [28] and (2) river input of weathering continental crust.Removal processes of lithium from the ocean include (1) low-temperature (<250 ºC) alteration ofoceanic crust in which basalts take up lithium; (2) biogenic carbonate production—marine carbonatescontain 2 mg/kg lithium on average; (3) biogenic opal and chert production—Quaternary radiolarianand diatomaceous oozes contain about 30 mg/kg Li; and (4) diagenesis of clay minerals and authigenicclay mineral production, which may be the most important sink for lithium [29].
© 2002 IUPAC, Pure and Applied Chemistry 74, 1987–2017
Isotope-abundance variations 1993
Fig. 2 Lithium isotopic composition and atomic weight of selected lithium-bearing materials [25]. The δ(7Li) scaleand 7Li mole-fraction scale were matched using the data of Qi et al. [26]; therefore, the uncertainty in placementof the atomic-weight scale and the 7Li mole-fraction scale relative to the δ(7Li) scale is equivalent to ±3 ‰.
Of the chemical elements discussed in this report, Li is particularly unusual because largeamounts of Li have been isotopically fractionated by removal of 6Li for use in hydrogen bombs. Theremaining Li is substantially enriched in 7Li, and some of this material has found its way into labora-tory reagents and into the environment. An analysis of 39 laboratory reagents [30] showed a range inδ(7Li) of –11 to +3013 ‰. For the most enriched in 7Li, Ar(Li) = 6.9959 and the mole fraction of 7Liis 0.9799. Values of δ(7Li) as high as +354 ‰ have been measured in ground water from a carbonateaquifer underlying West Valley Creek in Pennsylvania (USA), down-gradient from a Li processing plant[25].
The lowest 7Li content reported in a material of natural terrestrial origin is Li dissolved inground water from a coastal aquifer in South Carolina (USA) with δ (7Li) = –19 ‰ [25]. For this sam-ple, Ar(Li) = 6.9387 and the mole fraction of 7Li is 0.9227. The highest 7Li abundance reported in amaterial of natural terrestrial origin [δ(7Li) = +56.3 ‰] is found in pore water from a marine core [31].For this sample, Ar(Li) = 6.9438 and the mole fraction of 7Li is 0.9278.
Boron 5B Ar(B) = 10.811(7)
Isotope Atomic mass Mole fraction in NIST SRM 951 boric acid [2,32]
10B 10.012 9371(3) u 0.198 27(13)11B 11.009 3055(4) u 0.801 73(13)
The basis for the relative abundance measurement of B isotopes is NIST SRM 951 boric acid, which isassigned a δ(11B) value of 0 ‰. A second reference material, IRMM–011 boric acid, is identical(within measurement error) in isotopic composition to SRM 951. Two boric acid reference materials(IRMM–610 and SRM 952) depleted in 11B are available [33,34]. Three waters and five rocks are sec-ondary reference materials to be distributed by IAEA (B-1 through B-8 in Fig. 3) [35].
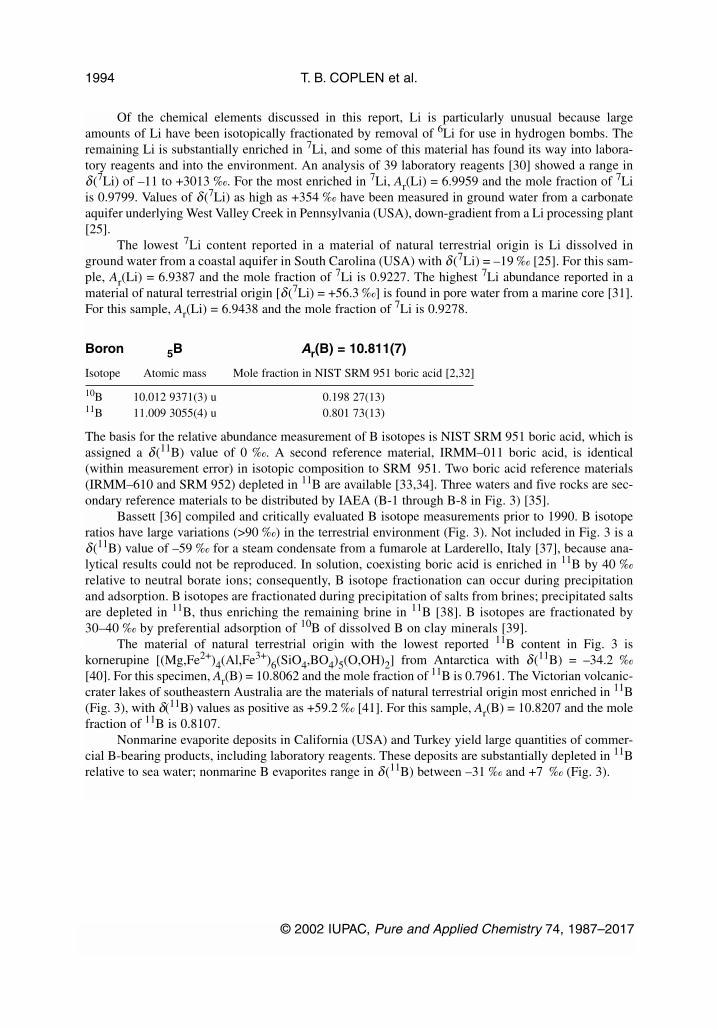
Bassett [36] compiled and critically evaluated B isotope measurements prior to 1990. B isotoperatios have large variations (>90 ‰) in the terrestrial environment (Fig. 3). Not included in Fig. 3 is aδ(11B) value of –59 ‰ for a steam condensate from a fumarole at Larderello, Italy [37], because ana-lytical results could not be reproduced. In solution, coexisting boric acid is enriched in 11B by 40 ‰relative to neutral borate ions; consequently, B isotope fractionation can occur during precipitationand adsorption. B isotopes are fractionated during precipitation of salts from brines; precipitated saltsare depleted in 11B, thus enriching the remaining brine in 11B [38]. B isotopes are fractionated by30–40 ‰ by preferential adsorption of 10B of dissolved B on clay minerals [39].
The material of natural terrestrial origin with the lowest reported 11B content in Fig. 3 iskornerupine [(Mg,Fe2+)4(Al,Fe3+)6(SiO4,BO4)5(O,OH)2] from Antarctica with δ(11B) = –34.2 ‰[40]. For this specimen, Ar(B) = 10.8062 and the mole fraction of 11B is 0.7961. The Victorian volcanic-crater lakes of southeastern Australia are the materials of natural terrestrial origin most enriched in 11B(Fig. 3), with δ(11B) values as positive as +59.2 ‰ [41]. For this sample, Ar(B) = 10.8207 and the molefraction of 11B is 0.8107.
Nonmarine evaporite deposits in California (USA) and Turkey yield large quantities of commer-cial B-bearing products, including laboratory reagents. These deposits are substantially depleted in 11Brelative to sea water; nonmarine B evaporites range in δ(11B) between –31 ‰ and +7 ‰ (Fig. 3).
T. B. COPLEN et al.
© 2002 IUPAC, Pure and Applied Chemistry 74, 1987–2017
1994
Carbon 6C Ar(C) = 12.0107(8)
Isotope Atomic mass Mole fraction in VPDB [2,42]
12C 12 u (exactly) 0.988 944(28)13C 13.003 354 838(5) u 0.011 056(28)
Beginning in the 1950s, isotope-abundance measurements of C isotopes were expressed relative toPeedee belemnite (PDB), which was assigned a δ(13C) value of 0 ‰. Because the supply of PDB isexhausted, IUPAC recommended in 1993 [11,43] that δ(13C) values be reported relative to VPDB(Vienna PDB) by assigning a δ(13C) value of +1.95 ‰ on the VPDB scale to IAEA reference materialNBS 19 CaCO3. Various carbonates, several CO2 gases, 3 natural gases, 1 sugar, and 1 oil are second-ary reference materials distributed by IAEA and/or NIST (see Fig. 4) [12,25]. Reference materials in asubset of these are variably enriched in 13C and intended for use mainly in medical and biological tracerstudies [13].
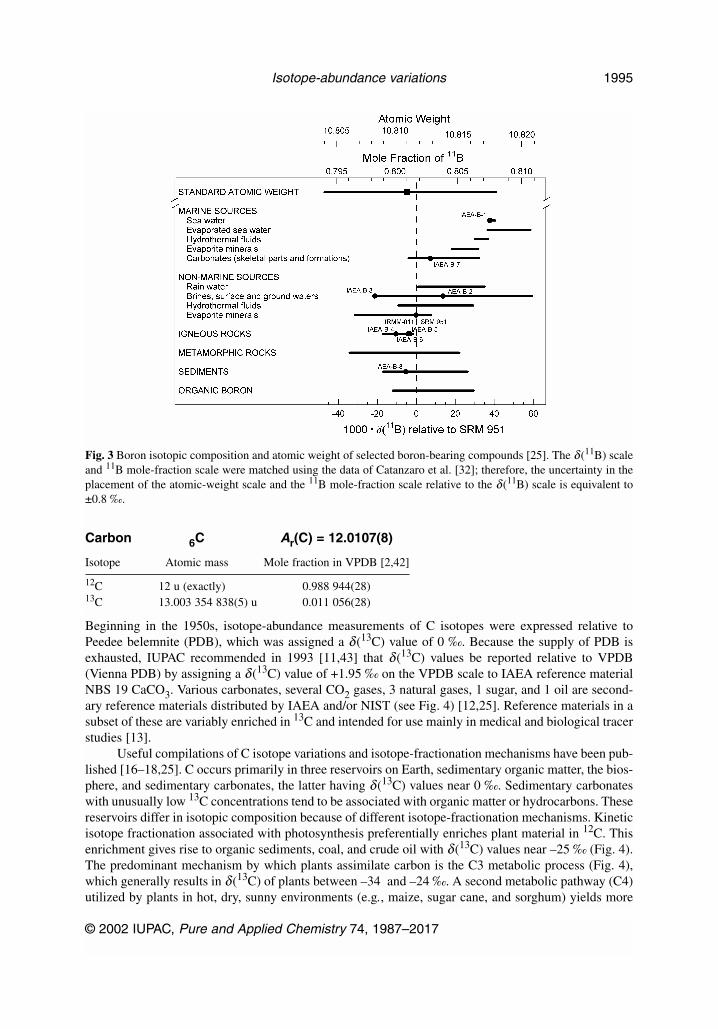
Useful compilations of C isotope variations and isotope-fractionation mechanisms have been pub-lished [16–18,25]. C occurs primarily in three reservoirs on Earth, sedimentary organic matter, the bios-phere, and sedimentary carbonates, the latter having δ(13C) values near 0 ‰. Sedimentary carbonateswith unusually low 13C concentrations tend to be associated with organic matter or hydrocarbons. Thesereservoirs differ in isotopic composition because of different isotope-fractionation mechanisms. Kineticisotope fractionation associated with photosynthesis preferentially enriches plant material in 12C. Thisenrichment gives rise to organic sediments, coal, and crude oil with δ(13C) values near –25 ‰ (Fig. 4).The predominant mechanism by which plants assimilate carbon is the C3 metabolic process (Fig. 4),which generally results in δ(13C) of plants between –34 and –24 ‰. A second metabolic pathway (C4)utilized by plants in hot, dry, sunny environments (e.g., maize, sugar cane, and sorghum) yields more
© 2002 IUPAC, Pure and Applied Chemistry 74, 1987–2017
Isotope-abundance variations 1995
Fig. 3 Boron isotopic composition and atomic weight of selected boron-bearing compounds [25]. The δ(11B) scaleand 11B mole-fraction scale were matched using the data of Catanzaro et al. [32]; therefore, the uncertainty in theplacement of the atomic-weight scale and the 11B mole-fraction scale relative to the δ(11B) scale is equivalent to±0.8 ‰.
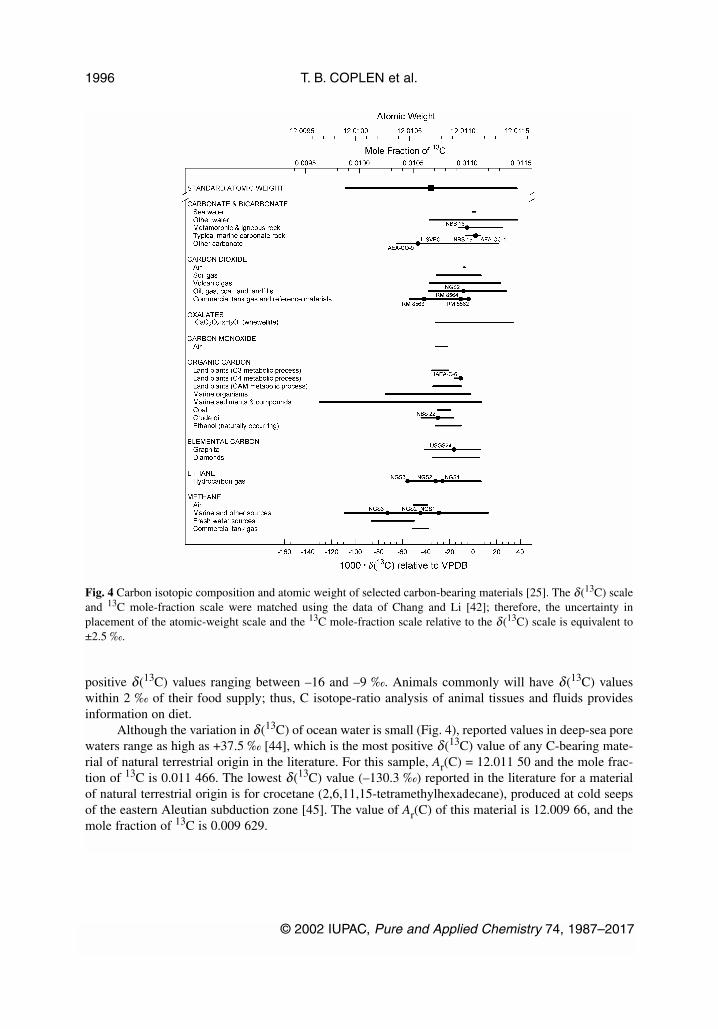
positive δ(13C) values ranging between –16 and –9 ‰. Animals commonly will have δ(13C) valueswithin 2 ‰ of their food supply; thus, C isotope-ratio analysis of animal tissues and fluids providesinformation on diet.
Although the variation in δ(13C) of ocean water is small (Fig. 4), reported values in deep-sea porewaters range as high as +37.5 ‰ [44], which is the most positive δ(13C) value of any C-bearing mate-rial of natural terrestrial origin in the literature. For this sample, Ar(C) = 12.011 50 and the mole frac-tion of 13C is 0.011 466. The lowest δ(13C) value (–130.3 ‰) reported in the literature for a materialof natural terrestrial origin is for crocetane (2,6,11,15-tetramethylhexadecane), produced at cold seepsof the eastern Aleutian subduction zone [45]. The value of Ar(C) of this material is 12.009 66, and themole fraction of 13C is 0.009 629.
T. B. COPLEN et al.
© 2002 IUPAC, Pure and Applied Chemistry 74, 1987–2017
1996
Fig. 4 Carbon isotopic composition and atomic weight of selected carbon-bearing materials [25]. The δ(13C) scaleand 13C mole-fraction scale were matched using the data of Chang and Li [42]; therefore, the uncertainty inplacement of the atomic-weight scale and the 13C mole-fraction scale relative to the δ(13C) scale is equivalent to±2.5 ‰.
Nitrogen 7N Ar(N) = 14.0067(2)
Isotope Atomic mass Mole fraction in N2 in air [2,46]
14N 14.003 074 0074(18) u 0.996 337(4)15N 15.000 108 973(12) u 0.003 663(4)
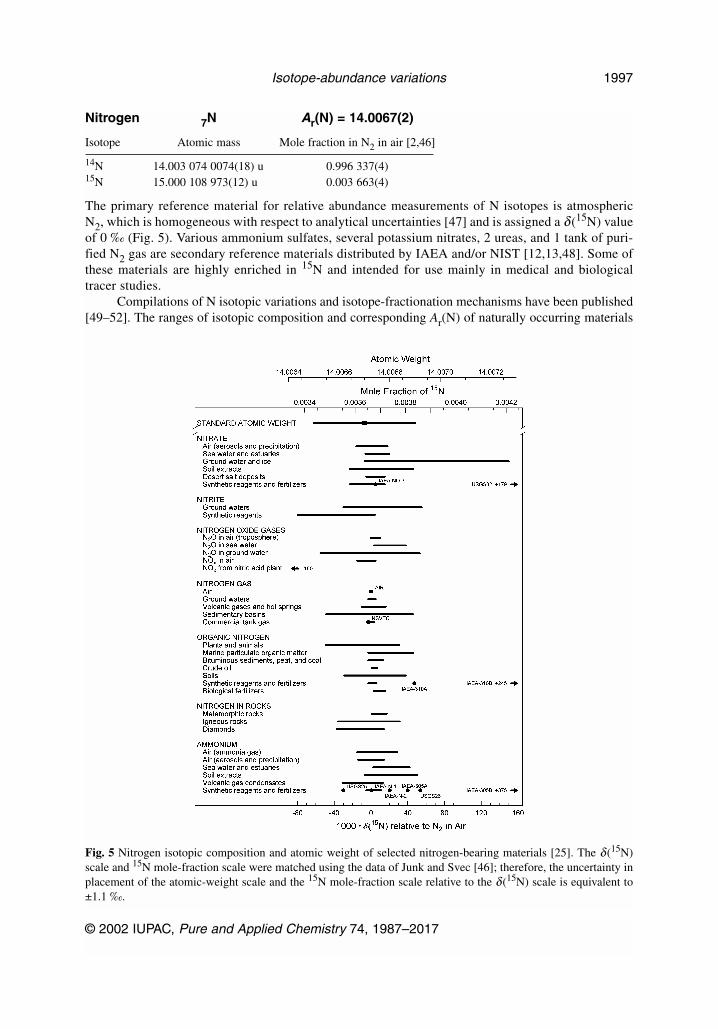
The primary reference material for relative abundance measurements of N isotopes is atmosphericN2, which is homogeneous with respect to analytical uncertainties [47] and is assigned a δ (15N) valueof 0 ‰ (Fig. 5). Various ammonium sulfates, several potassium nitrates, 2 ureas, and 1 tank of puri-fied N2 gas are secondary reference materials distributed by IAEA and/or NIST [12,13,48]. Some ofthese materials are highly enriched in 15N and intended for use mainly in medical and biologicaltracer studies.
Compilations of N isotopic variations and isotope-fractionation mechanisms have been published[49–52]. The ranges of isotopic composition and corresponding Ar(N) of naturally occurring materials
© 2002 IUPAC, Pure and Applied Chemistry 74, 1987–2017
Isotope-abundance variations 1997
Fig. 5 Nitrogen isotopic composition and atomic weight of selected nitrogen-bearing materials [25]. The δ(15N)scale and 15N mole-fraction scale were matched using the data of Junk and Svec [46]; therefore, the uncertainty inplacement of the atomic-weight scale and the 15N mole-fraction scale relative to the δ(15N) scale is equivalent to±1.1 ‰.
and reference materials are shown in Fig. 5. An early report of very positive δ(15N) values in uraniumores [53] is not included because its results were not confirmed [54].
Atmospheric N2 is the dominant N component in the combined atmosphere–biosphere–hydro-sphere portion of the Earth, so the bulk δ(15N) value of accessible N at the Earth’s surface is close to0 ‰. However, N isotopes are strongly fractionated by a variety of chemical and physical processes, socommon materials have variable isotope ratios. The mole fraction of 15N in the majority (>99 %) of N-bearing materials likely to be encountered in terrestrial materials ranges from 0.003 61 to 0.003 74;corresponding δ(15N) values range from –15 to +20 ‰; corresponding values for Ar(N) are 14.006 67and 14.007 10. The isotopic composition of N in the deep Earth (hence, the bulk value for the wholeEarth) is not well known.
N with atomic-weight values substantially different from the reference value occurs in the envi-ronment as a result of both kinetic and equilibrium isotope fractionation associated with biologic andnonbiologic processes. For example, residual inorganic aqueous N species may be relatively enrichedin 15N during assimilation by plants, oxidation of ammonium to nitrate (nitrification), reduction ofnitrate to N gases (denitrification), or volatilization of ammonia from ammonium-bearing solutions.Microbial N fixation and organic N mineralization, however, commonly have relatively minor effects.Some of the highest δ(15N) values found in the literature (>+20 ‰) are in nitrate and ammonium sep-arated from ground waters and soils that may have experienced several such processes. The highestδ(15N) value found in the literature (+150 ‰) for a material of natural terrestrial origin is for nitrate inAntarctic ice, where partial evaporation of HNO3 may have caused isotope fractionation [55]; the cor-responding Ar(N) = 14.007 27, and the mole fraction of 15N is 0.004 210. N substantially depleted in15N is found in precipitation and in some soils, plants, and natural gases. Some of the lowest δ(15N)values reported (<–20 ‰) for materials of natural terrestrial origin are in soil nitrate from the Dry Valleyregion of Antarctica, where the dominant source of N may be precipitation with low 15N content [56].The lowest value of a natural biologic sample in the literature (–49 ‰) is for epibenthic algae from asaline pond in the same region of Antarctica, and may be due to a combination of low 15N content inthe nutrient source plus isotope fractionation during assimilation [56]. Slightly lower δ(15N) valueswere reported for N2O from ground water undergoing denitrification [57], and the lowest δ(15N) valueis –55 ‰. For this sample, Ar(N) = 14.006 53 and the mole fraction of 15N is 0.003 462. KNO2 reagentshave δ(15N) values as negative as –80 ‰ [25]; corresponding Ar(N) = 14.006 43, and the mole fractionof 15N is 0.003 371.
Recent studies have rapidly expanded the limits for several of the subcategories of natural terres-trial materials, and it would not be surprising if the extreme values were exceeded in the future. It shouldbe noted that large quantities of reagents and fertilizers manufactured and distributed for experimentalpurposes have 15N mole fractions ranging from at least 0.000 016 to 0.99 [58,59].
Oxygen 8O Ar(O) = 15.9994(3)
Isotope Atomic mass Mole fraction in VSMOW [2,60,61]
16O 15.994 914 6223(25) u 0.997 6206(5)17O 16.999 131 50(22) u 0.000 3790(9)18O 17.999 1604(9) u 0.002 0004(5)
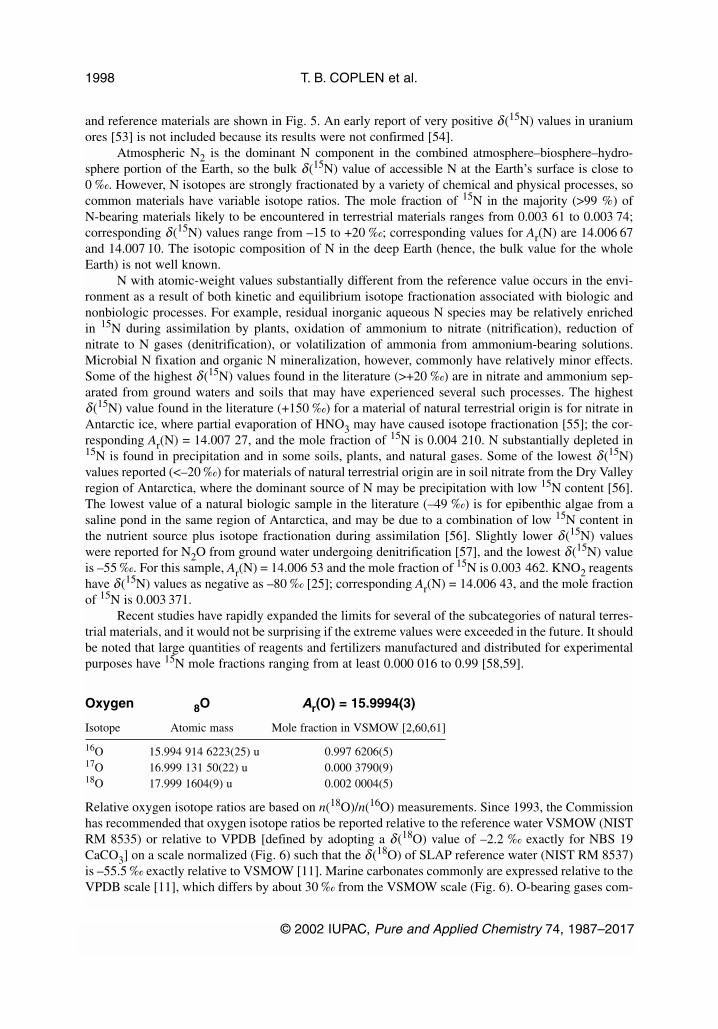
Relative oxygen isotope ratios are based on n(18O)/n(16O) measurements. Since 1993, the Commissionhas recommended that oxygen isotope ratios be reported relative to the reference water VSMOW (NISTRM 8535) or relative to VPDB [defined by adopting a δ(18O) value of –2.2 ‰ exactly for NBS 19CaCO3] on a scale normalized (Fig. 6) such that the δ(18O) of SLAP reference water (NIST RM 8537)is –55.5 ‰ exactly relative to VSMOW [11]. Marine carbonates commonly are expressed relative to theVPDB scale [11], which differs by about 30 ‰ from the VSMOW scale (Fig. 6). O-bearing gases com-
T. B. COPLEN et al.
© 2002 IUPAC, Pure and Applied Chemistry 74, 1987–2017
1998
monly are expressed relative to atmospheric O2. Various carbonates, 1 silica sand, 1 sulfate, 3 CO2gases, and 1 biotite are secondary reference materials distributed by IAEA and/or NIST (Fig. 6) [12].In addition, IAEA distributes several reference materials for medical and biological tracer studies [13].
Compilations of oxygen isotopic variations and isotope-fractionation mechanisms have been pub-lished [16–18,25,62]. As shown in Fig. 6, the δ (18O) of atmospheric O2 is constant within the uncer-tainty of analytical measurement [63]. Variations in the δ (18O) values of terrestrial waters generally areconcordant with δ(2H) variations and are caused primarily by evaporation and condensation processes.The δ(18O) of plants and animals reflects the δ(18O) of meteoric water in their environment. In naturalwaters, δ(17O) variations, based on n(17O)/n(16O) measurements relative to VSMOW, were found to be0.5281 ± 0.0015 times variation in δ(18O) [64]. The δ(18O) of bulk Earth is well represented by mid-ocean ridge basalts (+5.7 ± 0.5 ‰), which cover much of the ocean floor [65].
Mass-independent δ(17O) and δ(18O) isotopic variation has been observed in atmospheric O3,O2, N2O, H2O2, CO, and CO2 [66,67] and is attributed to discrimination between symmetric and asym-metric isotopic species during photochemical reaction [68]. Bao et al. [69] report δ(17O) and δ(18O)values of +11.1 ‰ and +12.5 ‰ for sulfate in sand crystals from Scotts Bluff, Nebraska (USA), a
© 2002 IUPAC, Pure and Applied Chemistry 74, 1987–2017
Isotope-abundance variations 1999
Fig. 6 Oxygen isotopic composition and atomic weight of selected oxygen-bearing materials [25]. The δ(18O) scaleand 18O mole-fraction scale were matched using the data of Li et al. [60] and Baertschi [61]; therefore, theuncertainty in placement of the atomic-weight scale and the 18O mole-fraction scale relative to the δ(18O) scale isequivalent to ±0.3 ‰.
+4.6 ‰ enrichment in 17O relative to the expected mass-dependent value. This is the first sulfate depositon the Earth’s surface reported to be enriched in 17O. 17O enrichments in excess of 20 ‰ relative tomass-dependent values have been reported for nitrate from the Atacama Desert, Chile [25].
The lowest δ(18O) value found in the literature for a naturally occurring material is –62.8 ‰ forAntarctic precipitation [70]. For this sample, the corresponding Ar(O) = 15.999 04 and the mole frac-tion of 18O is 0.001 875. The highest δ(18O) found in the literature for a terrestrial material of naturalorigin is +109 ‰, found in marine N2O [71]. For this sample, Ar(O) = 15.999 76 and the mole fractionof 18O is 0.002 218.
Magnesium 12Mg Ar(Mg) = 24.3050(6)
Isotope Atomic mass Mole fraction in NIST SRM 980 Mg metal [2,72]
24Mg 23.985 041 87(26) u 0.789 92(25)25Mg 24.985 837 00(26) u 0.100 03(9)26Mg 25.982 593 00(26) u 0.110 05(19)
Relative Mg isotope ratios are based on n(26Mg)/n(24Mg) measurements and are expressed relative toNIST SRM 980 Mg metal, which is assigned a δ(26Mg) value of 0 ‰, exactly.
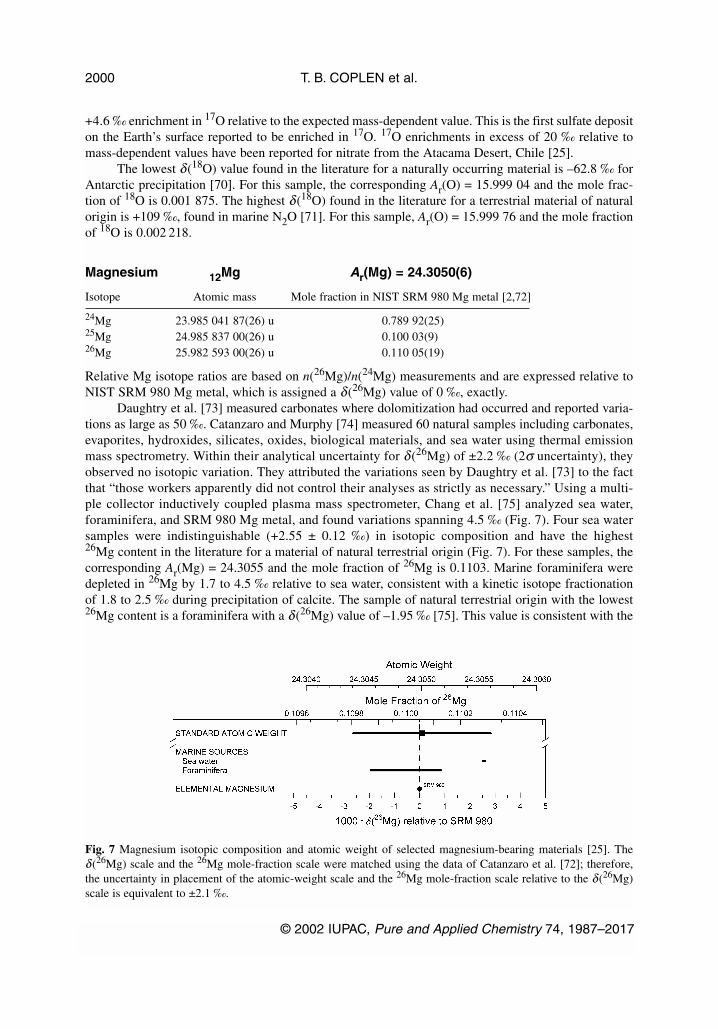
Daughtry et al. [73] measured carbonates where dolomitization had occurred and reported varia-tions as large as 50 ‰. Catanzaro and Murphy [74] measured 60 natural samples including carbonates,evaporites, hydroxides, silicates, oxides, biological materials, and sea water using thermal emissionmass spectrometry. Within their analytical uncertainty for δ (26Mg) of ±2.2 ‰ (2σ uncertainty), theyobserved no isotopic variation. They attributed the variations seen by Daughtry et al. [73] to the factthat “those workers apparently did not control their analyses as strictly as necessary.” Using a multi-ple collector inductively coupled plasma mass spectrometer, Chang et al. [75] analyzed sea water,foraminifera, and SRM 980 Mg metal, and found variations spanning 4.5 ‰ (Fig. 7). Four sea watersamples were indistinguishable (+2.55 ± 0.12 ‰) in isotopic composition and have the highest 26Mg content in the literature for a material of natural terrestrial origin (Fig. 7). For these samples, thecorresponding Ar(Mg) = 24.3055 and the mole fraction of 26Mg is 0.1103. Marine foraminifera weredepleted in 26Mg by 1.7 to 4.5 ‰ relative to sea water, consistent with a kinetic isotope fractionationof 1.8 to 2.5 ‰ during precipitation of calcite. The sample of natural terrestrial origin with the lowest26Mg content is a foraminifera with a δ(26Mg) value of –1.95 ‰ [75]. This value is consistent with the
T. B. COPLEN et al.
© 2002 IUPAC, Pure and Applied Chemistry 74, 1987–2017
2000
Fig. 7 Magnesium isotopic composition and atomic weight of selected magnesium-bearing materials [25]. Theδ(26Mg) scale and the 26Mg mole-fraction scale were matched using the data of Catanzaro et al. [72]; therefore,the uncertainty in placement of the atomic-weight scale and the 26Mg mole-fraction scale relative to the δ(26Mg)scale is equivalent to ±2.1 ‰.
results of a cave study by Galy et al. [76], which indicates that calcite is depleted in 26Mg relative towater from which it is precipitating. For this sample, the corresponding Ar(Mg) = 24.3046 and the molefraction of 26Mg is 0.1099.
Silicon 14Si Ar(Si) = 28.0855(3)
Isotope Atomic mass Mole fraction in NBS 28 SiO2 [25,77]
28Si 27.976 926 49(22) u 0.922 223(9)29Si 28.976 494 68(22) u 0.046 853(6)30Si 29.973 770 18(22) u 0.030 924(7)
Relative Si isotope ratios are based on n(30Si)/n(28Si) measurements and are expressed relative to NISTNBS 28 silica sand, which is assigned a δ(30Si) value of 0 ‰. Three other isotopic reference materialsare available: NIST SRM 990 elemental Si, IRMM–017 elemental Si, and IRMM–018 SiO2 (Fig. 8).These three reference materials have been used primarily for absolute isotope-abundance measure-ments.
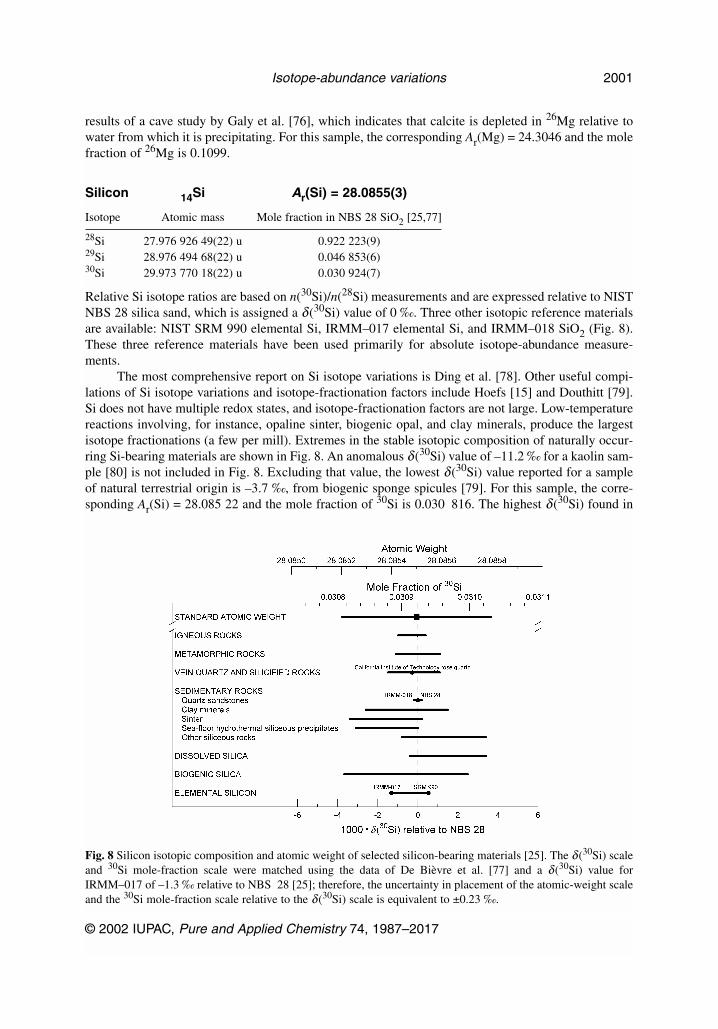
The most comprehensive report on Si isotope variations is Ding et al. [78]. Other useful compi-lations of Si isotope variations and isotope-fractionation factors include Hoefs [15] and Douthitt [79].Si does not have multiple redox states, and isotope-fractionation factors are not large. Low-temperaturereactions involving, for instance, opaline sinter, biogenic opal, and clay minerals, produce the largestisotope fractionations (a few per mill). Extremes in the stable isotopic composition of naturally occur-ring Si-bearing materials are shown in Fig. 8. An anomalous δ(30Si) value of –11.2 ‰ for a kaolin sam-ple [80] is not included in Fig. 8. Excluding that value, the lowest δ(30Si) value reported for a sampleof natural terrestrial origin is –3.7 ‰, from biogenic sponge spicules [79]. For this sample, the corre-sponding Ar(Si) = 28.085 22 and the mole fraction of 30Si is 0.030 816. The highest δ(30Si) found in
© 2002 IUPAC, Pure and Applied Chemistry 74, 1987–2017
Isotope-abundance variations 2001
Fig. 8 Silicon isotopic composition and atomic weight of selected silicon-bearing materials [25]. The δ(30Si) scaleand 30Si mole-fraction scale were matched using the data of De Bièvre et al. [77] and a δ(30Si) value forIRMM–017 of –1.3 ‰ relative to NBS 28 [25]; therefore, the uncertainty in placement of the atomic-weight scaleand the 30Si mole-fraction scale relative to the δ(30Si) scale is equivalent to ±0.23 ‰.
the literature for a sample of natural terrestrial origin is +3.4 ‰, from silicified algal matter in sediments[80]. For this sample, Ar(Si) = 28.085 78 and the mole fraction of 30Si is 0.031 023.
Sulfur 16S Ar(S) = 32.065(5)
Isotope Atomic mass Mole fraction in VCDT [81]
32S 31.972 070 73(15) u 0.950 3957(90)33S 32.971 458 54(15) u 0.007 4865(12)34S 33.967 866 87(14) u 0.041 9719(87)36S 35.967 080 88(25) u 0.000 1459(21)
Relative S isotope ratios are based on n(34S)/n(32S) measurements. The historical reference material forthese measurements, CDT troilite (FeS) from the Cañon Diablo meteorite, varies in δ(34S) by as muchas 0.4 ‰ [82]. Consequently, an advisory committee of IAEA recommended in 1993 that the Ag2S ref-erence material IAEA-S-1 (previously known as NZ-1) be assigned a δ(34S) value of –0.3 ‰ exactly,thereby establishing a VCDT (Vienna CDT) scale (Fig. 9). An elemental sulfur, 1 sphalerite, and vari-ous barium sulfates and silver sulfides are reference materials distributed internationally by IAEAand/or NIST [12].
Although most isotope fractionation of S isotopes is mass-dependent, mass-independent isotopicvariation has been observed in sulfate and sulfide rock [83,84]. Rumble et al. [84] report values for
T. B. COPLEN et al.
© 2002 IUPAC, Pure and Applied Chemistry 74, 1987–2017
2002
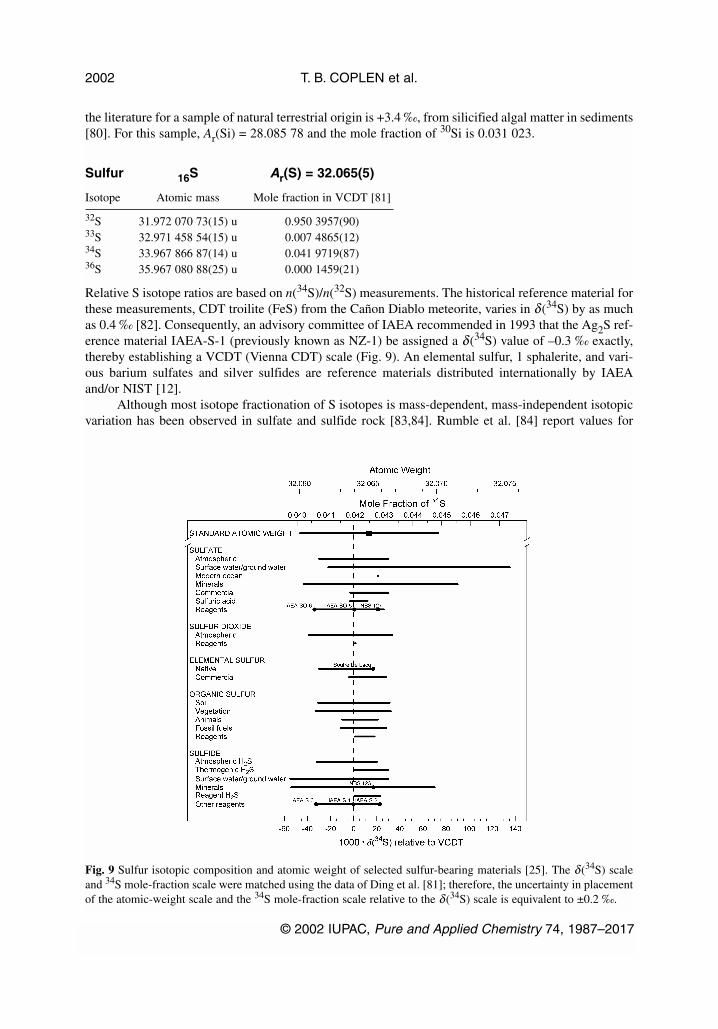
Fig. 9 Sulfur isotopic composition and atomic weight of selected sulfur-bearing materials [25]. The δ(34S) scaleand 34S mole-fraction scale were matched using the data of Ding et al. [81]; therefore, the uncertainty in placementof the atomic-weight scale and the 34S mole-fraction scale relative to the δ(34S) scale is equivalent to ±0.2 ‰.
δ (33S) of between –2 and +7 ‰ in excess of mass-dependent values for black shale with an age of2.5 Ga.
The dominant mechanism of terrestrial S isotope fractionation is low-temperature bacterial sul-fate reduction, whereby 32SO4
2– may react up to 1.07 times faster than 34SO42– [85]. As reduction pro-
ceeds, unreacted sulfate and product sulfide not mixed with earlier produced sulfide can acquire highlypositive δ(34S) values. The highest value in the literature for a sample of natural terrestrial origin is+135 ‰ from dissolved sulfate in pore fluids in deep ocean sediments undergoing bacterial reductionat elevated temperature off the coast of Washington state (USA) [86]. For this value, Ar(S) = 32.075 andthe mole fraction of 34S is 0.0473.
Very negative δ(34S) values were found for biogenic H2S and metal sulfides in environmentswhere the fraction of sulfate reduction was small, e.g., –50 ‰ for biogenic HS– in spring waters andboreholes [85], pyrite in some Deep Sea Drilling Project sediment cores [87], pyrite concretions in sed-imentary rocks [86], and hydrotroilite in river sediments [88]. The most negative δ(34S) value reportedfor a material of natural terrestrial origin is –55 ‰ for HS– under ice cover in a sewage treatment lagoon[25]. For this sample, Ar(S) = 32.059 and the mole fraction of 34S is 0.0398.
In a database of over 13 000 natural samples, the bulk of the oxidized forms were found to haveδ(34S) values between +5 and +25 ‰, whereas the corresponding range for reduced forms was –5 to+15 ‰ [89]. Although the total variation in terrestrial δ(34S) values extends from –55 to +135 ‰, mostcommercial S comes ultimately from two reservoirs, lower crustal sulfide (mean ~+2 ‰) and oceanicsulfate (variable over geological time from +10 to +25 ‰). Some 40 laboratory reagents were found tohave δ(34S) values ranging from –4 to +26 ‰, with a peak in the distribution near 0 ‰ [25].Unfortunately, a working list with manufacturer and catalog number could prove misleading becauseBaSO4 from the same manufacturer and catalog number was found to have δ(34S) values of –2.7 ‰ and+11.5 ‰ when purchased in 1973 and 1985, respectively.
Chlorine 17Cl Ar(Cl) = 35.453(2)
Isotope Atomic mass Mole fraction in SMOC [2,90,91]
35Cl 34.968 852 71(4) u 0.757 79(46)37Cl 36.965 902 60(5) u 0.242 21(46)
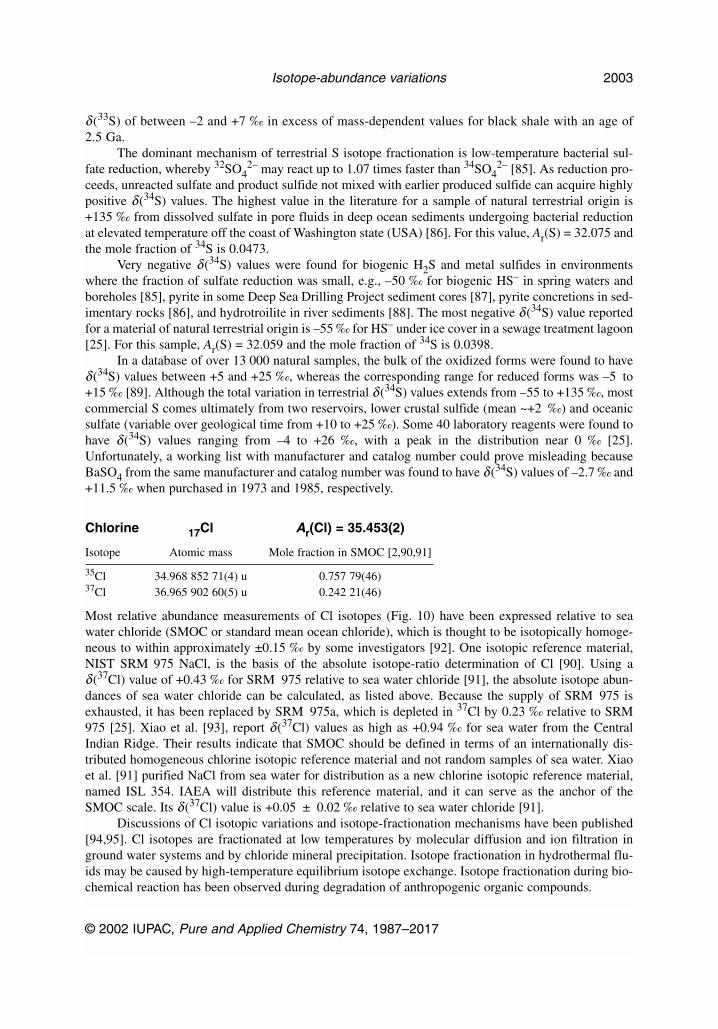
Most relative abundance measurements of Cl isotopes (Fig. 10) have been expressed relative to seawater chloride (SMOC or standard mean ocean chloride), which is thought to be isotopically homoge-neous to within approximately ±0.15 ‰ by some investigators [92]. One isotopic reference material,NIST SRM 975 NaCl, is the basis of the absolute isotope-ratio determination of Cl [90]. Using aδ(37Cl) value of +0.43 ‰ for SRM 975 relative to sea water chloride [91], the absolute isotope abun-dances of sea water chloride can be calculated, as listed above. Because the supply of SRM 975 isexhausted, it has been replaced by SRM 975a, which is depleted in 37Cl by 0.23 ‰ relative to SRM975 [25]. Xiao et al. [93], report δ(37Cl) values as high as +0.94 ‰ for sea water from the CentralIndian Ridge. Their results indicate that SMOC should be defined in terms of an internationally dis-tributed homogeneous chlorine isotopic reference material and not random samples of sea water. Xiaoet al. [91] purified NaCl from sea water for distribution as a new chlorine isotopic reference material,named ISL 354. IAEA will distribute this reference material, and it can serve as the anchor of theSMOC scale. Its δ(37Cl) value is +0.05 ± 0.02 ‰ relative to sea water chloride [91].
Discussions of Cl isotopic variations and isotope-fractionation mechanisms have been published[94,95]. Cl isotopes are fractionated at low temperatures by molecular diffusion and ion filtration inground water systems and by chloride mineral precipitation. Isotope fractionation in hydrothermal flu-ids may be caused by high-temperature equilibrium isotope exchange. Isotope fractionation during bio-chemical reaction has been observed during degradation of anthropogenic organic compounds.
© 2002 IUPAC, Pure and Applied Chemistry 74, 1987–2017
Isotope-abundance variations 2003
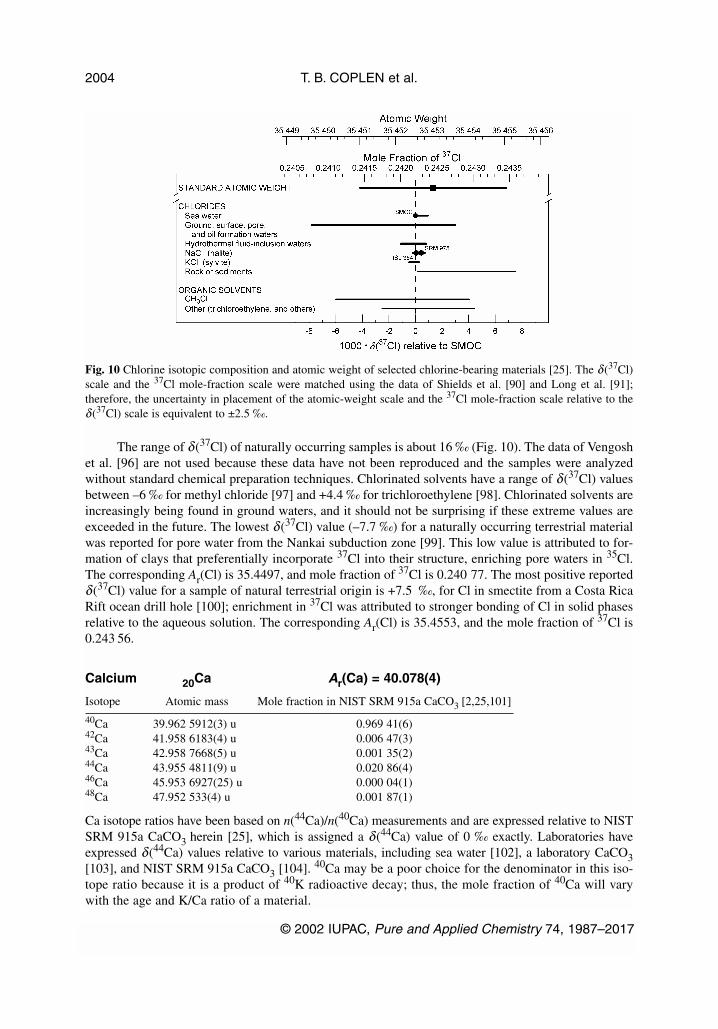
The range of δ(37Cl) of naturally occurring samples is about 16 ‰ (Fig. 10). The data of Vengoshet al. [96] are not used because these data have not been reproduced and the samples were analyzedwithout standard chemical preparation techniques. Chlorinated solvents have a range of δ(37Cl) valuesbetween –6 ‰ for methyl chloride [97] and +4.4 ‰ for trichloroethylene [98]. Chlorinated solvents areincreasingly being found in ground waters, and it should not be surprising if these extreme values areexceeded in the future. The lowest δ(37Cl) value (–7.7 ‰) for a naturally occurring terrestrial materialwas reported for pore water from the Nankai subduction zone [99]. This low value is attributed to for-mation of clays that preferentially incorporate 37Cl into their structure, enriching pore waters in 35Cl.The corresponding Ar(Cl) is 35.4497, and mole fraction of 37Cl is 0.240 77. The most positive reportedδ(37Cl) value for a sample of natural terrestrial origin is +7.5 ‰, for Cl in smectite from a Costa RicaRift ocean drill hole [100]; enrichment in 37Cl was attributed to stronger bonding of Cl in solid phasesrelative to the aqueous solution. The corresponding Ar(Cl) is 35.4553, and the mole fraction of 37Cl is0.243 56.
Calcium 20Ca Ar(Ca) = 40.078(4)
Isotope Atomic mass Mole fraction in NIST SRM 915a CaCO3 [2,25,101]
40Ca 39.962 5912(3) u 0.969 41(6)42Ca 41.958 6183(4) u 0.006 47(3)43Ca 42.958 7668(5) u 0.001 35(2)44Ca 43.955 4811(9) u 0.020 86(4)46Ca 45.953 6927(25) u 0.000 04(1)48Ca 47.952 533(4) u 0.001 87(1)
Ca isotope ratios have been based on n(44Ca)/n(40Ca) measurements and are expressed relative to NISTSRM 915a CaCO3 herein [25], which is assigned a δ(44Ca) value of 0 ‰ exactly. Laboratories haveexpressed δ(44Ca) values relative to various materials, including sea water [102], a laboratory CaCO3[103], and NIST SRM 915a CaCO3 [104]. 40Ca may be a poor choice for the denominator in this iso-tope ratio because it is a product of 40K radioactive decay; thus, the mole fraction of 40Ca will varywith the age and K/Ca ratio of a material.
T. B. COPLEN et al.
© 2002 IUPAC, Pure and Applied Chemistry 74, 1987–2017
2004
Fig. 10 Chlorine isotopic composition and atomic weight of selected chlorine-bearing materials [25]. The δ(37Cl)scale and the 37Cl mole-fraction scale were matched using the data of Shields et al. [90] and Long et al. [91];therefore, the uncertainty in placement of the atomic-weight scale and the 37Cl mole-fraction scale relative to theδ(37Cl) scale is equivalent to ±2.5 ‰.
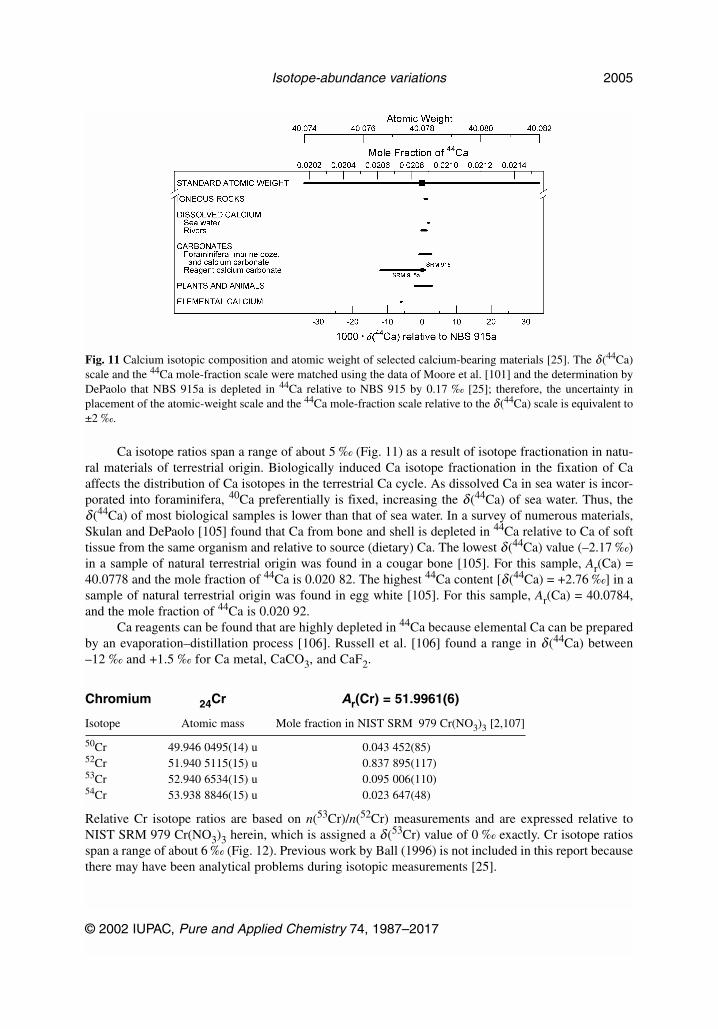
Ca isotope ratios span a range of about 5 ‰ (Fig. 11) as a result of isotope fractionation in natu-ral materials of terrestrial origin. Biologically induced Ca isotope fractionation in the fixation of Caaffects the distribution of Ca isotopes in the terrestrial Ca cycle. As dissolved Ca in sea water is incor-porated into foraminifera, 40Ca preferentially is fixed, increasing the δ(44Ca) of sea water. Thus, theδ(44Ca) of most biological samples is lower than that of sea water. In a survey of numerous materials,Skulan and DePaolo [105] found that Ca from bone and shell is depleted in 44Ca relative to Ca of softtissue from the same organism and relative to source (dietary) Ca. The lowest δ(44Ca) value (–2.17 ‰)in a sample of natural terrestrial origin was found in a cougar bone [105]. For this sample, Ar(Ca) =40.0778 and the mole fraction of 44Ca is 0.020 82. The highest 44Ca content [δ(44Ca) = +2.76 ‰] in asample of natural terrestrial origin was found in egg white [105]. For this sample, Ar(Ca) = 40.0784,and the mole fraction of 44Ca is 0.020 92.
Ca reagents can be found that are highly depleted in 44Ca because elemental Ca can be preparedby an evaporation–distillation process [106]. Russell et al. [106] found a range in δ (44Ca) between–12 ‰ and +1.5 ‰ for Ca metal, CaCO3, and CaF2.
Chromium 24Cr Ar(Cr) = 51.9961(6)
Isotope Atomic mass Mole fraction in NIST SRM 979 Cr(NO3)3 [2,107]
50Cr 49.946 0495(14) u 0.043 452(85)52Cr 51.940 5115(15) u 0.837 895(117)53Cr 52.940 6534(15) u 0.095 006(110)54Cr 53.938 8846(15) u 0.023 647(48)
Relative Cr isotope ratios are based on n(53Cr)/n(52Cr) measurements and are expressed relative toNIST SRM 979 Cr(NO3)3 herein, which is assigned a δ(53Cr) value of 0 ‰ exactly. Cr isotope ratiosspan a range of about 6 ‰ (Fig. 12). Previous work by Ball (1996) is not included in this report becausethere may have been analytical problems during isotopic measurements [25].
© 2002 IUPAC, Pure and Applied Chemistry 74, 1987–2017
Isotope-abundance variations 2005
Fig. 11 Calcium isotopic composition and atomic weight of selected calcium-bearing materials [25]. The δ(44Ca)scale and the 44Ca mole-fraction scale were matched using the data of Moore et al. [101] and the determination byDePaolo that NBS 915a is depleted in 44Ca relative to NBS 915 by 0.17 ‰ [25]; therefore, the uncertainty inplacement of the atomic-weight scale and the 44Ca mole-fraction scale relative to the δ(44Ca) scale is equivalent to±2 ‰.
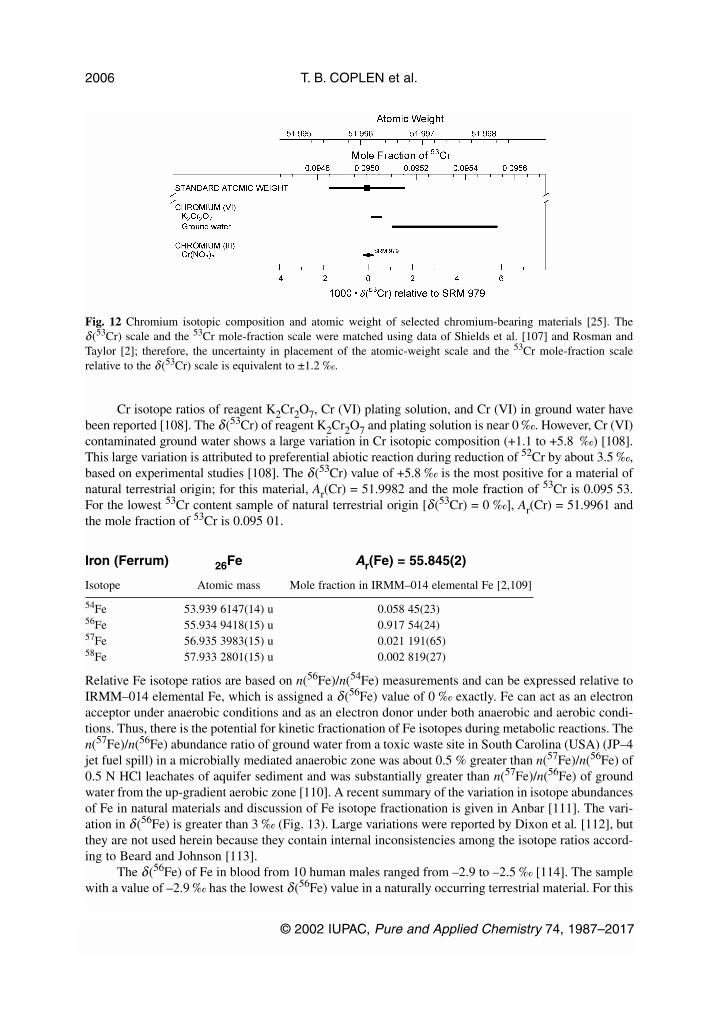
Cr isotope ratios of reagent K2Cr2O7, Cr (VI) plating solution, and Cr (VI) in ground water havebeen reported [108]. The δ(53Cr) of reagent K2Cr2O7 and plating solution is near 0 ‰. However, Cr (VI)contaminated ground water shows a large variation in Cr isotopic composition (+1.1 to +5.8 ‰) [108].This large variation is attributed to preferential abiotic reaction during reduction of 52Cr by about 3.5 ‰,based on experimental studies [108]. The δ(53Cr) value of +5.8 ‰ is the most positive for a material ofnatural terrestrial origin; for this material, Ar(Cr) = 51.9982 and the mole fraction of 53Cr is 0.095 53.For the lowest 53Cr content sample of natural terrestrial origin [δ(53Cr) = 0 ‰], Ar(Cr) = 51.9961 andthe mole fraction of 53Cr is 0.095 01.
Iron (Ferrum) 26Fe Ar(Fe) = 55.845(2)
Isotope Atomic mass Mole fraction in IRMM–014 elemental Fe [2,109]
54Fe 53.939 6147(14) u 0.058 45(23)56Fe 55.934 9418(15) u 0.917 54(24)57Fe 56.935 3983(15) u 0.021 191(65)58Fe 57.933 2801(15) u 0.002 819(27)
Relative Fe isotope ratios are based on n(56Fe)/n(54Fe) measurements and can be expressed relative toIRMM–014 elemental Fe, which is assigned a δ (56Fe) value of 0 ‰ exactly. Fe can act as an electronacceptor under anaerobic conditions and as an electron donor under both anaerobic and aerobic condi-tions. Thus, there is the potential for kinetic fractionation of Fe isotopes during metabolic reactions. Then(57Fe)/n(56Fe) abundance ratio of ground water from a toxic waste site in South Carolina (USA) (JP–4jet fuel spill) in a microbially mediated anaerobic zone was about 0.5 % greater than n(57Fe)/n(56Fe) of0.5 N HCl leachates of aquifer sediment and was substantially greater than n(57Fe)/n(56Fe) of groundwater from the up-gradient aerobic zone [110]. A recent summary of the variation in isotope abundancesof Fe in natural materials and discussion of Fe isotope fractionation is given in Anbar [111]. The vari-ation in δ(56Fe) is greater than 3 ‰ (Fig. 13). Large variations were reported by Dixon et al. [112], butthey are not used herein because they contain internal inconsistencies among the isotope ratios accord-ing to Beard and Johnson [113].
The δ(56Fe) of Fe in blood from 10 human males ranged from –2.9 to –2.5 ‰ [114]. The samplewith a value of –2.9 ‰ has the lowest δ(56Fe) value in a naturally occurring terrestrial material. For this
T. B. COPLEN et al.
© 2002 IUPAC, Pure and Applied Chemistry 74, 1987–2017
2006
Fig. 12 Chromium isotopic composition and atomic weight of selected chromium-bearing materials [25]. Theδ(53Cr) scale and the 53Cr mole-fraction scale were matched using data of Shields et al. [107] and Rosman andTaylor [2]; therefore, the uncertainty in placement of the atomic-weight scale and the 53Cr mole-fraction scalerelative to the δ(53Cr) scale is equivalent to ±1.2 ‰.
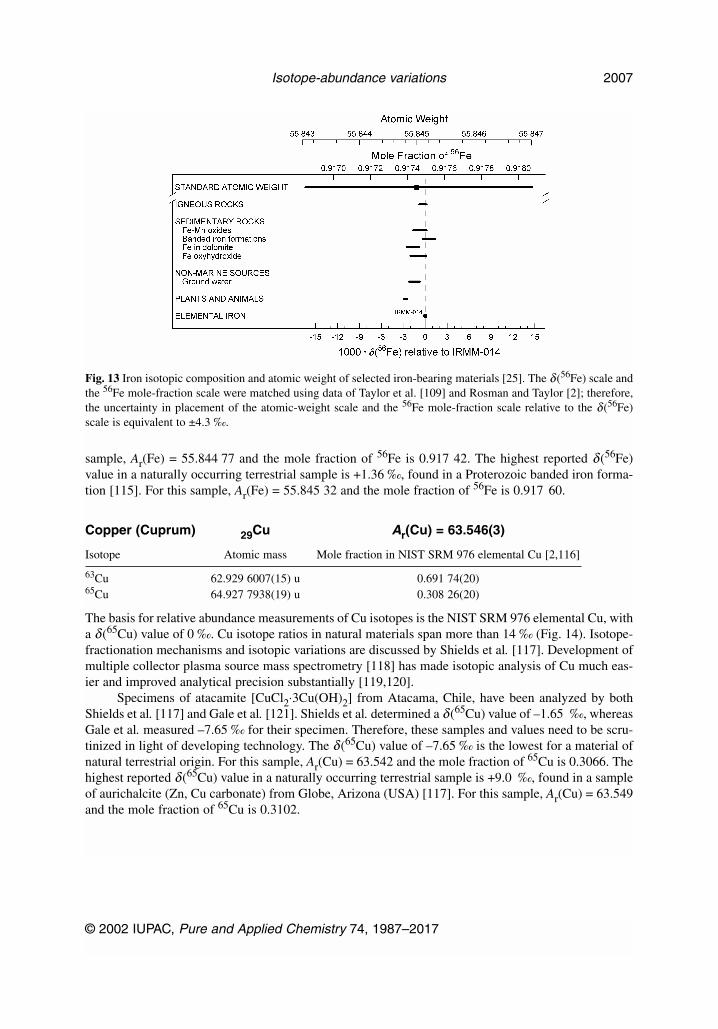
sample, Ar(Fe) = 55.844 77 and the mole fraction of 56Fe is 0.917 42. The highest reported δ(56Fe)value in a naturally occurring terrestrial sample is +1.36 ‰, found in a Proterozoic banded iron forma-tion [115]. For this sample, Ar(Fe) = 55.845 32 and the mole fraction of 56Fe is 0.917 60.
Copper (Cuprum) 29Cu Ar(Cu) = 63.546(3)
Isotope Atomic mass Mole fraction in NIST SRM 976 elemental Cu [2,116]
63Cu 62.929 6007(15) u 0.691 74(20)65Cu 64.927 7938(19) u 0.308 26(20)
The basis for relative abundance measurements of Cu isotopes is the NIST SRM 976 elemental Cu, witha δ(65Cu) value of 0 ‰. Cu isotope ratios in natural materials span more than 14 ‰ (Fig. 14). Isotope-fractionation mechanisms and isotopic variations are discussed by Shields et al. [117]. Development ofmultiple collector plasma source mass spectrometry [118] has made isotopic analysis of Cu much eas-ier and improved analytical precision substantially [119,120].
Specimens of atacamite [CuCl2⋅3Cu(OH)2] from Atacama, Chile, have been analyzed by bothShields et al. [117] and Gale et al. [121]. Shields et al. determined a δ(65Cu) value of –1.65 ‰, whereasGale et al. measured –7.65 ‰ for their specimen. Therefore, these samples and values need to be scru-tinized in light of developing technology. The δ(65Cu) value of –7.65 ‰ is the lowest for a material ofnatural terrestrial origin. For this sample, Ar(Cu) = 63.542 and the mole fraction of 65Cu is 0.3066. Thehighest reported δ(65Cu) value in a naturally occurring terrestrial sample is +9.0 ‰, found in a sampleof aurichalcite (Zn, Cu carbonate) from Globe, Arizona (USA) [117]. For this sample, Ar(Cu) = 63.549and the mole fraction of 65Cu is 0.3102.
© 2002 IUPAC, Pure and Applied Chemistry 74, 1987–2017
Isotope-abundance variations 2007
Fig. 13 Iron isotopic composition and atomic weight of selected iron-bearing materials [25]. The δ(56Fe) scale andthe 56Fe mole-fraction scale were matched using data of Taylor et al. [109] and Rosman and Taylor [2]; therefore,the uncertainty in placement of the atomic-weight scale and the 56Fe mole-fraction scale relative to the δ(56Fe)scale is equivalent to ±4.3 ‰.
Zinc 30Zn Ar(Zn) = 65.409(4)
Isotope Atomic mass Mole fraction in a naturally occurring sample [2,122]
64Zn 63.929 1461(18) u 0.4863(20)66Zn 65.926 0364(17) u 0.2790(9)67Zn 66.927 1305(17) u 0.0410(4)68Zn 67.924 8473(17) u 0.1875(17)70Zn 69.925 325(4) u 0.0062(1)
Rosman [122] has determined the absolute isotope abundances of Zn. The advent of multiple collectorplasma source mass spectrometry [118] has improved the analytical precision of the isotopic analysisof Zn [119]. Maréchal et al. [119] reported n(66Zn)/n(64Zn) ratios for Zn-bearing materials andexpressed their results as δ(66Zn) values relative to JMC (Johnson Matthey) 3–0749 L solution becausethere are no internationally distributed isotopic reference materials for Zn. The full range in naturallyoccurring materials is about 1 ‰ [119]. The material with the lowest 66Zn content is ZnS from the LauBasin, Pacific Ocean, with a δ(66Zn) value of –0.19 ‰ [119]. The material with the highest reported66Zn content is a mussel with a δ(66Zn) value of +0.82 ‰ [119].
T. B. COPLEN et al.
© 2002 IUPAC, Pure and Applied Chemistry 74, 1987–2017
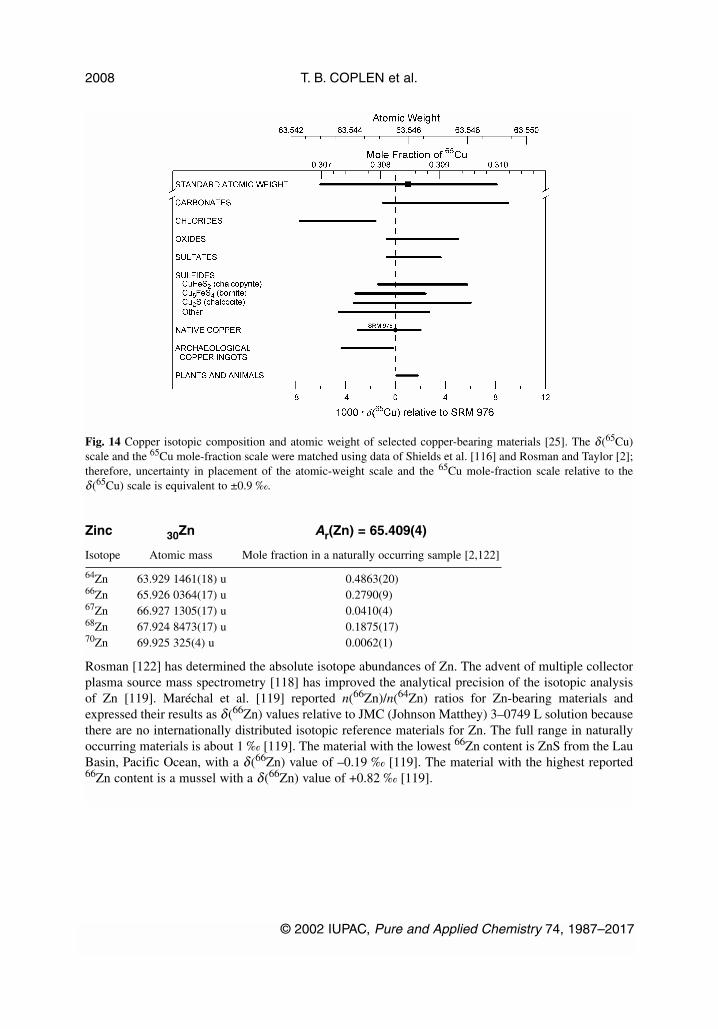
2008
Fig. 14 Copper isotopic composition and atomic weight of selected copper-bearing materials [25]. The δ(65Cu)scale and the 65Cu mole-fraction scale were matched using data of Shields et al. [116] and Rosman and Taylor [2];therefore, uncertainty in placement of the atomic-weight scale and the 65Cu mole-fraction scale relative to theδ(65Cu) scale is equivalent to ±0.9 ‰.
Selenium 34Se Ar(Se) = 78.96(3)
Isotope Atomic mass Mole fraction in a naturally occurring sample [2,123]
74Se 73.922 4767(16) u 0.008 89(3)76Se 75.919 2143(16) u 0.093 66(18)77Se 76.919 9148(16) u 0.076 35(10)78Se 77.917 3097(16) u 0.237 72(20)80Se 79.916 5221(20) u 0.496 07(17)82Se 81.916 7003(22) u 0.087 31(10)
Few measurements are available of variations in the isotopic composition of terrestrial Se. Furthermore,absolute abundance determinations have not been made for any specimen used in relative abundanceinvestigations. The published maximum range of δ (82Se) values (based on n(82Se)/n(76Se) measure-ments) in naturally occurring terrestrial materials is 16 ‰ [124]. Se is analogous to S in that bacterialredox reactions have been identified in nature and substantial kinetic isotope effects have been realizedduring laboratory SeO4
2– and SeO32– reductions [124–129]. If a k76/k82 value of 1.018 (average for lab-
oratory studies) existed during reduction of SeO32– containing Se with Ar(Se) = 78.963, the initial Se0
product would have an Ar(Se) = 78.948.
Molybdenum 42Mo Ar(Mo) = 95.94(2)
Isotope Atomic mass Mole fraction in a naturally occurring sample [2,130]
92Mo 91.906 810(4) u 0.148 362(148)94Mo 93.905 0867(20) u 0.092 466(92)95Mo 94.905 8406(20) u 0.159 201(159)96Mo 95.904 6780(20) u 0.166 756(167)97Mo 96.906 0201(20) u 0.095 551(96)98Mo 97.905 4069(20) u 0.241 329(241)100Mo 99.907 476(6) u 0.096 335(96)
Moore and others [130] have determined the absolute isotope abundances of Mo; however, absolute iso-tope-abundance determinations have not been made for any specimen used in relative isotope-abun-dance investigations. Multiple collector plasma source mass spectrometry [118] has improved the ana-lytical precision of the isotopic analysis of Mo and demonstrated natural isotopic variation. The materialwith the highest n(98Mo)/n(95Mo) ratio is ocean water, which is homogeneous in isotopic compositionwithin ±0.1 ‰, and Siebert et al. [131] have recommended that the Mo isotope scale be anchored byassigning a δ(98Mo) value of 0 ‰ to ocean water because no internationally distributed isotopic refer-ence material is available for Mo. The material with the lowest n(98Mo)/n(95Mo) ratio is the crust of aferromanganese deep-sea nodule with a δ(98Mo) value of –3.1 ‰ relative to Mo in ocean water [131].The reported isotopic variation is within the atomic-weight uncertainty.
© 2002 IUPAC, Pure and Applied Chemistry 74, 1987–2017
Isotope-abundance variations 2009
Palladium 46Pd Ar(Pd) = 106.42(1)
Isotope Atomic mass Mole fraction in a sample from Sudbury, Ontario [2,132]
102Pd 101.905 607(3) u 0.0102(1)104Pd 103.904 034(5) u 0.1114(8)105Pd 104.905 083(5) u 0.2233(8)106Pd 105.903 484(5) u 0.2733(3)108Pd 107.903 895(4) u 0.2646(9)110Pd 109.905 153(12) u 0.1172(9)
Shima et al. [132] analyzed samples from Sudbury, Ontario, Canada (containing a mass fraction of 0.25mg/kg Pd) and from the western Bushveld Igneous Complex in South Africa at Lonrho (containing amass fraction of 7.7 mg/kg Pd). Although Shima et al. found no variation in isotopic composition inthese terrestrial samples, Mermelengas et al. [133] reported evidence of isotope fractionation in a pre-cious metal concentrate from the Atok mine in South Africa. A concentrate from a second mine, alsofrom the Bushveld Complex, was not isotopically fractionated. Rosman et al. [134] reanalyzed thesesamples together with another four mineral concentrates and one highly refined sample of palladiummetal (Table 1).
Rosman et al. [134] confirmed that palladium samples with higher atomic weights are present inthe Atok mine, which is located in the eastern part of the Bushveld complex. No enrichment was foundin other samples, which all come from the western part of the Bushveld Complex. Rosman et al. con-cluded that isotope fractionation in the Atok mine sample was produced by natural geochemicalprocesses rather than by industrial processing or purification.
T. B. COPLEN et al.
© 2002 IUPAC, Pure and Applied Chemistry 74, 1987–2017
2010
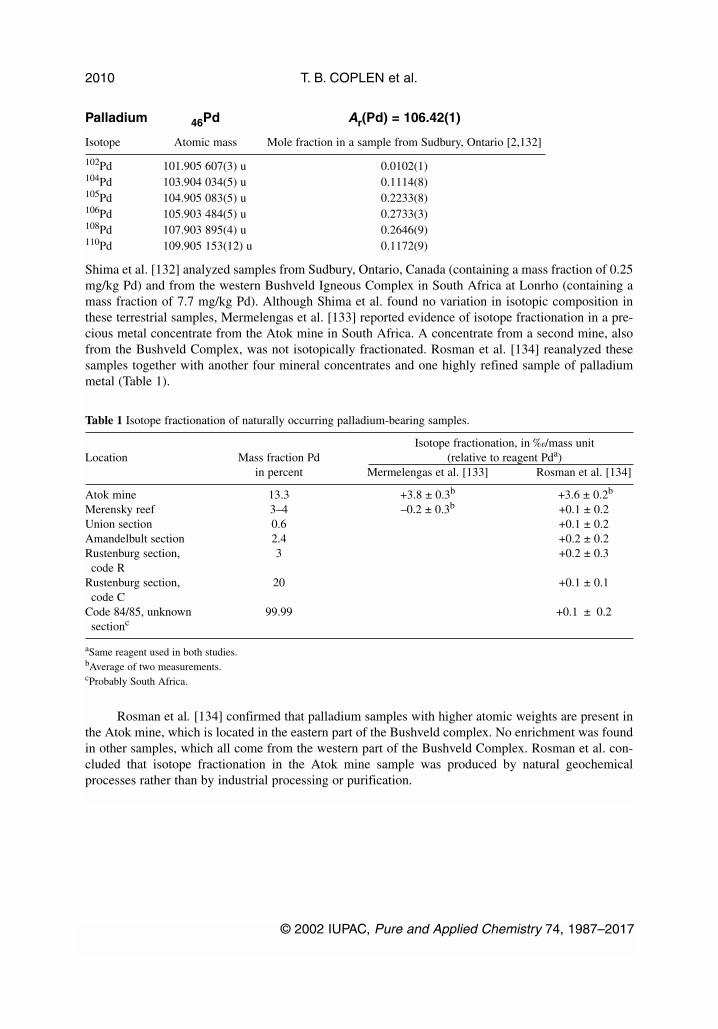
Table 1 Isotope fractionation of naturally occurring palladium-bearing samples.
Isotope fractionation, in ‰/mass unitLocation Mass fraction Pd (relative to reagent Pda)
in percent Mermelengas et al. [133] Rosman et al. [134]
Atok mine 13.3 +3.8 ± 0.3b +3.6 ± 0.2b
Merensky reef 3–4 –0.2 ± 0.3b +0.1 ± 0.2Union section 0.6 +0.1 ± 0.2Amandelbult section 2.4 +0.2 ± 0.2Rustenburg section, 3 +0.2 ± 0.3code R
Rustenburg section, 20 +0.1 ± 0.1code C
Code 84/85, unknown 99.99 +0.1 ± 0.2sectionc
aSame reagent used in both studies.bAverage of two measurements.cProbably South Africa.
Tellurium 52Te Ar(Te) = 127.60(3)
Isotope Atomic mass Mole fraction in a naturally occurring sample [2,135]
120Te 119.904 026(11) u 0.000 96(1)122Te 121.903 0558(29) u 0.026 03(1)123Te 122.904 2711(20) u 0.009 08(1)124Te 123.902 8188(16) u 0.048 16(2)125Te 124.904 4241(20) u 0.071 39(2)126Te 125.903 3049(20) u 0.189 52(4)128Te 127.904 4615(19) u 0.316 87(4)130Te 129.906 2229(21) u 0.337 99(3)
Few determinations of Te isotopic composition in materials of natural terrestrial origin have been per-formed [135,136]. Furthermore, absolute isotope-ratio measurements have not been conducted on aspecimen used in relative isotope-ratio investigations. The reported maximum range of δ (130Te) values,which are based on n(130Te)/n(122Te) measurements, is 4 ‰, the ranges being similar for natural tel-luride minerals, native Te, and commercial K2TeO3 [136]. A kinetic isotope effect k122/k130, as high as1.008, has been obtained during TeO3
2– reduction. If tellurite (TeO32–) with Ar(Te) = 127.603 were
reduced with this k122/k130 value, the initial Te0 product would have Ar(Te) = 127.58. By analogy withS and Se, the natural variation in Te isotope abundances, because of mass fractionation, probably ishigher than reported here.
In contrast to mass fractionation effects, highly anomalous Te isotope abundances have beenfound near the Oklo natural fission reactor in Gabon [137,138]. Thus, Ar(Te) is highly variable and thisvariability is dependent upon many factors, such as the amount of fissiogenic Te present, neutron cap-ture reactions involving Te nuclei, and the migration (retention) of precursor nuclei. For example, therange reported for the ratio n(fission product 125,128,130Te)/n(primordial Te) for Zone 9 at Oklo was 81to 190 [138]. The maximum corresponds to a mole fraction of 130Te of about 0.8 as compared to 0.34found for the “normal” abundance. Fission product Te isotopes increase Ar(Te), so that Ar(Te) is greaterthan 129.
Thallium 81Tl Ar(Tl) = 204.3833(2)
Isotope Atomic mass Mole fraction in NIST SRM 997 elemental Tl [2,139]
203Tl 202.972 329(3) u 0.295 24(9)205Tl 204.974 412(3) u 0.704 76(9)
The basis for relative isotope-ratio measurements of Tl is the NIST isotopic reference material SRM997 elemental Tl metal, with an assigned δ (205Tl) value of 0 ‰. Development of multiple collectorinductively coupled plasma mass spectrometry has improved Tl isotope-ratio measurements substan-tially; isotope ratios can be determined with a 1-σ standard deviation of better than ±0.05 ‰ [140].The range in δ (205Tl) of natural terrestrial materials is 1.6 ‰ (Fig. 15). The δ (205Tl) of igneous rocksranges from –0.18 ‰ to +0.35 ‰, based on analysis of seven terrestrial samples [140]. The lowest205Tl content in the literature of a material of natural terrestrial origin [δ (205Tl) = –0.18 ‰] is foundin a volcanic rhyolite in the East Rift Zone of Iceland [140]. For this sample, the mole fraction of 205Tlis 0.704 72 and Ar(Tl) = 204.383 24. The δ (205Tl) values of crusts of ferromanganese deep-sea nod-ules range from +0.33 to +1.43 ‰ [140,141]. High δ (205Tl) values (+1.31 to +1.43 ‰) were foundin ferromanganese crusts of samples collected from the Southern Atlantic Ocean, the Indian Ocean,and the central Pacific Ocean [141]. The value of +1.43 ‰ is the highest δ (205Tl) value in the liter-ature of a material of natural terrestrial origin. For this sample, the mole fraction of 205Tl is 0.705 06and Ar(Tl) = 204.383 91.
© 2002 IUPAC, Pure and Applied Chemistry 74, 1987–2017
Isotope-abundance variations 2011
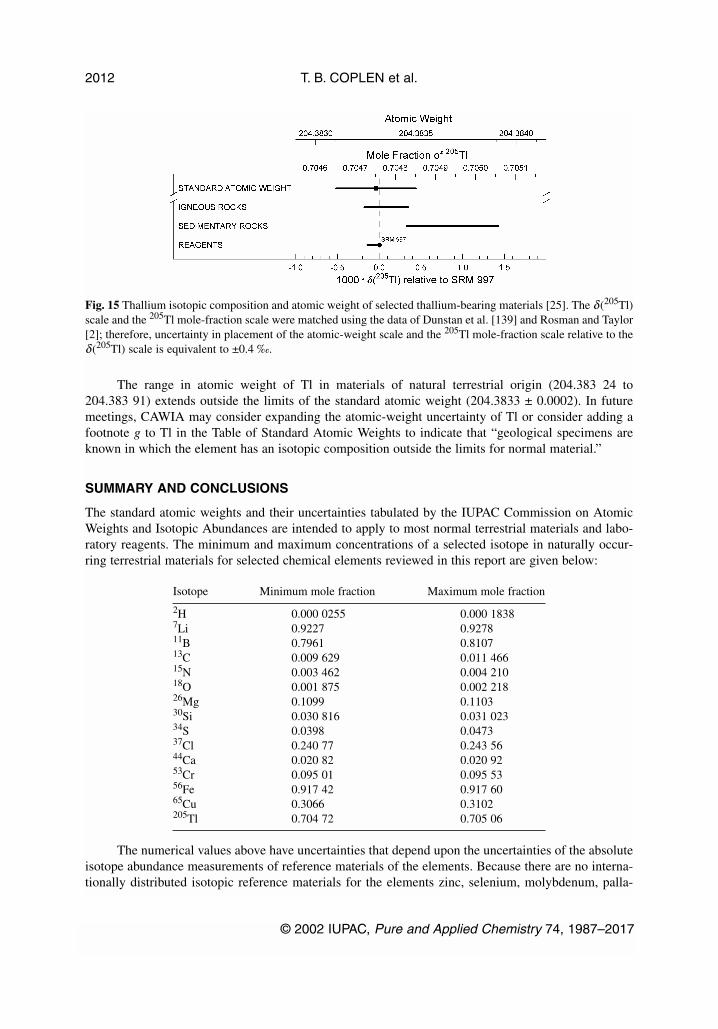
The range in atomic weight of Tl in materials of natural terrestrial origin (204.383 24 to204.383 91) extends outside the limits of the standard atomic weight (204.3833 ± 0.0002). In futuremeetings, CAWIA may consider expanding the atomic-weight uncertainty of Tl or consider adding afootnote g to Tl in the Table of Standard Atomic Weights to indicate that “geological specimens areknown in which the element has an isotopic composition outside the limits for normal material.”
SUMMARY AND CONCLUSIONS
The standard atomic weights and their uncertainties tabulated by the IUPAC Commission on AtomicWeights and Isotopic Abundances are intended to apply to most normal terrestrial materials and labo-ratory reagents. The minimum and maximum concentrations of a selected isotope in naturally occur-ring terrestrial materials for selected chemical elements reviewed in this report are given below:
Isotope Minimum mole fraction Maximum mole fraction
2H 0.000 0255 0.000 18387Li 0.9227 0.927811B 0.7961 0.810713C 0.009 629 0.011 46615N 0.003 462 0.004 21018O 0.001 875 0.002 21826Mg 0.1099 0.110330Si 0.030 816 0.031 02334S 0.0398 0.047337Cl 0.240 77 0.243 5644Ca 0.020 82 0.020 9253Cr 0.095 01 0.095 5356Fe 0.917 42 0.917 6065Cu 0.3066 0.3102205Tl 0.704 72 0.705 06
The numerical values above have uncertainties that depend upon the uncertainties of the absoluteisotope abundance measurements of reference materials of the elements. Because there are no interna-tionally distributed isotopic reference materials for the elements zinc, selenium, molybdenum, palla-
T. B. COPLEN et al.
© 2002 IUPAC, Pure and Applied Chemistry 74, 1987–2017
2012
Fig. 15 Thallium isotopic composition and atomic weight of selected thallium-bearing materials [25]. The δ(205Tl)scale and the 205Tl mole-fraction scale were matched using the data of Dunstan et al. [139] and Rosman and Taylor[2]; therefore, uncertainty in placement of the atomic-weight scale and the 205Tl mole-fraction scale relative to theδ(205Tl) scale is equivalent to ±0.4 ‰.
dium, and tellurium, ranges in isotopic composition are not listed for these elements even though rangesmay be measurable with state-of-the-art mass spectrometry. Two chemical elements, chromium andthallium, have isotope-abundance variations in materials of natural terrestrial origin that may exceedatomic-weight uncertainties.
Preparation of isotopic reference materials for the elements zinc, selenium, molybdenum, palla-dium, and tellurium would improve comparability of isotope-ratio measurements among laboratories.In addition, IUPAC may consider preparation of guidelines for reporting relative isotope-abundanceratios of iron and calcium with respect to existing reference materials, such as IRMM-014 elementaliron and SRM 915a calcium carbonate.
ACKNOWLEDGMENTS
Assistance from Masako Shima is acknowledged and gratefully appreciated. The authors are indebtedto Prof. D. J. DePaolo (University of California, Berkeley, California) for Ca isotope-ratio measure-ments of NIST SRM 915 and SRM 915a CaCO3 that allow us to correlate the δ(44Ca) scale to theabsolute 44Ca scale. Prof. John de Laeter, Ms. Haiping Qi, and Ms. Kathryn Plummer are thanked fortheir comments on this manuscript. Mr. Jerry Keybl is thanked for manuscript preparation assistance.Prof. M. Whiticar is thanked for the isotope data and citations he provided for this project. Ms. IreneHamblen, Ms. Margery Shapira, Ms. Shalini Mohleji, and Ms. Michelle Gendron are commended forextensive library work and extensive data tabulation efforts.
REFERENCES
1. T. B. Coplen. Pure Appl. Chem. 73, 667–683 (2001).2. K. J. R. Rosman and P. D. P. Taylor. Pure Appl. Chem. 70, 217–235 (1998).3. H. S. Peiser, N. E. Holden, P. De Bièvre, I. L. Barnes, R. Hagemann, J. R. de Laeter, T. J. Murphy,
E. Roth, M. Shima, H. G. Thode. Pure Appl. Chem. 56, 695–768 (1984).4. J. R. de Laeter, J. K. Böhlke, P. De Bièvre, H. Hidaka, H. S. Peiser, K. J. R. Rosman, P. D. P.
Taylor. “The Atomic Weights of the Elements, Review 2000”, Pure Appl. Chem. (2003). In press.5. G. Audi and A. H. Wapstra. Nucl. Phys. A565, 1–65 (1993).6. International Organization for Standardization. ISO–31–0, Quantities and Units, Part 0, General
Principles, Subclause 2.3.3, Geneva, International Organization for Standardization (1992).7. T.-L. Chang, M.-T. Zhao, W. Li, J. Wang, Q.-Y. Qian. Int. J. Mass Spectrom. 208, 113–118
(2001).8. M. E. Wieser and J. R. de Laeter. Int. J. Mass Spectrom. 197, 253–261 (2000).9. M. A. McKibben and C. S. Eldridge. “S isotopic effects in sulfur transformation: SHRIMP micro-
analysis of δ34S zoning in pyrite from sedimentary and hydrothermal settings”, Paper 101 of ACSDivision of Geochemistry, 208th ACS National Meeting, 21–25 August 1994, Washington, DC(1994).
10. R. Hagemann, G. Nief, E. Roth. Tellus 22, 712–715 (1970).11. T. B. Coplen. Pure Appl. Chem. 66, 273–276 (1994).12. R. Gonfiantini, W. Stichler, K. Rozanski. In Reference and Intercomparison Materials for Stable
Isotopes of Light Elements, pp. 13–29, International Atomic Energy Agency, Vienna, IAEA-TEC-DOC-825 (1995).
13. R. M. Parr and S. A. Clements. Intercomparison of Enriched Stable Isotope Reference Materialsfor Medical and Biological Studies, Vienna, International Atomic Energy Agency, NAHRES-5(1991).
14. I. Friedman and J. R. O’Neil. Handbook of Geochemistry II–1, K. H. Wedepohl (Ed.), pp. 1B1–1B8, Springer-Verlag, Berlin (1978).
© 2002 IUPAC, Pure and Applied Chemistry 74, 1987–2017
Isotope-abundance variations 2013
15. J. Hoefs. Stable Isotope Geochemistry 3rd ed., Springer-Verlag, New York (1987).16. I. Friedman and J. R. O’Neil. U.S. Geological Survey Professional Paper 440–KK, Data of
Geochemistry, 6th ed., Chapter KK (1977).17. R. E. Criss. Principles of Stable Isotope Distribution, Oxford University Press, Oxford (1999).18. J. W. Valley and D. R. Cole (Eds.). Stable Isotope Geochemistry, Mineralogical Society of
America, Rev. Mineral. Geochem. 43, 662 (2001). 19. J. Jouzel, C. Lorius, J. R. Petit, C. Genthon, N. I. Barkov, V. M. Kotlyakov, V. M. Petrov. Nature
329, 403–408 (1987).20. J. Ch. Fontes and R. Gonfiantini. Earth Planet. Sci. Lett. 3, 258–266 (1967).21. E. Roth. Compt. Rend. Acad. Sci., Paris 242, 3097–3100 (1956).22. G. J. Martin, C. Guillou, M. L. Martin, M.-T. Cabanis, J. Aerny. J. Agric. Food Chem. 36,
316–322 (1988).23. R. M. Coveney, Jr., E. D. Goebel, E. J. Zeller, G. A. M. Dreschhoff, E. E. Angino. Bull. Am.
Assoc. Pet. Geol. 71, 39–48 (1987).24. B. Gonsior, I. Friedman, G. Lindenmayr. Tellus 18, 256–261 (1966).25. T. B. Coplen, J. A. Hopple, J. K. Böhlke, H. S. Peiser, S. E. Rieder, H. R. Krouse, K. J. R.
Rosman, T. Ding, R. D. Vocke, Jr., K. M. Révész, A. Lamberty, P. Taylor, P. De Bièvre.“Compilation of minimum and maximum isotope ratios of selected elements in naturally occur-ring terrestrial materials and reagents”, U.S. Geological Survey Water-Resources InvestigationsReport 01-4222 (2002).
26. H. P. Qi, P. D. P. Taylor, M. Berglund, P. De Bièvre. Int. J. Mass Spectrom. Ion Proc. 171,263–268 (1997).
27. T. B. Coplen. Pure Appl. Chem. 68, 2339–2359 (1996).28. J. M. Edmond, C. Measures, R. E. McDuff, L. H. Chan, R. Collier, B. Grant, L. I. Gordon, J. B.
Corliss. Earth Planet. Sci. Lett. 46, 1–18 (1979).29. L.-H. Chan, J. M. Edmond, G. Thompson, K. Gillis. Earth Planet. Sci. Lett. 108, 151–160 (1992).30. H. P. Qi, T. B. Coplen, Q. Zh. Wang, Y. H. Wang. Anal. Chem. 69, 4076–4078 (1997).31. C.-F. You and L.-H. Chan. Geochim. Cosmochim. Acta 60, 909–915 (1996).32. E. J. Catanzaro, C. E. Champion, E. L. Garner, G. Marinenko, K. M. Sappenfield, W. R. Shields.
NBS Special Publication 260-17, U.S. Printing Office, Washington, DC (1970).33. IRMM, Certificate, spike isotopic reference material IRMM-610, Institute for Reference
Materials and Measurements, Geel, Belgium (2001).34. NIST, Certificate of Analysis, Standard Reference Material 952 Enriched Boric Acid Standard,
National Institute Standards and Technology, Gaithersburg, Maryland (1999).35. S. Tonarini, M. Pennisi, A. Adorni-Braccesi, A. Dini, G. Ferrara, R. Gonfiantini, M. Gröning, M.
Wiedenbeck. “Intercomparison of boron stable isotope measurements”, Geostandards Newsletter.In press.
36. R. L. Bassett. Appl. Geochem. 5, 541–554 (1990).37. U. S. Klötzli. Chem. Geol. 101, 111–122 (1992).38. A. Vengosh, A. Starinsky, Y. Kolodny, A. R. Chivas, M. Raab. Geology 20, 799–802 (1992).39. H. P. Schwarcz, E. K. Agyei, C. C. McMullen. Earth Planet. Sci. Lett. 6, 1–5 (1969).40. G. Wang and Y. K. Xiao. Rock Miner. Anal. 19, 169–172 (2000).41. A. Vengosh, A. R. Chivas, M. T. McCulloch, A. Starinsky, Y. Kolodny. Geochim. Cosmochim.
Acta 55, 2591–2606 (1991).42. T. L. Chang and W. Li. Chin. Sci. Bull. 35, 290–296 (1990).43. IUPAC Commission on Atomic Weights and Isotopic Abundances. Pure Appl. Chem. 66,
2423–2444 (1994).44. G. E. Claypool, C. N. Threlkeld, P. N. Mankiewicz, M. A. Arthur, T. F. Anderson. Initial Reports
of the Deep Sea Drilling Project 84, 683–691 (1995).
T. B. COPLEN et al.
© 2002 IUPAC, Pure and Applied Chemistry 74, 1987–2017
2014
45. M. Elvert, E. Suess, J. Greinert, M. J. Whiticar. “Archaea mediating anaerobic methane oxidationin deep-sea sediments at cold seeps of the eastern Aleutian subduction zone”, Org. Geochem. 31,1175–1187 (2000).
46. G. Junk and H. J. Svec. Geochim. Cosmochim. Acta 14, 234–243 (1958).47. A. Mariotti. Nature 303, 685–687 (1983).48. J. K. Böhlke and T. B. Coplen. In Reference and Intercomparison Materials for Stable Isotopes
of Light Elements, pp. 51–66, International Atomic Energy Agency, Vienna, TECDOC-825(1995).
49. R. Létolle. In Handbook of Environmental Isotope Geochemistry, Volume 1, The TerrestrialEnvironment, A, P. Fritz and J. Ch. Fontes (Eds.), pp. 407–433, Elsevier, Amsterdam (1980).
50. T. H. E. Heaton. Chem. Geol. 59, 87–102 (1986).51. H. Hübner. In Handbook of Environmental Isotope Geochemistry, Vol. 2, The Terrestrial
Environment, B, P. Fritz and J. Ch. Fontes (Eds.), pp. 361–425, Elsevier, Amsterdam (1986).52. N. J. P. Owens. Adv. Mar. Biol. 24, 389–451 (1987).53. W. C. White and H. Yagoda. Science 111, 307–308 (1950).54. F. Wlotzka. In Handbook of Geochemistry II–1, K. H. Wedepohl (Ed.), pp. 7B1–7B9, Springer-
Verlag, Berlin (1972).55. H. D. Freyer, K. Kobel, R. J. Delmas, D. Kley, M. R. Legrand. Tellus 48B, 93–105 (1996).56. E. Wada, R. Shibata, T. Torii. Nature 292, 327–329 (1981).57. J. K. Böhlke, R. L. Smith, K. M. Revesz, T. Yoshinari. EOS, Trans. Am. Geophys. Union 81, S186
(2000).58. R. D. Hauck and J. M. Bremner. Adv. Agron. 28, 219–266 (1976).59. C. Van Kessel and J. P. Roskoski. Plant Soil 111, 17–23 (1988).60. W. Li, B. Ni, D. Jin, T. L. Chang. Kexue Tongbao 33, 1610–1613 (1988).61. P. Baertschi. Earth Planet. Sci. Lett. 31, 341–344 (1976).62. H.-L. Schmidt, R. A. Werner, A. Roßmann. Phytochem. 58, 9–32 (2001).63. M. Dole, G. A. Lange, D. P. Rudd, D. A. Zaukelies. Geochim. Cosmochim. Acta 6, 65–78 (1954).64. H. A. J. Meijer and W. J. Li. Isot. Environ. Health Stud. 34, 349–369 (1998).65. T. K. Kyser. In Stable Isotopes in High Temperature Geological Processes, Reviews of
Mineralogy, Vol. 16, J. W. Valley, H. P. Taylor, Jr., J. R. O’Neil (Eds.), pp. 141–164,Mineralogical Society of America, Washington, DC (1986).
66. M. H. Thiemens, T. L. Jackson, C. A. M. Brenninkmeijer. Geophys. Res. Lett. 22, 255–257(1995).
67. M. H. Thiemens. Science 293, 226 (2001).68. Y. Q. Gao and R. A. Marcus. Science 293, 259–263 (2001).69. H. Bao, M. H. Thiemens, J. Farquhar, D. A. Campbell, C. C.-H. Lee, K. Heine, D. B. Loope.
Nature 406, 176–178 (2000).70. L. Aldaz and S. Deutsch. Earth Planet. Sci. Lett. 3, 267–274 (1967).71. T. Yoshinari, M. A. Altabet, S. W. A. Naqvi, L. Codispoti, A. Jayakumar, M. Kuhland, A. Devol.
Mar. Chem. 56, 253–264 (1997).72. E. J. Catanzaro, T. J. Murphy, E. L. Garner, W. R. Shields. J. Res. Natl. Bur. Stand. (U.S.) 70A,
453–458 (1966).73. A. C. Daughtry, D. Perry, M. Williams. Geochim. Cosmochim. Acta 26, 857–866 (1962).74. E. J. Catanzaro and T. J. Murphy. J. Geophys. Res. 71, 1271–1274 (1966).75. V. T.-C. Chang, A. Galy, R. K. O’Nions. In Eleventh Annual V. M. Goldschmidt Conference,
Abstract 3426: LPI Contribution No. 1088, Lunar and Planetary Institute, Houston (CD-ROM)(2001).
76. A. Galy, M. Bar-Matthews, L. Halicz, R. K. O’Nions. Cambridge Publications, J. Conf. Abstr. 5(2), 422 (2000).
77. P. De Bièvre, S. Valkiers, H. S. Peiser. J. Res. Natl. Inst. Stand. Technol. 99, 201–202 (1994).
© 2002 IUPAC, Pure and Applied Chemistry 74, 1987–2017
Isotope-abundance variations 2015
78. T. Ding, S. Jiang, D. Wan, Y. Li, J. Li, H. Song, Z. Liu, X. Yao. Silicon Isotope Geochemistry,Geological Publishing House, Beijing, China (1996).
79. C. B. Douthitt. Geochim. Cosmochim. Acta 46, 1449–1458 (1982).80. T. Ding, D. Wan, J. Li, S. Jiang, H. Song, Y. Li, Z. Li. Kuangchang Dizhi (Mineral Deposits) 7,
90–95 (1988).81. T. Ding, S. Valkiers, H. Kipphardt, P. De Bièvre, P. D. P. Taylor, R. Gonfiantini, H. R. Krouse.
Geochim. Cosmochim. Acta 65, 2433–2437 (2001).82. G. Beaudoin, B. E. Taylor, D. Rumble III, M. Thiemens. Geochim. Cosmochim. Acta 58,
4253–4255 (1994). 83. J. Farquhar, H. Bao, M. Thiemens. Science 289, 756–758 (2000).84. D. Rumble, A. Bekker, J. Farquhar, H. D. Holland, G. Hu, S. Maruyama, S. Ono, H. Ohmoto, M.
Rosing, Y. Ueno, P. Wang, B. A. Wing. EOS, Transactions of the American Geophysical Union,Spring Meeting Supplement Abstract V41A-02, 83, S373 (2002).
85. K. U. Weyer, H. R. Krouse, W. C. Horwood. In Isotope Hydrology 1978, Vol. 1, pp. 251–264,International Atomic Energy Agency, Vienna (1979).
86. M. D. Rudnicki, H. Elderfield, B. Spiro. Geochim. Cosmochim. Acta 65, 777–789 (2001).87. H. R. Krouse, H. M. Brown, R. B. Farquharson. Can. J. Earth Sci. 14, 787–793 (1977).88. N. V. Veselovsky, A. L. Rabinovitch, V. S. Putintseva. Gidrokhim. Mater. 51, 112–119 (1969).89. H. Nielsen. In Stable Isotopes: Natural and Anthropogenic Sulphur in the Environment, H. R.
Krouse and V. A. Grinenko (Eds.), pp. 65–67, John Wiley, New York (1991).90. W. R. Shields, T. J. Murphy, E. L. Garner, V. H. Dibeler. J. Am. Chem. Soc. 84, 1519–1522 (1962). 91. Y. Xiao, Y. Zhou, Q. Wang, H. Wei, W. Liu, C. J. Eastoe. Chem. Geol. 182, 655–661 (2002).92. R. S. Kaufmann, A. Long, D. J. Campbell. Am. Assoc. Petrol. Geol. Bull. 72, 839–844 (1988).93. Y. K. Xiao, Y. M. Zhou, W. G. Liu, A. S. Hong, Q. Z. Wang, H. Z. Wei, P. V. Shirodkar. “The
character of chlorine isotopic compositions in ocean water (in Chinese)”, Geol. Rev. 48 (suppl.).In press.
94. D. E. Desaulniers, R. S. Kaufmann, J. A. Cherry, H. W. Bentley. Geochim. Cosmochim. Acta 50,1757–1764 (1986).
95. R. S. Kaufmann, S. K. Frape, R. H. McNutt, C. Eastoe. Appl. Geochem. 8, 403–408 (1993).96. A. Vengosh, A. R. Chivas, M. T. McCulloch. Chem. Geol. 79, 333–343 (1989).97. N. Tanaka and D. Rye. Nature 23, 707 (1991).98. R. Aravena, S. K. Frape, B. J. Moore, E. M. Van Warmerdam, R. J. Drimmie. In Isotopes in Water
Resources Management, pp. 31–42, International Atomic Energy Agency, Vienna (1996).99. B. Ransom, A. J. Spivack, M. Kastner. Geology 23, 715–718 (1995).
100. A. J. Magenheim, A. J. Spivack, P. J. Michael, J. M. Gieskes. Earth Planet. Sci. Lett. 131,427–432 (1995).
101. L. J. Moore and L. A. Machlan. Anal. Chem. 44, 2291–2296 (1972). 102. P. Zhu and D. Macdougall. Geochim. Cosmochim. Acta 62, 1691–1698 (1998). 103. J. Skulan, D. J. DePaolo, T. L. Owens. Geochim. Cosmochim. Acta 61, 2505–2510 (1997). 104. L. Halicz, A. Galy, N. S. Belshaw, R. K. O’Nions. J. Anal. Atom. Spectrom. 14, 1835–1838
(1999).105. J. Skulan and D. J. DePaolo. Proc. Natl. Acad. Sci. U.S.A. 96, 13709–13713 (1999). 106. W. A. Russell, D. A. Papanastassiou, T. A. Tombrello. Geochim. Cosmochim. Acta 42, 1075–1090
(1978).107. W. R. Shields, T. J. Murphy, E. J. Catanzaro, E. L. Garner. J. Res. Nat. Bur. Stand. (U.S.) 70A,
193–197 (1966). 108. A. S. Ellis, T. M. Johnson, T. D. Bullen. Science 295, 2060–2062 (2002).109. P. D. P. Taylor, R. Maeck, P. De Bièvre. Int. J. Mass Spectrom. Ion Proc. 121, 111–125 (1992).110. T. D. Bullen and P. M. McMahon. EOS, Trans. Amer. Geophys. Union 78, S173 (1997).111. A. D. Anbar. EOS, Trans. Am. Geophys. Union 82, 173–179 (2001).
T. B. COPLEN et al.
© 2002 IUPAC, Pure and Applied Chemistry 74, 1987–2017
2016
112. P. R. Dixon, D. R. Janecky, R. E. Perrin, D. J. Rokop, P. L. Unkefer, W. D. Spall. In Water-RockInteraction, Vol. 2, Moderate and High Temperature Environments, Y. K. Kharaka and A. S.Maest (Eds.), pp. 915–918, A. A. Balkema, Rotterdam, Netherlands (1992).
113. B. L. Beard and C. M. Johnson. Geochim. Cosmochim. Acta 63, 1653–1660 (1999).114. T. Walczyk. Fresenius’ J. Anal. Chem. 370, 444–453 (2001).115. B. L. Beard, C. M. Johnson, L. Cox, H. Sun, K. H. Nealson, C. Aguilar. Science 285, 1889–1892
(1999).116. W. R. Shields, T. J. Murphy, E. L. Garner. J. Res. Natl. Bur. Stand. (U.S.) 68A, 593–599 (1964). 117. W. R. Shields, S. S. Goldich, E. L. Garner, T. J. Murphy. J. Geophys. Res. 70, 479–491 (1965).118. J. A. Walder and P. A. Freedman. J. Anal. Atom. Spectrom. 7, 571–575 (1992). 119. C. N. Maréchal, P. Télouk, F. Albarède. Chem. Geol. 156, 251–273 (1999). 120. X. K. Zhu, R. K. O’Nions, Y. Guo, N. S. Belshaw, D. Rickard. Chem. Geol. 163, 139–149 (2000). 121. N. H. Gale, A. P. Woodhead, Z. A. Stos-Gale, A. Walder, I. Bowen. Int. J. Mass Spectrom. 184,
1–9 (1999). 122. K. J. R. Rosman. Geochim. Cosmochim. Acta 36, 801–819 (1972). 123. M. Wachsmann and K. G. Heumann. Adv. Mass Spectrom. 11B, 1828–1829 (1989). 124. H. R. Krouse and H. G. Thode. Can. J. Chem. 40, 367–375 (1962).125. C. E. Rees and H. G. Thode. Can. J. Chem. 44, 419–427 (1966).126. K. Rashid and H. R. Krouse. Can. J. Chem. 63, 3195–3199 (1985).127. T. M. Johnson, M. J. Herbel, T. D. Bullen, P. T. Zawislanski. Geochim. Cosmochim. Acta 63,
2775–2783 (1999).128. M. J. Herbel, T. M. Johnson, R. S. Oremland, T. D. Bullen. Geochem. Cosmochim. Acta 64,
3701–3709 (2000).129. T. M. Johnson, T. D. Bullen, P. T. Zawislanski. Environ. Sci. Technol. 34, 2075–2079 (2000).130. L. J. Moore, L. A. Machlan, W. R. Shields, E. L. Garner. Anal. Chem. 46, 1082–1089 (1974).131. C. Siebert, T. F. Nägler, F. von Blankenburg, J. D. Kramers. EOS, Trans. Am. Geophys. Union 82,
F1324–F1325 (2001).132. M. Shima, C. Rees, H. G. Thode. Can. J. Phys. 56, 1333–1339 (1978).133. N. Mermelengas, K. J. R. Rosman, J. R. de Laeter. Int. J. Mass Spectrom. Ion Phys. 37, 1–11
(1981).134. K. J. R. Rosman, J. R. de Laeter, N. Kempt. Int. J. Mass Spectrom. Ion Proc. 93, 107–114 (1989).135. C. L. Smith, K. J. R. Rosman, J. R. de Laeter. Int. J. Mass Spectrom. Ion Phys. 28, 7–17 (1978).136. M. R. Smithers and H. R. Krouse. Can. J. Chem. 46, 583–591 (1968).137. R. D. Loss, J. R. de Laeter, K. J. R. Rosman, T. M. Benjamin, D. B. Curtis, A. J. Gancarz, J. E.
Delmore, W. J. Maeck. Earth Planet. Sci. Lett. 89, 193–206 (1988).138. R. D. Loss, K. J. R. Rosman, J. R. de Laeter, D. B. Curtis, T. M. Benjamin, A. J. Gancarz, W. J.
Maeck, J. E. Delmore. Chem. Geol. 76, 71–84 (1989).139. L. P. Dunstan, J. W. Gramlich, I. L. Barnes, W. C. Purdy. J. Res. Natl. Bur. Stand. (U.S.) 85, 1–10
(1980).140. M. Rehkämper and A. N. Halliday. Geochem. Cosmochim. Acta 63, 935–944 (1999). 141. M. Rehkämper, M. Frank, A. N. Halliday, J. R. Hein. European Union of Geosciences, 11th
Biannual Symposium, Strasbourg, France, Book of Abstracts, p. 689 (2001).
© 2002 IUPAC, Pure and Applied Chemistry 74, 1987–2017
Isotope-abundance variations 2017