influence of temperature and c4 abundance on n-alkane ...polissar/orggeochem/bush--mciner… ·...
TRANSCRIPT
Organic Geochemistry 79 (2015) 65–73
Contents lists available at ScienceDirect
Organic Geochemistry
journal homepage: www.elsevier .com/locate /orggeochem
Influence of temperature and C4 abundance on n-alkane chain lengthdistributions across the central USA
http://dx.doi.org/10.1016/j.orggeochem.2014.12.0030146-6380/� 2014 Elsevier Ltd. All rights reserved.
⇑ Corresponding author at: Dept. of Civil & Environmental Engineering & EarthSciences, University of Notre Dame, 156 Fitzpatrick Hall, Notre Dame, IN 46556,USA. Tel.: +1 (832) 588 7290.
E-mail address: [email protected] (R.T. Bush).
Rosemary T. Bush a,⇑, Francesca A. McInerney a,b
a Dept. of Earth and Planetary Sciences, Northwestern University, 2145 Sheridan Road, Evanston, IL 60208, USAb Sprigg Geobiology Centre, Environment Institute and the School of Earth and Environmental Sciences, University of Adelaide, Adelaide, South Australia 5005, Australia
a r t i c l e i n f o a b s t r a c t
Article history:Received 10 July 2014Received in revised form 24 November 2014Accepted 5 December 2014Available online 16 December 2014
Keywords:Leaf wax n-alkanesTemperaturePaleoclimatePaleoenvironment
The distributions of long chain n-alkanes are often utilized as plant-derived paleoenvironmental proxies.However, there is debate regarding the degree to which photosynthetic pathway, temperature and/orhydrology drive the variation in chain length distribution observed among different environments. Inorder to assess the influence of temperature and photosynthetic pathway on plant n-alkanes, this studyexamined n-alkane chain length distributions in plants and soils along a transect across mid-continentalUSA spanning > 20 �C mean annual temperature with a limited range of mean annual precipitation. Wefound that (i) longer chain length in plants and soils correlated with higher growing season temperature,with relative humidity also a possible driver, (ii) soils exhibited a stronger correlation with temperaturethan did individual plants, which may reflect the averaging of plant input to soils and (iii) average chainlength values in soils did not correlate with the predominance of C4 plants. The data suggest that the spa-tial and temporal variation in chain length distributions observed in studies of sediment archives may bedriven in large part by growing season temperature and/or aridity rather than photosynthetic pathway(C3 or C4). The findings call for further research into the mechanisms and effects of leaf wax compositionon water permeability under different environmental conditions, the relationship between leaf wax n-alkanes and relative humidity, and the incorporation of n-alkanes into soils and sediments.
� 2014 Elsevier Ltd. All rights reserved.
1. Introduction
Long chain n-alkanes (C21–C39) are synthesized as part of theepicuticular leaf wax and are typically long-lived in the sedimen-tary record (Eglinton and Hamilton, 1967). As a result, they serveas plant biomarkers and valuable paleoclimate and paleoenviron-ment proxies. Most paleoenvironmental applications use the stableisotope ratios of n-alkanes (Castañeda and Schouten, 2011; Sachseet al., 2012), but chain length distributions have been hypothesizedto reflect source plant groups or climate drivers such as tempera-ture and aridity (Bush and McInerney, 2013 and referencestherein). Drivers of chain length also form an important part ofconsideration of the stable isotope values from sediment archives,for example when considering different chain lengths contributedby C3 and C4 vegetation (Wang et al., 2013). Data from a broad sur-vey of modern plants do not support a direct link between chainlength and most major terrestrial plant types, with the notable
exceptions of aquatic plants and Sphagnum moss (Bush andMcInerney, 2013). Temperature and aridity have been posited,but much of the evidence relating n-alkane chain length to climatevariables has been relatively indirect, coming from studies ofn-alkanes in atmospheric dust, marine surface sediments, or strati-graphic sections (e.g. Kawamura et al., 2003; Rommerskirchenet al., 2003; Castañeda et al., 2009), with only a few recent studiesdemonstrating correlations between chain length and temperatureor aridity in living plants (Hoffmann et al., 2013; Tipple and Pagani,2013). In studies of sediment archives, shifts in chain length areoften concurrent with large shifts in climate and the local plantcommunity (e.g. Brincat et al., 2000; Schwark et al., 2002), leadingto potential conflation of climate and plant type as the directdriver. Furthermore, although studies have shown that C4 grassesgenerally produce longer chain lengths than C3 grasses(Rommerskirchen et al., 2006b), C4 plants thrive in hot, dry condi-tions while C3 plants are favored by cooler, wetter conditions. Thus,comparison of n-alkanes from C3 and C4 plants can conflate envi-ronment and photosynthetic pathway. In fact, C3 plants from drysavanna environments, where C4 grasses are predominantly found,produce long chain length distributions more similar to those of C4
grasses than C3 plants in wet rainforests (Vogts et al., 2009). The

66 R.T. Bush, F.A. McInerney / Organic Geochemistry 79 (2015) 65–73
correlations between n-alkane chain length from sedimentarchives and shifts in environmental variables are promising, butthe meaning of the shifts is unclear and can only be elucidatedvia tests using modern plants and soils.
The goal of this study was to assess the degree to which temper-ature, relative humidity and C4 abundance correlated withn-alkane chain length concentration and distribution in plantsand soils across a large spatial scale. We sampled 70 sites acrossa ca. 2700 km transect through the central USA, from the Minne-sota–Canada border in the north to the Texas–Mexico border inthe south. In the central US, temperature generally varies along alatitudinal gradient, while precipitation changes with longitude,which allows sampling a large natural temperature gradient whilelargely controlling annual precipitation (Fig. 1). There is also astrong gradient in the proportion of C4 plants through the area,as the proportion of C4 plants increases with decreasing latitude(Teeri and Stowe, 1976; Still et al., 2003). We utilized climate datafrom the PRISM Climate Group (Section 2.4) for temperature andprecipitation measurements and measured carbon isotope valuesof soil organic matter (OM) as a proxy for the proportion of C4
plants (Tieszen et al., 1997). Within this framework, we couldexamine the influence of climate on the concentration and distri-bution of plant-derived n-alkanes, which is crucial for applyingthem as a paleoclimate proxy.
2. Methods
2.1. Samples and locations
Leaf and soil samples were collected in September 2012 from 70locations along a transect from International Falls, Minnesota toBrownsville, Texas (Fig. 1). To minimize soil disturbance and theeffect of human activity, sites were selected in state parks andwildlife management areas. Due to the paucity of protected naturalareas through the central Great Plains, these sites were supple-mented by sampling from small rural cemeteries, which can
Fig. 1. Sample locations (black points) showing (A) mean annual precipitation (MAP) and2010.
provide minimally disturbed areas for native plant species to growin regions otherwise dominated almost exclusively by cultivatedland (Sorensen and Holden, 1974; Gustafson et al., 2005). Naturalarea sites were selected, where possible, to balance accessibilitywith minimizing anthropogenic effects and were typically awayfrom roads and adjacent (5–20 m) to hiking or access trails. Ceme-tery site selection was more limited, but effort was made to locateleast disturbed areas, e.g. oldest, non-mowed and/or perimeter sec-tions and beside (rather than before or behind) visible grave mark-ers. Site information is reported in the Supplementary material(Appendix A). The transect covers a range of 20.2 �C in meanannual temperature and was devised to restrict the variation inannual precipitation as much as possible. The latter ranges from559 to 736 mm, with a mean of 667 mm, but it should be notedthat the seasonality changes from summer-wet at the north endto proportionally more autumn and winter precipitation in thesouth. Sampling sites span from mixed temperate forest in north-ern Minnesota, tall grass and mixed grass prairies through the cen-tral states, to savanna and sub-tropical forest in southernmostTexas.
For soil samples, surface duff (if present) was removed and60 ml soil collected with a hand trowel from 2 to 8 cm depth. Theywere stored in glass jars with a liner of Al foil under the lid andoven dried at 50 �C. Glass jars and foil liners were ashed at420 �C prior to sample collection. Plant samples were collectedand stored in stapled brown paper bags or in a plant press andwere allowed to air dry for several days. Soil samples were sievedthrough 2 mm mesh, and root and stem pieces were removed.
2.2. Lipid extraction and quantification
Lipids were extracted from ca. 5 g soil or 0.1–0.4 g dry leaf sam-ple in 30 ml dichloromethane (DCM):MeOH (9:1 v/v) using micro-wave extraction (MARS-X) with a ramp to 100 �C (held 15 min) andminimum cooling time 30 min. Each total lipid extract was concen-trated under a stream of dry N2. Non-polar lipids, including
(B) mean annual temperature (MAT), using data from PRISM climate normals, 1981–

R.T. Bush, F.A. McInerney / Organic Geochemistry 79 (2015) 65–73 67
n-alkanes, were separated from the polar lipids via short columnsilica gel chromatography, using ca. 1 g activated silica gel in a Pas-teur pipette plugged with glass wool and 4 ml hexane. Polar lipidswere eluted in 4 ml 1:1 DCM:MeOH. Five plant samples requiredfurther separation of saturated from unsaturated non-polar lipidsvia elution through a short column of silica gel with 5% AgNO3
(ca. 1 g), eluting saturated lipids with 4 ml hexane and unsaturatedlipids with 4 ml EtOAc. Saturated lipids were again concentratedvia evaporation with dry N2. Each sample was dissolved in hexaneand an internal standard added (1–10 binaphthyl, 10 ng/ml in hex-ane; Sigma–Aldrich) prior to analysis using gas chromatography–mass spectrometery (GC–MS; Medeiros and Simoneit, 2007). TheGC instrument (Thermo Scientific Trace GC Ultra) was equippedwith a 15 m � 0.25 mm i.d. column (Thermo TR-5 ms SQC) andinterfaced with a quadrupole mass spectrometer for identification(Thermo Scientific DSQII). The samples were simultaneouslyinjected onto a separate column (with the same specifications)via a second inlet in the same GC instrument and analyzed viaflame ionization detection (FID) for abundance. The GC oven tem-perature program was: 100 �C (held 2 min) to 320 �C (held 5 min)at 11 �C/min. Quantification used the internal standard, calibratedto a homologous series of n-alkanes from C21 to C40 (Fluka, Sigma–Aldrich). Sample chain length ranged from C16 to C39. Averagechain length (ACL) was limited to C21 to C39, recognized as beingpredominantly from plants (Bush and McInerney, 2013). It was cal-culated as follows:
ACL ¼ ð21C21 þ 23C23 þ � � � þ 39C39ÞðC21 þ C23 þ � � � þ C39Þ
;
where Cx is the abundance of the chain length with x carbons.Carbon preference index (CPI) was calculated using the abundancesof odd and even chain lengths from C21 to C39, following Marzi et al.(1993):
CPI ¼ ðC21 þ C23 þ � � � þ C37Þ þ ðC23 þ C25 þ � � � þ C39Þ2� ðC22 þ C24 þ � � � þ C38Þ
:
Fig. 2. Soil OC d13C values by latitude (n = 70).
2.3. Soil organic carbon (OC) content and d13C measurements
Sub-samples of sieved soil were ground and treated to removecarbonate using 0.5 N HCl for 1 h, repeated until all carbonatehad been removed (via one additional acid treatment after the lastrinse that generated visible bubbles) and then rinsed with deion-ized water until neutral. Samples were then lyophilized andweighed into Sn boats for analysis of C content and d13C valuesusing an elemental analysis (EA) instrument (Costech AnalyticalTechnologies) coupled via a Conflo IV interface to an isotope ratiomass spectrometry (IRMS) instrument (Thermo Finnigan Delta VPlus) at Northwestern University. EA used an oxidation reactorwith Cr2O3 and silvered Co3O4 at 1020 �C, a reduction reactor withreduced Cu wires at 650 �C and a 4 m chromatography column at65 �C. Isotope values were calibrated using certified standardsincluding Acetanilide #1 and Urea #2 (A. Schimmelmann, IndianaUniversity), IAEA-600 Caffeine and IAEA-CH3 Cellulose. They arereported relative to Vienna Peedee Belemnite (VPDB). Each samplewas run in duplicate at a minimum. Average precision for total OC(TOC) content was better than ± 0.24% (1 r) of measured valuesand average precision for d13C values was ± 0.2‰ (1 r).
2.4. Climate estimates
Temperature and precipitation estimates, including monthly andannual averages for precipitation and for mean, minimum and max-imum temperature, for the contiguous USA come from the PRISMClimate Group climate normals dataset, 1981–2010 (available at
http://www.prism.oregonstate.edu). The PRISM datasets are mod-eled from physiographic data and climate stations across the conter-minous USA at a resolution of 4 km (Daly et al., 2008). Averagerelative humidity (RH) was calculated separately for the months ofJune, July and August as well as annual RH over the same 30 yrperiod using monthly dewpoint temperatures from PRISM:
RH ð%Þ ¼ 100� e
17:269� Td
237:3þ Td
e
17:269� T237:3þ T
;
based on Teten’s formula for vapor pressure, where Td is themonthly dewpoint temperature and T the monthly mean air tem-perature. All data are also provided in the Supplementary material(Appendix A). All analyses were performed with STATA IC 11.1.
3. Results
3.1. Soil TOC and d13C values
TOC (wt%) and d13C values for soil samples (n = 70) are reportedin the Supplementary material (Appendix A). Average TOC was3.1%, ranging from 0.3% to 11.7%. There was no correlation betweenTOC and latitude; d13C values ranged from �29.1‰ to �14.3‰,with the most negative values confined to the northern latitudes,and mixed values at middle and southern latitudes that largelyreflected the input of C4 plants (predominantly grass) to soil OM(Fig. 2). Although fractionation during the decay of soil OM isknown to increase its d13C value with depth (Melillo et al., 1989;Buchmann et al., 1997), leaf litter and soil OM d13C values arehighly correlated (Balesdent et al., 1993). The shallow soil depthat which the samples in this study were collected also minimizedthis potential bias, especially in comparison with the large rangeof measured d13C values. For comparison, Tieszen et al. (1997)reported soil d13C values of ca. �14‰ at 100% C4 cover and ca.�24‰ at 0% C4 cover in a study of Great Plains grasslands.
3.2. n-Alkane concentration and CPI values
Soil n-alkane concentration ranged from 0.4 to 27.5 lg/gsediment (�x = 3.6 lg/g); concentration was much higher in plantsamples, ranging from 61.4 to 7115 lg n-alkane/g dry leaf(�x = 507.2 lg/g). Soil n-alkane content correlated with TOC(log–log regression, R2 0.37, p < 0.001), suggesting that local plantmatter was a source for both n-alkanes and TOC. Although the cor-relation is significant, the low strength likely reflects the multiple

68 R.T. Bush, F.A. McInerney / Organic Geochemistry 79 (2015) 65–73
inputs to soil OM, including microbial and fungal communities,while the long chain n-alkane source is likely almost entirely vas-cular plants. Soil n-alkane content did not significantly correlatewith latitude, mean annual temperature, annual precipitation orsoil d13C value. For soils, CPI values ranged between 2.4 and 10.0(�x = 5.7), well within the range of plant-derived CPI values (Bushand McInerney, 2013). Plant CPI values were between 2.1 and16.7 (�x = 6.3). Mean soil CPI was not significantly different frommean plant CPI in an unpaired Student’s t-test (p 0.091). Soil CPIvalues did not correlate with soil TOC, latitude, mean annual tem-perature, annual precipitation or soil d13C values (for all regres-sions, p > 0.01 and R2 < 0.10). Similarly, plant CPI values did notcorrelate with latitude, mean annual temperature, or mean annualprecipitation (p > 0.01 and R2 < 0.10).
3.3. n-Alkane ACL values and climate
Soil ACL values ranged between 27.6 and 32.8 (�x = 30.3) andplant values between 26.4 and 31.7 (�x = 29.4). Soil values corre-lated significantly with mean annual temperature (Fig. 3, blacksymbols; linear regression R2 0.41, p < 0.001). They also correlatedsignificantly with average seasonal temperature, with seasons cal-culated as an average of three months each: spring (March, April,May), summer (June, July, August), autumn (September, October,November) and winter (December, January, February). Table 1shows the linear regression results for all soils for each season aswell as mean annual temperature, with results separated bywhether soils were collected from cemetery sites or sites in pro-tected natural areas. Linear regression results for plant samples(n = 54) by temperature are also shown in Table 1. For soil samples,regression results were significant for all correlations and summerwas the most strongly correlated of all four seasons (Fig. 3, graysymbols). Across all seasons, and for mean annual temperature,natural area soils correlated more strongly with temperature thancemetery samples. Fig. 4 presents ternary diagrams of soil n-alkanedistributions using C27 and greater, with the sites color coded bymean annual temperature. Two attributes of the relationshipbetween temperature and n-alkane chain length are apparent inFig. 4. First, the increase in relative abundance with increasingtemperature is greater for C33 and C35 than for C31, likely becauseC31 is relatively abundant compared with the longer chain lengths.Second, the increase in ACL with increasing temperature is the
Fig. 3. ACL of soil n-alkanes, plotted by mean annual temperature (black points) and meSolid lines are linear regression lines for all ACL data vs. mean annual temperature (blackand filled circles are samples from protected natural areas.
result of a shift in the entire range of chain length, rather than pro-portional changes in one or two chain lengths.
Fig. 5A shows plant ACL values vs. mean annual temperature forplants, showing the general increase in ACL values with increasingtemperature but also the large range of ACL values for plants at thesame temperature. Regression results for all plant measurementswere only significant (p < 0.005) for summer temperature (Table 1),and to test whether there are trends within species, Fig. 5B showsACL values vs. summer temperature only for plant species or gen-era with two or more measurements. However, given the smallsample size (2–6) there was no significant correlation within spe-cies. When plant ACL values were averaged by site for the 14 siteswith more than one plant measurement, site-averaged ACL valuescorrelated with mean summer temperature (Fig. 5C). In linearregressions, site-averaged ACL values correlated with mean annualtemperature (R2 0.44, p 0.010) and mean summer temperature (R2
0.55, p 0.003). The strength of each of the regressions was similarto those between mean annual and summer temperature and soilACL values, and the reduced significance was due to the reducedsample size.
Although we restricted annual precipitation, the seasonal dis-tribution of precipitation varied across the transect, with north-ern sites receiving more summer precipitation than southernsites, so we also tested for correlations between ACL valuesand precipitation. ACL values did not correlate with annual pre-cipitation for either soils or plants. Soil and plant ACL values alsodid not correlate with summer precipitation (June, July, August)when controlling for summer temperature. A similar lack of cor-relation between ACL values and precipitation existed for allother seasons (not reported). Relative humidity (values calcu-lated only for annual and summer months) generally correlatednegatively with mean temperature except for the most southernsites, which were near enough to the Gulf of Mexico to receivecoastal moisture. We also tested soil ACL values against temper-ature, precipitation and relative humidity as partial correlations,where ACL values were correlated with one climate variablewhile controlling for the other two variables. This was done forsummer and annual mean climate values. The partial correlationresults show that temperature was consistently the strongest dri-ver, having the largest correlation coefficients, and was the onlysignificant driver with the exception of annual values of relativehumidity (Table 2).
an temperature of summer months (average of June, July and August, gray points).) and summer temperature (gray). Open circles represent samples from cemeteries
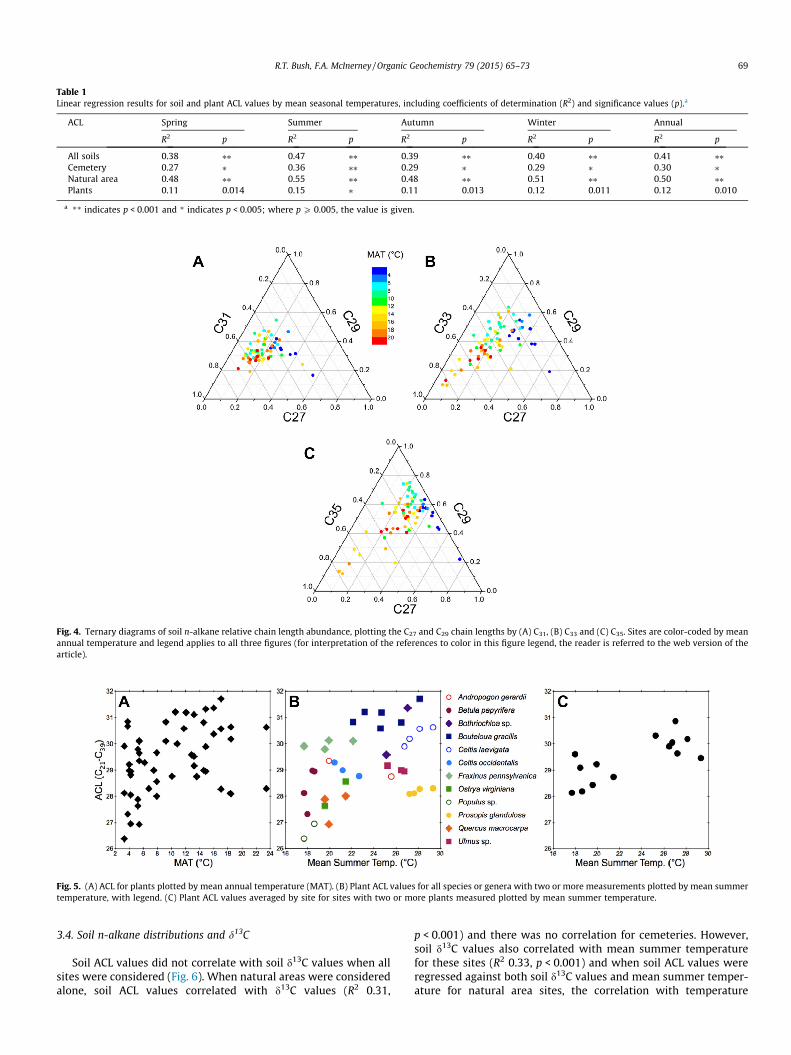
Table 1Linear regression results for soil and plant ACL values by mean seasonal temperatures, including coefficients of determination (R2) and significance values (p).a
ACL Spring Summer Autumn Winter Annual
R2 p R2 p R2 p R2 p R2 p
All soils 0.38 ⁄⁄ 0.47 ⁄⁄ 0.39 ⁄⁄ 0.40 ⁄⁄ 0.41 ⁄⁄Cemetery 0.27 ⁄ 0.36 ⁄⁄ 0.29 ⁄ 0.29 ⁄ 0.30 ⁄Natural area 0.48 ⁄⁄ 0.55 ⁄⁄ 0.48 ⁄⁄ 0.51 ⁄⁄ 0.50 ⁄⁄Plants 0.11 0.014 0.15 ⁄ 0.11 0.013 0.12 0.011 0.12 0.010
a ** indicates p < 0.001 and * indicates p < 0.005; where p P 0.005, the value is given.
Fig. 4. Ternary diagrams of soil n-alkane relative chain length abundance, plotting the C27 and C29 chain lengths by (A) C31, (B) C33 and (C) C35. Sites are color-coded by meanannual temperature and legend applies to all three figures (for interpretation of the references to color in this figure legend, the reader is referred to the web version of thearticle).
Fig. 5. (A) ACL for plants plotted by mean annual temperature (MAT). (B) Plant ACL values for all species or genera with two or more measurements plotted by mean summertemperature, with legend. (C) Plant ACL values averaged by site for sites with two or more plants measured plotted by mean summer temperature.
R.T. Bush, F.A. McInerney / Organic Geochemistry 79 (2015) 65–73 69
3.4. Soil n-alkane distributions and d13C
Soil ACL values did not correlate with soil d13C values when allsites were considered (Fig. 6). When natural areas were consideredalone, soil ACL values correlated with d13C values (R2 0.31,
p < 0.001) and there was no correlation for cemeteries. However,soil d13C values also correlated with mean summer temperaturefor these sites (R2 0.33, p < 0.001) and when soil ACL values wereregressed against both soil d13C values and mean summer temper-ature for natural area sites, the correlation with temperature
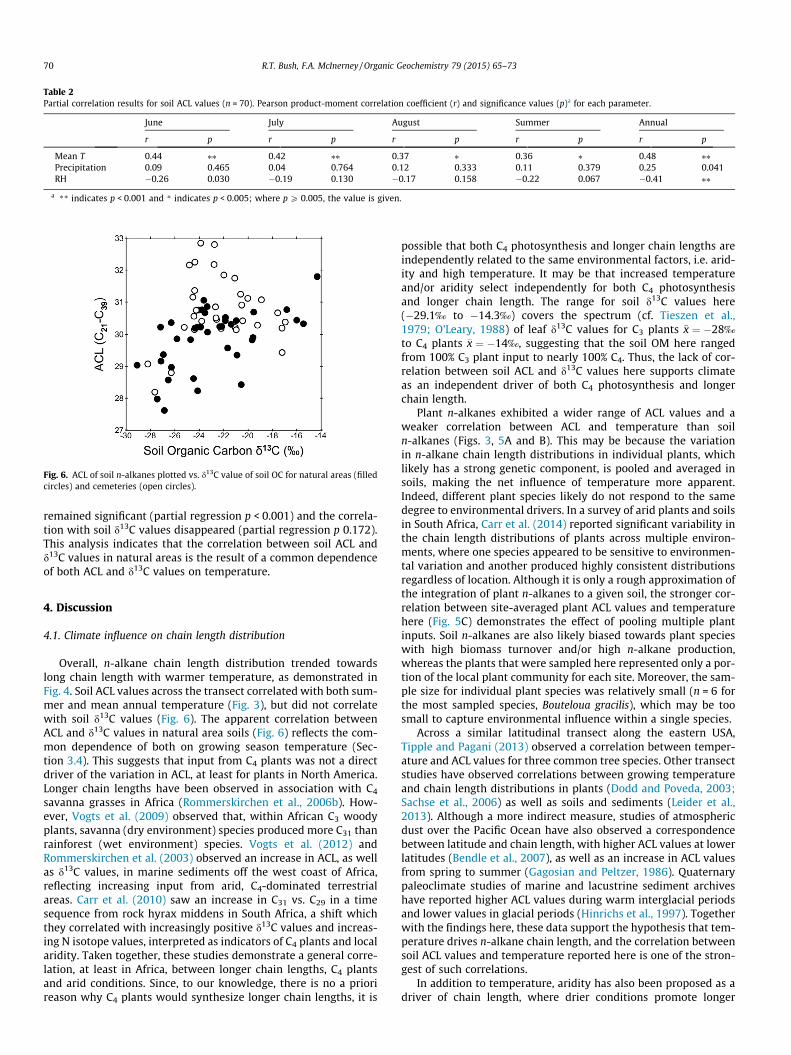
Table 2Partial correlation results for soil ACL values (n = 70). Pearson product-moment correlation coefficient (r) and significance values (p)a for each parameter.
June July August Summer Annual
r p r p r p r p r p
Mean T 0.44 ⁄⁄ 0.42 ⁄⁄ 0.37 ⁄ 0.36 ⁄ 0.48 ⁄⁄Precipitation 0.09 0.465 0.04 0.764 0.12 0.333 0.11 0.379 0.25 0.041RH �0.26 0.030 �0.19 0.130 �0.17 0.158 �0.22 0.067 �0.41 ⁄⁄
a ** indicates p < 0.001 and * indicates p < 0.005; where p P 0.005, the value is given.
Fig. 6. ACL of soil n-alkanes plotted vs. d13C value of soil OC for natural areas (filledcircles) and cemeteries (open circles).
70 R.T. Bush, F.A. McInerney / Organic Geochemistry 79 (2015) 65–73
remained significant (partial regression p < 0.001) and the correla-tion with soil d13C values disappeared (partial regression p 0.172).This analysis indicates that the correlation between soil ACL andd13C values in natural areas is the result of a common dependenceof both ACL and d13C values on temperature.
4. Discussion
4.1. Climate influence on chain length distribution
Overall, n-alkane chain length distribution trended towardslong chain length with warmer temperature, as demonstrated inFig. 4. Soil ACL values across the transect correlated with both sum-mer and mean annual temperature (Fig. 3), but did not correlatewith soil d13C values (Fig. 6). The apparent correlation betweenACL and d13C values in natural area soils (Fig. 6) reflects the com-mon dependence of both on growing season temperature (Sec-tion 3.4). This suggests that input from C4 plants was not a directdriver of the variation in ACL, at least for plants in North America.Longer chain lengths have been observed in association with C4
savanna grasses in Africa (Rommerskirchen et al., 2006b). How-ever, Vogts et al. (2009) observed that, within African C3 woodyplants, savanna (dry environment) species produced more C31 thanrainforest (wet environment) species. Vogts et al. (2012) andRommerskirchen et al. (2003) observed an increase in ACL, as wellas d13C values, in marine sediments off the west coast of Africa,reflecting increasing input from arid, C4-dominated terrestrialareas. Carr et al. (2010) saw an increase in C31 vs. C29 in a timesequence from rock hyrax middens in South Africa, a shift whichthey correlated with increasingly positive d13C values and increas-ing N isotope values, interpreted as indicators of C4 plants and localaridity. Taken together, these studies demonstrate a general corre-lation, at least in Africa, between longer chain lengths, C4 plantsand arid conditions. Since, to our knowledge, there is no a priorireason why C4 plants would synthesize longer chain lengths, it is
possible that both C4 photosynthesis and longer chain lengths areindependently related to the same environmental factors, i.e. arid-ity and high temperature. It may be that increased temperatureand/or aridity select independently for both C4 photosynthesisand longer chain length. The range for soil d13C values here(�29.1‰ to �14.3‰) covers the spectrum (cf. Tieszen et al.,1979; O’Leary, 1988) of leaf d13C values for C3 plants �x ¼ �28‰
to C4 plants �x ¼ �14‰, suggesting that the soil OM here rangedfrom 100% C3 plant input to nearly 100% C4. Thus, the lack of cor-relation between soil ACL and d13C values here supports climateas an independent driver of both C4 photosynthesis and longerchain length.
Plant n-alkanes exhibited a wider range of ACL values and aweaker correlation between ACL and temperature than soiln-alkanes (Figs. 3, 5A and B). This may be because the variationin n-alkane chain length distributions in individual plants, whichlikely has a strong genetic component, is pooled and averaged insoils, making the net influence of temperature more apparent.Indeed, different plant species likely do not respond to the samedegree to environmental drivers. In a survey of arid plants and soilsin South Africa, Carr et al. (2014) reported significant variability inthe chain length distributions of plants across multiple environ-ments, where one species appeared to be sensitive to environmen-tal variation and another produced highly consistent distributionsregardless of location. Although it is only a rough approximation ofthe integration of plant n-alkanes to a given soil, the stronger cor-relation between site-averaged plant ACL values and temperaturehere (Fig. 5C) demonstrates the effect of pooling multiple plantinputs. Soil n-alkanes are also likely biased towards plant specieswith high biomass turnover and/or high n-alkane production,whereas the plants that were sampled here represented only a por-tion of the local plant community for each site. Moreover, the sam-ple size for individual plant species was relatively small (n = 6 forthe most sampled species, Bouteloua gracilis), which may be toosmall to capture environmental influence within a single species.
Across a similar latitudinal transect along the eastern USA,Tipple and Pagani (2013) observed a correlation between temper-ature and ACL values for three common tree species. Other transectstudies have observed correlations between growing temperatureand chain length distributions in plants (Dodd and Poveda, 2003;Sachse et al., 2006) as well as soils and sediments (Leider et al.,2013). Although a more indirect measure, studies of atmosphericdust over the Pacific Ocean have also observed a correspondencebetween latitude and chain length, with higher ACL values at lowerlatitudes (Bendle et al., 2007), as well as an increase in ACL valuesfrom spring to summer (Gagosian and Peltzer, 1986). Quaternarypaleoclimate studies of marine and lacustrine sediment archiveshave reported higher ACL values during warm interglacial periodsand lower values in glacial periods (Hinrichs et al., 1997). Togetherwith the findings here, these data support the hypothesis that tem-perature drives n-alkane chain length, and the correlation betweensoil ACL values and temperature reported here is one of the stron-gest of such correlations.
In addition to temperature, aridity has also been proposed as adriver of chain length, where drier conditions promote longer
R.T. Bush, F.A. McInerney / Organic Geochemistry 79 (2015) 65–73 71
chain length (Dodd et al., 1998; Andersson et al., 2011). A study ofatmospheric dust off the western coast of Africa found lower ACLvalues from locations adjacent to rainforest and higher values fromdesert regions (Schefuß et al., 2003). However, the evidence for acorrelation between aridity and n-alkane chain length distributionappears to be more mixed, and whether temperature or aridity isthe primary driver of ACL change in sediment records may dependon the regional context. For example, Calvo et al. (2004) observedincreased ACL values during dry but cooler time periods from Pleis-tocene sediments from the Tasman Sea. In contrast, Castañedaet al. (2009) observed increased ACL values from Lake Malawi sed-iments in warmer, wetter time periods through the Late Pleisto-cene. For modern plants, a recent study reported opposite trendsin ACL in the leaves of two different genera with increasing aridityin Australia (Hoffmann et al., 2013), while another study of arid-adapted plants in South Africa reported a significant but weak posi-tive correlation between aridity and ACL in plants and soils (Carret al., 2014). Similar to the temperature results here, Carr et al.(2014) also found that the correlation between ACL and ariditywas stronger for soils than for plants, again suggesting that soilsexert an averaging effect on variation among plants. Our studyshows only a correlation between soil ACL values and relativehumidity when relative humidity was calculated for the entireyear. Thus the evidence for aridity as a driver is not yet as clearas it is for temperature and calls for further investigation of mod-ern environments. Overall, these and previous findings (Bush andMcInerney, 2013) suggest that it may be prudent to interpretchanges in chain length distributions during periods of climatechange not as the direct result of plant community turnover perse (Schwark et al., 2002; Zhang et al., 2006; Bai et al., 2009) butrather a result of the climate conditions.
4.2. Mechanisms of temperature influence
Cuticular wax blocks non-stomatal leaf water loss and is a crit-ical adaptation for land plants. Plants allocate a large portion oflipid synthesis to cuticular wax lipids (Samuels et al., 2008). It istherefore expected that wax amount, structure and compositionwould be adapted to minimize water loss, as well as serving otherecological functions (Hall and Jones, 1961; Shepherd and Griffiths,2006; Mamrutha et al., 2010). Increasing temperature has beenshown to increase the permeability of leaf cuticle surfaces, includ-ing at natural environmental temperature (Riederer and Schreiber,2001; Riederer, 2006), and plants in hotter, drier environmentssynthesize less permeable cuticles (Schreiber and Riederer,1996). Also, noting that leaf wax does not form a smooth surfaceover the leaf cuticle, but rather forms crystalline structures (Post-Beittenmiller, 1996), the loss of this crystal structure due to partialmelting may negatively impact the ecological functions of leaf wax,e.g. mediating plant–insect and plant–microbe interactions(Riederer and Müller, 2006). Thus, it is reasonable to surmise that,under warm and/or arid conditions, selective pressures favor theproduction of longer, more hydrophobic n-alkane chain lengths(Shepherd and Griffiths, 2006). Furthermore, this functionalitymust be maintained at the warmest temperatures experiencedby the plant, i.e. the warmest months of the growing season. Thismay explain why chain length correlates most strongly with sum-mer temperature, even if leaf waxes are largely synthesized inspring at the beginning of the growing season (Tipple et al.,2013). Thus, although the isotope values of the n-alkanes reflectwater uptake at the time of leaf wax synthesis and leaf flush(Kahmen et al., 2011; Tipple et al., 2013), n-alkane chain lengthdistribution is decoupled from spring environmental conditionsand instead reflects summer temperature. However, it is notedthat, while this hypothesis may explain observations for deciduousand annual plants that produce and lose their leaves over the
course of a single growing season, it may not hold for evergreenplants in cold climates, the leaves of which may require longerchain length to survive winter freezing and desiccation in dry, coldconditions (Dodd and Poveda, 2003). There is also a clear genetic ortaxonomic component to n-alkane biosynthesis, where some spe-cies produce highly consistent chain length distributions acrosstheir range and some species are much more variable (Bush andMcInerney, 2013; Carr et al., 2014) and the reasons for this areunclear. Data on the biosynthetic control and function of n-alkanesin leaf wax are sparse and the biochemistry of this relationship hasyet to be fully explored.
4.3. Application to a paleoclimate archive: the Paleocene–EoceneThermal Maximum
In order to test the applicability of the correlation between tem-perature and chain length to paleoclimate archives, we applied thefindings to the Paleocene–Eocene Thermal Maximum (PETM). ThePETM was an extreme, geologically brief, global warming eventthat occurred ca. 56 � 106 yr ago, before the evolution of C4 plants,and that has been observed in multiple sedimentary archives(McInerney and Wing, 2011). Of the studies that have examinedn-alkanes across the PETM, several discuss ACL values: Smithet al. (2007) for Wyoming, Handley et al. (2008) for Tanzania,Schouten et al. (2007) for the Arctic Ocean and Tipple et al.(2011) for Forada, Italy. In three of the four records, ACL increasedat the onset of PETM warming (Schouten et al., 2007; Smith et al.,2007). In the fourth (Forada, Italy), ACL decreased at the onset ofthe PETM. The decrease was associated with a decrease in n-alkanedD values that might suggest that the area locally became wetter(Tipple et al., 2011), which in turn may have reduced the effectof increased temperature. Similarly, during the cooling and recov-ery phase of the PETM, three of the four records showed a decreasein ACL (Schouten et al., 2007; Smith et al., 2007; Tipple et al., 2011).Handley et al. (2008) speculated that the Tanzania record had ahiatus that spanned the recovery, so the ACL signal was notrecorded for that interval. Although atmospheric CO2 alsoincreased at the onset of the PETM, a study of modern plants, inwhich n-alkane distributions were found not to change with ele-vated CO2, suggests that this is unlikely to have had an effect onACL values across the PETM (Wiesenberg et al., 2008). Thus, it ispossible that the global warming, potentially coupled with dryingin some areas, drove the increase in ACL observed in most recordsat the onset of the PETM, and conversely that the cooling at the endof the PETM largely drove a decrease in ACL. Other studies havealready speculated on the effects of aridity and temperature onchain length distributions across Quaternary climate changeevents, e.g. glacial–interglacial cycles (Rommerskirchen et al.,2006a). Measures of variation in chain length distributions suchas ACL may serve as useful qualitative indicators of climate changeevents, supplementing other proxy records.
5. Conclusions
This study demonstrates a strong correlation between summertemperature and n-alkane chain length distributions. Comple-mented by a previous study that showed a lack of correlationbetween n-alkane chain length and most major plant groups(Bush and McInerney, 2013) and in conjunction with other studiesthat show a correlation between chain length and aridity or tem-perature, this suggests that the spatial and temporal variation inchain length distribution may be driven in large part by growingseason temperature and/or aridity. There is no evidence to supporta direct link between C4 photosynthesis and long chain length(> C31), which suggests that they both are adaptations to hot and/
72 R.T. Bush, F.A. McInerney / Organic Geochemistry 79 (2015) 65–73
or dry environments. Lastly, soils integrate the various n-alkanesignals from local plants, and therefore may provide a better com-parison dataset for interpretation of sediments and paleosols.Future research would benefit from investigation of the mechanicsof the incorporation of n-alkanes into cuticular wax and the effectof cuticle lipid composition on water permeability, as well as thenature of the relationship between leaf wax n-alkanes and theirsources, and their incorporation into sediment and fossil archives.
Acknowledgements
We are grateful to the state and local agencies who providedaccess and assistance: Minnesota Department of NaturalResources, South Dakota Game, Fish & Parks Department, NebraskaGame and Parks Commission, Kansas Department of Wildlife, Parksand Tourism, Oklahoma Tourism and Recreation Department,Texas Parks & Wildlife Department, and Sabal Palms Sanctuary.Funding was provided by The Paleontological Society, Sigma Xiand EPA Science to Achieve Results (STAR) Graduate Fellowshipto R.T.B. and by NSF EAR-1053351 and Australian Research CouncilFT110100793 to F.A.M. Portions of the work were presented at theGSA 2012 Annual Meeting, thanks to funding from the Associationfor Women Geoscientists. Thanks go to N. Richter and K. Dutta forlaboratory assistance and to S. Wing, N. Blair and B. Sageman forinsightful comments and suggestions. The manuscript was muchimproved by comments from two anonymous reviewers.
Appendix A. Supplementary data
Supplementary data associated with this article can be found, inthe online version, at http://dx.doi.org/10.1016/j.orggeochem.2014.12.003.
Associate Editor—P.A. Meyers
References
Andersson, R.A., Kuhry, P., Meyers, P., Zebühr, Y., Crill, P., Mörth, M., 2011. Impactsof paleohydrological changes on n-alkane biomarker compositions of aHolocene peat sequence in the eastern European Russian Arctic. OrganicGeochemistry 42, 1065–1075.
Bai, Y., Fang, X., Nie, J., Wang, Y., Wu, F., 2009. A preliminary reconstruction of thepaleoecological and paleoclimatic history of the Chinese Loess Plateau from theapplication of biomarkers. Palaeogeography, Palaeoclimatology, Palaeoecology271, 161–169.
Balesdent, J., Girardin, C., Mariotti, A., 1993. Site-related d13C of tree leaves and soilorganic matter in a temperate forest. Ecology 74, 1713–1721.
Bendle, J., Kawamura, K., Yamazaki, K., Niwai, T., 2007. Latitudinal distribution ofterrestrial lipid biomarkers and n-alkane compound-specific stable carbonisotope ratios in the atmosphere over the western Pacific and Southern Ocean.Geochimica et Cosmochimica Acta 71, 5934–5955.
Brincat, D., Yamada, K., Ishiwatari, R., Uemura, H., Naraoka, H., 2000. Molecularisotopic stratigraphy of long-chain n-alkanes in Lake Baikal Holocene andglacial age sediments. Organic Geochemistry 31, 287–294.
Buchmann, N., Kao, W.-Y., Ehleringer, J.R., 1997. Influence of stand structure oncarbon-13 of vegetation, soils, and canopy air within deciduous and evergreenforests in Utah, United States. Oecologia 110, 109–119.
Bush, R.T., McInerney, F.A., 2013. Leaf wax n-alkane distributions in and acrossmodern plants: implications for paleoecology and chemotaxonomy.Geochimica et Cosmochimica Acta 117, 161–179.
Calvo, E., Pelejero, C., Logan, G.A., De Deckker, P., 2004. Dust-induced changes inphytoplankton composition in the Tasman Sea during the last four glacialcycles. Paleoceanography 19, 1–10.
Carr, A.S., Boom, A., Chase, B.M., 2010. The potential of plant biomarker evidencederived from rock hyrax middens as an indicator of palaeoenvironmentalchange. Palaeogeography, Palaeoclimatology, Palaeoecology 285, 321–330.
Carr, A.S., Boom, A., Grimes, H.L., Chase, B.M., Meadows, M.E., Harris, A., 2014. Leafwax n-alkane distributions in arid zone South African flora: environmentalcontrols, chemotaxonomy and palaeoecological implications. OrganicGeochemistry 67, 72–84.
Castañeda, I.S., Schouten, S., 2011. A review of molecular organic proxies forexamining modern and ancient lacustrine environments. Quaternary ScienceReviews 30, 2851–2891.
Castañeda, I.S., Werne, J.P., Johnson, T.C., Filley, T.R., 2009. Late Quaternaryvegetation history of southeast Africa: the molecular isotopic record fromLake Malawi. Palaeogeography, Palaeoclimatology, Palaeoecology 275, 100–112.
Daly, C., Halbleib, M., Smith, J.I., Gibson, W.P., Doggett, M.K., Taylor, G.H., Curtis, J.,Pasteris, P.P., 2008. Physiographically sensitive mapping of climatologicaltemperature and precipitation across the conterminous United States.International Journal of Climatology 28, 2031–2064.
Dodd, R.S., Poveda, M.M., 2003. Environmental gradients and population divergencecontribute to variation in cuticular wax composition in Juniperus communis.Biochemical Systematics and Ecology 31, 1257–1270.
Dodd, R.S., Rafii, Z.A., Power, A.B., 1998. Ecotypic adaptation in Austrocedrus chilensisin cuticular hydrocarbon composition. New Phytologist 138, 699–708.
Eglinton, G., Hamilton, R.J., 1967. Leaf epicuticular waxes. Science 156, 1322–1335.Gagosian, R.B., Peltzer, E.T., 1986. The importance of atmospheric input of terrestrial
organic material to deep sea sediments. Organic Geochemistry 10, 661–669.Gustafson, D.J., Gibon, D.J., Nickrent, D.L., 2005. Using local seeds in prairie
restoration. Native Plants 6, 25–28.Hall, D.M., Jones, R.L., 1961. Physiological significance of surface wax on leaves.
Nature 191, 95–96.Handley, L., Pearson, P.N., McMillan, I.K., Pancost, R.D., 2008. Large terrestrial and
marine carbon and hydrogen isotope excursions in a new Paleocene/Eoceneboundary section from Tanzania. Earth and Planetary Science Letters 275, 17–25.
Hinrichs, K.-U., Rinna, J., Rullkötter, J., 1997. Late Quaternary paleoenvironmentalconditions indicated by marine and terrestrial molecular biomarkers insediments from the Santa Barbara Basin. Interagency Ecological Program forthe Sacramento-San Joaquin Estuary Technical Report 57, 125–137.
Hoffmann, B., Kahmen, A., Cernusak, L.A., Arndt, S.K., Sachse, D., 2013. Abundanceand distribution of leaf wax n-alkanes in leaves of Acacia and Eucalyptus treesalong a strong humidity gradient in northern Australia. Organic Geochemistry62, 62–67.
Kahmen, A., Dawson, T.E., Vieth, A., Sachse, D., 2011. Leaf wax n-alkane dD valuesare determined early in the ontogeny of Populus trichocarpa leaves when grownunder controlled environmental conditions. Plant, Cell & Environment 34,1639–1651.
Kawamura, K., Ishimura, Y., Yamazaki, K., 2003. Four years’ observations ofterrestrial lipid class compounds in marine aerosols from the western NorthPacific. Global Biogeochemical Cycles 17, 1–19.
Leider, A., Hinrichs, K.-U., Schefuß, E., Versteegh, G.J.M., 2013. Distribution andstable isotopes of plant wax derived n-alkanes in lacustrine, fluvial and marinesurface sediments along an Eastern Italian transect and their potential toreconstruct the hydrological cycle. Geochimica et Cosmochimica Acta 117, 16–32.
Mamrutha, H.M., Mogili, T., Lakshmi, K.J., Rama, N., Kosma, D., Kumar, M.U., Jenks,M.A., Nataraja, K.N., 2010. Leaf cuticular wax amount and crystal morphologyregulate post-harvest water loss in mulberry (Morus species). Plant Physiologyand Biochemistry 48, 690–696.
Marzi, R., Torkelson, B.E., Olson, R.K., 1993. A revised carbon preference index.Organic Geochemistry 20, 1303–1306.
McInerney, F.A., Wing, S.L., 2011. The Paleocene–Eocene thermal maximum: aperturbation of carbon cycle, climate, and biosphere with implications for thefuture. Annual Review of Earth and Planetary Sciences 39, 489–516.
Medeiros, P.M., Simoneit, B.R.T., 2007. Gas chromatography coupled to massspectrometry for analyses of organic compounds and biomarkers as tracers forgeological, environmental, and forensic research. Journal of Separation Science30, 1516–1536.
Melillo, J.M., Aber, J.D., Linkins, A.E., Ricca, A., Fry, B., Nadelhoffer, K.J., 1989. Carbonand nitrogen dynamics along the decay continuum: plant litter to soil organicmatter. Plant and Soil 115, 189–198.
O’Leary, M.H., 1988. Carbon isotopes in photosynthesis. BioScience 38, 328–336.Post-Beittenmiller, D., 1996. Biochemistry and molecular biology of wax production
in plants. Annual Review of Plant Physiology and Plant Molecular Biology 47,405–430.
Riederer, M., 2006. Thermodynamics of the water permeability of plant cuticles:characterization of the polar pathway. Journal of Experimental Botany 57,2937–2942.
Riederer, M., Müller, C., 2006. Biology of the Plant Cuticle. Blackwell, Oxford.Riederer, M., Schreiber, L., 2001. Protecting against water loss: analysis of the
barrier properties of plant cuticles. Journal of Experimental Botany 52, 2023–2032.
Rommerskirchen, F., Eglinton, G., Dupont, L., Günter, U., Wenzel, C., Rullkötter, J.,2003. A north to south transect of Holocene southeast Atlantic continentalmargin sediments: relationship between aerosol transport and compound-specific d13C land plant biomarker and pollen records. GeochemistryGeophysics Geosystems 4, 1101–1128.
Rommerskirchen, F., Eglinton, G., Dupont, L., Rullkötter, J., 2006a. Glacial/interglacial changes in southern Africa: compound-specific d13C land plantbiomarker and pollen records from southeast Atlantic continental marginsediments. Geochemistry Geophysics Geosystems 7, 1–2.
Rommerskirchen, F., Plader, A., Eglinton, G., Chikaraishi, Y., Rullkötter, J., 2006b.Chemotaxonomic significance of distribution and stable carbon isotopiccomposition of long-chain alkanes and alkan-1-ols in C4 grass waxes. OrganicGeochemistry 37, 1303–1332.
Sachse, D., Radke, J., Gleixner, G., 2006. DD values of individual n-alkanes fromterrestrial plants along a climatic gradient – implications for the sedimentarybiomarker record. Organic Geochemistry 37, 469–483.

R.T. Bush, F.A. McInerney / Organic Geochemistry 79 (2015) 65–73 73
Sachse, D., Billault, I., Bowen, G.J., Chikaraishi, Y., Dawson, T.E., Feakins, S.J.,Freeman, K.H., Magill, C.R., McInerney, F.A., van der Meer, M.T.J., Polissar, P.,Robins, R.J., Sachs, J.P., Schmidt, H.-L., Sessions, A.L., White, J.W.C., West, J.B.,Kahmen, A., 2012. Molecular paleohydrology: interpreting the hydrogen-isotopic composition of lipid biomarkers from photosynthesizing organisms.Annual Review of Earth and Planetary Sciences 40, 221–249.
Samuels, L., Kunst, L., Jetter, R., 2008. Sealing plant surfaces: cuticular waxformation by epidermal cells. Annual Review of Plant Biology 59, 683–707.
Schefuß, E., Schouten, S., Jansen, J.H.F., Sinninghe Damsté, J.S., 2003. Africanvegetation controlled by tropical sea surface temperatures in the mid-Pleistocene period. Nature 422, 418–421.
Schouten, S., Woltering, M., Rijpstra, W.I.C., Sluijs, A., Brinkhuis, H., SinningheDamsté, J.S., 2007. The Paleocene–Eocene carbon isotope excursion in higherplant organic matter: differential fractionation of angiosperms and conifers inthe Arctic. Earth and Planetary Science Letters 258, 581–592.
Schreiber, L., Riederer, M., 1996. Ecophysiology of cuticular transpiration:comparative investigation of cuticular water permeability of plant speciesfrom different habitats. Oecologia 107, 426–432.
Schwark, L., Zink, K., Lechterbeck, J., 2002. Reconstruction of postglacial to earlyHolocene vegetation history in terrestrial Central Europe via cuticular lipidbiomarkers and pollen records from lake sediments. Geology 30, 463–466.
Shepherd, T., Griffiths, D.W., 2006. The effects of stress on plant cuticular waxes.New Phytologist 171, 469–499.
Smith, F.A., Wing, S.L., Freeman, K.H., 2007. Magnitude of the carbon isotopeexcursion at the paleocene–eocene thermal maximum: the role of plantcommunity change. Earth and Planetary Science Letters 262, 50–65.
Sorensen, J.T., Holden, D.J., 1974. Germination of native prairie forb seeds. Journal ofRange Management 27, 123–126.
Still, C.J., Berry, J.A., Collatz, G.J., DeFries, R.S., 2003. Global distribution of C3 and C4
vegetation: carbon cycle implications. Global Biogeochemical Cycles 17, 1–14.Teeri, J.A., Stowe, L.G., 1976. Climatic patterns and the distribution of C4 grasses in
North America. Oecologia 23, 1–12.
Tieszen, L.L., Senyimba, M.M., Imbamba, S.K., Troughton, J.H., 1979. The distributionof C3 and C4 grasses and carbon isotope discrimination along an altitudinal andmoisture gradient in Kenya. Oecologia 37, 337–350.
Tieszen, L.L., Reed, B.C., Bliss, N.B., Wylie, B.K., DeJong, D.D., 1997. NDVI, C3 and C4
production, and distributions in Great Plains grassland land cover classes.Ecological Applications 7, 59–78.
Tipple, B.J., Pagani, M., 2013. Environmental control on eastern broadleaf forestspecies’ leaf wax distributions and D/H ratios. Geochimica et CosmochimicaActa 111, 64–77.
Tipple, B.J., Pagani, M., Krishnan, S., Dirghangi, S.S., Galeotti, S., Agnini, C., Giusberti,L., Rio, D., 2011. Coupled high-resolution marine and terrestrial records ofcarbon and hydrologic cycles variations during the paleocene–eocene thermalmaximum (PETM). Earth and Planetary Science Letters 311, 82–92.
Tipple, B.J., Berke, M.A., Doman, C.E., Khachaturyan, S., Ehleringer, J.R., 2013. Leaf-wax n-alkanes record the plant-water environment at leaf flush. Proceedings ofthe National Academy of Sciences United States of America 110, 2659–2664.
Vogts, A., Moossen, H., Rommerskirchen, F., Rullkötter, J., 2009. Distributionpatterns and stable carbon isotopic composition of alkanes and alkan-1-olsfrom plant waxes of African rain forest and savanna C3 species. OrganicGeochemistry 40, 1037–1054.
Vogts, A., Schefuß, E., Badewein, T., Rullkötter, J., 2012. n-Alkane parameters from adeep sea sediment transect off southwest Africa reflect continental vegetationand climate conditions. Organic Geochemistry 47, 109–119.
Wang, Y.V., Larsen, T., Leduc, G., Andersen, N., Blanz, T., Schneider, R.R., 2013. Whatdoes leaf wax dD from a mixed C3/C4 vegetation region tell us? Geochimica etCosmochimica Acta 111, 128–139.
Wiesenberg, G.L.B., Schmidt, M.W.I., Schwark, L., 2008. Plant and soil lipidmodifications under elevated CO2 conditions. I. Lipid distribution patterns.Organic Geochemistry 39, 91–102.
Zhang, Z., Zhao, M., Eglinton, G., Lu, H., Huang, C.-Y., 2006. Leaf wax lipids aspaleovegetational and paleoenvironmental proxies for the Chinese LoessPlateau over the last 170 kyr. Quaternary Science Reviews 25, 575–594.