strategic facilities planning - jd · pdf filestrategic facilities planning one...
TRANSCRIPT

Strategic Facilities Planning One Hospital’s Response to Healthcare Reform
September 20, 2011
11:15 – 12:30pm

Presenters
• David H. Deininger, AIA, LEED AP
– Principal
– TROJB
• Shraddha Patel, FACHE
– Director of Business Development
– Lawrence & Memorial Hospital

Learning Objectives
• Learn specific, strategic responses to the forces of healthcare reform
• Explore an integrated process that leads to a broad consensus
• Identify a flexible, long range vision that can be phased to align to the capital available
• Learn to prioritize numerous agendas, evaluate facility options and arrive at an optimal final plan within budget guidelines

Agenda
• Introduction
– L&M Context
– Health Care Reform Overlay
– Core Capabilities
• Partnership
• Thinking in Systems
• Data Driven Decisions
• Q&A

Introduction
• Lawrence & Memorial Hospital
– Non-Profit Community Hospital in New London, CT
– Founded in 1912
– 280 Licensed Beds
• Medical, Surgical, Rehab, Obstetrics, Psych
– Centers of Excellence
• Critical Care, Rehab, NICU, Oncology
– 2,300 Employees
– 302 Active Staff Physicians
– 14,000 Inpatient Discharges,
10,000 OR Cases, 84,000 ED Visits

Introduction
• Healthcare Reform Overlay– How do You Prosper in a Post Reform World?
– Requires a New Business Model• FFS to Patient Management
• Volume to (Value = Quality/Cost)
• Downward Pressure on Price
• Cost Management to Cost Structure
• Create Scale

Introduction
Source: Kaufman, Hall & Associates, Inc.
Assessing Your Core Capabilities

Introduction
Source: Kaufman, Hall & Associates, Inc.
How L&M Stacked Up• Physician Alignment
• Provider Integration
• Efficiency
• Facility Condition
• Labor Flexibility

Introduction
Source: Kaufman, Hall & Associates, Inc.
3 Core Capabilities to Work On

1. Multi-Disciplinary Approach Partnership
The Blind Men & the Elephant
– To Learn What it is Like
Each Touches a Different Part
• Side…”A Wall”
• Trunk…”A Snake”
• Leg…”A Tree”
• Ear…”A Fan”
– No One Individual Can Know the
Whole Truth About the Elephant

1. Multi-Disciplinary Approach Partnership
Integrated Process

2. Partner With Physicians Partnership
Benefits of Hospital-Physician Alignment
– Growth – hospitals need to grow to maintain financial performance to fund investment in clinical programs, new technology, etc.
– Efficiency – physicians can assist hospitals in reducing costs, increasing throughput, access, quality, outcomes, and value
2. Partner With Physicians Partnership
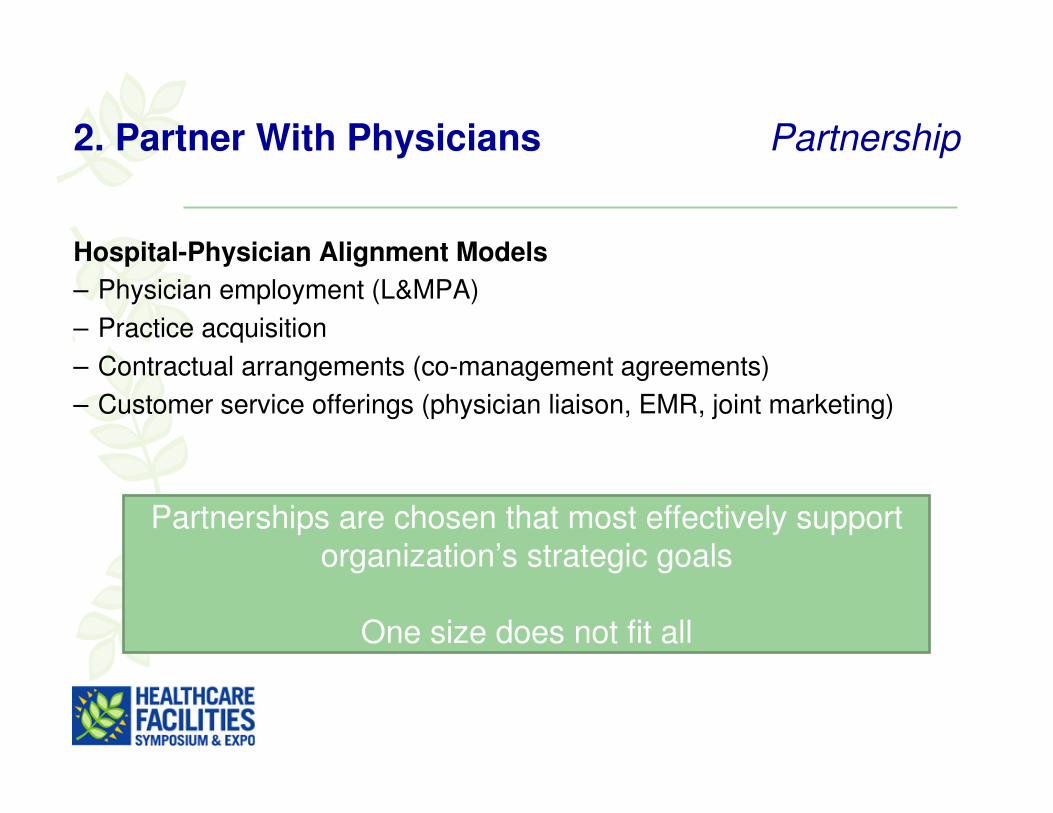
Hospital-Physician Alignment Models
– Physician employment (L&MPA)
– Practice acquisition
– Contractual arrangements (co-management agreements)
– Customer service offerings (physician liaison, EMR, joint marketing)
Partnerships are chosen that most effectively support organization’s strategic goals
One size does not fit all
3. Clinical Affiliations Partnership
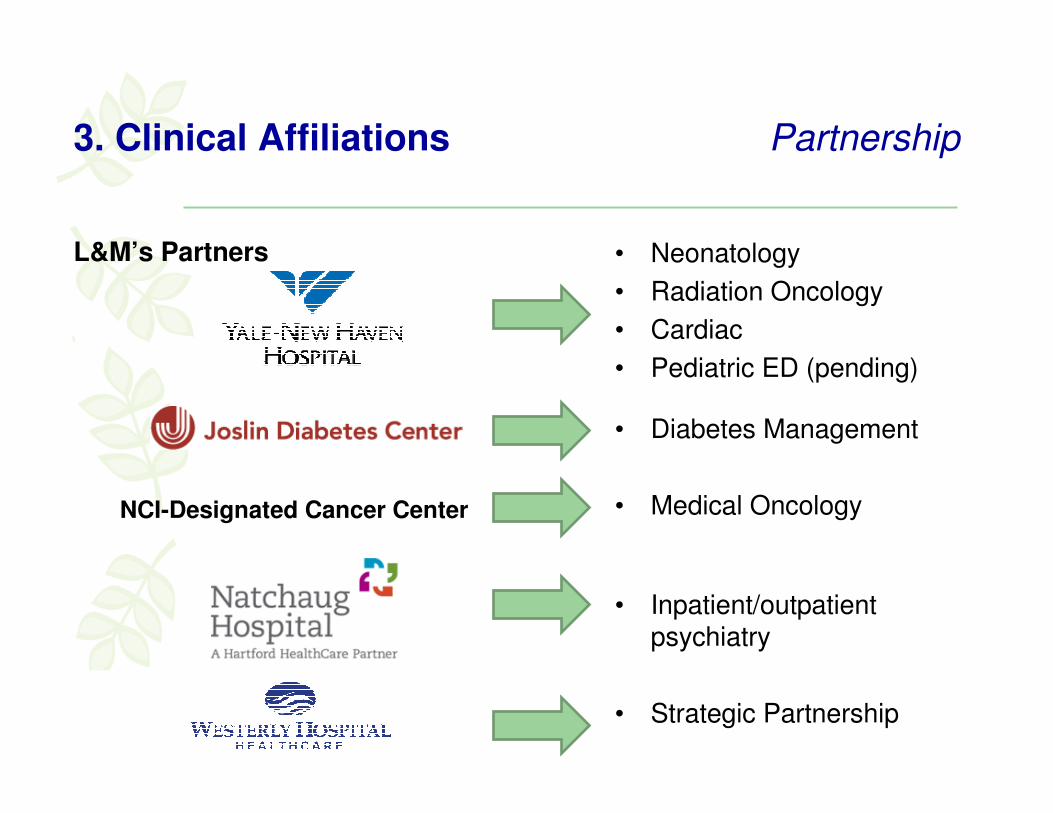
L&M’s Partners • Neonatology
• Radiation Oncology
• Cardiac
• Pediatric ED (pending)
• Diabetes Management
• Medical Oncology
• Inpatient/outpatient psychiatry
• Strategic Partnership
NCI-Designated Cancer Center

3. Clinical Affiliations Partnership
Benefits of Clinical Affiliation
– Increase market share and volume
– Decrease cost; improve financial strength
– Leverage clinical expertise
– Improve quality of care locally; reduce outmigration
– Make best use of scarce capital and clinical resources

4. Integrated Project Delivery (IPD) Partnership
What is IPD?
– “Integrated project delivery is a project delivery approach that integrates people, systems, business structures and practices into a process that collaboratively harnesses the talent and insights of all participants to reduce waste and optimize design efficiency through all phases of design fabrication and construction.”
Source: American Institute of Architects

4. Integrated Project Delivery (IPD) Partnership
IPD Principles
– Trust
– Shared Risk and Reward/Single Contract
– Effective Collaboration
– Open Information Sharing
– Team Success is Tied to Project Success
– Value Based Decision Making
– Utilization of Technology/BIM

4. Integrated Project Delivery (IPD) Partnership
Traditional vs. IPD

4. Integrated Project Delivery (IPD) Partnership
Shifting the Curve to the Left

5. Strengthening the Core Thinking in Systems
• It can be easy to forget what is working well
• Must balance new initiatives with the core of your business
• Continual analysis of what you have
• A long range vision
5. Strengthening the Core Thinking in Systems
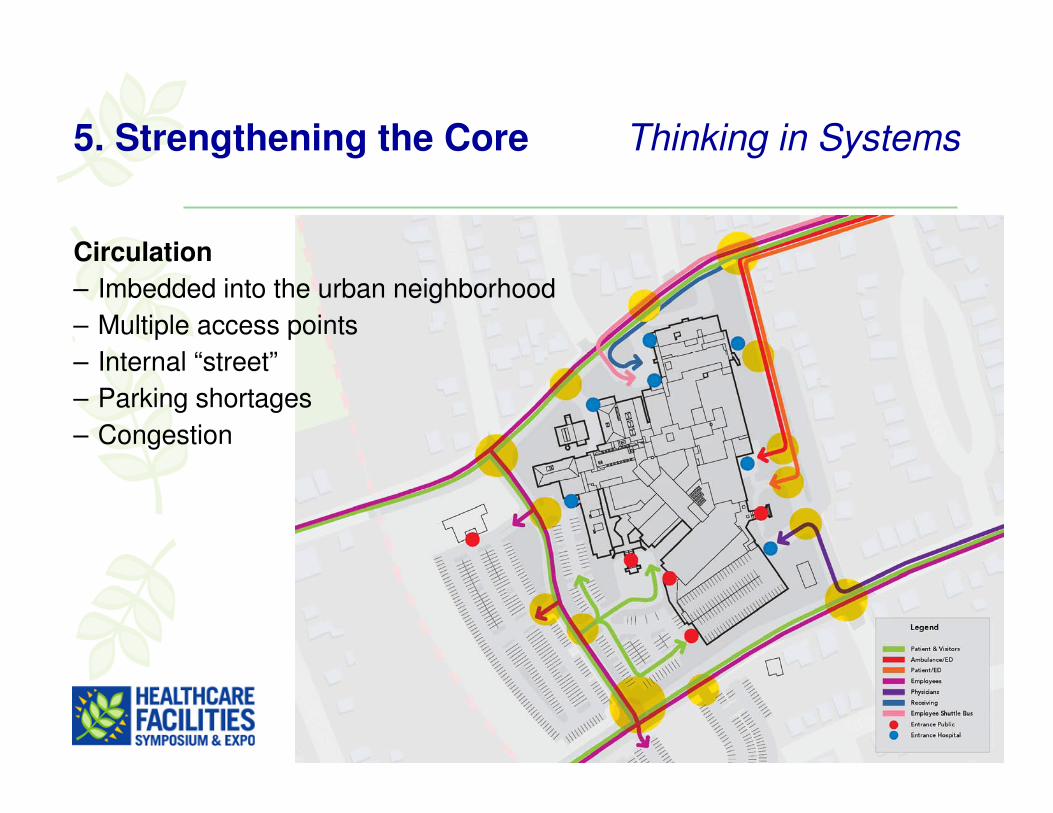
Circulation
– Imbedded into the urban neighborhood
– Multiple access points
– Internal “street”
– Parking shortages
– Congestion

5. Strengthening the Core Thinking in Systems
Building Condition
– 45% space over 50 years
– Best long term use
– Vertical growth

5. Strengthening the Core Thinking in Systems
Quadrants
– Clear zoning

5. Strengthening the Core Thinking in Systems
Topography
– 3 different entry levels• Level 1- Main
• Level 2- Receiving
• Level 3- Emergency
– Disconnect

5. Strengthening the Core Thinking in Systems
3rd Floor Congestion• Lab
• Imaging
• Emergency
• Surgery
• Ambulatory Surgery/Endoscopy
5. Strengthening the Core Thinking in Systems
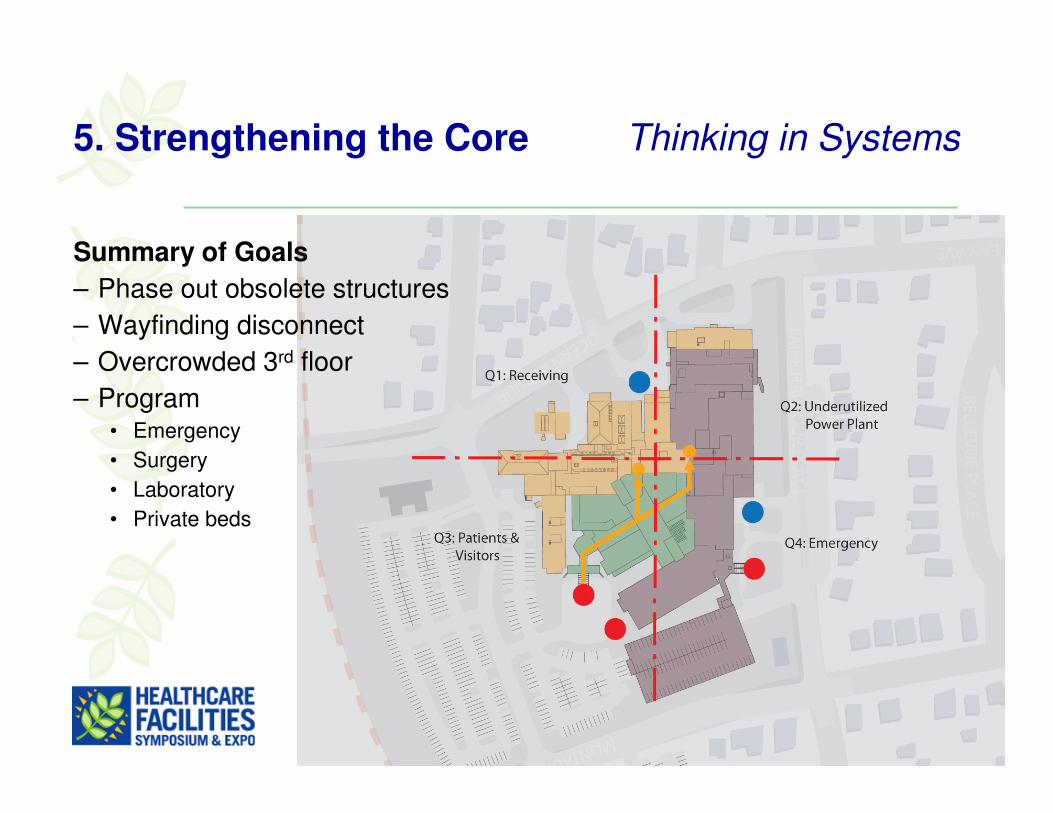
Summary of Goals
– Phase out obsolete structures
– Wayfinding disconnect
– Overcrowded 3rd floor
– Program • Emergency
• Surgery
• Laboratory
• Private beds

5. Strengthening the Core Thinking in Systems
Future Vision
– Build on best buildings
– Connect vertical cores
– Rebuilt major D&T
– Redevelopment strategy for Nursing
– Phasing options

5. Strengthening the Core Thinking in Systems
Existing

5. Strengthening the Core Thinking in Systems
Demolition

5. Strengthening the Core Thinking in Systems
New
1. Lab & Pharmacy
2. Emergency
3. ICU / CCU
4. M/S Beds
5. M/S Beds

Vertical Circulation
Pedestrian Connector
New Building
Pond House
F-BLDG
D-BLDG
C-WING
New
Ele
vato
r Core
Red
Ele
vato
r Core
Gre
en E
leva
tor Core
New Atrium
New Atrium
5. Strengthening the Core Thinking in Systems
Wayfinding Network

6. Regional Emergency Network Thinking in Systems
Factors Driving the Emergency Network
– ED utilization rates have been increasing
– Reform will increase number of insured
– Primary care shortages will persist
– 60% of inpatient admits through ED
– ED key point of entry for many residents
– Population aging and few psychiatric options
– Seasonal population growth

6. Regional Emergency Network Thinking in Systems
L&M’s Approach to ED Services
– Ensure services are available to meet needs of our market
– Strategically locate EDs in two locations in PSA to increase access and decompress main ED
• Expand and build ED capacity
• Develop efficient staff and patient flow via process and layout optimization
• Increase hours of operation at satellite ED to 24/7
– Also focus on lower cost settings; develop walk-in centers

7. Ambulatory Network Thinking in Systems
Factors Driving Ambulatory Network
– Growth in ambulatory care services• Healthcare reform
• Shift of care to outpatient setting
• Reimbursement policies that support outpatient investment
• Rise in chronic conditions (e.g., diabetes)
– Decompress main campus
– Increase access and visibility of L&M in market
– Opportunity to align with physicians (MOB strategy)

7. Ambulatory Network Thinking in Systems
L&M’s Market Attractiveness Study
PSA Town
‘09 to ‘14 Population Growth
Market Opportunity
East Lyme High Medium
Groton High Med-High
Ledyard Medium High
Lyme Low Medium
Montville High High
New London Low Medium
North Stonington Low Medium
Old Lyme Low High
Stonington Low Medium
Waterford Medium Med-High
� When considering net population growth and opportunity capture more private and Medicare inpatients, the most attractive PSA towns include Montville, Groton, Ledyard, and East Lyme
KEY: Net population growth: <100 residents=low, 100-500 residents=medium, >500residents=high.Market opportunity based on the following for private/Medicare payors: >80% share for L&M=low, 70%-80% share=medium, <70% share=high AND <50 discharges market size=low, 50-100 discharges market size=medium, >100 discharges market size=high.

7. Ambulatory Network Thinking in Systems
L&M Sites of ServiceSite Services
L&M Hospital Inpatient, ED, surg, lab, imaging
Pequot Health Center ED, imaging, lab, rehab, surg
Waterfall Rehab CenterWound Care Center
RehabWound care, hyperbaric
therapy
Flanders Health Center Rehab, lab
Old Saybrook Center Imaging
Stonington Walk-In Center Imaging, lab, primary care
Crossroads Imaging Center Imaging
Sleep Center Sleep lab
Cancer Center (pending) Radiation and medical oncology
Joslin at Mystic Diabetes center

8. Strategic Land Purchase Thinking in Systems
Existing Service Distribution
• What is the next move?
Source: Stroudwater Associates

8. Strategic Land Purchase Thinking in Systems
Discharges
– 44,000 Annual
Source: Stroudwater Associates

8. Strategic Land Purchase Thinking in Systems
Existing Drive Times
– 15-20-25 Minutes
Source: Stroudwater Associates

8. Strategic Land Purchase Thinking in Systems
New Drive Times
– 15-20-25 Minutes
– For a potential west campus location
– Improve access by 13%
– 93% of patients within 25 minutes
Source: Stroudwater Associates

8. Strategic Land Purchase Thinking in Systems
New Service Distribution
– New Western Campus
Source: Stroudwater Associates

8. Strategic Land Purchase Thinking in Systems
– 100 Acres
– Direct highway access
– Site visibility from highway
– Overall site master plan
– Ambulatory
– Future impatient location

9. Strategic Land Purchase Thinking in Systems
Regional Cancer Center
– 50,000sf
– Programs• Radiation Oncology
• Medical Oncology
• Laboratory
• Pharmacy
• Community Space
– $34M Project Cost

9. Market Analysis Data Driven Decisions
Environment Assessment
– Market analysis (population, regional trends, market share, competition)
– Internal overview (utilization, financial performance, quality)
� Portfolio (service line) analysis
� Bed need analysis

9. Market Analysis Data Driven Decisions
L&M’s Portfolio Analysis

9. Market Analysis Data Driven Decisions
Bed Need Analysis
Baseline Discharge Projections
Source: Thomson Reuters
Source: Stroudwater Associates.
C hanges in Overall B ed D emand - 2025
Factor
Insurance Status Uninsured to M edicaid and Commercial
Less Population M oderates assumed population increases in baseline
Reduced Readmissions Revisions to payment po licies
LOS M anagement Based on LOS target o f 4.8 to 4.3
HM O/ACO M gmt. Expectation is 1% per year; beg. 2015
Total
5.0% 50% 80%
Chance of Impact Net Impact
2.5% 4.0%
-2.0% 25% 40% -0.5% -0.8%
-10.2% 25% 50% -2.6% -5.1%
-10.4%
Notes
Potential
Influence
-4.4% -9.1%
25% 50% -2.6% -5.2%
-5% 25% 40% -1.3% -2.0%
Adjusted Discharges
(5.6% market growth) (3.7% market growth)

10. Financial Proforma Data Driven Decisions
First, the Good News

10. Financial Proforma Data Driven Decisions
Where are revenues going with healthcare reform?
– Some volume opportunity
– Payer Mix Remains Constant
– Medicare Follows the Reform Mandates
– Medicaid = No Increase
– Other Rates Increasing at 4%

10. Financial Proforma Data Driven Decisions
Medicare Gap
39.50%64.80%2016Medicare
39.50%85.50%2009Medicare
% of Business% of CostYear

10. Financial Proforma Data Driven Decisions
What about expenses?
– Salaries Increase 4% Per Year
– Benefits Increase 4.5% Per Year
– Supplies Increase 3% Per Year
– Purchased Services Increase 3.5% Per Year
– All Other Expenses increase 5% Per Year

10. Financial Proforma Data Driven Decisions
Status Quo Model

10. Financial Proforma Data Driven Decisions
Where Should We Invest Our Capital?• Surgery
• Emergency Care
• Cancer
• Inpatient Beds
Why?• Overall decrease in market share due to facility constraints
• Some increasing volume opportunity
$140M facility investment capacity• Use scenario planning menu tool

10. Financial Proforma Data Driven Decisions

10. Financial Proforma Data Driven Decisions
Balanced Facility
Investment Scenario

10. Financial Proforma Data Driven Decisions
Staffing & Wage Strategies
TOTAL: $13.1 M Savings

10. Financial Proforma Data Driven Decisions
Project + Efficiencies = +3% Margin
11. In House Process Improvement Data Driven Decisions
What is LEAN?
– A disciplined and focused process to identify and eliminate waste and improve quality, care, and safety
– Shift in hospital culture• Looks at process through eyes of the customer
• Questions the status quo
• Asks “why”
• Continuous improvement

11. In House Process Improvement Data Driven Decisions
How is LEAN Incorporated at L&M?
– Four person department (process innovation); 200 others trained in lean principles
– 38 projects currently
– Facility development using lean design
– Design based on data and direct observation
– Trial and error with testing and simulations
– Full size mockups
– Use data to document existing process, find waste, and design new processes
– New processes leads to conceptual space design
– 3P (production, preparation, process) workshop begins lean design

11. In House Process Improvement Data Driven Decisions
3P Workshop
– Programming and space planning condensed to one week
– Multidisciplinary team including clinical staff, architects, contractors, vendors, patients, lean experts, and other stakeholders
– Team identifies and defines flow challenges and preferred flow patterns from the patient perspective

11. In House Process Improvement Data Driven Decisions
3P Workshop
– Team builder
– Facility design supports model of care
– Streamline design process
– Architect and contractor with real-time input into design

11. In House Process Improvement Data Driven Decisions
3P Tools
– Fish bone diagrams
– String diagrams mapping 7 flows of medicine
– Simulations
– 4 options
– Mock ups