steven m. fazzari, stanley feldman, cindy d. kam, and
TRANSCRIPT

PUBLIC ATTITUDES ABOUT MACROECONOMIC POLICY IN THE U.S.
Steven M. Fazzari, Stanley Feldman, Cindy D. Kam, and Steven S. Smith* Paper prepared for the annual meeting of the Midwest Political Science Association, Chicago, April 11-14, 2013. * S. Fazzari, Washington University; S. Feldman, Stony Brook University; C. Kam, Vanderbilt University; S. Smith, Washington University

1
PUBLIC ATTITUDES ABOUT MACROECONOMIC POLICY IN THE U.S. Since at least the Great Depression, most economists and most Americans
appear to have accepted that the government should play a significant role in managing the economy by adopting policies that stabilize employment, encourage economic growth, and control inflation. Nevertheless, Americans have always differed on the proper form and extent of government intervention, and these differences may have sharpened in recent decades. In general, policy attitudes appear to have sorted into liberal and conservative clusters and aligned more fully with partisan preferences (Abramowitz 2010). The Great Recession occurred in this context of party polarization and probably contributed to a continuation of change in party control of the institutions of government.
Remarkably little is known about the attitudes of Americans toward
macroeconomic policies. Although social science and popular survey research given considerable attention to fiscal policies regarding taxing and spending, the correspondence between Americans’ attitudes and the major schools of economic thought that inform policy making has not been examined by public opinion scholars. This paper reports a first effort to identify that correspondence.
We utilize a national survey conducted in July 2012 to analyze cross-sectional variation in public attitudes about macroeconomic policies. The survey allows us to characterize the distribution of attitudes toward economic policy options. We do so by (a) exploring the ability of Americans to respond to questions about macroeconomic policy, (b) developing indices to measure agreement with the major schools of economic thought, (c) exploring the correlates of agreement with the major schools of economic thought, (d) determining how Americans cluster with respect to their attitudes about macroeconomic policy, and (e) exploring the correlates of cluster membership.
We find that many Americans hold views about economic policy that are
consistent with either Keynesian or neoclassical schools of economic thought. A large minority, however, reports views that mix Keynesian and neoclassical principles. Republicans and conservatives are more homogeneous than Democrats and liberals. Republicans and conservatives are far more uniformly neoclassical in their views than Democrats are Keynesian. Political knowledge (and education and attentiveness to public affairs) facilitates the crystallization of more homogenous Keynesian or neoclassical views. However, Keynesian views, even among Democrats, are uncommon except among the most knowledgeable Americans.
The Economic and Political Context
Official accounts point to late 2007 as the start of the Great Recession.
Real gross domestic product fell by 4.5 percent from the economy’s peak in the fourth quarter of 2007 to the trough in the second quarter of 2009, a decline much larger than that of any other postwar U.S. recession. The subsequent

2
recovery settled into a pattern of sluggish growth of around two percent at an annual rate. The unemployment rate peaked at 10.0 percent in October 2009 and was on the verge of falling to 8.0 percent by January 2012.
The state of the economy has loomed large in political discourse and in the
public’s mind in the recession and recovery period. Policymakers have engaged in highly salient political debate over massive policies such as the 2008 Troubled Asset Relief Program, the 2009 stimulus bill, the auto company bailout, Patient Protection and Affordable Care Act of 2010, and the fight over the debt limit that produced the 2011 Budget Control Act. The economy was a central piece of the 2008 and 2012 presidential election campaigns.
And the economy has loomed large for the mass public as well. In
February 2009, Gallup reported that nearly nine out of ten respondents (86%) mentioned the economy as the “most important problem” facing the country. Concern with the economy has remained high for the ensuing several years, with a majority of Americans continuing to mention the economy as the most important problem facing the country. 1
The July 2012 wave occurred within this period - a period that is likely to
have been a time at which public interest in the economic policy was particularly intense and awareness of policy options was unusually widespread. We expect the influence of this economic and political context to be registered in the responses to our questions when asked in mid-2012. Remarkably, very little analysis of macroeconomic attitudes held by the American public can be found in social science. Scholars and pollsters have given considerable attention to specific fiscal policy issues—raising and cutting spending and taxes—but relatively little attention is given to broader macroeconomic choices that top policy makers address – such as managing the money supply, altering business regulations, and influencing household saving behaviors.
Scholars differ in their views about the degree to which public attitudes are
polarized and polarized by party. Abramowitz (2010), perhaps most prominently, makes the case for both a polarization of attitudes and a polarization of attitudes between self-identified Democrats and Republicans. His interpretation of the data differs from Fiorina, Abrams, and Pope (2010), who grant that Americans have sorted themselves so that liberals and conservatives are more likely to be Democrats and Republicans, respectively, but argue that the distribution of attitudes is no more bimodal in recent years than it had been for decades. Our first wave allows us to take another look at the question of polarization in Americans’ attitudes about an important field of public policy.
1 http://www.gallup.com/poll/161342/fewer-‐mention-‐economic-‐issues-‐top-‐problem.aspx

3
Macroeconomic Schools of Thought Our analysis focuses on the relationship between public attitudes and two
major schools of economic thought: Keynesian and neoclassical. John Maynard Keynes was a British economist writing in the wake of the
Great Depression. He is best known for recognizing the limits of the free market in correcting itself during economic recession. His revolutionary idea was that, in the short-term, active government intervention might be necessary to spur economic recovery. As a general matter, the Keynesian school argues that a poorly-performing economy may not be able to correct itself. Aggregate demand drives the economy – and in the modern American economy, this demand is primarily driven by consumer spending. When consumers suffer from low wages, unemployment, or the specter of continued economic struggles, they keep their wallets clamped shut – constraining aggregate demand and sending the economy into a further downward spiral. Hence, when the economy is weak, Keynesians argue that, in the short-term, government spending can serve as a temporary stopgap and as a means to stimulate consumer spending behavior. A significant policy objective among Keynesians is to stimulate spending and demand when the economy is weak. Raising taxes would deter consumer spending behavior, and reducing deficits is not prioritized. In the short-term, expansionary monetary policy (increasing the money supply) is not inflationary. Although mainstream and fundamentalist Keynesians differ on demand- and supply-side pressures in the long term, the short-term understanding of the source of economic fluctuations and the broad direction of policies designed to stabilize the economy are largely a matter of consensus among Keynesians.
Keynesianism served as the dominant guide for macroeconomic policy in
the United States until the stagflation of the 1970s. The rival school of economic theory that emerged since then is the neoclassical (often called “new classical”) school. This school argues that economic output is driven by the supply of resources (inputs) and technology. Unemployment is largely a matter of a mismatch between jobs and skills—that is, a choice by workers not to accept jobs available for the skills they have in prevailing, and possibly changing, conditions. It also is affected by incentives to take leisure over employment or to remain in a preferred geographic area even as job availability moves to different regions. According to this perspective, the primary economic problem is not insufficient spending. Monetary expansion will therefore not be very effective at stimulating the economy and could lead to undesirable inflation. Even in a weak economy, government activity is usually less productive than private activity and should be minimized: there is no need for stimulus spending. Tax changes work through incentives to raise productive capacity and improve technology rather than primarily through consumer spending. Moreover, new classical economists believe that household savings can expand the capital available to the production-side of the economy and should therefore be encouraged.
4
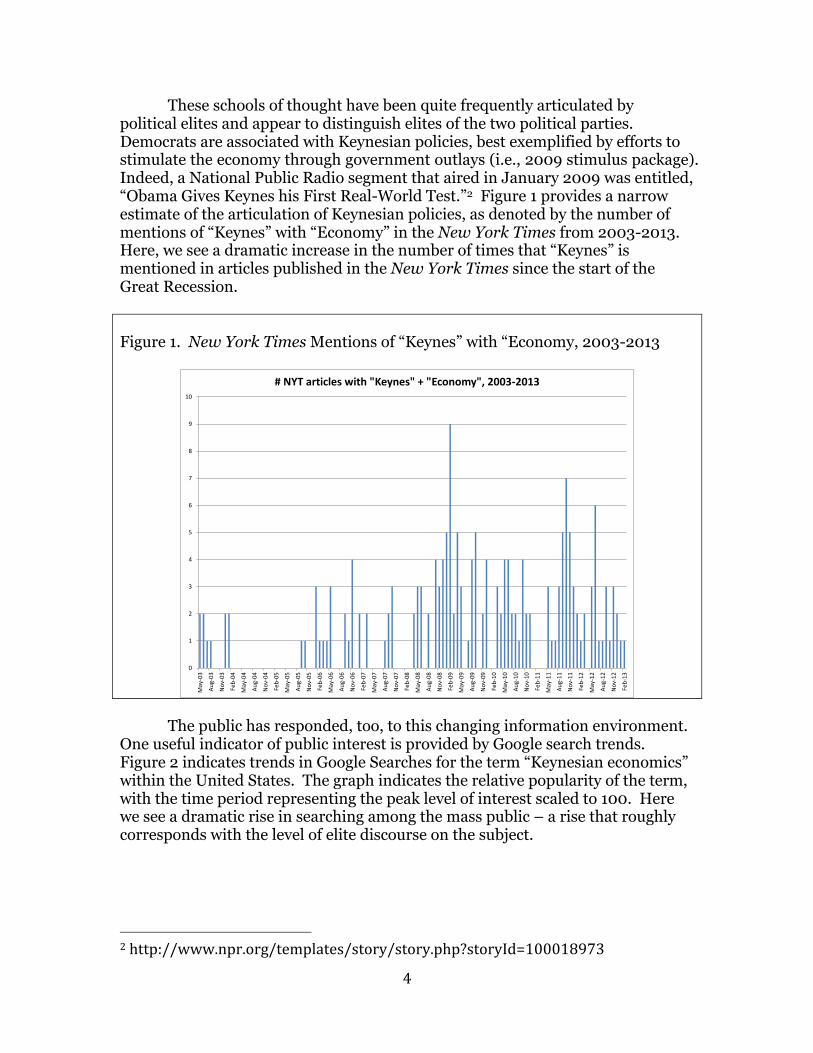
These schools of thought have been quite frequently articulated by political elites and appear to distinguish elites of the two political parties. Democrats are associated with Keynesian policies, best exemplified by efforts to stimulate the economy through government outlays (i.e., 2009 stimulus package). Indeed, a National Public Radio segment that aired in January 2009 was entitled, “Obama Gives Keynes his First Real-World Test.”2 Figure 1 provides a narrow estimate of the articulation of Keynesian policies, as denoted by the number of mentions of “Keynes” with “Economy” in the New York Times from 2003-2013. Here, we see a dramatic increase in the number of times that “Keynes” is mentioned in articles published in the New York Times since the start of the Great Recession.
Figure 1. New York Times Mentions of “Keynes” with “Economy, 2003-2013
The public has responded, too, to this changing information environment.
One useful indicator of public interest is provided by Google search trends. Figure 2 indicates trends in Google Searches for the term “Keynesian economics” within the United States. The graph indicates the relative popularity of the term, with the time period representing the peak level of interest scaled to 100. Here we see a dramatic rise in searching among the mass public – a rise that roughly corresponds with the level of elite discourse on the subject.
2 http://www.npr.org/templates/story/story.php?storyId=100018973
0
1
2
3
4
5
6
7
8
9
10
May-‐03
Aug-‐03
Nov-‐03
Feb-‐04
May-‐04
Aug-‐04
Nov-‐04
Feb-‐05
May-‐05
Aug-‐05
Nov-‐05
Feb-‐06
May-‐06
Aug-‐06
Nov-‐06
Feb-‐07
May-‐07
Aug-‐07
Nov-‐07
Feb-‐08
May-‐08
Aug-‐08
Nov-‐08
Feb-‐09
May-‐09
Aug-‐09
Nov-‐09
Feb-‐10
May-‐10
Aug-‐10
Nov-‐10
Feb-‐11
May-‐11
Aug-‐11
Nov-‐11
Feb-‐12
May-‐12
Aug-‐12
Nov-‐12
Feb-‐13
# NYT articles with "Keynes" + "Economy", 2003-‐2013

5
Figure 2. Google Searches for “Keynesian economics,” 2007-2013.
Republicans are associated with neoclassical policies – in their opposition to government stimulus spending, support for reducing deficits, and emphasis on policies that would encourage private industry to become more efficient. The distinction across the parties is consistent with the observed pattern of partisan polarization among elites on policy issues more generally. Our NYT content analysis shows that the presence of the terms “neoclassical” or “new classical” paired with the term “economy” rises a bit over the past decade (Figure 3). The small numbers also point to the narrowness of the search terms used here. The mass public has not responded in kind with information searches for “neoclassical economics” or “new classical economics,” belying the narrowness of the terminology here.
Figure 3. Google Searches for “Neoclassical” or “New Classical” with “Economy,” 2007-2013.
0
0.5
1
1.5
2
2.5
3
3.5
4
4.5
May-‐03
Aug-‐03
Nov-‐03
Feb-‐04
May-‐04
Aug-‐04
Nov-‐04
Feb-‐05
May-‐05
Aug-‐05
Nov-‐05
Feb-‐06
May-‐06
Aug-‐06
Nov-‐06
Feb-‐07
May-‐07
Aug-‐07
Nov-‐07
Feb-‐08
May-‐08
Aug-‐08
Nov-‐08
Feb-‐09
May-‐09
Aug-‐09
Nov-‐09
Feb-‐10
May-‐10
Aug-‐10
Nov-‐10
Feb-‐11
May-‐11
Aug-‐11
Nov-‐11
Feb-‐12
May-‐12
Aug-‐12
Nov-‐12
Feb-‐13
# NYT articles with "Neoclassical" Or "New Classical" + "Economy", 2003-‐2013

6
By July 2012, the stage was set for the economic education of the mass public into these two schools of thought. Political elites were talking about these schools of thought more than they had for a decade, and some members of the mass public were responding to some degree by seeking information. Our purpose here is to explore the extent to which the public internalized these two schools of thought, and in particular, to identify the segments of the public that have developed attitudes that reflect these broad economic schools of thought.
Data and Coding
Data for our analysis are drawn from The American Panel Survey (TAPS).
TAPS is a monthly online survey of about 2000 U.S. adults. TAPS panelists were recruited as a national probability sample with an addressed-based sampling frame in the fall of 2011 by Knowledge Networks for the Weidenbaum Center at Washington University. Individuals without internet access were provided a laptop and internet service at the expense of the Weidenbaum Center. In a typical month, over 1700 of the panelists complete the online survey. The July 2012 survey was completed by 1712 panelists. More technical information about the survey is available at taps.wustl.edu. All dated reported in this paper are weighted by the CPS for mid-2012.
Our survey included a wide range of questions about the economy and
economic policy. We focus here on a ten-question battery that was prefaced by this statement:
Policymakers often design policies to address immediate, short-term economic conditions, but these policies may have beneficial or harmful effects in the long run. We are interested in your views about the factors that improve or harm the American economy. Consider the following policies that might be adopted during a recession or weak economy. Describe your views about how effective each of the policies listed below would be in improving the national economy during a recession or weak economy.
Thus, the focus of our analysis is attitudes about economic policy in the context of a recession.
For each of ten items, each panelist was asked to “describe your views about how effective each of these policies listed below would be in improving the national economy during a recession or weak economy.” The response set is:
1. greatly improves the economy 2. improves the economy 3. has little effect on the economy 4. harms the economy 5. greatly harms the economy

7
6. don’t know A panelist could skip an item without choosing a response.
The ten items are listed in Table 1. For each item, the table indicates the Keynesian and neoclassical position for short-term economic policy in a weak economy as we classify them. These positions are used below to create Keynesian and neoclassical indexes for panelists.
Table 1. Economic Policy Items and the Positions of the
Major Schools of Economic Thought. School of Thought
Keynesian Neoclassical raise government spending supports opposes raise taxes opposes opposes reduce government deficits opposes supports increase the money supply supports no preference lower regulations on business no preference supports stimulate more consumer spending supports opposes encourage more household saving opposes supports raise wages supports no preference encourage better use of technology by business no preference supports lower taxes of foreign goods coming into the U.S. opposes supports
To what extent can we uncover Keynesian and neoclassical clusters among the mass public? Finding them may be a difficult task. These questions ask panelists to consider various aspects of economic policy beyond just taxing and spending. Some of these policy items are closer to home than others, and some are more prevalent in political debate than others. These items ask panelists to consider the potential impact of a diverse set of economic policies on the economy at large. Does the mass public have any thoughts on these various policies?
Findings
We examine Americans’ economic attitudes in three complementary steps. First, we explore the determinants of nonresponse to what may be difficult questions about economics. Second, we report measures of support for Keynesian and neoclassical schools of thought and examine their correlates. Third, we perform a latent class analysis to identify the natural clustering of respondents according to their expressed economic policy attitudes and consider the correlates of group membership.

8
Nonresponse
We begin by examining the extent to which panelists are willing to venture an assessment of the economic impacts of these various economic positions in the short-term. Figure 4 depicts rates of refusal and Don’t Knows, sorted by question.
The items that are most readily answered by the sample have to do with fiscal policy questions regarding taxes and spending. The vast majority of respondents are willing to state an opinion on whether raising taxes is a good idea for the economy during a recession (only 9 percent refused or said “Don’t Know”). Nearly 90 percent have an opinion on whether raising government spending and consumer spending are good or bad ideas for the economy, and whether raising wages and encouraging more household spending would be advisable.
Figure 4. Rates of Refusals and DK’s, by Item
The level of nonresponse rises for items that are likely to be more technical or less familiar. Nearly 20 percent of respondents could not say whether they though raising regulations on businesses would have a good or bad effect on the economy in the short-term, although this is an important aspect of neoclassical economics. About 18 percent of respondents could not say whether reducing
0 0.05 0.1 0.15 0.2 0.25
Raise Taxes
More Consumer Spending
Raise Gov Spending
Raise Wages
More Household Saving
Reduce Deficits
More Technology in Business
Increase Money Supply
Reduce Import Taxes
Reduce Business Regulations
Proportion of Sample [Weighted], with 95% CI

9
import taxes on foreign goods coming to the U.S. would have a good or bad effect on the economy in the short-term (even though the two schools of thought dictate opposing views on this item).
Figure 5 provides the distribution of the number of questions answered. All ten questions were answered by 60 percent of respondents. Another 14 percent of respondents failed to offer a response to just one question. At the other end of the spectrum, 7 percent of respondents did not answer any question in the battery.
Figure 5. Number of Refusals and “Don’t Know” Responses
to Economic Schools of Thought Battery
We model nonresponse with a dependent variable that consists of the number of items that are skipped or the respondent chooses “Don’t Know.” In Table 2, we see that the most prominent determinants of nonresponse on this battery are engagement with politics, as measured by a Zaller-type (1992) political awareness scale, and by a question asking the respondents’ interest in following politics and government. As we might suspect, people who know more factual information about government answer significantly more of these questions than people who know less information about government, and people who profess to have more interest in politics and government answer more of these questions than people who are uninterested in politics. In addition, liberals answer fewer questions than conservatives, younger people answer fewer of these questions than older people, and people with lower incomes answer fewer of these questions than people with higher incomes, holding all else equal. Education, party identification, and race do not have a significant independent effect on the number of responses.
0
0.1
0.2
0.3
0.4
0.5
0.6
0.7
0 1 2 3 4 5 6 7 8 9 10
Prop
ortio
n of sa
mple [w
eighted]

10
Table 2. Correlates of Nonresponse on Economic Schools of Thought Battery
Number of Refusals or DK’s on
Economic Schools of Thought Partisanship -0.08 0.33 Ideology -0.79* 0.48 Education -0.46 0.33 Political Awareness -1.37*** 0.37 Female 0.10 0.23 Age -1.65** * 0.54 Black 0.18 0.48 Hispanic -0.33 0.31 Race: Other -0.14 0.31 Interest in Politics -0.73* 0.38 Strength of Partisanship -0.40 0.37 Household Income -0.54** 0.26 Intercept 4.42 0.73 p>F 0.00 R2 0.14 N 1453 OLS regression coefficient with standard error below. Weighted analysis. *p<0.10; **p<0.05; ***p<0.01.
Inter-Item Coherence
These two major schools of economic thought are based not upon logical sources of constraint, but upon social sources of constraint (Converse 1964). These diverse policy prescriptions are held together not by formal logic but by, as Converse (1964) would say, “quasi-logical reasons developed from a coherent world view” (p. 211). With experts themselves disagreeing sharply on what configuration of policies can remedy a lagging economy, for the public, knowing “what goes with what” is largely a function of receiving and internalizing messages from political elites. To what extent does the mass public do so?

11
As an initial attempt to ascertain the level of constraint within the mass
public, we estimate Cronbach’s alpha and the inter-item covariances for the items that are viewed to load on Keynesian and neoclassical schools of thought, respectively. The eight items that were ex ante identified as instantiations of Keynesianism have a Cronbach’s alpha = 0.34, and this poor fit is attributable to the loading of a single item: respondents’ views of the potential effect of raising taxes on the economy. Cronbach’s alpha increases to 0.57 when the second item in the scale is allowed to load in the reverse direction. The eight items that were ex ante identified as instantiations of neoclassical views cohere reasonably well together, with a Cronbach’s alpha = 0.57.
In Table 3, we list the factor loadings from an unrotated principal
components analysis. Here, we see that the item with the largest factor loading concerns the short-term effects of raising government spending on the economy. Here, Keynesians and neoclassical economists diverge sharply on the effects of government spending on the economy in the short-term, and this item is the centerpiece of the mass public’s views as well. We also see that the mass public aligns well on the matter of reducing government deficits: Keynesians will tolerate government deficits in the short-run, while neoclassical economists support deficit reduction. The mass public’s views align with those of the economists here.
Table 3. Factor Loadings of Economic Policy Items
School of Thought Keynesian Neoclassical
raise government spending Supports: 0.72 Opposes: 0.72 raise taxes Opposes: -0.46 Opposes: 0.50 reduce government deficits Opposes: 0.49 Supports: 0.52 increase the money supply Supports: 0.45 no preference: n/a lower regulations on business no preference: n/a Supports: 0.46 stimulate more consumer spending Supports: 0.34 Opposes: 0.21 encourage more household saving Opposes: 0.31 Supports: 0.36 raise wages Supports: 0.34 no preference: n/a encourage better use of technology by business
no preference: n/a Supports: 0.003
lower taxes of foreign goods coming into the U.S.
Opposes: 0.04 Supports: 0.12
Eigenvalue, Factor 1 1.49 1.44 Eigenvalue, Factor 2 0.50 0.47 Cronbach’s α 0.57
(after reversing the taxes item)
0.57
Note: unweighted. Principal components analysis, unrotated. N=1154 and 1167.
Interestingly, the data also indicate a very clear departure from pure Keynesianism on the matter of raising taxes. Keynesian economists oppose

12
raising taxes as a means to stimulate a lagging economy. (On this point, both Keynesian economists and neoclassical economists agree that raising taxes will hurt a lagging economy in the short-term). The public, insofar as it adheres to Keynesianism, has taken a fairly significant departure on this item. The mass neoclassical supporters see raising taxes as harming the economy in the short-term, but the mass Keynesians are less dour about it: they see fewer problems with raising taxes in the short-term.
How do we interpret this divergence among the mass public? One
possibility is that Keynesians generally happen to be liberals and Democrats who support raising taxes (or at least see fewer problems with raising taxes). They may not want to raise taxes in order to stimulate the economy, but rather to support domestic outlays on social welfare programs. Since they are generally supportive of raising taxes to support programmatic expansion, they may figure that raising taxes should also be good for (or at least not detrimental to) stabilizing the economy. Another possibility is that Keynesians (who happen to be liberals and Democrats) are focusing on raising specific types of taxes – taxes on wealthy families (as articulated by Obama in a July 9, 2012 campaign stop) or taxes on corporations. With the data here, we cannot probe the precise meaning of why mass Keynesians depart so fundamentally from the prescriptions of pure Keynesianism, but the disjuncture highlights clear tensions between pure Keynesians, their mass followers, and the politics of macroeconomic policies. Scales of Macroeconomic Attitudes
Based on the coding in Table 1, we created a set of scales that represent pure economic (as dictated by economists) and mass-public schools of thought, for the Keynesian and neoclassical schools, respectively. For the mass-public Keynesian scale, we reverse-coded raising taxes and removed a poorly performing item (raising import taxes on foreign goods). The resulting seven-item scale has a Cronbach’s alpha of 0.61. For the mass-public neoclassical scale, we removed two poorly performing items (encouraging more effective use of technology in business and raising import taxes on foreign goods). The resulting six-item scale has a Cronbach’s alpha of 0.62. Each scale is an additive index that averages responses from panelists who answered at least half of the relevant items.
The weighted scale correlations in the Table 4 below show that the link between Keynesian and neoclassical ideas is more pronounced in the mass-public version (where the magnitude of the correlation rises from -0.65 for the Pure versions to -0.86 for the Mass-Public versions). There are barely any differences between the pure and mass-public neoclassical categories (dropping the two poorly performing items makes little difference).
The estimated effects of political and demographic characteristics on
economic scale scores are shown in Tables 5 and 6. Partisanship and ideology are

13
significant predictors of pure Keynesian and pure neoclassical views – and they are even stronger predictors of the mass-public versions. Moreover, people who are more politically aware and have higher incomes are less likely to be neoclassical of either variety, holding all else equal.
Table 4. Correlations among Economic Attitude Scales Pure
Keynesian Mass-Public Keynesian
Pure Neoclassical
Pure Keynesian 1.00 Mass Public Keynesian 0.77 1.00 Pure Neoclassical -0.65 -0.75 1.00 Mass Public Neoclassical -0.61 -0.86 0.93
Table 5. Correlates of Four Economic Attitude Scales Pure
Keynesian Mass-Public Keynesian
Pure Neoclassical
Mass-Public Neoclassical
Partisanship -0.03* -0.08*** 0.07*** 0.09*** 0.02 0.02 0.02 0.02 Ideology -0.09*** -0.16*** 0.12*** 0.16*** 0.03 0.03 0.02 0.03 Education -0.00 0.01 -0.02 -0.03 0.02 0.02 0.02 0.02 Political 0.02 0.04** -0.07*** -0.07*** Information 0.02 0.02 0.02 0.02 Female -0.01 0.01 -0.00 -0.00 0.01 0.01 0.01 0.01 Age 0.04 0.00 0.02 0.03 0.03 0.03 0.03 0.03 Black -0.01 -0.00 0.04** 0.03 0.02 0.02 0.02 0.02 Hispanic -0.03 -0.01 0.01 0.01 0.01 0.01 0.01 0.01 Race: Other 0.04* 0.02 0.02 0.02 0.02 0.02 0.02 0.02 Household 0.02* 0.02 -0.04*** -0.03** Income 0.01 0.02 0.01 0.02 Intercept 0.57 0.54 0.54 0.52 0.02 0.02 0.02 0.02 N 1357 1374 1350 1334 Table entry is the OLS coefficient with standard error below. Weighted analysis. *p<0.10; **p<0.05; ***p<0.01.
If the internalization of “what goes with what” is largely a function of the receipt of elite messages, then we should expect adherence to these economic schools of thought to be greater among the more politically informed. For the

14
most part, this is what we find, when we interact partisanship with political information. The notable exception emerges when it comes to “Pure Keynesianism.” Here, we think this departure from Pure Keynesianism could be indicative of the mixed messages being sent by political elites themselves. Indeed, Paul Krugman published an editorial entitled “The Obama-Keynes Mystery” in which he criticizes Obama for “throw[ing] his rhetorical weight behind anti-Keynesian economics” and “talking nonsense about economics.”3 In a July 9, 2012 speech focusing on taxes (which occurred within our fielding period), President Obama argued for allowing the tax cuts for families making over $250,000 to expire” while protecting tax cuts for the middle class. He notes explicitly that “these tax cuts for the wealthiest Americans are also the tax cuts that are least likely to promote growth.”4
Table 6. Correlates of Four Economic Attitude Scales, Interacting Partisanship and Information
Pure
Keynesian Mass-Public Keynesian
Pure Neoclassical
Mass-Public Neoclassical
Partisanship * -0.07 -0.16*** 0.18*** 0.20*** Information 0.05 0.05 0.04 0.04 Partisanship 0.01 0.01 -0.04 -0.02 0.03 0.04 0.03 0.03 Ideology -0.09*** -0.14*** 0.10*** 0.14*** 0.03 0.03 0.03 0.03 Education -0.00 0.01 -0.02 -0.04* 0.02 0.02 0.02 0.02 Political 0.05** 0.11*** -0.15*** -0.16*** Information 0.03 0.02 0.02 0.02 Female -0.01 0.01 -0.00 -0.00 0.01 0.01 0.01 0.01 Age 0.04 0.00 0.02 0.03 0.03 0.03 0.03 0.03 Black -0.01 0.01 0.03* 0.02 0.02 0.02 0.02 0.02 Hispanic -0.03* -0.00 0.00 0.00 0.01 0.01 0.01 0.01 Race: Other 0.04* 0.03 0.01 0.01 0.03 0.02 0.02 0.02 Household 0.02* 0.02 -0.04** -0.03* Income 0.01 0.02 0.01 0.02 Intercept 0.55 0.49 0.59 0.57 0.03 0.03 0.02 0.03 N 1357 1374 1350 1334 Table entry is the OLS coefficient with standard error below. Weighted analysis. *p<0.10; **p<0.05; ***p<0.01. 3 http://krugman.blogs.nytimes.com/2011/07/06/the-‐obama-‐keynes-‐mystery/ 4 http://blogs.wsj.com/washwire/2012/07/09/transcript-‐of-‐obama-‐tax-‐remarks/

15
Figure 6 depicts the interactions for mass-public Keynesianism and mass-public neoclassicism. The dashed lines represent the predicted scale values for Strong Democrats and the solid line indicates the predicted scale values for strong Republicans. Notice that the information effects emerge most strongly for Democrats, not Republicans. Among Strong Republicans we see only modest information effects: for the most part, Strong Republicans are in the neoclassical school and not in the Keynesian school. Among Strong Democrats, we see that information makes a difference. That is, the information about “what goes with what” is important for getting Strong Democrats into the Keynesian realm and out of the neoclassical realm. Indeed, the least informed Strong Democrats find themselves closer to Republicans than their co-partisans. Similar patterns appear for the interaction of ideological self-identification and information (Figure7).
Figure 6. Interaction Effects of Party Identification and Information on Economic Attitudes
.4.4
5.5
.55
.6.6
5
Pre
dict
ed M
-P K
eyne
sian
ism
0 .2 .4 .6 .8 1Political Information
Str Democrat Str Republican
Mass Public Keynesianism.4
.45
.5.5
5.6
.65
Pre
dict
ed M
-P N
eocl
assi
cism
0 .2 .4 .6 .8 1Political Information
Str Democrat Str Republican
Mass Public Neoclassicism

16
Figure 7. Interaction Effects of Ideological Self-Identification and Information
on Economic Attitudes
Latent Classes in Economic Attitudes
We next turn to latent class analysis as another way of determining the degree to which citizens have constrained economic belief systems consistent with neoclassical or Keynesian principles. 5 Where factor analysis attempts to account for the covariances among a set of items via continuous latent dimensions, latent class analysis does so by estimating the parameters of a discrete latent variable. Within each value of the latent variable (a latent class), it is assumed that the probabilities of responding to each observed variable are homogeneous. Variation in responses to these questions across the entire sample is therefore assumed to be a function of differences between the latent classes. In effect, latent class analysis identifies groups of people who share a common set of attitudes. The parameters of the latent class are the probabilities within each class of responding to each of the three response categories for each variable and the proportion of the sample in each latent class. The meaning of each latent class is inferred from the estimated response probabilities.
To simplify estimation and interpretation the items were trichotomized so each had categories of “improves the economy,” “has little effect,” and “hurts the economy.” A series of models with an increasing number of latent classes were estimated to find the optimal number of classes to best account for the observed data. We then examined the BIC (Bayesian Information Criterion) for those models. The BIC decreased as the number of classes increased from 1 to 4. There 5 Latent class analysis was conducted using the Mplus software package.
.3.4
.5.6
.7
Pre
dict
ed M
-P K
eyne
sian
ism
0 .2 .4 .6 .8 1Political Information
Ext Liberal Ext Conservative
Mass Public Keynesianism
.3.4
.5.6
.7
Pre
dict
ed M
-P N
eocl
assi
cism
0 .2 .4 .6 .8 1Political Information
Ext Liberal Ext Conservative
Mass Public Neoclassicism

17
was no further decrease in the BIC going from 4 to 5 latent classes, and the BIC increased moving from 5 to 6 classes.6 This suggests that a 4 class model is most appropriate for these data. In addition, the latent classes become more distinct and interpretable as we go from 1 to 4 classes. After that, the additional classes are just minor variations of others. In Table 7 we show the estimated probabilities of each category of the ten questions for each of the four latent classes.
Class 1 is the clearest neoclassical/conservative group. They very strongly believe that raising government spending, raising taxes, and not reducing deficits hurt the economy. Clear opinions on the money supply and regulation differentiate this group to some extent from Class 2. However, the consumer spending and household saving results pose an interesting enigma. The fairly large share of this group that thinks that higher consumer spending is good for the economy largely contradicts its clear policy views. If one believes that government spending and expansionary monetary policy are bad, there is really not much basis for arguing that consumer spending is good. Even the “no effect” result is weakly inconsistent with the policy views. If demand is not the problem (higher government spending hurts the economy) the most consistent perspective would be that higher consumer spending is bad for the economy since it drains resources away from saving and business investment. Based on their macro policy preferences, one would also expect class 1 to be strong free traders if they reasoned from a coherent economic theory. Yet most are not in favor of reducing barriers to trade.
Table 7. Estimated Latent Class Probabilities
Class 1 d
Neoc
Class 2 Class 3 Class 4 Raise Gov't Spending
Improves Economy 0.062 0.178 0.946 0.086 No Effect 0.112 0.077 0.048 0.374 Hurts Economy 0.826 0.745 0.006 0.540 Raise Taxes
Improves Economy 0.010 0.179 0.282 0.086 No Effect 0.053 0.057 0.226 0.238 Hurts Economy 0.937 0.764 0.492 0.676 Reduce Deficits
Improves Economy 0.836 0.840 0.305 0.430 No Effect 0.102 0.102 0.291 0.480 Hurts Economy 0.062 0.058 0.404 0.089 Increase Money Supply
Improves Economy 0.101 0.488 0.626 0.291 No Effect 0.132 0.114 0.144 0.406 Hurts Economy 0.767 0.399 0.230 0.303 Less Regulation
Improves Economy 0.860 0.574 0.293 0.275 No Effect 0.067 0.162 0.337 0.597 Hurts Economy 0.073 0.264 0.370 0.128 More Consumer Spending
6 The values of the BIC for 1 to 6 class models are: 27249, 26610, 26423, 26353, 26353, 26429.

18
Improves Economy 0.606 0.919 0.963 0.567 No Effect 0.258 0.046 0.021 0.390 Hurts Economy 0.136 0.035 0.016 0.044 More Household Savings
Improves Economy 0.462 0.606 0.208 0.262 No Effect 0.431 0.235 0.363 0.621 Hurts Economy 0.108 0.159 0.429 0.116 Raise Wages
Improves Economy 0.146 0.854 0.742 0.589 No Effect 0.376 0.086 0.152 0.388 Hurts Economy 0.479 0.060 0.105 0.023 More Technology
Improves Economy 0.552 0.825 0.712 0.351 No Effect 0.364 0.142 0.235 0.598 Hurts Economy 0.084 0.034 0.053 0.050 Lower Taxes on Foreign Goods
Improves Economy 0.176 0.314 0.144 0.167 No Effect 0.196 0.087 0.157 0.397 Hurts Economy 0.628 0.599 0.699 0.435
Estimated Class Proportion
10-21% 21-26% 38-46% 15-25%
The economic views of those in Class 2 are not quite as clear cut as those in Class 1. They still seem to support basic conservative positions rather clearly on fiscal policy. But this group follows the conservative line much less clearly than Class 1 when it come the less politically prominent categories of monetary policy and regulation. In a major departure from conservative economic philosophy, members of Class 2 look entirely Keynesian on consumer spending. They also apparently see no inconsistency between saying that more consumer spending and more household savings are good for the economy. Members of Class 2 have opinions about the consequences of economic policies for the economy but, overall, it is an even less coherent economic vision than Class 1.
Members of Class 3 seem to be fairly consistent Keynesians. They express
strong Keynesian views on the benefits of government spending and consumer spending and they believe that increasing the money supply during a recession improves the economy. On the other hand, significant numbers of people in this class deviate from Keynesian principles on taxes and deficit spending. One way to reconcile these results is to say that these people, despite their Keynesian leanings, think that the deficit needs to be dealt with, perhaps by higher taxes on the rich. But this is more of a long-run concern for Keynesians and it’s not at all clear how lower deficits would improve the short-run economy if you take a Keynesian perspective. Interestingly, a big part of this group seems to understand the paradox of thrift. A plurality says that higher household saving hurts the economy. This can be a subtle issue that flies in the face of personal experience. That this result emerges suggests that there is indeed basic Keynesian reasoning behind the opinions of class 3.
Members of Class 4 exhibit little in the way of coherent views about
economic policy. On each of the ten questions there is a significant estimated probability that members of this group responded that the policy would have

19
little effect on the economy. They lean somewhat conservative on questions of government spending, taxes, and the deficit. On the other hand, they tend to believe that higher wages and more consumer spending is good for the economy. As a whole, members of this group seem not to understand much about the consequences of economic policy and, where they do have some positions, they appear to be pulled along in one direction by prevailing winds on government spending and taxes and in another by consumer spending and wages.
The last row of Table 7 shows the estimated proportion of the sample in each of the latent classes. We show a range of values as those estimates are influenced by the sample post-stratification weights. Importantly, those weights do not have a significant effect on the number or interpretation of the latent classes. Correlates of Class Membership
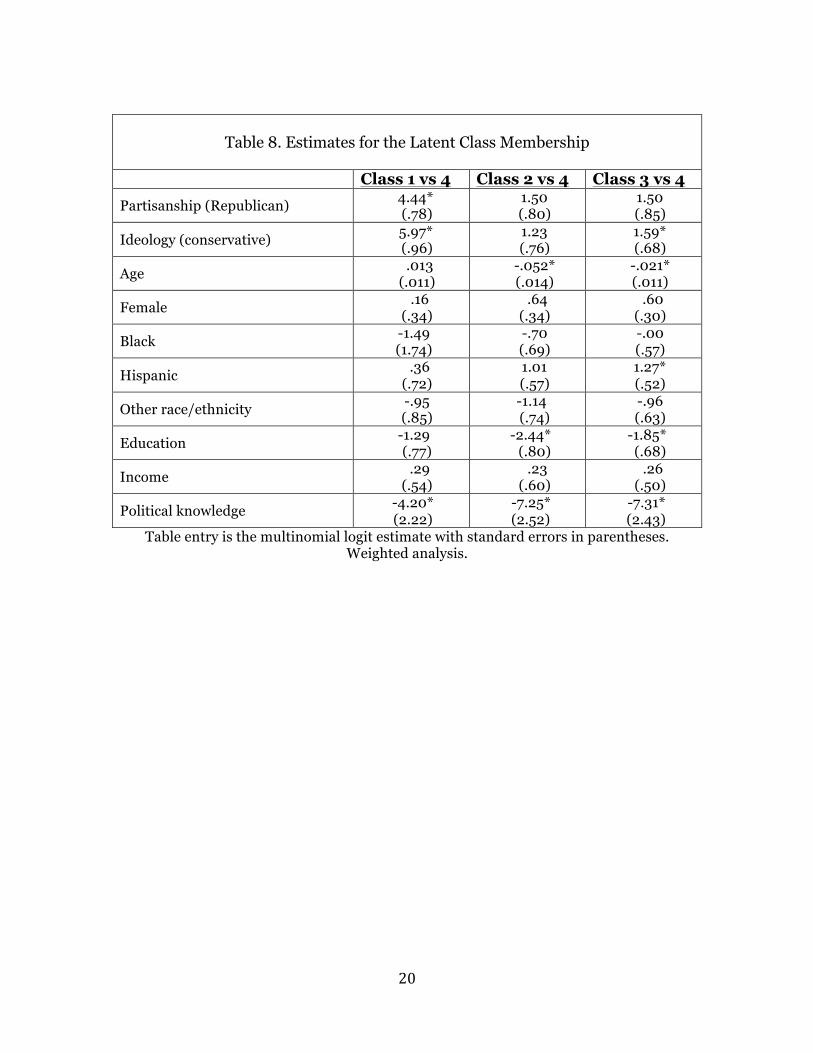
Having described a series of classes of individuals in our sample, we now turn to identifying the kinds of people who are in those four latent classes. We regressed the discrete latent variable on a series of predictor variables: partisanship, ideology (self-placement), political information, age, gender, education, income, and race/ethnicity. Since the dependent variable is an unordered, discrete variable, the statistical model is analogous to a multinomial logit. The estimates from this model are shown in Table 8. As MNL coefficient estimates are difficult to interpret, we graph the key results.
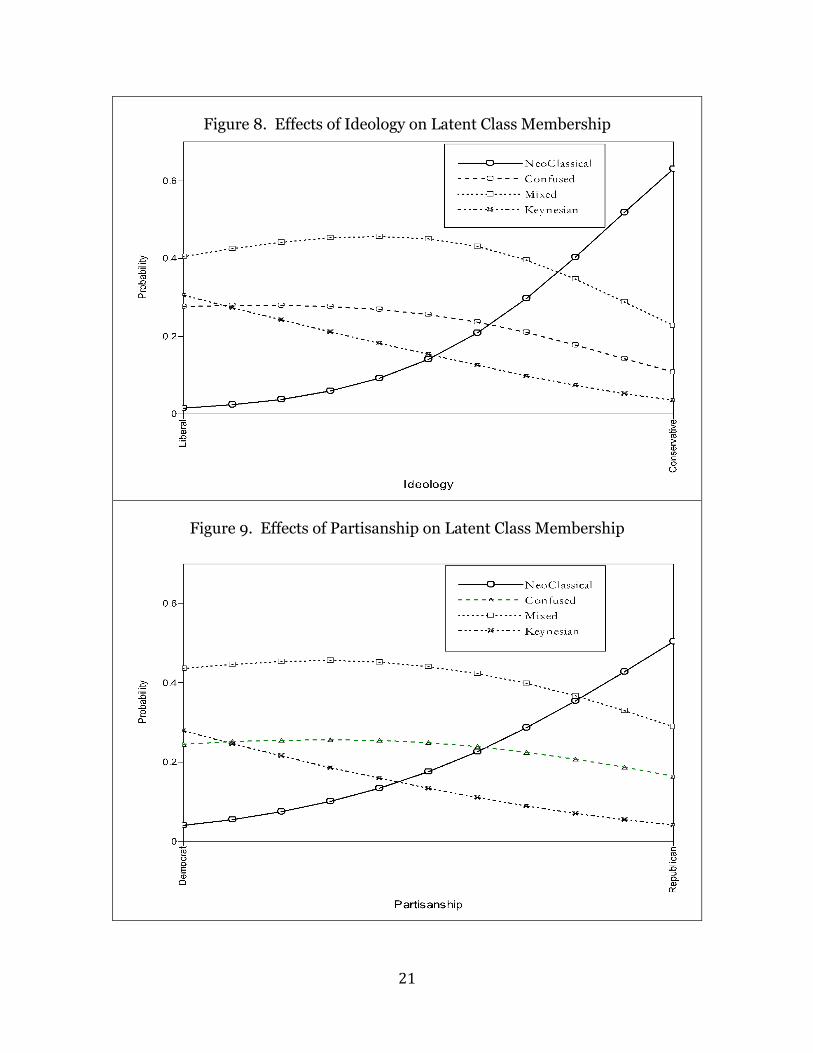
Figure 8 shows the predicted probability of membership in each latent class as a function of ideology. We computed these probabilities setting gender to female and race/ethnicity to white with all other variables set to their sample means. Looking first at the predicted probabilities for strong conservatives we see that the Neoclassical class is most likely with an predicted probability of greater than .6. Secondarily, there is a probability of about .25 that strong conservatives will be members of the mixed latent class. Overall we can see that strong conservatives are relatively united in their belief that government spending, taxes, and deficit spending during a recession are harmful to the economy. Many conservatives deviate from strict neoclassical theory in their belief that consumer spending will help recover from a recession but they strongly oppose government action to stimulate the economy.
The picture is quite different for strong liberals. It is most likely that they
are members of the mixed latent class that oppose government spending and deficits. And they are barely more likely to be members of the Keynesian latent class than the confused class. While conservatives are consistently opposed to government actions to stimulate the economy, liberals are fairly heterogeneous. Conservative elites speak to a receptive audience while liberal elites should have a much more difficult time selling a Keynesian response to recession. As Figure 9 shows, a very similar picture appears when we plot the predicted probabilities against partisanship.
20
Table 8. Estimates for the Latent Class Membership
Class 1 vs 4 Class 2 vs 4 Class 3 vs 4 Partisanship (Republican) 4.44*
(.78) 1.50 (.80)
1.50 (.85)
Ideology (conservative) 5.97* (.96)
1.23 (.76)
1.59* (.68)
Age .013 (.011)
-.052* (.014)
-.021* (.011)
Female .16 (.34)
.64 (.34)
.60 (.30)
Black -1.49 (1.74)
-.70 (.69)
-.00 (.57)
Hispanic .36 (.72)
1.01 (.57)
1.27* (.52)
Other race/ethnicity -.95 (.85)
-1.14 (.74)
-.96 (.63)
Education -1.29 (.77)
-2.44* (.80)
-1.85* (.68)
Income .29 (.54)
.23 (.60)
.26 (.50)
Political knowledge -4.20* (2.22)
-7.25* (2.52)
-7.31* (2.43)
Table entry is the multinomial logit estimate with standard errors in parentheses. Weighted analysis.
21
Figure 8. Effects of Ideology on Latent Class Membership
Figure 9. Effects of Partisanship on Latent Class Membership

22
We thus have two asymmetries in patterns of latent class memberships: The probability of being in the Keynesian class is much lower for liberals than membership in the neoclassical class is for conservatives and, as seen in Figures 8 and 9, much higher levels of information are needed for the Keynesian than the neoclassical class. We explore these patterns jointly in Figures 10 and 11.
Figure 10 shows the effects of information on the predicted probabilities of
membership in the four classes for people who are strong conservatives and strong Republicans. Here we see that information has modest effects on the probability that a strong conservative/Republican will be in the neoclassical class. At high levels of information that probability exceeds .9. Importantly, there is still a very high probability of being in the neoclassical class even for those very low in information; only modest levels of information are needed for a strong conservative/Republican to be in this class and the probability exceeds .8 for those below the mean of information.
In Figure 11, a very different pattern emerges for strong liberals/Democrats. As before, at the highest levels of knowledge the probability of being in the Keynesian class is very high. But that probability declines to zero as information decreases. Below the mean in information it is more likely that a strong liberal/Democrat will be a member of the mixed or confused class than the Keynesian class. Conservatives appear to readily support key elements of neoclassical economics – little political sophistication is required. A great deal of sophistication seems to be necessary for liberals to support the principles of Keynesian economics.

23
Figure 10. Effects of Information on Latent Class Membership for Strong Conservatives/Republicans
Figure 11. Effects of Information on Latent Class Membership for Strong Liberals/Democrats

24
Conclusion
The Great Recession has had a substantial impact on American economic and political life. The state of the economy has emerged consistently as an important, if not the most important, problem facing the country in the past five years. Knowing that the economy is a problem and knowing how to fix it are two very different things, however.
In this paper, we have provided a glimpse at what Americans think should be done in the short-term to spur economic growth within the context of a recession. Several of the questions about economic policy prove difficult for many Americans to answer. People who know more factual information about government answer significantly more of these questions than people who know less information about government, and people who profess to have more interest in politics and government answer more of these questions than people who are uninterested in politics. In addition, liberals answer fewer questions than conservatives, younger people answer fewer of these questions than older people, and people with lower incomes answer fewer of these questions than people with higher incomes, holding all else equal. Education, party identification, and race do not have a significant independent effect on the number of responses.
We find that a majority of Americans hold views about economic policy that are consistent with either Keynesian or neoclassical schools of economic thought. A large minority, however, reports views that mix Keynesian and neoclassical principles. Republicans and conservatives are more homogeneous than Democrats and liberals. Republicans and conservatives are far more uniformly neoclassical in their views than Democrats are Keynesian. Political knowledge (and education and attentiveness to public affairs) is related to holding more homogenous Keynesian or neoclassical views. Keynesian views, even among Democrats, are uncommon except among knowledgeable Americans.
With respect to economic beliefs in 2012, we have uncovered a partisan or
ideological asymmetry that seems likely to have had political consequences. Republican elites benefit from a far more homogeneous electoral coalition than Democratic elites. A reasonable speculation is that this pattern is registered among Washington policy makers as different sets of incentives for compromise on economic and fiscal matters. Republicans may be more emboldened than Democrats to establish uncompromising bargaining positions without too much concern that their “base” will object. In contrast, Democrats may have a more difficult time persuading the less well informed elements of their coalition that their basic Keynesian policies are desirable and may find that it is more difficult to satisfy significant parts of their electoral coalition.

25
Appendix. Variable coding.
Variable Description/coding Coding Partisanship partisanship in 7 categories 0=strong Democrat to
1=strong GOP Ideology ideology in 7 categories 0=extremely liberal to
1=extremely conservative, DK to midpoint
Education education in 6 categories 0=<HS degree to 1=advanced degree
Political Awareness
factual political information scale
0=none correct to 1= 8 correct
Female Sex of respondent 1=female; 0 male Black Race of respondent 1=black; 0=not black) Hispanic Ethnicity of respondent 1=Hispanic; 0=not Hispanic Race: Other Race of respondent 1=Native Am, Asian, Other;
0=not Interest in Politics
Self-reported interest in following politics & government
0=not at all interested to 1=very interested
Strength of Partisanship
Strength of partisanship 0=pure Independent to 1=strong partisan
Household Income
Household income in 4 quartiles
0=bottom quartile to 1=top quartile

26
References Abramowitz, Alan I. 2010. The disappearing center: Engaged citizens, polarization,
and American democracy. New Haven: Yale University Press. Converse, Philip E. 1964. "The nature of belief systems in mass publics." In Ideology
and Discontent, ed. David E. Apter. New York: Free Press. 206-‐261. Fiorina, Morris P., Samuel J. Adams, and Jeremy C. Pope. 2010. Culture war? The
myth of a polarized America (3rd ed). New York: Pearson. Zaller, John R. 1992. The nature and origins of mass opinion. Cambridge: Cambridge
University Press.