status & trend networks smapling manual - oct 2017 revision · revision to the status &...
TRANSCRIPT

Sampling Manual Revision – Oct. 2017 09/15/2017
Page A-1 of 37 Revision to the Status & Trend Networks Sampling Manual – Effective October 1, 2017
Updates to Sampling Manual Section 1: Introduction, Description of Networks, Training The number of Ground Water Trend Network stations has increased to 51.
This revision to the Status and Trend Networks Sampling Manual includes updates to address revisions to the DEP SOPs dated January 2017, for which rulemaking is currently underway.
Updates to Sampling Manual Section 3: Instrument Calibration Procedures The definition of Chronological Calibration Bracket has been updated. The instrument or meter must be verified before sample measurements and verified after sample measurements. This means that data must be "J" qualified if samplers forget to perform an ICV immediately after calibrating the meter, before collecting any field data.
The number of decimal places to record for all field testing calibrations, calibration verifications, and sample measurements has changed.
• For pH, specific conductance, dissolved oxygen, temperature, and turbidity, record the instrumentreading to the resolution stated by the instrument manufacturer for the measurement range (i.e. recordall digits displayed).
• Record all calibrations and verifications for electronic depth measuring devices to two decimal places.Record all verifications for manual devices to one decimal place. When recording depthmeasurements in the field (total depth, sample collection depth, and secchi depth when visible onbottom), record two decimal places if total depth < 0.6m, and record one decimal place if total depth ≥0.6m. If the second decimal place is 0, 1, 2, 3, or 4, the value is rounded down (e.g. 0.64 becomes0.6). If the second decimal place is 5, 6, 7, 8, or 9, the value is rounded up (e.g. 0.65 becomes 0.7).
The requirements for depth measurement device verification frequency have changed.
• Daily: Calibrate (zero or enter an offset value) and verify (ICV) depth sensors in field multi-parametermeters (acceptance criteria: ± 5% or ± 0.05 m, whichever is greater).
• Quarterly: Verify all electronic depth measuring devices (sensors in field multi-parameter meters andsonar devices) against a reference device such as a graduated bucket, meter stick, or metal measuringtape, or against a weighted line or secchi disk line that has been checked for accuracy as describedbelow (acceptance criteria: ± 10%).
• Every 6 months: Verify incremental markings (acceptance criteria: ± 10%) and total length of line upto greatest anticipated depth encountered in the field (acceptance criteria: ± 5%) for all secchi disklines and weighted lines used for depth measurements. Use a meter stick or metal measuring tape as areference device.
Additional Updates for Dissolved Oxygen Meters
Dissolved oxygen calibration and verification may be performed using either the water-saturated air method or the air-saturated water method. Consult the manufacturer’s instructions to determine the recommended method for each instrument. For both methods, room temperature water should be used when preparing the calibration environment. Dissolved Oxygen Calibration and Verification Using the Air-Saturated Water Method:
• Use room temperature DI water or clean tap water (specific conductance < 500umhos/cm) to preparecalibration water that is 100% saturated with oxygen. Continuously aerate water in a large openmouth container, or fill a large (≥ 1L) bottle approximately 3/4 full with water and vigorously shakethe bottle for at least 30 seconds.

Sampling Manual Revision – Oct. 2017 09/15/2017
Page A-2 of 37 • Place the DO sensor and the calibration water in a large open mouth container. Allow adequate time
for the DO and temperature readings to stabilize. Make sure the probe is not in direct sunlight, which prevents proper stabilization.
• Measure the temperature of the calibration water, and observe the readings until the instrument stabilizes. Compare DO (mg/L) meter reading with value obtained from Table 5.
• Verify the calibration of the instrument (ICV) by keeping the sensor in the calibration water. Place the instrument in run mode, allow the DO and temperature readings to stabilize, and compare the DO (mg/L) meter reading with value obtained from Table 5. The value must meet the calibration acceptance criteria.
• Check the calibration of the DO meter with air-saturated water (see instructions above for preparing water that is 100% saturated with oxygen) at the end of the sampling day (chronological calibration bracket). If a DO meter fails the calibration verification, then recalibrate the meter before taking any more DO measurements. Remember to report all DO readings that could not be properly bracketed with an acceptable verification with a “J” qualifier and a comment such as “value not properly bracketed during calibration verification” or “DO meter failed calibration verification.”
Additional Updates for Turbidity
Follow the manufacturer's instructions for proper storage and use of standards. Instructions for using StablCal primary formazin standards are provided below:
• Store standards away from direct sunlight, at a temperature between 0°C and 25°C. Allow standards to acclimate to room temperature before performing calibration or verification activities.
• If StablCal standards in sealed vials have been sitting undisturbed for longer than 1 month, they must be shaken prior to use. Shake the vials vigorously for 2-3 min to resuspend any particles, then allow vial to stand undisturbed for 5 min. Next, gently invert the vial 5 to 7 times and allow the vial to stand undisturbed for 1 min prior to beginning the calibration or verification procedure.
• If StablCal standards in sealed vials have been used within the past month, gently invert the vial 5 to 7 times and allow the vial to stand undisturbed for 1 min prior to beginning the calibration or verification procedure.
Updates to Sampling Manual Section 4: Ground Water Sampling Protocols The Status and Trend Networks Ground Water Field Sheet has been revised (Figure 10).
Guidance for measuring depth to water, calculating water column height, and measuring and documenting flowing wells has been revised as follows:
Depth to Water Measurement
The depth to water (DTW) is the water level relative to a known measuring point. DTW is measured using a graduated steel tape and chalk, or an electronic water-level sensor. Always measure from the same reference point or survey mark on the top of the well casing. If there is no reference mark, measure from the north side of the casing. Before placing equipment in the well or purging water from the well, measure the depth to water twice to the nearest 0.01 foot and record both measurements in the "Depth to Water" section of the field sheet. Check to make sure that the second measurement is within ±0.01 ft of the first measurement. If it is not, perform additional measurements until two consecutive measurements within the stated limits are obtained. The second measurement in this pair should be reported as the initial (undisturbed) DTW, and used in the calculations described below. This initial depth to water measurement is the DTW value that should be reported in the electronic data entry forms (Trimble data

Sampling Manual Revision – Oct. 2017 09/15/2017
Page A-3 of 37 logger for Status sites and http://fldeploc.dep.state.fl.us/ambient/field/ or standardized format for Trend), not the final reading after purging.
DTW is a distance downward from the measuring point elevation (MPE), and is therefore recorded as a positive number if the water is below the MPE. DTW measurement may not be possible on wells with closed system in-place plumbing, in which case no value will be reported. If the well is a “flowing” artesian well, additional steps (described in “Measuring Depth to Water for Flowing Wells” below) are needed to calculate DTW.
Measuring Depth to Water for Flowing Wells
The water in a “flowing” well is under pressure. This means that that if the well is uncapped, the water will rise above the land surface elevation (LSE). If the well is uncapped and visually flowing, or if it is capped and has a pressure gage that indicates a pressure (water level) greater than LSE, you may assume it is a flowing well. Note: you may need to track down the individual or agency responsible for installing the pressure gage in order to determine how to read the gage.
Under most situations, the water level of a flowing well is above the Measuring Point Elevation (MPE). In these situations, the DTW is recorded as a negative number, because DTW is typically measured as a distance downward from the MPE. If the water level is exactly equal to the MPE, then the DTW is recorded as 0.00 feet. Finally, if the water level is below the MPE, a “normal” (non-flowing) situation exists and the DTW is recorded as a positive number. For both the Status and Trend Networks, every attempt must be made to obtain a DTW measurement.
There must be a spigot or valve on the casing in order to sample a flowing well. A hose and tape measure or a pressure gauge must be used for measuring DTW for flowing wells. The hose material, diameter, and length do not matter as long as the hose is long enough to reach the top of the water column when the spigot or valve is fully open. When a spigot is fully open, the upward hydraulic pressure causes the water to flow up to a height where this upward pressure equals the downward atmospheric pressure. The goal is to measure the height (above the MPE) at which this occurs.
To determine the DTW of a flowing well using a hose and tape measure:
1. Connect a hose to the spigot or valve. Open the spigot or valve until it is at maximum flow. Raise the end of the hose above the casing to a height where water just stops flowing from the hose (Figure 32).
2. Do not hold the hose too high or else the top of the water column will be located within the hose, instead of at the end. Water will flow out of the hose if the hose is not held high enough.
3. Once the correct hose height is achieved, measure the vertical distance from the top of the hose down to the MPE. This measurement (in feet) will be the DTW, represented as a negative number from the MPE.
4. Lower the hose so water flows from it and then repeat the procedure for a second measurement.
A pressure gauge can also be used to measure DTW for flowing wells. To convert a pressure reading (in units of psi) to a DTW measurement, use the conversion factor of 1 psi = 2.31 feet above gauge. For example, if the pressure gauge reads 5 psi, the water level is 11.55 feet above the gauge. Additional adjustments to the converted water level may be needed if the gauge is not located at the same height as the MPE (Figure 33).
For wells at which the DTW cannot be measured, place a checkmark next to "DTW Not Measured" on the field sheet and enter a comment describing why the measurement was not taken. When entering data electronically, leave the depth to water prompt blank; do not enter “NA” or the number zero. The only time the number zero should be entered is in the unlikely case that the water level is exactly at the measuring point, not flowing over it or receded below it. The comment describing why the measurement was not taken should also be recorded in the comments section of the electronic data entry form.

Sampling Manual Revision – Oct. 2017 09/15/2017
Page A-4 of 37 Water Column Height Calculation
Water column height (WCH) is the height (in feet) of water from the bottom of the well to the top of the water column. WCH is calculated using Equation 1.
Equation 1: WCH = Total Depth – (DTW – Stickup)
The Stickup is the distance (in feet) between the MPE and land surface elevation (LSE). For Trend Network wells and Status Network wells where the MPE and LSE are known and are reported using the same vertical datum, the Stickup can be calculated using Equation 2.
Equation 2: Stickup = MPE – LSE
For Status Network sites where LSE information is outdated or not known, the Stickup can be calculated by measuring the distance (to the nearest 0.01 feet) from the measuring point reference point (typically the north side of the casing) to the ground.
When completing the WCH calculation section of the field sheet, if the DTW measurement was a negative number, or if DTW could not be measured, record “NA” for DTW in the WCH equation. This will allow you to calculate WCH as the total depth + stickup. This is done because the goal is to purge all of the standing water. When purging the well, we do not need to account for water flowing above the well casing, and if we cannot measure the water level within the casing we assume the entire well (plus stickup) is full of standing water.
Updates to Sampling Manual Section 5: Surface Water Sampling Protocols The Status and Trend Networks Surface Water Field Sheet has been revised (Figure 11).
Documenting stage height measurements has been discontinued for all Status and Trend Network projects.
The number of decimal places to record for depth measurements in the field (total depth, sample collection depth, and secchi depth when visible on bottom) has changed. Record two decimal places if total depth < 0.6 m, and record one decimal place if total depth ≥ 0.6 m.
Photo documentations requirements have been updated. Document conditions at all surface water sites by taking photographs from the sample collection point facing north, east, south, and west (in that order). If samples are collected from a structure (e.g. bridge, dock) or from the shore of the waterbody, a photograph showing the sample collection location is also required. Photographs are required for all Status Network sites. For Trend sites, take photographs once a year or as needed based on changing conditions. For any sites that are excluded in the field, take photos to document the rationale (no photos are required for office recon exclusions).
Updates to Sampling Manual Section 6: Sediment Sampling Protocols Updates for Sample Collection
The size of the sediment sample jar will vary, according to the analytes scheduled. A 500 mL jar will be provided when only metals and nutrients are scheduled. A 1 L jar will be provided when metals, nutrients, and organic compounds, such as pesticides, are scheduled for analysis. The 500 mL jars should be filled 2/3 full with sediment sample, while the 1 L jars should be filled 1/2 full with sediment sample.
Updates to Sampling Manual Section 7: Aquatic Habitat Characterization Sample submersed aquatic mosses (e.g. Fontinalis) as aquatic vegetation if the predominant length is 15 cm or greater (approximately the length of your hand). If the moss is shorter and more mat-like, it should be included as part of the substrate to which it is attached (typically snag).
Sampling Manual Revision – Oct. 2017 09/15/2017
Page A-5 of 37 Updates to Sampling Manual Section 8: Stream Condition Index Sampling Protocols Include submersed aquatic mosses (e.g. Fontinalis) in the macrophyte sweeps if the predominant length is 15 cm or greater. If the moss is shorter and more mat-like, it should be included as part of the sweep for the substrate to which it is attached.
Updates for Sample Preservation with Diluted (recycled) Buffered Formalin
Once the jugs are ready (filled with material), samplers will pour the diluted buffered formalin in the jug to a level slightly above the sample material. The diluted buffered formalin level must be high enough in the container to ensure that all material remains submerged during transport.
Updates to Sampling Manual Section 10: Linear Vegetation Survey Include submersed aquatic moss (e.g. Fontinalis) that are structurally similar to macrophytes.
Updates to Sampling Manual Section 11: Sample Preservation If the DEP laboratory does not have sulfuric acid or nitric acid vials in stock, teams may receive 2 mL pipettes and small (60 mL) plastic bottles containing approximately 30 mL of 1:1 analytical reagent grade nitric or sulfuric acid.
• When preserving samples using pipettes, precautions must be exercised to avoid contaminating the bottle of acid and the sample being preserved. Always use a clean pipette to add acid to the sample bottle, and dispose of used pipettes in an acid waste container. Do not insert the pipette into the sample bottle or allow it to contact the bottle lip. Use separate pipettes to preserve samples from each site or blank. Use separate pipettes for each type of acid at each site.
• Nutrients samples in 500mL bottles should be preserved by adding 2 mL of 1:1 sulfuric acid. After adding the acid, discard the used pipette in an acid waste container. Cap the nutrients bottle and invert it to mix. Confirm that the pH of the sample is now less than 2 by uncapping the sample bottle and pouring a small amount of sample directly onto the narrow range pH paper over a small disposable cup.
• Metals samples in 500mL bottles should be preserved by adding 2 mL of 1:1 nitric acid. After adding the acid, discard the used pipette in an acid waste container. Cap the metals bottle and invert it to mix. Confirm that the pH of the sample is now less than 2 by uncapping the sample bottle and pouring a small amount of sample directly onto the narrow range pH paper over a small disposable cup.
Updates to Sampling Manual Section 12: Documentation Use of pencil is now allowed on waterproof paper.
Updates to the list of requirements for surface water and sediments sampling:
• Added sample access method.
• Removed stage height.
Updates to the list of requirements for custody sheets:
• Added bottle group (from lab project identification label). Typically “A” is used for water samples, “B” is used for water blanks, and “C” is used for SCI samples, sediments, or kits with special modifications.
• Added options for matrix (surface water, ground water, field blank, equipment blank, sediment, or biology).

Sampling Manual Revision – Oct. 2017 09/15/2017
Page A-6 of 37 Updates to Sampling Manual Section 14: Quality Assurance The required content for quality assurance report and the frequency at which they must be submitted has been revised as follows:
Each team is required to submit a QA report to the DEP Project Manager each time that project paperwork is submitted. Contracted sampling teams are required to submit project paperwork and the corresponding QA reports quarterly (as supporting documentation for their invoices), within 30 days after each quarter. DEP sampling teams are required to submit project paperwork and the corresponding QA report within 30 days of completing each project.
This report summarizes the QA/QC activities, problems, and corrective actions for the projects included in each report. A template for the report is provided in Figure 41.
These reports must include:
• Date of report preparation and name of person submitting the report
• For each project: o Number of samples scheduled
o Number of samples collected
o Brief narrative if number of samples collected differs from number scheduled
o Number of field blanks collected
o Number of equipment blanks collected
• List of internal and external audits conducted
• Description of cross-sampling or other collaborative efforts.
• Description of any quality assurance issues, corrective actions, or other notable circumstances that affect data collected for the projects listed in the report.
Updates to Sampling Manual Section 15: GPS / GNSS Procedures Guidance concerning Waypoints has been eliminated and replaced with the following information, which will be added to the Navigation and Data Collection section:
Navigation to Status Network stations should be accomplished using pre-populated data files that are loaded onto the unit at the team’s base of operations. Using pre-populated data files for navigation increases efficiency in the field, and eliminates the possibility of transcription errors associated with manually entering the coordinates for each navigation target. Pre-populated data files for Status Network projects can be downloaded from the WMS FTP site (http://publicfiles.dep.state.fl.us/dear/watershed%20monitoring/GPS_Import_Files/).
Updates to Sampling Manual Section 17: Appendix
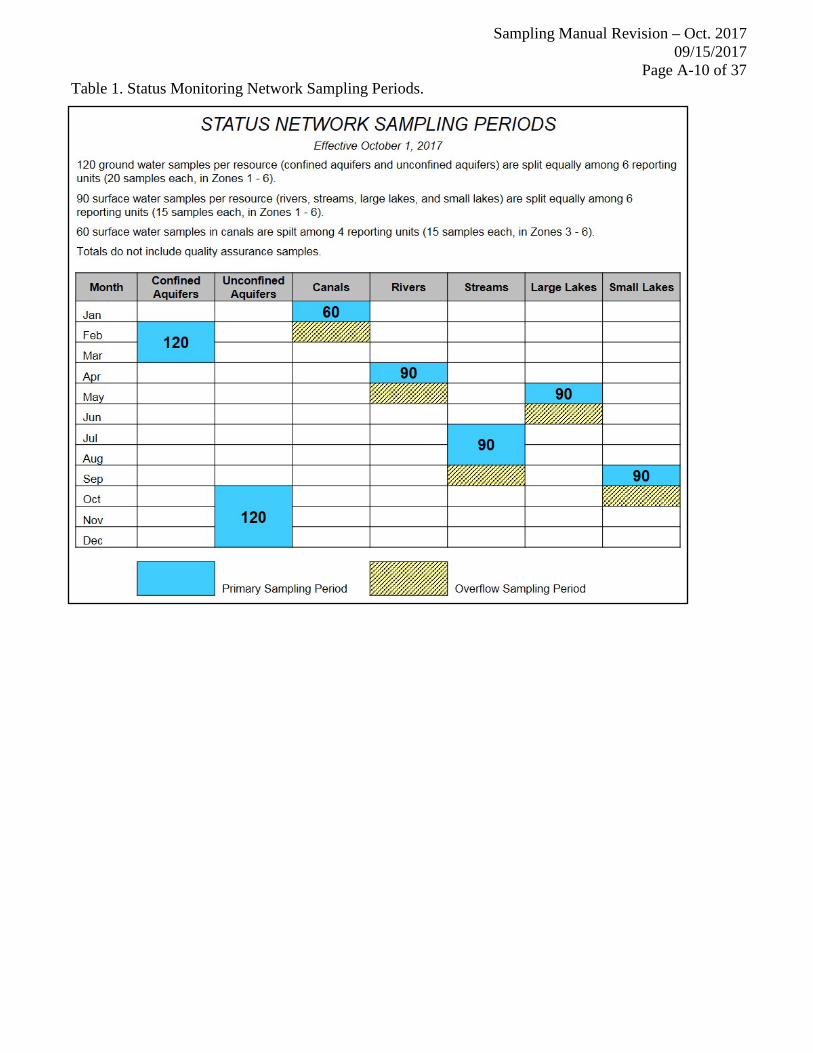
Table 1. Status Monitoring Network Sampling Periods.
• Sampling for CN will begin in January. • Sampling for CA will begin in February. • Sampling for LR will begin in April. • Sampling for LL will begin in May.
Table 2. Status Monitoring Network Indicator List.

Sampling Manual Revision – Oct. 2017 09/15/2017
Page A-7 of 37 • Beginning with UA in October 2017, organics have been removed from all Status Network
projects. • Several trace metals were added to analyte lists for water and sediments.
Table 4. Trend Monitoring Network Indicator List.
• Several trace metals were added to analyte list for water. Table 6. Field Meter Calibration Requirements.
• Revised number of decimal placed to record for all parameters. • Revised calibration / verification frequency requirements for depth.
Table 7. Data Value Qualifiers.
• Added clarification for qualifiers A, K, L, Q, and Z. Figure 3. Custody Sheet Front Page for Ground Water Trend and Status Monitoring.
• Changed version to "October 2017". • Added notes to assist lab staff with sample login in LIMS. • Added reminder that comments are required if "N" is circled for any item in the preservation
section.
Figure 4. Custody Sheet Back Page for Ground Water Trend and Status Monitoring.
• Several trace metals were added to analyte list for Status Network and October Ground Water Trend Network projects.
Figure 9. Example FLUWID Tag (Florida Unique Well Identification tag).
• Updated example to reflect current design and contact information. Figure 10. Ground Water Field Sheet
• Changed version to "October 2017". • Moved storage tank volume to top section with well information. • Added reminder about calculating stickup using MPE & LSE with same vertical datum. • Changed wording on questions about time zones / daylight savings time. • Split DTW measurement and WCH calculation into two separate sections. Added options /
guidance for documenting DTW at flowing artesian wells. Added space to check WCH calculation.
• Rephrased several existing purge volume questions and added spaces to document requirements for purge volume and purge time between stability measurements.
• Added reminder that Method 1 equation should be used for min. purge volume determination if well diameter is not listed in reference table on field sheet.
• Added note that time sampling begins must be the same as time purge stops or later. • Added clarification for when to place labels in boxes. • In QA sample section changed "equipment used" to "equipment used (type & ID)". • Added reminder to comment if weather conditions may affect water quality parameter values. • Divided sampler names & signatures lines into 3 columns.
Figure 11. Surface Water Field Sheet
• Changed version to "October 2017". • Changed wording on questions about time zones / daylight savings time. • Removed stage height.
Sampling Manual Revision – Oct. 2017 09/15/2017
Page A-8 of 37 • Added check box to indicate Secchi visible on bottom ("S" qualifier needed). • Changed wording for two options in Stream / River / Canal Flow question. • Removed "dipper" and "other" from list of water sample collection devices. Clarified that
Equipment ID must be recorded when using a Van Dorn. • Added check box under field measurement table to indicate that bottom measurements not
performed because total depth < 1.5m. • Added box with reference information regarding required depths for data collection. • Changed layout of preservation section (move SCI preservation to its own line). • In QA sample section, changed "equipment used" to "Van Dorn Equipment ID". • Added question about access method for sample collection. • Added reminder to comment if weather conditions may affect water quality parameter values. • Added clarification for when to place labels in boxes. • Removed exotic apple snail question. • Divided sampler names & signatures lines into 3 columns.
Figure 20. Permission Letter and Form.
• Updated page 1 to reflect current DEP letterhead. Figure 21. DEP Regulatory Districts and Contact Information.
• Updated contact information for Northwest, Southwest, South, and Southeast offices. Figure 22. Daily Multi-parameter Meter Calibration Log.
• Changed effective date to "October 2017". • Updated guidance on number of decimal places to record. • Added options to circle answer for "Pass / Fail" and "Lab / Field". • Added a space for comments. • Modified questions in depth sensor section. • Added effective date to bottom of form.
Figure 23. Turbidity Meter Calibration Log.
• Changed effective date to "October 2017". • Updated guidance on number of decimal places to record. • Added options to circle answer for "Pass / Fail" and "Lab / Field". • Added a space for comments. • Modified questions in depth sensor section. • Added effective date to bottom of form.
Figure 24. Quarterly Temperature Sensor Verification Log.
• Changed effective date to "October 2017". • Updated guidance on number of decimal places to record. • Switched "date of last verification" and "date / time" to keep all info about current CCV together. • Added space to specify time zone. • Added space to identify reference device. • Modified correction factor question.
Figure 25. Depth Measuring Device Verification Log.
• Changed effective date to "October 2017". • Updated guidance on number of decimal places to record. • Changed frequency for manual device verification to once every 6 months.
Sampling Manual Revision – Oct. 2017 09/15/2017
Page A-9 of 37 • Added headers to differentiate between electronic device section and manual device section. • Switched "date of last verification" and "date / time" to keep all info about current CCV together. • Added space to specify time zone. • Added space to identify reference device. • Added instructions to section for checking total length of line to clarify that the spaces are for
documenting the distance measured with the reference device and device being tested. • Reduced white space to make room for 2 electronic devices and 2 manual devices per form.
Figure 36. SCI Sample Preservation with New Buffered Formalin (Formaldehyde).
• Updated text below figure to reflect revised guidance for preserving samples with recycled diluted buffered formalin.
Figure 40. Field Audit Form.
• Changed version to "October 2017". • Added summary of audit findings table. • Documentation updates:
o Use of pencil is now allowed on using waterproof paper. o For calibrations, verifications and sample readings: temperature, pH, specific conductance,
dissolved oxygen (mg/L and % sat), and turbidity must be recorded to the resolution specified by the manufacturer.
o Sample collection access method has been added to surface water field sheet documentation requirements.
o Bottle group has been added to custody sheet documentation requirements. o Concentration, lot numbers, date of receipt, expiration date, vendor and initial date of use
must be recorded in the log book and on the containers for all reagents, detergents, solvents, and chemicals.
• Field testing updates: o Calibration verifications for DO must be within ± 0.3 mg/L DO when compared to the
table of theoretical values for solubility of oxygen in water. o Calibration verifications for turbidity must met acceptance criteria for NTU range. o Lines used for secchi & depth measurement must be checked every 6 months and remarked
as needed (only applicable to surface water projects). o Depth sensors in multi-parameter meters must be zeroed daily. All electronic depth
sensors must be verified quarterly by comparing to reference device (only applicable to surface water projects).
• General sampling procedures updates: o Personal protective equipment must be used when working with acid preservatives.
• Surface water sampling updates: o Total depth, secchi depth, and sample collection depth must be measured to nearest 0.1m
(or nearest 0.01m if total depth < 0.6m). o Secchi depth must be measured on shaded side of boat / body, with sunglasses removed. o Removed requirements for stage height measurement.
• Ground water sampling updates: o At least one well volume (plus storage tank, if applicable) must be purged before
beginning purge stabilization measurements and at least 1/4 well volume must be purged between measurements.
Figure 41. Example Quarterly Quality Assurance Report.
• Updated example to reflect new requirements and suggested template for reports.
Sampling Manual Revision – Oct. 2017 09/15/2017
Page A-10 of 37 Table 1. Status Monitoring Network Sampling Periods.

Sampling Manual Revision – Oct. 2017 09/15/2017
Page A-11 of 37 Table 2. Status Monitoring Network Indicator List.
This table reflects the indicator list effective October 1, 2017. For the most recent version, please refer to http://publicfiles.dep.state.fl.us/DEAR/DEARweb/WMS/Reports_Docs_SOPs/Indicator_Lists/WMS-status-indicators.pdf. Note: Sampling for 2017 Status Network Small Lakes projects began in September 2017, and follows the previous version of the indicator list available at http://publicfiles.dep.state.fl.us/DEAR/DEARweb/WMS/Reports_Docs_SOPs/Indicator_Lists/WMS-status-indicators-Apr2017.pdf. T = Total sample (unfiltered sample); X = Other sample or measurement; Dash (-) indicates not applicable SM= Standard Methods for the Examination of Water and Wastewater.
Indicator Analysis Method
Large and
Small Lakes
Streams, Rivers
and Canals
Confined and
Unconfined Aquifers
pH DEP-SOP-001/01 FT 1100 X X X Temperature DEP-SOP-001/01 FT 1400 X X X Specific Conductance DEP-SOP-001/01 FT 1200 X X X Dissolved Oxygen DEP-SOP-001/01 FT 1500 X X X Turbidity DEP-SOP-001/01 FT 1600 - - X Secchi Depth DEP-SOP-001/01 FT 1700 X X - Total Depth Manual/electronic measuring device X X X Sample Depth Manual/electronic measuring device X X - Micro Land Use WMS Sampling Manual (01/2016), Sec. 4 - - X Depth to Water DEP-SOP-001/01 FS 2211 - - X Chlorophyll a (suite) SM 10200 H (modified) T T - Habitat Assessment DEP-SOP-001/01 FT 3000 - X - Lake Vegetation Index DEP-SOP-003/11 LVI 1000 X - - Total Coliform SM 9222 B - - T Fecal Coliform SM 9222 D - - T Enterococci Enterolet (IDEXX) T T - Escherichia coli SM 9223 QuantiTray T T - Total Organic Carbon SM 5310 B-00 T T T Nitrate + Nitrite EPA 353.2 Rev 2.0 T T T Ammonia EPA 350.1 Rev. 2.0 T T T Total Kjeldahl Nitrogen EPA 351.2 Rev 2.0 T T T Total Phosphorus EPA 365.1 Rev 2.0 T T T Chloride, Sulfate EPA 300.0 Rev 2.1 T T T Fluoride SM 4500 F-C-97 T T T Aluminum, Antimony, Arsenic, Barium, Beryllium, Cadmium, Calcium, Chromium, Copper, Iron, Lead, Magnesium, Manganese, Molybdenum, Nickel, Potassium, Selenium, Silver, Sodium, Thallium, Zinc
EPA 200.7 Rev. 4.4 / 200.8 Rev. 5.4 T T T
Alkalinity SM 2320 B-97 T T T Hardness SM 2340 B T T T Turbidity (Lab) EPA 180.1 Rev. 2.0 T T T Specific Conductance (Lab) EPA 120.1 T T T Color (True) SM 2120 B T T T Total Suspended Solids SM 2540 D-97 T T - Total Dissolved Solids SM 2540 C-97 T T T

Sampling Manual Revision – Oct. 2017 09/15/2017
Page A-12 of 37 Table 2. Continued
Indicator Analysis Method
Large and
Small Lakes
Streams, Rivers
and Canals
Confined and
Unconfined Aquifers
Sediments: Total Organic Carbon
DEP SOP: NU-076-1 (In-house based on EPA 415.1) T - -
Sediments: Total Phosphorus In-house based on EPA 365.4 T - -
Sediments: Total Kjeldahl Nitrogen In-house based on EPA 351.2 T - -
Sediments: Aluminum, Antimony, Arsenic, Beryllium, Cadmium, Chromium, Copper, Iron, Lead, Manganese, Molybdenum, Nickel, Silver, Selenium, Zinc
EPA 6010C/6020A T - -
Sediments: Mercury EPA 7473 T - -

Sampling Manual Revision – Oct. 2017 09/15/2017
Page A-13 of 37 Table 4. Trend Monitoring Network Indicator List.
This table reflects the indicator list effective October 1, 2017. For the most recent version, please refer to http://publicfiles.dep.state.fl.us/dear/watershed%20monitoring/documents/WMS-trend-indicators.pdf. T = Total sample (unfiltered sample); D = Dissolved sample (filtered sample); X = Other sample or measurement; Dash (-) indicates not applicable * Collected once a year per site; ** Collected twice per year at applicable sites; ***Collected quarterly per site. SM= Standard Methods for the Examination of Water and Wastewater
Indicator Analysis Method Surface Water Ground Water pH DEP-SOP-001/01 FT 1100 X X Temperature DEP-SOP-001/01 FT 1400 X X Specific Conductance DEP-SOP-001/01 FT 1200 X X Dissolved Oxygen DEP-SOP-001/01 FT 1500 X X Turbidity DEP-SOP-001/01 FT 1600 - X Secchi Depth DEP-SOP-001/01 FT 1700 X - Total Depth Manual/electronic measuring device X X Sample Depth Manual/electronic measuring device X - Micro Land Use WMS Sampling Manual (01/2016), Sec. 4 - X* Depth to Water DEP-SOP-001/01 FS 2211 - X Chlorophyll a (suite) SM 10200 H (modified) T - Biological Community (SCI) DEP-SOP-003/11 SCI 1000 X** - Habitat Assessment DEP-SOP-001/01 FT 3000 X** - Rapid Periphyton Survey (RPS) DEP-SOP-001/01 FS 7230 X** - Linear Vegetation Survey (LVS) DEP-SOP-001/01 FS 7320 X** - Total Coliform SM 9222 B - T*** Fecal Coliform SM 9222 D - T*** Enterococci Enterolet/QT (ASTM D6503) T - Escherichia coli SM 9223 QuantiTray T - Total Organic Carbon SM 5310 B-00 T T*** Nitrate + Nitrite EPA 353.2 Rev. 2.0 T T***, D* Ammonia EPA 350.1 Rev. 2.0 T T***, D* Total Kjeldahl Nitrogen EPA 351.2 Rev 2.0 T T***, D* Total Phosphorus EPA 365.1 Rev 2.0 T T***, D* Orthophosphate EPA 365.1 Rev. 2.0 - D*** Chloride, Sulfate EPA 300.0 Rev 2.1 T T***, D* Fluoride SM 4500 F-C-97 T T***, D* Calcium, Magnesium, Potassium, Sodium EPA 200.7 Rev. 4.4 T T***, D*
Aluminum, Antimony, Arsenic, Barium, Beryllium, Cadmium, Chromium, Copper, Iron, Lead, Manganese, Molybdenum, Nickel, Selenium, Silver, Thallium, Zinc
EPA 200.7 Rev. 4.4 / 200.8 Rev. 5.4 T* T*
Alkalinity SM 2320 B-97 T T*** Hardness SM 2340 B T T*** Turbidity (Lab) EPA 180.1 Rev. 2.0 T T*** Specific Conductance (Lab) EPA 120.1 T T*** Color (True) SM 2120 B T T*** Total Suspended Solids SM 2540 D-97 T - Total Dissolved Solids SM 2540 C-97 T T***

Sampling Manual Revision – Oct. 2017 09/15/2017
Page A-14 of 37 Table 6. Field Meter Calibration Requirements. IC = initial calibration; ICV = initial calibration verification; CCV = continuing calibration verification; N/A = not applicable. For all parameters except depth, report instrument reading to the resolution specified by the manufacturer (report all digits displayed). For depth, follow the rounding rule: if the next decimal place is 0, 1, 2, 3, or 4 the value is rounded down (e.g. 5.14 becomes 5.1), if the next decimal place is 5, 6, 7, 8, or 9 the value is rounded up (e.g. 5.15 becomes 5.2).
Parameter Number of Decimal Places to Record
Calibration / Verification Frequency Acceptance Criteria
pH (FT 1100) All Digits Displayed Daily: IC, ICV, CCV. ± 0.2 SU
Specific Conductance (FT 1200)
All Digits Displayed Daily: IC, ICV, CCV. ± 5%
Dissolved Oxygen (mg/L) (FT 1500)
All Digits Displayed Daily: IC, ICV, CCV. ± 0.3 mg/L
Dissolved Oxygen (% saturation) All Digits Displayed N/A N/A
Temperature (FT 1400) All Digits Displayed Quarterly: CCV. ± 0.5 ºC
Turbidity (FT 1600) All Digits Displayed
Daily: CCV. Quarterly: IC, ICV, secondary standard verification.
0.1 – 10 NTU: ± 10%; 11 – 40 NTU: ± 8%; 41 – 100 NTU: ± 6.5%; > 100 NTU: ± 5%
Depth
Calibrations & Verifications: 2 for electronic devices; 1 for manual devices. Field Measurements: 2 if total depth < 0.6 m; 1 if total depth ≥ 0.6 m
Daily: IC, ICV for Sondes. Quarterly: Verify Sondes & Electronic Devices. Every 6 months: Inspect Manual Devices.
ICV: ± 5% or ± 0.05 m, whichever is greater. Electronic Device Verification: ± 10%. Line Increments: ± 10%. Total Length of Lines: ± 5%.
Sampling Manual Revision – Oct. 2017 09/15/2017
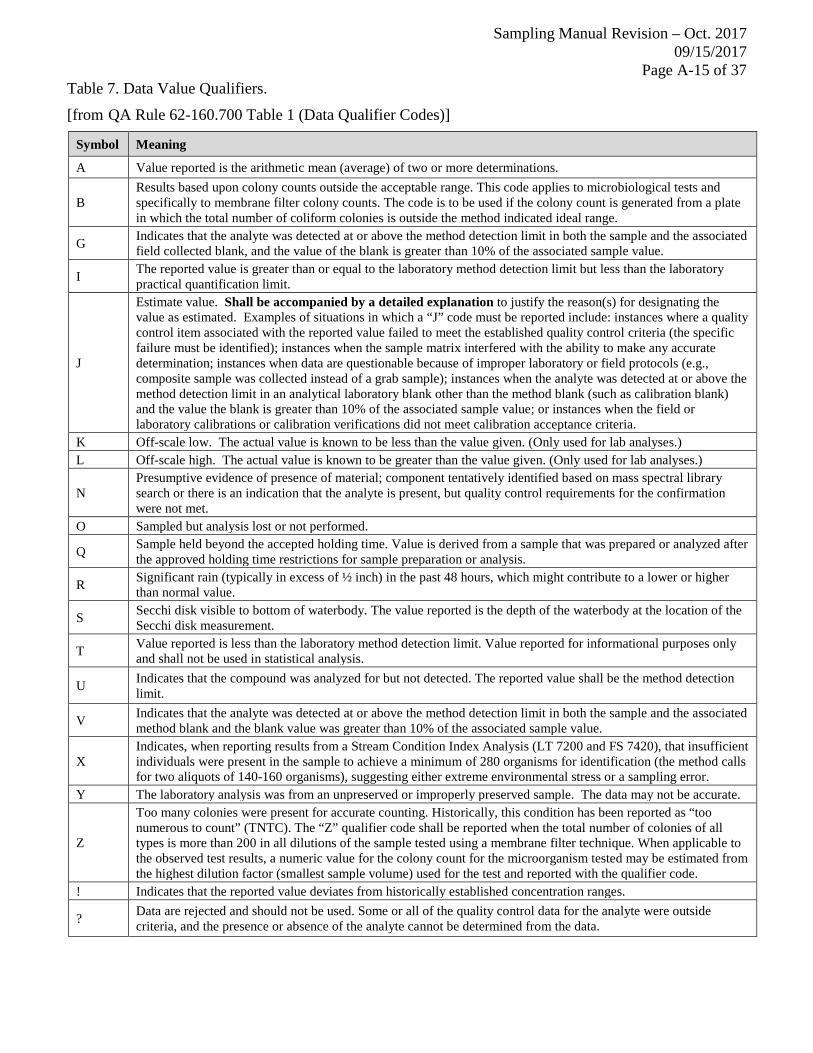
Page A-15 of 37 Table 7. Data Value Qualifiers.
[from QA Rule 62-160.700 Table 1 (Data Qualifier Codes)]
Symbol Meaning
A Value reported is the arithmetic mean (average) of two or more determinations.
B Results based upon colony counts outside the acceptable range. This code applies to microbiological tests and specifically to membrane filter colony counts. The code is to be used if the colony count is generated from a plate in which the total number of coliform colonies is outside the method indicated ideal range.
G Indicates that the analyte was detected at or above the method detection limit in both the sample and the associated field collected blank, and the value of the blank is greater than 10% of the associated sample value.
I The reported value is greater than or equal to the laboratory method detection limit but less than the laboratory practical quantification limit.
J
Estimate value. Shall be accompanied by a detailed explanation to justify the reason(s) for designating the value as estimated. Examples of situations in which a “J” code must be reported include: instances where a quality control item associated with the reported value failed to meet the established quality control criteria (the specific failure must be identified); instances when the sample matrix interfered with the ability to make any accurate determination; instances when data are questionable because of improper laboratory or field protocols (e.g., composite sample was collected instead of a grab sample); instances when the analyte was detected at or above the method detection limit in an analytical laboratory blank other than the method blank (such as calibration blank) and the value the blank is greater than 10% of the associated sample value; or instances when the field or laboratory calibrations or calibration verifications did not meet calibration acceptance criteria.
K Off-scale low. The actual value is known to be less than the value given. (Only used for lab analyses.) L Off-scale high. The actual value is known to be greater than the value given. (Only used for lab analyses.)
N Presumptive evidence of presence of material; component tentatively identified based on mass spectral library search or there is an indication that the analyte is present, but quality control requirements for the confirmation were not met.
O Sampled but analysis lost or not performed.
Q Sample held beyond the accepted holding time. Value is derived from a sample that was prepared or analyzed after the approved holding time restrictions for sample preparation or analysis.
R Significant rain (typically in excess of ½ inch) in the past 48 hours, which might contribute to a lower or higher than normal value.
S Secchi disk visible to bottom of waterbody. The value reported is the depth of the waterbody at the location of the Secchi disk measurement.
T Value reported is less than the laboratory method detection limit. Value reported for informational purposes only and shall not be used in statistical analysis.
U Indicates that the compound was analyzed for but not detected. The reported value shall be the method detection limit.
V Indicates that the analyte was detected at or above the method detection limit in both the sample and the associated method blank and the blank value was greater than 10% of the associated sample value.
X Indicates, when reporting results from a Stream Condition Index Analysis (LT 7200 and FS 7420), that insufficient individuals were present in the sample to achieve a minimum of 280 organisms for identification (the method calls for two aliquots of 140-160 organisms), suggesting either extreme environmental stress or a sampling error.
Y The laboratory analysis was from an unpreserved or improperly preserved sample. The data may not be accurate.
Z
Too many colonies were present for accurate counting. Historically, this condition has been reported as “too numerous to count” (TNTC). The “Z” qualifier code shall be reported when the total number of colonies of all types is more than 200 in all dilutions of the sample tested using a membrane filter technique. When applicable to the observed test results, a numeric value for the colony count for the microorganism tested may be estimated from the highest dilution factor (smallest sample volume) used for the test and reported with the qualifier code.
! Indicates that the reported value deviates from historically established concentration ranges.
? Data are rejected and should not be used. Some or all of the quality control data for the analyte were outside criteria, and the presence or absence of the analyte cannot be determined from the data.

Sampling Manual Revision – Oct. 2017 09/15/2017
Page A-16 of 37 Figure 3. Custody Sheet Front Page for Ground Water Trend and Status Monitoring.
This figure is provided as an example only. Please visit the Watershed Monitoring Information Center (https://fldeploc.dep.state.fl.us/status/) to view the most recent version.

Sampling Manual Revision – Oct. 2017 09/15/2017
Page A-17 of 37 Figure 4. Custody Sheet Back Page for Ground Water Trend and Status Monitoring.
This figure is provided as an example only. Please visit the Watershed Monitoring Information Center (https://fldeploc.dep.state.fl.us/status/) to view the most recent version.

Sampling Manual Revision – Oct. 2017 09/15/2017
Page A-18 of 37 Figure 9. Example FLUWID Tag (Florida Unique Well Identification tag).

Sampling Manual Revision – Oct. 2017 09/15/2017
Page A-19 of 37 Figure 10. Ground Water Field Sheet.
This figure is provided as an example only. Please visit the Watershed Monitoring Information Center (https://fldeploc.dep.state.fl.us/status/) to download the most recent version.

Sampling Manual Revision – Oct. 2017 09/15/2017
Page A-20 of 37 Figure 10. Continued.

Sampling Manual Revision – Oct. 2017 09/15/2017
Page A-21 of 37 Figure 11. Surface Water Field Sheet.
This figure is provided as an example only. Please visit the Watershed Monitoring Information Center (https://fldeploc.dep.state.fl.us/status/) to download the most recent version.

Sampling Manual Revision – Oct. 2017 09/15/2017
Page A-22 of 37 Figure 11. Continued.

Sampling Manual Revision – Oct. 2017 09/15/2017
Page A-23 of 37 Figure 20. Permission Letter and Form.
(Page 1 of 4.) This figure is provided as an example only. Please visit the Watershed Monitoring Information Center (https://fldeploc.dep.state.fl.us/status/) to download the most recent version.

Sampling Manual Revision – Oct. 2017 09/15/2017
Page A-24 of 37 Figure 21. DEP Regulatory Districts and Contact Information.
District Location Phone Number
Northwest - Main Office 160 W. Government Street, Suite 308, Pensacola, FL 32502 (850) 595-8300
Northwest - Branch Office 2600 Blair Stone Rd, Tallahassee, FL 32399 (850) 245-2984
Northwest -Branch Office 470 Harrison Avenue, Panama City, FL 32401 (850) 872-4375
Northeast - Main Office 8800 Baymeadows Way West, Suite 100, Jacksonville, FL 32256 (904) 256-1700
Central - Main Office 3319 Maguire Boulevard, Suite 232, Orlando, FL 32803 (407) 897-4100
Southwest - Main Office 13051 N Telecom Parkway, Suite 101, Temple Terrace, FL 33637 (813) 470-5700
South - Main Office 2295 Victoria Avenue, Suite 364, Fort Myers, FL 33901 (239) 344-5600
South - Branch Office 2796 Overseas Highway, Suite 221, Marathon, FL 33050 (305) 289-7070
Southeast - Main Office 3301 Gun Club Rd, MSC7210-1, West Palm Beach, FL 33406 (561) 681-6600

Sampling Manual Revision – Oct. 2017 09/15/2017
Page A-25 of 37 Figure 22. Daily Multi-parameter Meter Calibration Log.
This figure is provided as an example only. Please visit the Watershed Monitoring Information Center (https://fldeploc.dep.state.fl.us/status/) to download the most recent version.

Sampling Manual Revision – Oct. 2017 09/15/2017
Page A-26 of 37 Figure 23. Turbidity Meter Calibration Log.
This figure is provided as an example only. Please visit the Watershed Monitoring Information Center (https://fldeploc.dep.state.fl.us/status/) to download the most recent version.

Sampling Manual Revision – Oct. 2017 09/15/2017
Page A-27 of 37 Figure 24. Quarterly Temperature Sensor Verification Log.
This figure is provided as an example only. Please visit the Watershed Monitoring Information Center (https://fldeploc.dep.state.fl.us/status/) to download the most recent version.

Sampling Manual Revision – Oct. 2017 09/15/2017
Page A-28 of 37 Figure 25. Depth Measuring Device Verification Log.
This figure is provided as an example only. Please visit the Watershed Monitoring Information Center (https://fldeploc.dep.state.fl.us/status/) to download the most recent version.

Sampling Manual Revision – Oct. 2017 09/15/2017
Page A-29 of 37 Figure 36. SCI Sample Preservation with New Buffered Formalin (Formaldehyde).
An alternate preservation method is required for using diluted buffered formalin (formaldehyde) that is supplied by the DEP laboratory. Samplers will not use any ambient water with this diluted formalin because it has been recycled and is already diluted. Once the jugs are ready (filled with material), samplers will pour the diluted buffered diluted formalin in the jug to a level slightly above the sample material. The diluted buffered formalin level must be high enough in the container to ensure that all material remains submerged during transport. Samplers will not follow the “nine parts ambient water and one part buffered formalin” rule. This formalin is already diluted and is ready to use as a straight solution.

Sampling Manual Revision – Oct. 2017 09/15/2017
Page A-30 of 37 Figure 40. Field Audit Form.
(Page 1 of 7.) This figure is provided as an example only. Please visit the Watershed Monitoring Information Center (https://fldeploc.dep.state.fl.us/status/) to download the most recent version.

Sampling Manual Revision – Oct. 2017 09/15/2017
Page A-31 of 37 Figure 40. Continued (page 2 of 7).

Sampling Manual Revision – Oct. 2017 09/15/2017
Page A-32 of 37 Figure 40. Continued (page 3 of 7).

Sampling Manual Revision – Oct. 2017 09/15/2017
Page A-33 of 37 Figure 40. Continued (page 4 of 7).

Sampling Manual Revision – Oct. 2017 09/15/2017
Page A-34 of 37 Figure 40. Continued (page 5 of 7).

Sampling Manual Revision – Oct. 2017 09/15/2017
Page A-35 of 37 Figure 40. Continued (page 6 of 7).

Sampling Manual Revision – Oct. 2017 09/15/2017
Page A-36 of 37 Figure 40. Continued (page 7 of 7).

Sampling Manual Revision – Oct. 2017 09/15/2017
Page A-37 of 37 Figure 41. Example Quarterly Quality Assurance Report.
This figure is provided as an example only. Please visit the Watershed Monitoring Information Center (https://fldeploc.dep.state.fl.us/status/) to download the most recent version.