statistics day matter - united nations · statistics day 2010 june 29th, 2010 homage to professor...
TRANSCRIPT
Homage toProf. P. C. Mahalanobis
(1893-1972)
Statistics Day 20
10
Statistics Day 20
10
th 29 June 2010
Ministry of Statistics and Programme Implementation
Government of India
National Statistical Organisation (NSO)
Statistics Day 2010June 29th, 2010
Homage to
Professor Prasanta Chandra Mahalanobis(1893-1972)
Government of IndiaMinistry of Statistics and Programme Implementation
National Statistical Organisation (NSO)website: www.mospi.gov.in
“If the problem is one of theoretical nature, statistics supplies a valid method for drawing general conclusions from particular experience. If the problem is a practical one, statistics supplies the basis for choosing a particular course of action (in preference to other possible courses) by balancing the risks of gain and loss”


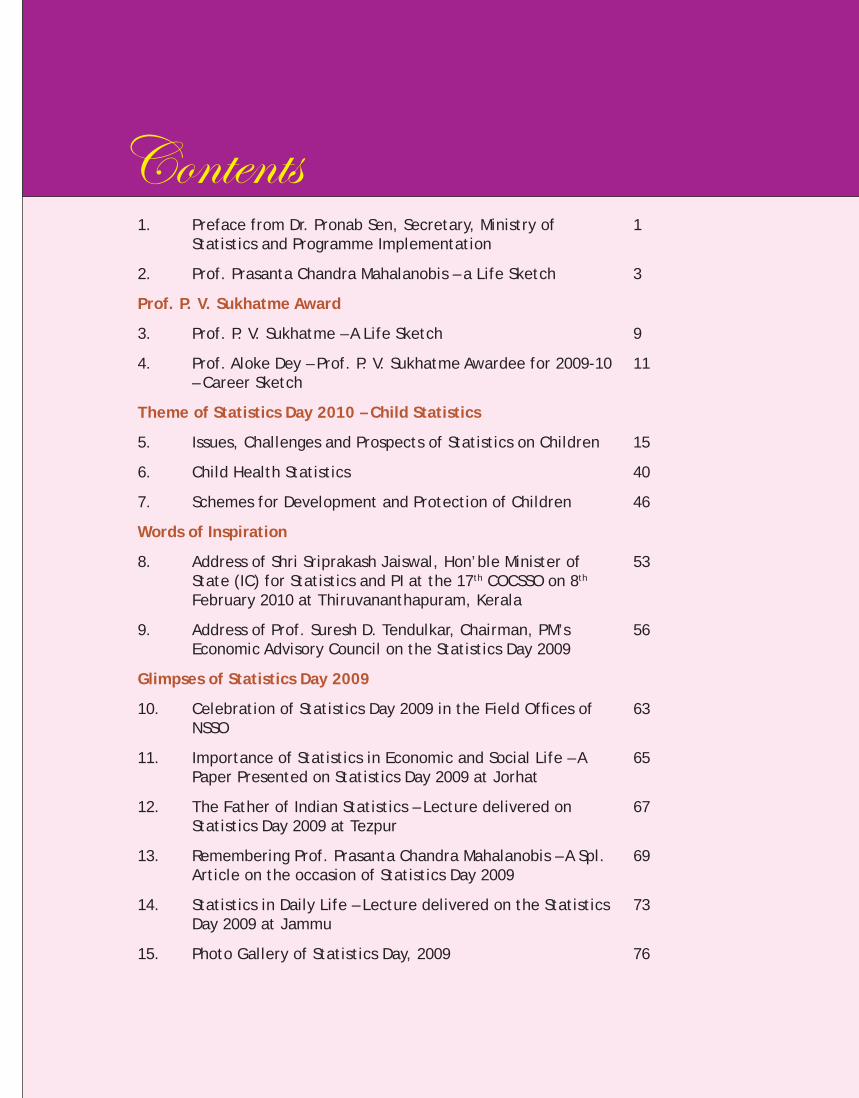
1. Preface from Dr. Pronab Sen, Secretary, Ministry of Statistics and Programme Implementation
1
2. Prof. Prasanta Chandra Mahalanobis – a Life Sketch 3
Prof. P. V. Sukhatme Award
3. Prof. P. V. Sukhatme – A Life Sketch 9
4. Prof. Aloke Dey – Prof. P. V. Sukhatme Awardee for 2009-10 – Career Sketch
11
Theme of Statistics Day 2010 – Child Statistics
5. Issues, Challenges and Prospects of Statistics on Children 15
6. Child Health Statistics 40
7. Schemes for Development and Protection of Children 46
Words of Inspiration
8. Address of Shri Sriprakash Jaiswal, Hon’ble Minister of State (IC) for Statistics and PI at the 17th COCSSO on 8th
February 2010 at Thiruvananthapuram, Kerala
53
9. Address of Prof. Suresh D. Tendulkar, Chairman, PM’s Economic Advisory Council on the Statistics Day 2009
56
Glimpses of Statistics Day 2009
10. Celebration of Statistics Day 2009 in the Field Offices of NSSO
63
11. Importance of Statistics in Economic and Social Life – A Paper Presented on Statistics Day 2009 at Jorhat
65
12. The Father of Indian Statistics – Lecture delivered on Statistics Day 2009 at Tezpur
67
13. Remembering Prof. Prasanta Chandra Mahalanobis – A Spl. Article on the occasion of Statistics Day 2009
69
14. Statistics in Daily Life – Lecture delivered on the Statistics Day 2009 at Jammu
73
15. Photo Gallery of Statistics Day, 2009 76
Contents

1
2

Prasanta Chandra Mahalanobis (June 1893 – June 1972) was born in a well known family of Brahmos ( a protestant theist movement within the fold of Hinduism) in Calcutta.
2. Mahalanobis belonged to a family of Bengali landed gentry who lived in Bikrampur (now in Bangladesh). His grandfather Gurucharan (1833-1916) moved to Calcutta in 1854 and built up a business, starting a chemist shop in 1860. Gurucharan was influenced by Debendranath Tagore (1817-1905), father of the Nobel poet, Rabindranath Tagore.Gurucharan was actively involved in social movements such as the Brahmo Samaj,acting as its Treasurer and President. His elder son Subodhchandra (1867-1954) was the father of P. C. Mahalanobis. He was a distinguished educationist who studied physiology at Edinburgh University and later became a Professor at the Presidency College and Head of the Department of
Prof. Prasanta Chandra Mahalanobis - Life Sketch
Born : 29th June 1893Died : 28th June 1972
Physiology. Subodhchandra also became a member of the Senate of the Calcutta University. Born in the house at 210 Cornwallis Street, P. C. Mahalanobis, grew up in a socially active family surrounded by intellectuals and reformers.
3. Mahalanobis received his early schooling at the Brahmo Boys’ Schoolin Calcutta graduating in 1908. He then joined the Presidency College, Calcutta and received a B.Sc. degree with honours in physics in 1912. He left for England in 1913 to join Cambridge. He however missed a train and stayed with a friend at King’s College, Cambridge. He was impressed by the Chapel there and his host’s friend M. A. Candeth suggested that he could try joining there, which he did. He did well in his studies, but also took an interest in cross-country walking and punting on the river. He interacted with the mathematical genius Srinivasa Ramanujan during the latter’s time at
3
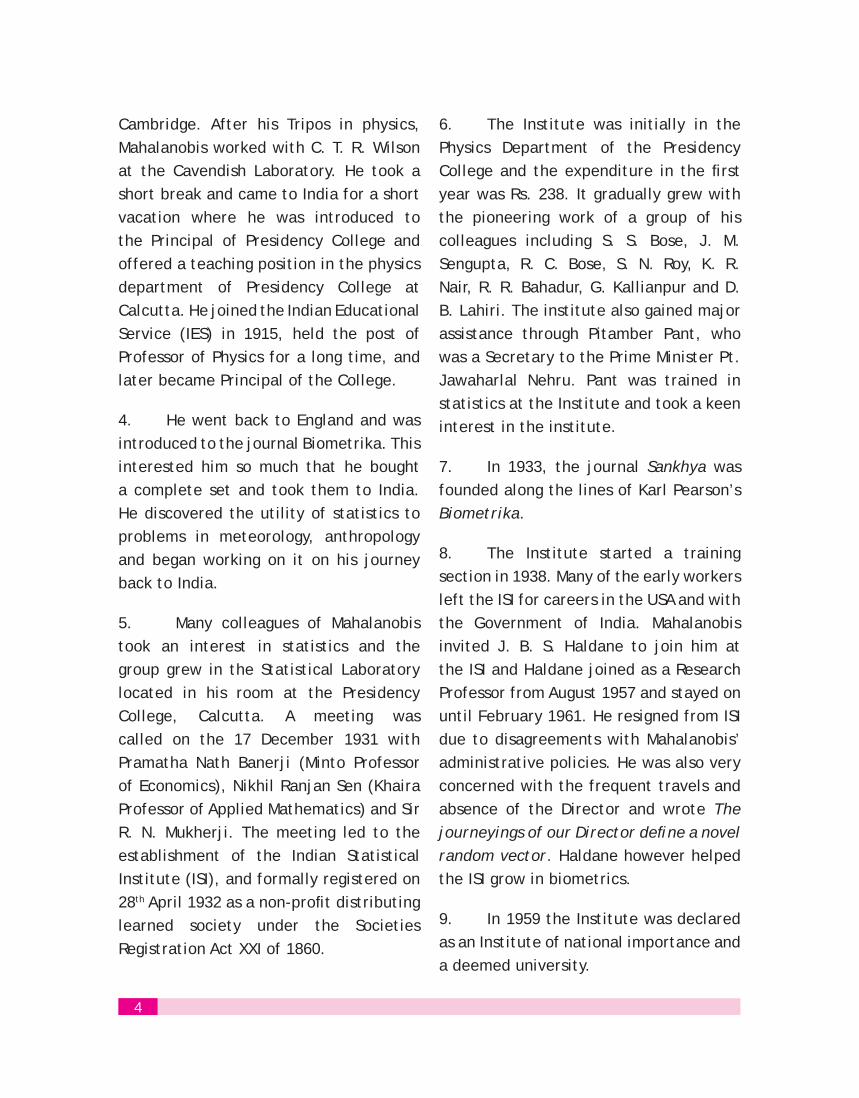
Cambridge. After his Tripos in physics, Mahalanobis worked with C. T. R. Wilson at the Cavendish Laboratory. He took a short break and came to India for a short vacation where he was introduced to the Principal of Presidency College and offered a teaching position in the physics department of Presidency College at Calcutta. He joined the Indian Educational Service (IES) in 1915, held the post of Professor of Physics for a long time, and later became Principal of the College.
4. He went back to England and was introduced to the journal Biometrika. This interested him so much that he bought a complete set and took them to India. He discovered the utility of statistics to problems in meteorology, anthropologyand began working on it on his journey back to India.
5. Many colleagues of Mahalanobis took an interest in statistics and the group grew in the Statistical Laboratory located in his room at the Presidency College, Calcutta. A meeting was called on the 17 December 1931 with Pramatha Nath Banerji (Minto Professor of Economics), Nikhil Ranjan Sen (Khaira Professor of Applied Mathematics) and Sir R. N. Mukherji. The meeting led to the establishment of the Indian Statistical Institute (ISI), and formally registered on 28th April 1932 as a non-profit distributing learned society under the Societies Registration Act XXI of 1860.
6. The Institute was initially in the Physics Department of the Presidency College and the expenditure in the first year was Rs. 238. It gradually grew with the pioneering work of a group of his colleagues including S. S. Bose, J. M. Sengupta, R. C. Bose, S. N. Roy, K. R. Nair, R. R. Bahadur, G. Kallianpur and D. B. Lahiri. The institute also gained major assistance through Pitamber Pant, who was a Secretary to the Prime Minister Pt. Jawaharlal Nehru. Pant was trained in statistics at the Institute and took a keen interest in the institute.
7. In 1933, the journal Sankhya was founded along the lines of Karl Pearson’s Biometrika.
8. The Institute started a training section in 1938. Many of the early workers left the ISI for careers in the USA and with the Government of India. Mahalanobis invited J. B. S. Haldane to join him at the ISI and Haldane joined as a Research Professor from August 1957 and stayed on until February 1961. He resigned from ISI due to disagreements with Mahalanobis’ administrative policies. He was also very concerned with the frequent travels and absence of the Director and wrote The journeyings of our Director define a novel random vector. Haldane however helped the ISI grow in biometrics.
9. In 1959 the Institute was declared as an Institute of national importance and a deemed university.
4
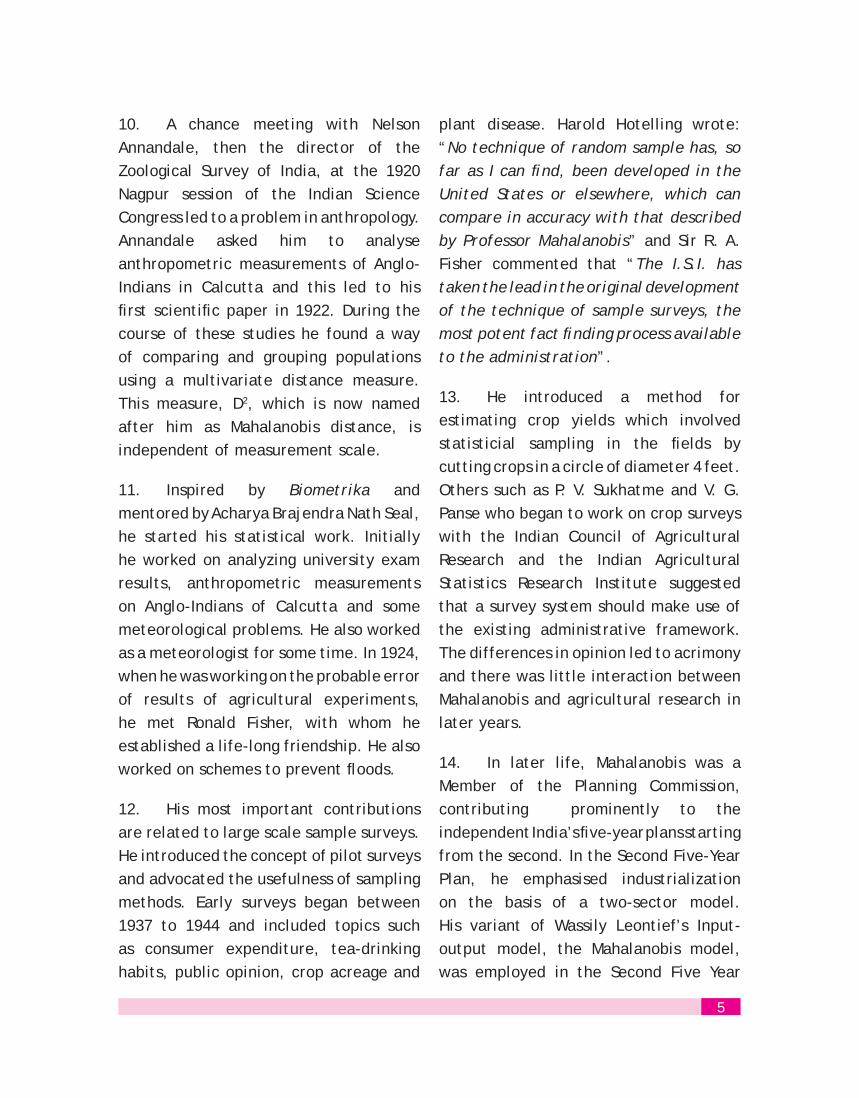
10. A chance meeting with Nelson Annandale, then the director of the Zoological Survey of India, at the 1920 Nagpur session of the Indian Science Congress led to a problem in anthropology. Annandale asked him to analyse anthropometric measurements of Anglo-Indians in Calcutta and this led to his first scientific paper in 1922. During the course of these studies he found a way of comparing and grouping populations using a multivariate distance measure. This measure, D2, which is now named after him as Mahalanobis distance, is independent of measurement scale.
11. Inspired by Biometrika and mentored by Acharya Brajendra Nath Seal,he started his statistical work. Initially he worked on analyzing university exam results, anthropometric measurements on Anglo-Indians of Calcutta and some meteorological problems. He also worked as a meteorologist for some time. In 1924, when he was working on the probable error of results of agricultural experiments, he met Ronald Fisher, with whom he established a life-long friendship. He also worked on schemes to prevent floods.
12. His most important contributions are related to large scale sample surveys. He introduced the concept of pilot surveys and advocated the usefulness of samplingmethods. Early surveys began between 1937 to 1944 and included topics such as consumer expenditure, tea-drinking habits, public opinion, crop acreage and
plant disease. Harold Hotelling wrote: “No technique of random sample has, so far as I can find, been developed in the United States or elsewhere, which can compare in accuracy with that described by Professor Mahalanobis” and Sir R. A. Fisher commented that “The I.S.I. has taken the lead in the original development of the technique of sample surveys, the most potent fact finding process available to the administration”.
13. He introduced a method for estimating crop yields which involved statisticial sampling in the fields by cutting crops in a circle of diameter 4 feet. Others such as P. V. Sukhatme and V. G. Panse who began to work on crop surveys with the Indian Council of Agricultural Research and the Indian Agricultural Statistics Research Institute suggested that a survey system should make use of the existing administrative framework. The differences in opinion led to acrimony and there was little interaction between Mahalanobis and agricultural research in later years.
14. In later life, Mahalanobis was a Member of the Planning Commission, contributing prominently to the independent India’s five-year plans starting from the second. In the Second Five-Year Plan, he emphasised industrialization on the basis of a two-sector model. His variant of Wassily Leontief’s Input-output model, the Mahalanobis model,was employed in the Second Five Year
5
Plan, which worked towards the rapid industrialization of India and with other colleagues at his institute, he played a key role in the development of a statistical infrastructure. He encouraged a project to assess de-industrialization in India and correct some previous census methodology errors and entrusted this project to Daniel Thorner.
15. Mahalanobis also had an abiding interest in cultural pursuits and served as secretary to Rabindranath Tagore,particularly during the latter’s foreign travels, and also worked at his Visva-Bharati University, for some time. He received one of the highest civilian awards, the Padma Vibhushan from the Government of India for his contribution to science and services to the country.
16. Mahalanobis died on 28th June 1972, a day before his seventy-ninth birthday. Even at this age, he was still active doing research work and discharging his duties as the Secretary and Director of the Indian Statistical Institute and as the Honorary Statistical Advisor to the Government of India
17. During his life time, he received many honours, a few of which were:
Weldon Meda• l from Oxford University (1944)
Fellow of the • Royal Society, London (1945)
President of • Indian Science Congress (1950)
Fellow of the • Econometric Society,U.S.A. (1951)
Fellow of the Pakistan Statistical •
Association (1952)
Honorary Fellow of the • Royal Statistical Society, U.K. (1954)
Sir Deviprasad Sarvadhikari Gold •
Medal (1957)
Foreign member of the • Soviet Academy of Sciences (1958)
Honorary Fellow of • King’s College, Cambridge (1959)
Fellow of the • American Statistical Association (1961)
Durgaprasad Khaitan Gold Medal •
(1961)
Padma Vibhusha• n (1968)
Srinivasa Ramanujam Gold Medal •
(1968)
18. The Government of India decided in 2006 to celebrate his birthday, 29th
June, as Statistics Day in recognition of the notable contributions made by the Professor in the fields of economic planning and statistical development.
6


Professor P. V. Sukhatme – A Life Sketch
Born : 27th July 1911Died : 28th January 1997
Pandurang Vasudeo Sukhatme was born of Vasudeo Hari Sukhatme and Satyabhama Sukhatme on 27th July 1911 in the village Budh, district Satara, 100 miles south of Pune. After completing his school education in Pune, he graduated in 1932 from Ferguson College of the same city with Mathematics as the principal subject and Physics as the subsidiary. During 1933-36, he studied at the University College, London and was awarded a Ph.D. in 1936 and a D.Sc. Degree in 1939 for his work on bipartitional functions. This work was published in the “Philosophical Transactions of the Royal Society of London, Series A”, June, 1938.
Whilst in London, Prof. Sukhatme came under the influence of such eminent authorities in Statistics as R.A.Fisher, Jerzy Neyman and E.S.Person and did valuable research in Statistical Theory of Sampling, his two most significant contribution being, one to bipartitional functions under the guidance of R.A.Fisher and the other to sampling theory entitled “Contributions to the Theory of the Representative
Method” under the guidance of J.Neyman and E.S.Pearson. The latter paper laid solid foundations for his subsequent pioneering research in the sampling theory of surveys and improvement of agricultural statistics which ushered in what may be appropriately termed as the Sukhatme era in the development of agricultural statistics in India and he world.
When P.V.Sukhatme returned to India, while searching for a University job, he had an interview with the Late Pandit Madan Mohan Malviya, Vice Chancellor, Banaras Hindu University. Though Pandit ji was satisfied with the brilliant career of P.V.Sukhatme and agreed to create a Department of Statistics in the University to accommodate him but he wanted to know from Sukhatme how a Chair in Statistics would help our poor country - India. P.V.Sukhatme did not know how to answer this question nor did he join Banaras Hindu University but this question must have moved him sufficiently in determining his future life, particularly his fundamental work on nutrition.
9
During 1939-40, he became a Professor at the All India Institute of Hygiene and Public Health, Calcutta. In 1940 he joined ICAR as a Statistician, and was later on appointed as Statistical Advisor to the Council to head its Statistical Unit. On account of his dynamic leadership, following the path and tradition set by him, the statistical branch of ICAR eventually grew to become a full-fledged Institute (Indian Agricultural Statistics Research Institute) exclusively devoted to research in agricultural statistics. Prof. Sukhatme, as a founder of the Indian Society of Agricultural Statistics, devoted a good deal of his time and energy to the popularization of statistical methods among the practitioners of agricultural, veterinary and related sciences. He served as the First Honorary Secretary of the Indian Society of Agricultural Statistics for a number of years. The Society owes him a lot for his continued valuable guidance as well as for shouldering the responsibility, as its President during 1991 and Executive President since 1970 till his demise.
In 1951, he was Visiting Professor at Iowa State University, Ames Lowa, USA where he completed his textbook on sampling. During 1952-70 he headed the Statistics Division of the Food & Agriculture Organisation (FAO) of the United Nations in Rome. After retiring from the UN in 1971 he served as Regents Professor, University of California at Berkely and then settled in Pune, carrying out valuable work on nutrition at the Maharashtra Association for the Cultivation of Science. He authored several books on the various scientific topics of interest and published more than 200 research papers in reputed national and international journals.
Prof. Sukhatme was well known in the field of nutrition for the Sukhatme-Margen hypothesis which in plain language implies that “ At low levels of calorie intake, energy is used with greater metabolic efficiency and efficiency decreases as the intake increases over the homeostatic range”.
He was awarded the ‘Guy Medal’ by the Royal Statistical Society for his paper on nutrition which he presented to the Society in 1963, the B.C.Guha Memorial Lectureship of the Indian Science Congress Association in 1965 and the B.D.Tilak Lectureship of the Indian National Science Academy in 1982. Among the numerous other honours he received, mention must be made of the Fellowship of the American Statistical Association, National Academy of Sciences, Allahabad, Indian Academy of Sciences, Bangalore and Indian National Science Academy, New Delhi. He was elected member of the International Statistical Institute, Netherlands and its Vice President in 1969-70. For his outstanding contribution to Science and Human Welfare, he was conferred the Padma Bhushan by the President of India in 1973. He was awarded the Hari Om Ashram Trust Award by the University Grants Commission in 1983. For the distinguished service to the cause of Statistics and its application to agriculture and allied fields, he was conferred with the honour of Sankhyiki Bhushan in 1989 by the Indian Society of Agricultural Statistics, New Delhi. He also received the P.C.Mohalanobis Birth Centenary Award at the Jaipur Session of the Indian Science Congress Association in 1994.
On 28th January 1997, Prof. Sukhatme passed away peacefully.
10
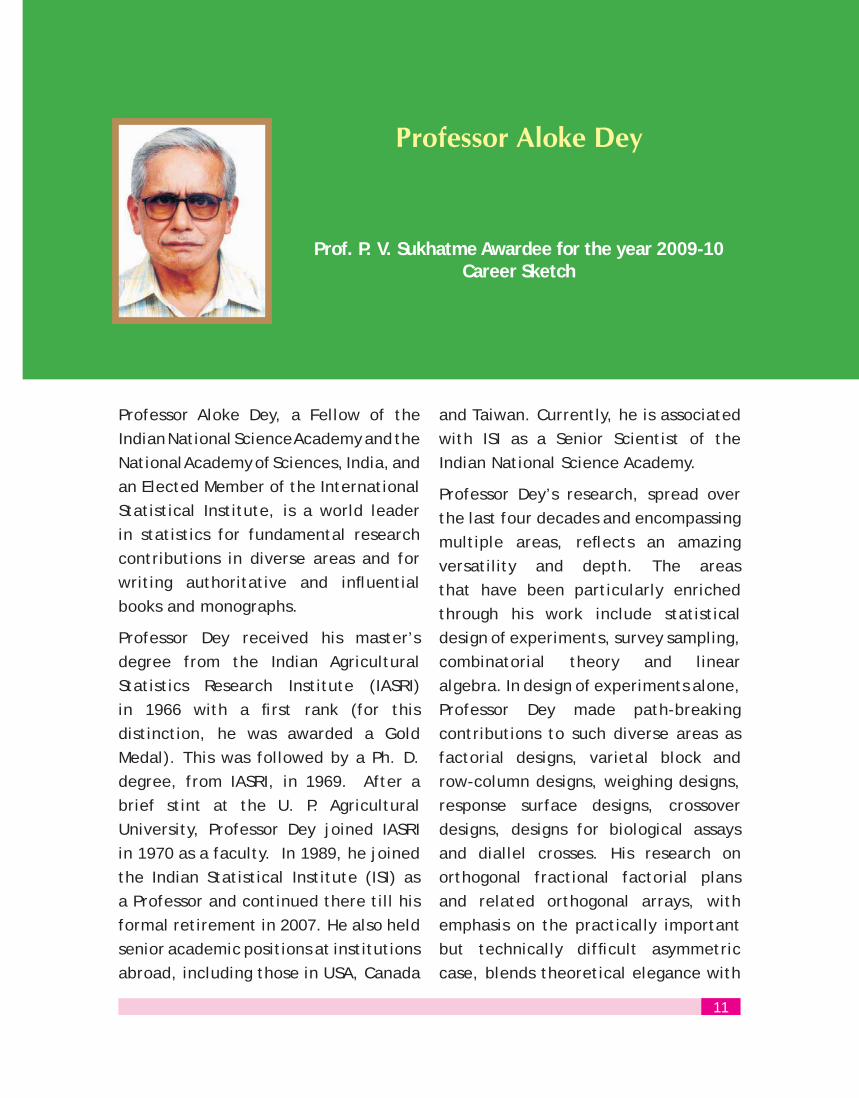
Professor Aloke Dey
Prof. P. V. Sukhatme Awardee for the year 2009-10Career Sketch
Professor Aloke Dey, a Fellow of the Indian National Science Academy and the National Academy of Sciences, India, and an Elected Member of the International Statistical Institute, is a world leader in statistics for fundamental research contributions in diverse areas and for writing authoritative and influential books and monographs.
Professor Dey received his master’s degree from the Indian Agricultural Statistics Research Institute (IASRI) in 1966 with a first rank (for this distinction, he was awarded a Gold Medal). This was followed by a Ph. D. degree, from IASRI, in 1969. After a brief stint at the U. P. Agricultural University, Professor Dey joined IASRI in 1970 as a faculty. In 1989, he joined the Indian Statistical Institute (ISI) as a Professor and continued there till his formal retirement in 2007. He also held senior academic positions at institutions abroad, including those in USA, Canada
and Taiwan. Currently, he is associated with ISI as a Senior Scientist of the Indian National Science Academy.
Professor Dey’s research, spread over the last four decades and encompassing multiple areas, reflects an amazing versatility and depth. The areas that have been particularly enriched through his work include statistical design of experiments, survey sampling, combinatorial theory and linear algebra. In design of experiments alone, Professor Dey made path-breaking contributions to such diverse areas as factorial designs, varietal block and row-column designs, weighing designs, response surface designs, crossover designs, designs for biological assays and diallel crosses. His research on orthogonal fractional factorial plans and related orthogonal arrays, with emphasis on the practically important but technically difficult asymmetric case, blends theoretical elegance with
11
immediate applicability, notably in industrial experimentation and quality control work. His other significant contributions to experimental designs include a new class of incomplete block designs with nested structure, optimal designs under a covariates model, optimal crossover designs, supersaturated designs and orthogonally blocked, highly efficient response surface designs. His work on universal optimality and non-optimality of certain row-column designs is well known for its counter-intuitive findings, and his early results on optimal designs for biological assays and optimal weighing designs have now become classics in these areas. Professor Dey also made significant contributions to many other areas such as unequal probability sampling plans, characterization problems via conditional expectations, tactical configurations, diagonally range dominant matrices, and so on.
Professor Dey has published more than 125 research papers and his work has appeared extensively in the very best journals like, Annals of Statistics, Biometrika, Journal of the Royal Statistical Society, Statistica Sinica, Biometrics and Technometrics. His research papers have received numerous citations globally. Professor has authored/co-authored six books, which have been received very well in academic circles and widely cited,
again globally and in India, with over 300 citations.
Professor Dey also shouldered the responsibility of editing Sankhya, the Indian Journal of Statistics, during 2002-05. He has been invited to act as a referee for numerous journals, including the top ones like Annals of Statistics, Biometrika, Journal of the Royal Statistical Society (Series B), Journal of the American Statistical Association and Statistica Sinica. He is also a regular reviewer for Mathematical Reviews.
Professor Dey has been a motivating and excellent teacher and research supervisor. He has supervised the work of more than 15 Ph. D. students.
Interestingly, one of the books co-authored by him aims at improving the understanding of mathematics among senior school students and first year college students. Professor Dey has for long been engaged in statistical consultancy, providing advice on data collection/analysis to numerous students and researchers in disciplines other than statistics. He has served and continues to serve as an expert on different committees of scientific bodies and government agencies like the Council of Scientific and Industrial Research, University Grants Commission, Department of Science and Technology and several Indian universities.
12


ISSUES, CHALLENGES AND PROSPECTSOF
STATISTICS ON CHILDREN(Theme Paper by Central Statistics Office)
Introduction
In India, childhood has been defined in the context of legal and constitutional provisioning mainly for aberrations of childhood. It is thus a variable concept to suit the purpose and rationale of childhood in differing circumstances. Essentially they differ in defining the upper age-limit of childhood.
The child related legal and constitutional provisions are kept in view while statistics
are generated for different cross-sections of children that align with specific age-groups standing for specific target groups of children such as, child labourers, children in school education, children in crimes, etc.
Recognizing the need to provide for different age-groups of children in different laws, the Article 1 of ‘UN Convention on the Rights of the Child (UNCRC)’ defined the meaning of a child: ‘a child means every human being below the age of eighteen
Article 45 of Constitution of India states • - ‘the State shall endeavour to provide free and compulsory education for all children till they complete the age of fourteen years …’.Different Acts under Labour Laws declare different age criteria :• The Apprentices Act (1961) o ‘A person is qualified to be engaged as an o
apprentice only if he is not less than fourteen years of age ….’.
The Factories Act (1948) o ‘a child below 14 years of age is not allowed oto work in any factory. An adolescent between 15 and 18 years can be employed in a factory only if he obtains a certificate of fitness from an authorized medical doctor….’.
The Child Labour Prohibition and oRegulation Act (1986)
‘Child means a person who has not ocompleted his fourteenth year of age.’
Prohibition of Child Marriage Act (2006) • declares ‘Child means a person who, if a male, has not completed twenty-one years of age and, if a female, has not completed eighteen years of age’.The Juvenile Justice (Care and Protection of Children Act (2000) • declares ‘”juvenile” or “child” means a person who has not completed eighteenth year of age.’ Indian Penal Code in its Criminal law • states ‘Nothing is an offence which is done by a child under age of 7 years. The age of criminal responsibility is raised to 12 years if the child is found to have not attained the ability to understand the nature and consequences of his/her act.
15
years unless under the law applicable to the child, majority is attained earlier.’The definition of the child as given by the UNCRC has definite bearing not only on child development programmes and on budgetary provisions for them, but also on production of statistics as applicable to different cross-sections of children in terms of reference ages.
The definition of children as implicitly adopted by the National Plan of Action for Children 2005 forms the basis for understanding the scope of childhood matters and child development issues. They relate to the broadest cross-section that generally subsumes sub-populations relevant and applicable to different reference age-groups. The National Plan of Action for Children, 2005 aims to ensure all rights to all children upto the age of 18 years. This necessarily implies co-existence of different sub-populations of children for different programmes and circumstances as per law(s) applicable to them, and hence recognises the existence or non-existence of corresponding sets of statistical details (mainly to signify incidence or prevalence rates) of various features of childhood aberration.
Statistics related to ‘Children’
Statistics produced by government and non-government agencies to characterize child related statistical features refer to different age-groups of children. Depending on children of different situations, conditions and circumstances, reference age-groups vary in the corresponding statistics, especially in respect of cases related to
children covered under certain specific legal or constitutional provisions. Apart from these categories, early childhood ages relating to infancy, pre-natal, neo-natal, post-natal, under-5 years, pre-school age, primary school age, etc also refer to different age-groups as per conventional or legitimate criteria followed for the purpose of recording official statistics. Standardisation of age-groups for different childhood characteristics and medico-legal considerations has been introduced through a number of international instruments that India, like most of other countries, has also adopted. But, in practice, defined age-groups for different childhood matters are not being followed uniformly in the statistics produced in the country and also in many cases in the development programmes related to specific target groups of children. This leads to confusion in identification and quantification of desired child population and measures of certain statistical indicators thereof as well as in comparability of these across different cross-sections and time.
Issues and characteristics of child related statistics essentially revolve around four broad domains namely, (i) child survival, (ii) child development and (iii) child protection and (iv) child participation. While child survival relates to early
childhood ages mainly from 0 to 5 years and defined natality
periods, child development essentially covers pre-school and school ages and child protection covers entire age-group of 0-18 years. Child rights are important
Broad Domains of Child Statistics
16
considerations in defining parameters and statistical measures for both development and protection of children, mostly for those which are invisible in statistics. However, for assessment of impact of government’s policy and programme interventions, considerations of specific target groups of childhood ages for the outcome indicators are all the more relevant.
Para 60 of the Resolution S- 27/2 ‘A World fit for Children’(WFFC) adopted by the
United Nations G e n e r a l Assembly on
11 October 2002 bears out the commitment of the world community to monitor the progress towards the set goals through strengthening of national statistical capacity as follows:
“We will monitor regularly at the national level and, where appropriate, at the regional level and assess progress towards the goals and targets of the present Plan of Action at the national, regional and global levels. Accordingly, we will strengthen our national
Thematic Listing of Childhood Characteristics
statistical capacity to collect, analyze and disaggregate data, including by sex, age and other relevant factors that may lead to disparities, and support a wide range of child-focused research. We will enhance international cooperation to support statistical capacity-building efforts and build community capacity for monitoring, assessment and planning”
UNCRC provides thematically listed indicators to address child issues. Though not exhaustive, the list as below can serve as a list of important measures of the outcomes of national programmes and policy focus on children. This list also indicates the relevant reference age-groups which can be treated as standard age-groups for production of statistics at different levels under the national system to assess locales of the problems at sub-national geographical and administrative divisions. However, the national system has to devise a country-specific list taking into account the UNCRC list together with MDG indicators, WFC framework etc.
Issues:
Sa) tandardised uniform age-grouping of children, over intersects of legal and programme-based sub-populations for classification by ages under various cross-cutting dimensions of child-affairs;
Harmonization of concepts and definitions of indicators adopted from international b)frameworks in national system;
Capacity building for production of statistics, analysis and research; c)
Use of statistical indicators for monitoring outcomes at national and sub-national levelsd) at
quick and regular intervals of time.
17
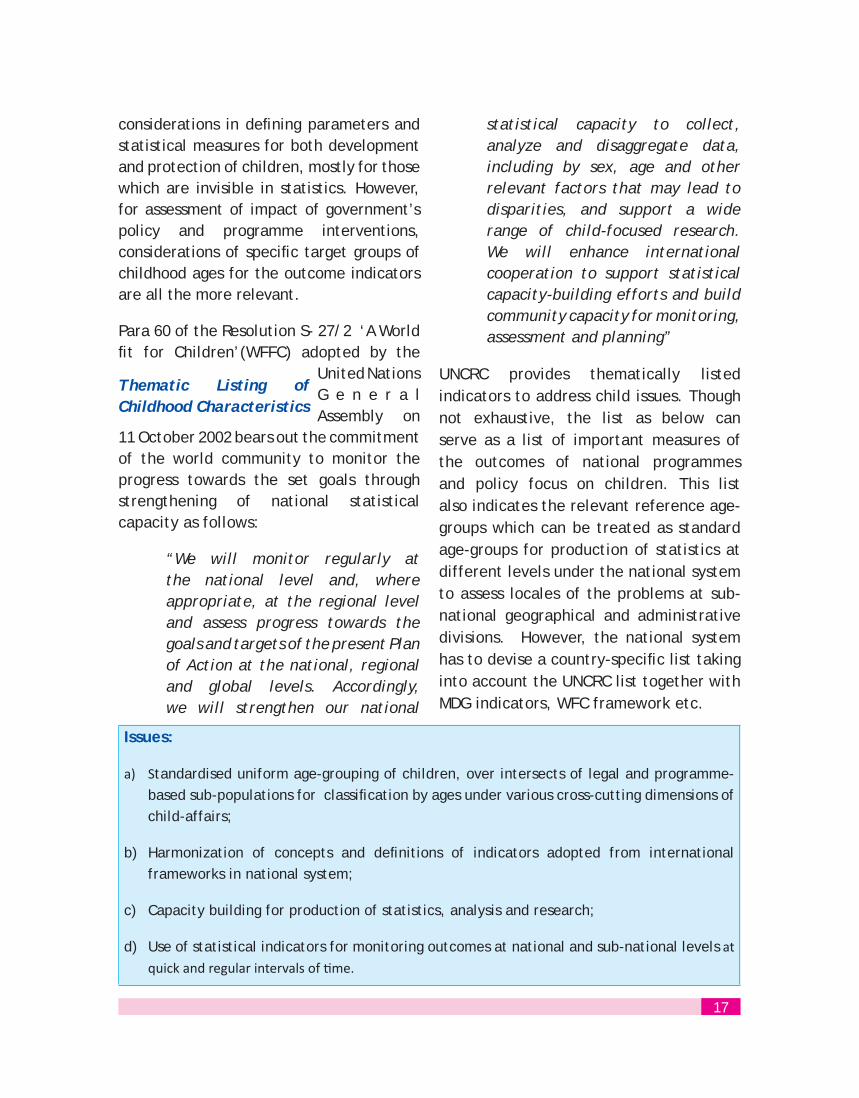
Challenges:
Statistical implications of adopting uniform concepts, definitions, classificatory a)characteristics do not receive due consideration. This inhibits merging or cross tabulation of data across sources and over time.
Data limitations in crime records inhibit use of statistics for measuring size of problematic b)sub-populations for government interventions.
Legal instruments do not necessitate use of statistics for evidence, whereas govt. c)programmes need to address target groups defined by legal norms and classification
Institutional mechanism to be in place for inter-disciplinary processes in identification and d)delineation of indicators for objectives/targets in view.
Prospects:
NPA 2005 guidelines may be a useful instrument for defining appropriate intersects of child a)population in various conditions/circumstances
Law administrators are being associated through various mechanisms for reviewing existing b)processes for production of statistics on involvement children in illegal activities and/or their victimisation.
NSO led contemporaneous monitoring system may effectively use other collaborative c)mechanisms in devising indicator-framework for appropriate statistical exercises.
Thematic Area/Indicators Age
General measures of implementation
1. National funds disbursed by governments NA
2. CRC National Policy and Planning Effort Index 0-17
3. Population aged less than 18 years 0-17
4. Deaths among children 0-17
Civil rights and freedom
5. Birth registration 0-4
6. Knowledge of children’s rights 12-17
7. Education on sexual and reproductive health NA
18
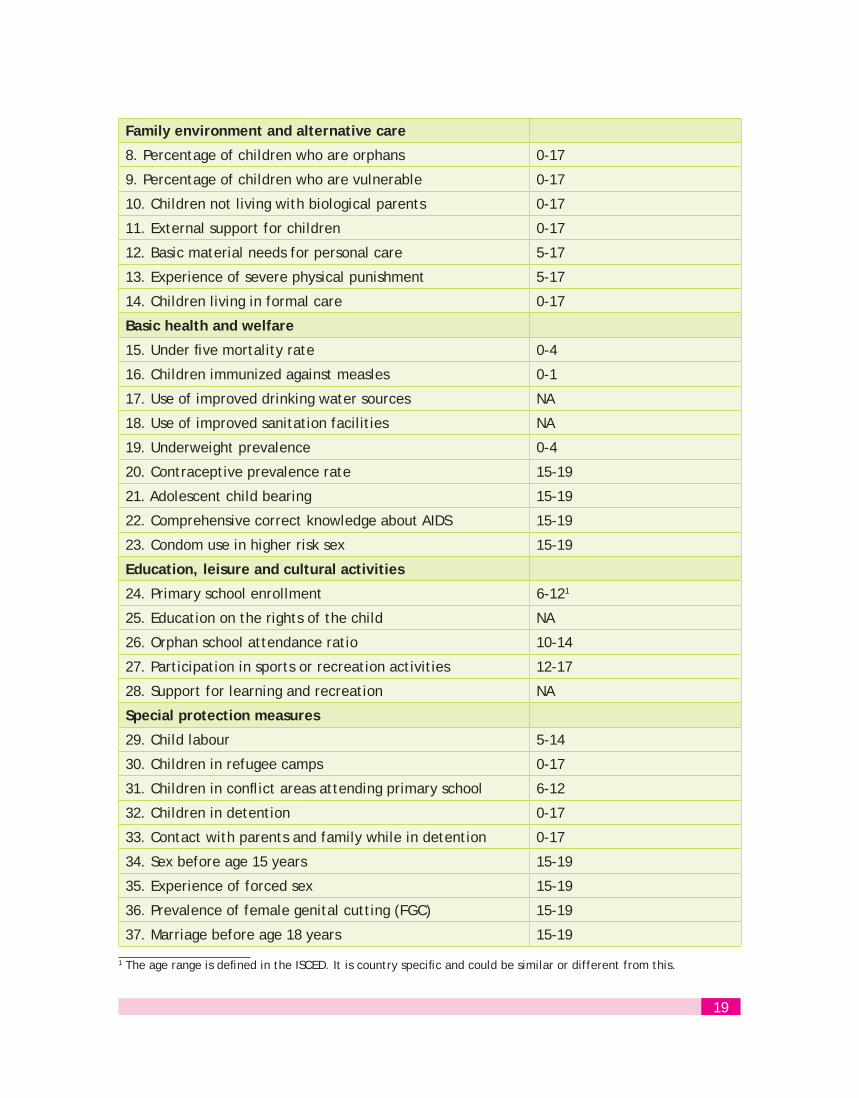
Family environment and alternative care
8. Percentage of children who are orphans 0-17
9. Percentage of children who are vulnerable 0-17
10. Children not living with biological parents 0-17
11. External support for children 0-17
12. Basic material needs for personal care 5-17
13. Experience of severe physical punishment 5-17
14. Children living in formal care 0-17
Basic health and welfare
15. Under five mortality rate 0-4
16. Children immunized against measles 0-1
17. Use of improved drinking water sources NA
18. Use of improved sanitation facilities NA
19. Underweight prevalence 0-4
20. Contraceptive prevalence rate 15-19
21. Adolescent child bearing 15-19
22. Comprehensive correct knowledge about AIDS 15-19
23. Condom use in higher risk sex 15-19
Education, leisure and cultural activities
24. Primary school enrollment 6-121
25. Education on the rights of the child NA
26. Orphan school attendance ratio 10-14
27. Participation in sports or recreation activities 12-17
28. Support for learning and recreation NA
Special protection measures
29. Child labour 5-14
30. Children in refugee camps 0-17
31. Children in conflict areas attending primary school 6-12
32. Children in detention 0-17
33. Contact with parents and family while in detention 0-17
34. Sex before age 15 years 15-19
35. Experience of forced sex 15-19
36. Prevalence of female genital cutting (FGC) 15-19
37. Marriage before age 18 years 15-19
1 The age range is defined in the ISCED. It is country specific and could be similar or different from this.
19
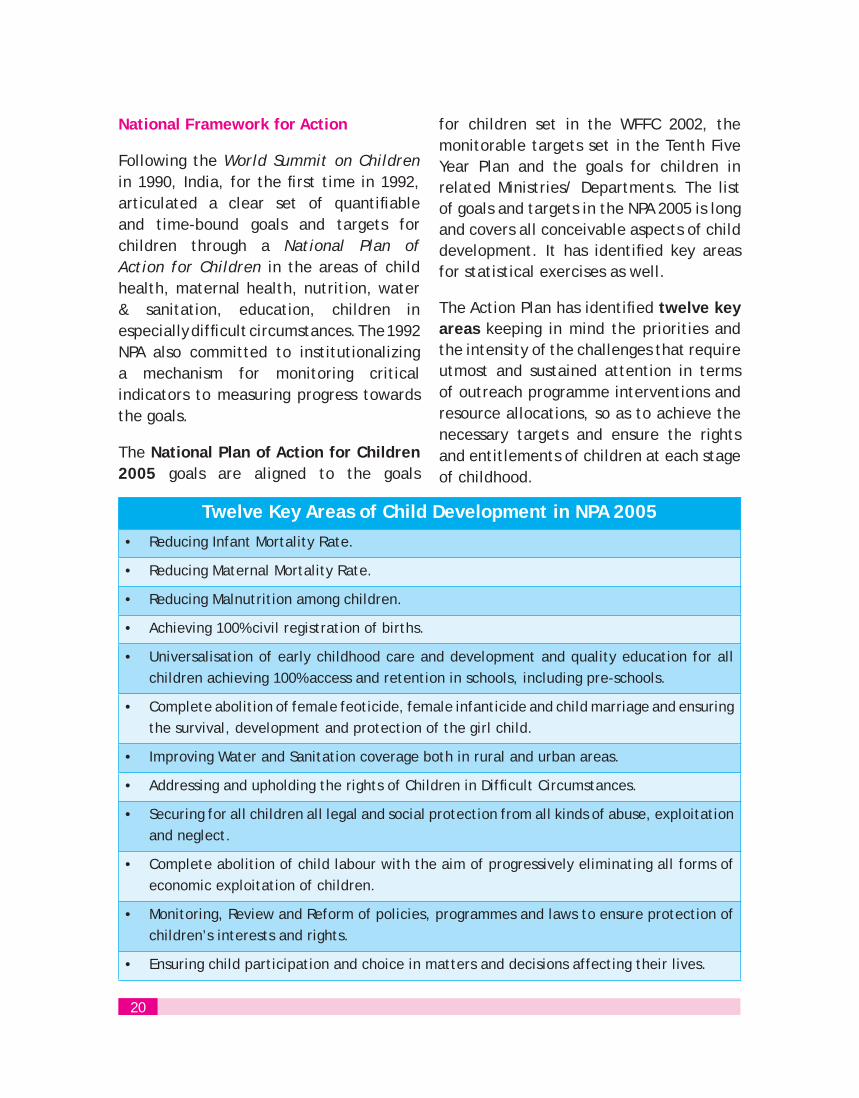
National Framework for Action
Following the World Summit on Childrenin 1990, India, for the first time in 1992, articulated a clear set of quantifiable and time-bound goals and targets for children through a National Plan of Action for Children in the areas of child health, maternal health, nutrition, water & sanitation, education, children in especially difficult circumstances. The 1992 NPA also committed to institutionalizing a mechanism for monitoring critical indicators to measuring progress towards the goals.
The National Plan of Action for Children 2005 goals are aligned to the goals
for children set in the WFFC 2002, the monitorable targets set in the Tenth Five Year Plan and the goals for children in related Ministries/ Departments. The list of goals and targets in the NPA 2005 is long and covers all conceivable aspects of child development. It has identified key areas for statistical exercises as well.
The Action Plan has identified twelve key areas keeping in mind the priorities and the intensity of the challenges that require utmost and sustained attention in terms of outreach programme interventions and resource allocations, so as to achieve the necessary targets and ensure the rights and entitlements of children at each stage of childhood.
Twelve Key Areas of Child Development in NPA 2005Reducing Infant Mortality Rate.•
Reducing Maternal Mortality Rate.•
Reducing Malnutrition among children.•
Achieving 100% civil registration of births.•
Universalisation of early childhood care and development and quality education for all • children achieving 100% access and retention in schools, including pre-schools.
Complete abolition of female feoticide, female infanticide and child marriage and ensuring • the survival, development and protection of the girl child.
Improving Water and Sanitation coverage both in rural and urban areas.•
Addressing and upholding the rights of Children in Difficult Circumstances.•
Securing for all children all legal and social protection from all kinds of abuse, exploitation • and neglect.
Complete abolition of child labour with the aim of progressively eliminating all forms of • economic exploitation of children.
Monitoring, Review and Reform of policies, programmes and laws to ensure protection of • children’s interests and rights.
Ensuring child participation and choice in matters and decisions affecting their lives.•
20
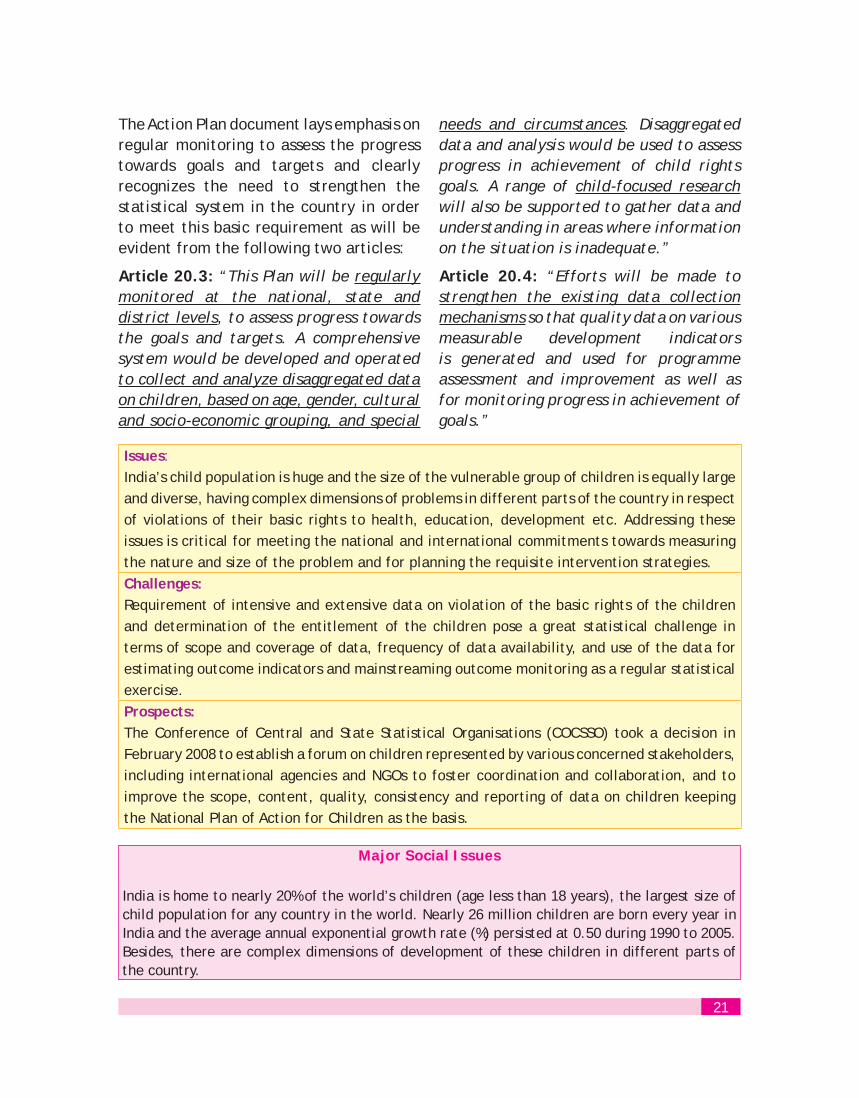
The Action Plan document lays emphasis on regular monitoring to assess the progress towards goals and targets and clearly recognizes the need to strengthen the statistical system in the country in order to meet this basic requirement as will be evident from the following two articles:
Article 20.3: “This Plan will be regularly monitored at the national, state and district levels, to assess progress towards the goals and targets. A comprehensive system would be developed and operated to collect and analyze disaggregated data on children, based on age, gender, cultural and socio-economic grouping, and special
needs and circumstances. Disaggregated data and analysis would be used to assess progress in achievement of child rights goals. A range of child-focused researchwill also be supported to gather data and understanding in areas where information on the situation is inadequate.”
Article 20.4: “Efforts will be made to strengthen the existing data collection mechanisms so that quality data on various measurable development indicators is generated and used for programme assessment and improvement as well as for monitoring progress in achievement of goals.”
Issues:India’s child population is huge and the size of the vulnerable group of children is equally large and diverse, having complex dimensions of problems in different parts of the country in respect of violations of their basic rights to health, education, development etc. Addressing these issues is critical for meeting the national and international commitments towards measuring the nature and size of the problem and for planning the requisite intervention strategies.Challenges:Requirement of intensive and extensive data on violation of the basic rights of the children and determination of the entitlement of the children pose a great statistical challenge in terms of scope and coverage of data, frequency of data availability, and use of the data for estimating outcome indicators and mainstreaming outcome monitoring as a regular statistical exercise.Prospects:The Conference of Central and State Statistical Organisations (COCSSO) took a decision in February 2008 to establish a forum on children represented by various concerned stakeholders, including international agencies and NGOs to foster coordination and collaboration, and to improve the scope, content, quality, consistency and reporting of data on children keeping the National Plan of Action for Children as the basis.
Major Social Issues
India is home to nearly 20% of the world’s children (age less than 18 years), the largest size of child population for any country in the world. Nearly 26 million children are born every year in India and the average annual exponential growth rate (%) persisted at 0.50 during 1990 to 2005. Besides, there are complex dimensions of development of these children in different parts of the country.
21
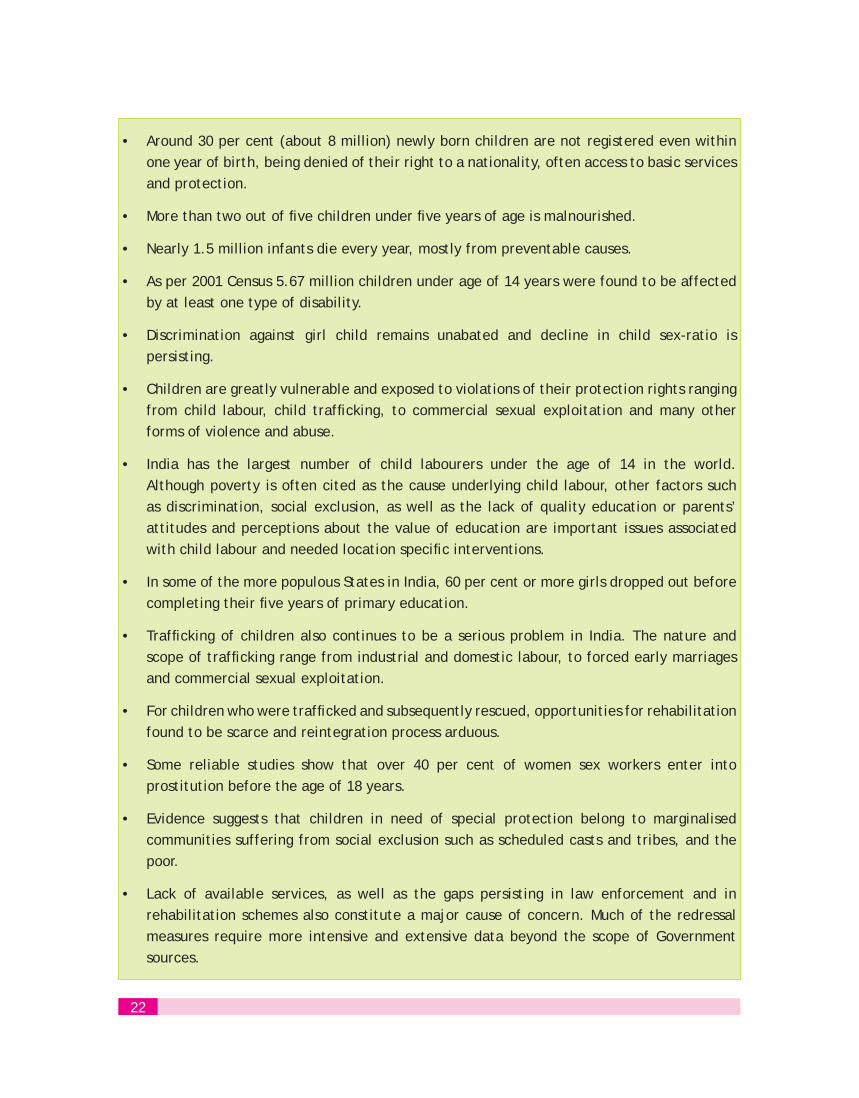
Around 30 per cent (about 8 million) newly born children are not registered even within • one year of birth, being denied of their right to a nationality, often access to basic services and protection.
More than two out of five children under five years of age is malnourished.•
Nearly 1.5 million infants die every year, mostly from preventable causes.•
As per 2001 Census 5.67 million children under age of 14 years were found to be affected • by at least one type of disability.
Discrimination against girl child remains unabated and decline in child sex-ratio is • persisting.
Children are greatly vulnerable and exposed to violations of their protection rights ranging • from child labour, child trafficking, to commercial sexual exploitation and many other forms of violence and abuse.
India has the largest number of child labourers under the age of 14 in the world. • Although poverty is often cited as the cause underlying child labour, other factors such as discrimination, social exclusion, as well as the lack of quality education or parents’ attitudes and perceptions about the value of education are important issues associated with child labour and needed location specific interventions.
In some of the more populous States in India, 60 per cent or more girls dropped out before • completing their five years of primary education.
Trafficking of children also continues to be a serious problem in India. The nature and • scope of trafficking range from industrial and domestic labour, to forced early marriages and commercial sexual exploitation.
For children who were trafficked and subsequently rescued, opportunities for rehabilitation • found to be scarce and reintegration process arduous.
Some reliable studies show that over 40 per cent of women sex workers enter into • prostitution before the age of 18 years.
Evidence suggests that children in need of special protection belong to marginalised • communities suffering from social exclusion such as scheduled casts and tribes, and the poor.
Lack of available services, as well as the gaps persisting in law enforcement and in • rehabilitation schemes also constitute a major cause of concern. Much of the redressal measures require more intensive and extensive data beyond the scope of Government sources.
22
Statistical Evidence for Child Issues
In the overall context of understanding the children’s state through statistical evidence, there is a need to use national statistics as well as statistics produced by non-government organisations or by international agencies. This is all the more important for those dimensions, which are invisible in national statistics or are required for international comparison and for establishing a more credible system for determination of the entitlement of children.
Child survival & Child Health
India, contributes to more than 20 per cent of the child deaths in the world.
Annually, about 1.83 million2 children die before completing
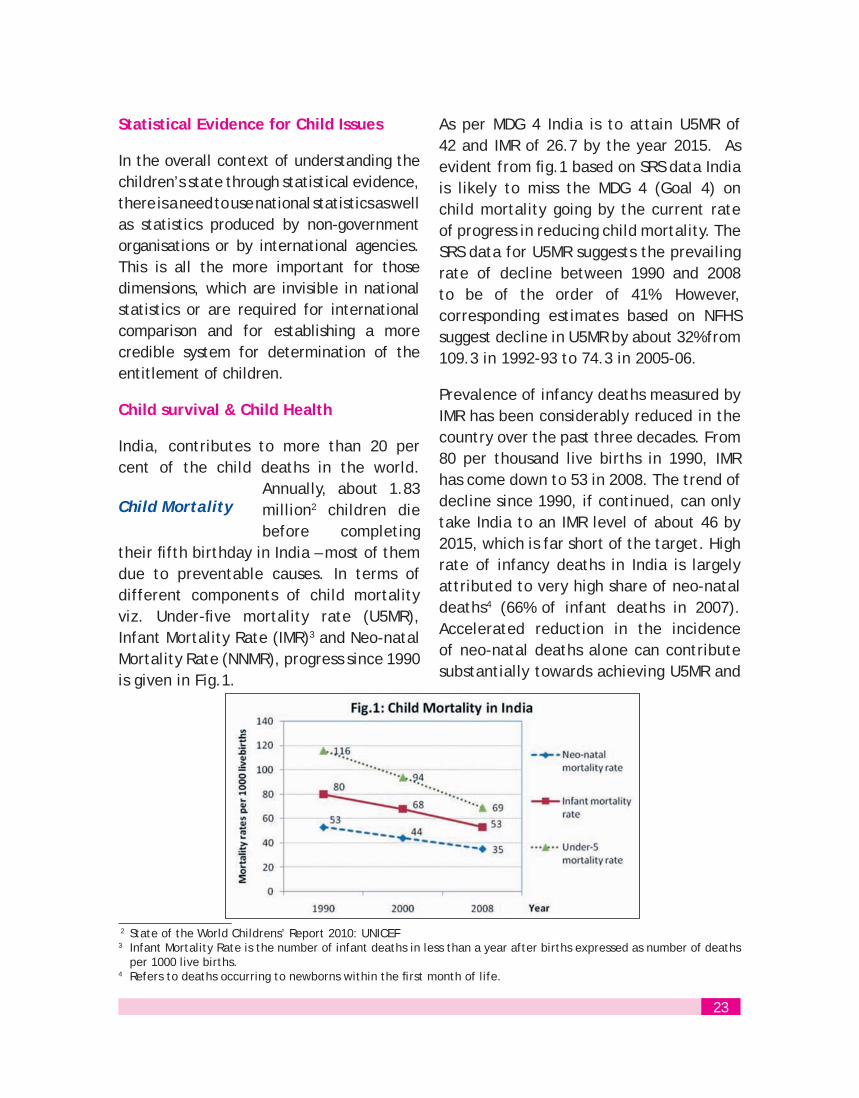
their fifth birthday in India – most of them due to preventable causes. In terms of different components of child mortality viz. Under-five mortality rate (U5MR), Infant Mortality Rate (IMR)3 and Neo-natal Mortality Rate (NNMR), progress since 1990 is given in Fig.1.
Child Mortality
As per MDG 4 India is to attain U5MR of 42 and IMR of 26.7 by the year 2015. As evident from fig.1 based on SRS data India is likely to miss the MDG 4 (Goal 4) on child mortality going by the current rate of progress in reducing child mortality. The SRS data for U5MR suggests the prevailing rate of decline between 1990 and 2008 to be of the order of 41%. However, corresponding estimates based on NFHS suggest decline in U5MR by about 32% from 109.3 in 1992-93 to 74.3 in 2005-06.
Prevalence of infancy deaths measured by IMR has been considerably reduced in the country over the past three decades. From 80 per thousand live births in 1990, IMR has come down to 53 in 2008. The trend of decline since 1990, if continued, can only take India to an IMR level of about 46 by 2015, which is far short of the target. High rate of infancy deaths in India is largely attributed to very high share of neo-natal deaths4 (66% of infant deaths in 2007). Accelerated reduction in the incidence of neo-natal deaths alone can contribute substantially towards achieving U5MR and
2 State of the World Childrens’ Report 2010: UNICEF3 Infant Mortality Rate is the number of infant deaths in less than a year after births expressed as number of deaths
per 1000 live births.4 Refers to deaths occurring to newborns within the first month of life.
23
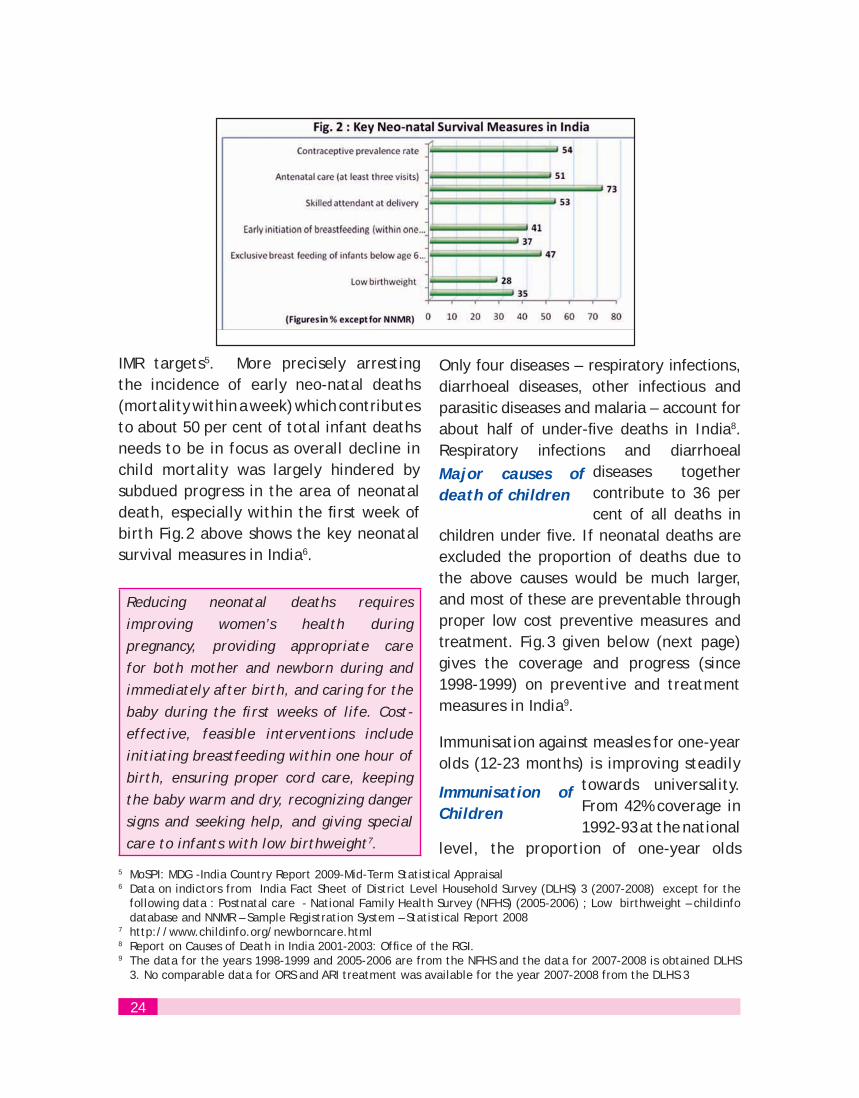
IMR targets5. More precisely arresting the incidence of early neo-natal deaths (mortality within a week) which contributes to about 50 per cent of total infant deaths needs to be in focus as overall decline in child mortality was largely hindered by subdued progress in the area of neonatal death, especially within the first week of birth Fig.2 above shows the key neonatal survival measures in India6.
Reducing neonatal deaths requires improving women’s health during pregnancy, providing appropriate care for both mother and newborn during and immediately after birth, and caring for the baby during the first weeks of life. Cost-effective, feasible interventions include initiating breastfeeding within one hour of birth, ensuring proper cord care, keeping the baby warm and dry, recognizing danger signs and seeking help, and giving special care to infants with low birthweight7.
Only four diseases – respiratory infections, diarrhoeal diseases, other infectious and parasitic diseases and malaria – account for about half of under-five deaths in India8.Respiratory infections and diarrhoeal
diseases together contribute to 36 per cent of all deaths in
children under five. If neonatal deaths are excluded the proportion of deaths due to the above causes would be much larger, and most of these are preventable through proper low cost preventive measures and treatment. Fig.3 given below (next page) gives the coverage and progress (since 1998-1999) on preventive and treatment measures in India9.
Immunisation against measles for one-year olds (12-23 months) is improving steadily
towards universality. From 42% coverage in 1992-93 at the national
level, the proportion of one-year olds
Immunisation of Children
Major causes of death of children
5 MoSPI: MDG -India Country Report 2009-Mid-Term Statistical Appraisal6 Data on indictors from India Fact Sheet of District Level Household Survey (DLHS) 3 (2007-2008) except for the
following data : Postnatal care - National Family Health Survey (NFHS) (2005-2006) ; Low birthweight – childinfo database and NNMR – Sample Registration System – Statistical Report 2008
7 http://www.childinfo.org/newborncare.html8 Report on Causes of Death in India 2001-2003: Office of the RGI. 9 The data for the years 1998-1999 and 2005-2006 are from the NFHS and the data for 2007-2008 is obtained DLHS
3. No comparable data for ORS and ARI treatment was available for the year 2007-2008 from the DLHS 3
24
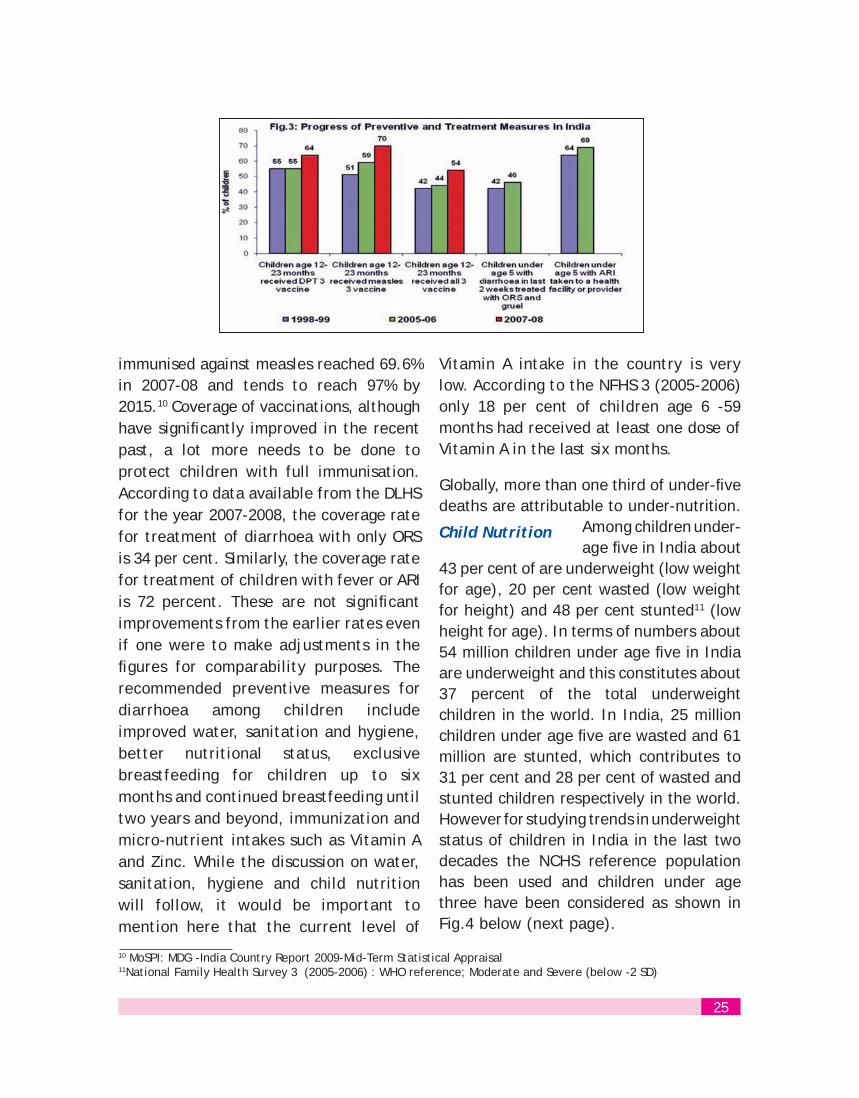
immunised against measles reached 69.6% in 2007-08 and tends to reach 97% by 2015.10 Coverage of vaccinations, although have significantly improved in the recent past, a lot more needs to be done to protect children with full immunisation. According to data available from the DLHS for the year 2007-2008, the coverage rate for treatment of diarrhoea with only ORS is 34 per cent. Similarly, the coverage rate for treatment of children with fever or ARI is 72 percent. These are not significant improvements from the earlier rates even if one were to make adjustments in the figures for comparability purposes. The recommended preventive measures for diarrhoea among children include improved water, sanitation and hygiene, better nutritional status, exclusive breastfeeding for children up to six months and continued breastfeeding until two years and beyond, immunization and micro-nutrient intakes such as Vitamin A and Zinc. While the discussion on water, sanitation, hygiene and child nutrition will follow, it would be important to mention here that the current level of
Vitamin A intake in the country is very low. According to the NFHS 3 (2005-2006) only 18 per cent of children age 6 -59 months had received at least one dose of Vitamin A in the last six months.
Globally, more than one third of under-five deaths are attributable to under-nutrition.
Among children under-age five in India about
43 per cent of are underweight (low weight for age), 20 per cent wasted (low weight for height) and 48 per cent stunted11 (low height for age). In terms of numbers about 54 million children under age five in India are underweight and this constitutes about 37 percent of the total underweight children in the world. In India, 25 million children under age five are wasted and 61 million are stunted, which contributes to 31 per cent and 28 per cent of wasted and stunted children respectively in the world. However for studying trends in underweight status of children in India in the last two decades the NCHS reference population has been used and children under age three have been considered as shown in Fig.4 below (next page).
Child Nutrition
10 MoSPI: MDG -India Country Report 2009-Mid-Term Statistical Appraisal11National Family Health Survey 3 (2005-2006) : WHO reference; Moderate and Severe (below -2 SD)
25

It is clear that India is not likely to reach the MDG on child malnutrition, which uses children underweight as the indicator and fix the target as 26% in 2015. Since the time MDGs were adopted in 2000, knowledge on causes and consequences of under-nutrition has greatly improved12. There is a growing emphasis on the problem of chronic under-nutrition (indicated by underweight and/ or stunting) which is difficult to correct. Chronic under-nutrition not only impacts child survival and growth but also results in diminished cognitive and physical development and has an inter-generational impact in terms of productivity and higher risk of disease and for girls leading to low birth weight babies, again leading to under-nutrition, and thus repeating a vicious cycle of under-nutrition. Therefore, there is a need to increase programme focus to chronic under-nutrition in addition to the other forms of under-nutrition. Also it is now being recognized that the greatest vulnerability to
nutritional deficiencies is during the period of the mothers’ pregnancy and continues until age two.
It is clear from above that the coverage levels of key interventions remain sub-optimal13 and require increased efforts to secure improved survival chances for children in their early stages of life.
Thus, marked reductions in child under-nutrition can be achieved through improvements in women’s nutrition before and during pregnancy, early and exclusive breastfeeding, good quality complementary
feeding for infants and young children, with
appropriate micro-nutrient interventions14.It has already been seen above that the nutritional status of women in the reproductive period is low and breastfeeding rates are sub-optimal and micronutrient intake is far from satisfactory. In India the complementary feeding (which is considered to be most effective intervention for reducing stunting) rate among breastfed children of
Maternal Health
12 Tracking Progress on Child and Maternal Nutrition: A survival and development priority, UNICEF 200913 There is notable improvement in initiation of breastfeeding within one hour- 25% in 2005-2006 (NFHS) to 41% in
2007-2008 (DLHS) 14 Tracking Progress on Child and Maternal Nutrition: A survival and development priority, UNICEF 2009
26

age 6 – 9 months is 57 per cent. Among the breastfed children of age 6-23 months, the percentage of children fed with three or more food groups and minimum number of times is as low as 22 per cent15. This will also contribute to improving maternal health and reduce maternal mortality. The Eleventh Plan of Government of India targets at achieving by 2012, reducing proportion of anaemic women of age 15-49 years to 26 per cent. About one third of currently married women in the age-group 15-49 years have Body Mass Index (BMI) less than 18.5 kg/m2 and 56 per cent have anemia16. It is important to note that about 47 per cent girls in the age-group 15-19 years, have BMI less than 18.5 kg/m2 andanaemia prevalence among them is also 56 per cent. This highlights the need to have focused interventions for improving
adolescent anaemia and related health risks among young women.
The factors that cause pre-term birth and neonatal deaths are also largely responsible
for maternal deaths. The Maternal Mortality
Ratio (MMR) for India for the period 2004-2006 was 254 per 100,000 live births, which declined from 301 estimated during 2001-200317. The availability of data on MMR in India in the past were to say the least, were sporadic. If one considers the MMR obtained from the first National Family Health Survey conducted in 1992-1993 as the starting point of MDG 5, India has to reach MMR of 109 by 2015, a target which is not likely to be attained at the current rate of progress. Fig.5 below shows the relative measures of the causes of maternal deaths in India18. It can be seen from Fig.
Secure Motherhood
15 NFHS 3 (2005- 2006): It is recommended that breastfeeding children age 6-23 months should be fed from three or more different food groups. Moreover, infants’ age 6-8 months should be fed at least twice a day and children age 9-23 months should be fed at least three times a day.
16 National Family Health Survey 2005-200617 The MMR data quoted here is from those obtained from Sample Registration Reports on Maternal Mortality.18 Maternal Mortality in India: 1997-2003, Trends, Causes and Risk Factors; Registrar General, India
27
5 that haemorrhage and sepsis which are predisposed to a great extent by maternal anemia, contribute to more than two-thirds of the maternal deaths. Women with chronic malnutrition are vulnerable to obstructed labour. The specific interventions that can reduce the elevated risk of morbidity and mortality due to complications before, during and after birth are antenatal care, skilled attendance at birth, emergency obstetric care, post-partum care, contraception and family planning delivered across a continuum of care19.
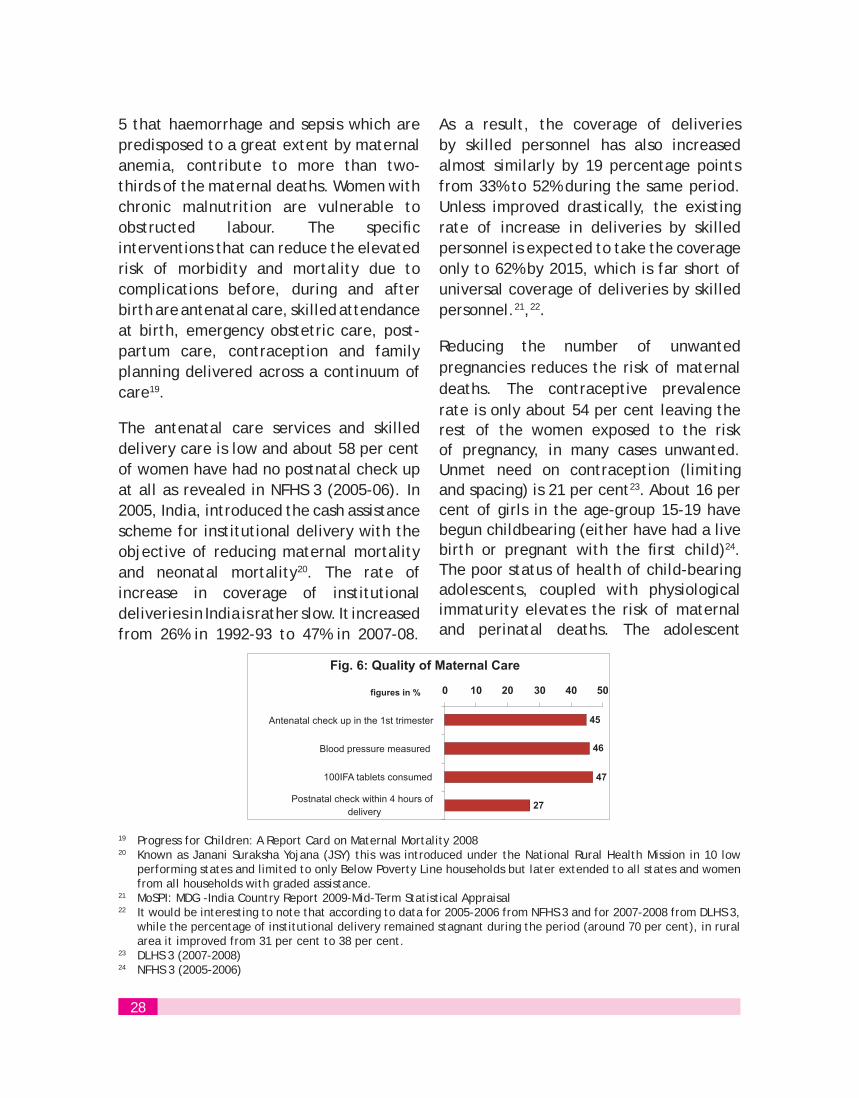
The antenatal care services and skilled delivery care is low and about 58 per cent of women have had no postnatal check up at all as revealed in NFHS 3 (2005-06). In 2005, India, introduced the cash assistance scheme for institutional delivery with the objective of reducing maternal mortality and neonatal mortality20. The rate of increase in coverage of institutional deliveries in India is rather slow. It increased from 26% in 1992-93 to 47% in 2007-08.
As a result, the coverage of deliveries by skilled personnel has also increased almost similarly by 19 percentage points from 33% to 52% during the same period. Unless improved drastically, the existing rate of increase in deliveries by skilled personnel is expected to take the coverage only to 62% by 2015, which is far short of universal coverage of deliveries by skilled personnel.21,22.
Reducing the number of unwanted pregnancies reduces the risk of maternal deaths. The contraceptive prevalence rate is only about 54 per cent leaving the rest of the women exposed to the risk of pregnancy, in many cases unwanted. Unmet need on contraception (limiting and spacing) is 21 per cent23. About 16 per cent of girls in the age-group 15-19 have begun childbearing (either have had a live birth or pregnant with the first child)24.The poor status of health of child-bearing adolescents, coupled with physiological immaturity elevates the risk of maternal and perinatal deaths. The adolescent
19 Progress for Children: A Report Card on Maternal Mortality 200820 Known as Janani Suraksha Yojana (JSY) this was introduced under the National Rural Health Mission in 10 low
performing states and limited to only Below Poverty Line households but later extended to all states and women from all households with graded assistance.
21 MoSPI: MDG -India Country Report 2009-Mid-Term Statistical Appraisal22 It would be interesting to note that according to data for 2005-2006 from NFHS 3 and for 2007-2008 from DLHS 3,
while the percentage of institutional delivery remained stagnant during the period (around 70 per cent), in rural area it improved from 31 per cent to 38 per cent.
23 DLHS 3 (2007-2008)24 NFHS 3 (2005-2006)
28
Challenges:
Existing Health MIS or other survey results including results brought out by the National a)Institute of Nutrition do not provide frequent updates with desired sub-national break-ups.
Programme based results are highly unreliable and can not be used for estimation of the b)desired outcome indicators at state level or national level.
Hospital recording system is not adequately configured for generation of statistics related c)to standard health and nutrition indicators of prospective mothers and neo-natal babies.
Important national surveys and statistical exercises differ in respect of concepts and d)definitions of common health parameters and methodology affecting the scope of pulling data from more than one sources.
It is important to identify, through spatial mapping of statistics, locales of female foeticide, e)children affected by HIV/AIDS and lack of access to safe drinking water and sanitation facilities etc.
Prospect:
a) NSO led contemporaneous monitoring system or the proposed Annual Health Survey a)may effectively produce frequent estimates on the basic survival/ mortality, nutrition and health indicators of mothers and children at state and sub-state levels. indicators
b) HMIS is likely to be broad based through integration of the proposed Annual Health b)Survey.
The proposed Annual Health Survey may effectively produce frequent estimates on the basic nutrition indicators and maternal mortality and can be part of HMIS.
fertility in India is a consequence of early marriage. About 43 per cent of currently married women in the age-group 20-24
married before age 18 years, a marginal decline from the level of 50 per cent in 1998-199925.
Issues:
How more frequent and reliable estimates of i) different mortality rates applicable a)to natality periods, infancy and under-five years of childhood, ii) different nutrition parameters of children and their mothers applicable to recommended reference ages of children and mothers, iii) maternal mortality parameters together with those for adolescent motherhood, can be had at disaggregated sub-national levels for setting locale-specific intervention strategies?
Reliability of estimates, often due to low sample size, as applicable to recommended b)reference ages at disaggregated sub-national levels is still an issue, as variant estimates from different sources cause confusion for formulation of intervention strategies.
25 Data for 2007-2008 from DLHS 3 and for 1998-1989 from NFHS 2
29
Child Education
The MDG 2 for achieving universal primary education and MDG 3 for promoting gender equality and empowerment of women are vital for achieving almost all the other MDGs. Education of children has an inter-generational impact on poverty26
Also it is well established in most parts of the developing world that there exists an inverse relationship between girls’ education and infant/ child mortality.
India has already attained cent percent gross enrolment ratio27 (GER) in primary
grades of schooling for both boys and
girls. GER stands at 114.42 for boys and 107.84 for girls in the year 2006-07.The ratio does not take into account the official schooling age for primary grades and thus also includes pupils who are under-aged or over-aged for primary grades and thus exceeds cent percent mark. But this is only indicative of steady progress to universal primary education. India has made rapid strides in universalizing primary education largely as the outcome of sustained interventions under Sarva Siksha Abhiyan (SSA) and the Mid Day Meal Scheme (MDM). Also the net enrolment ratio (NER)28, which is a more appropriate indicator in this respect, indicates that,
Enrolment Ratios
the country is tending to achieve 2015 target of universal primary education for all children aged 6-11 years.
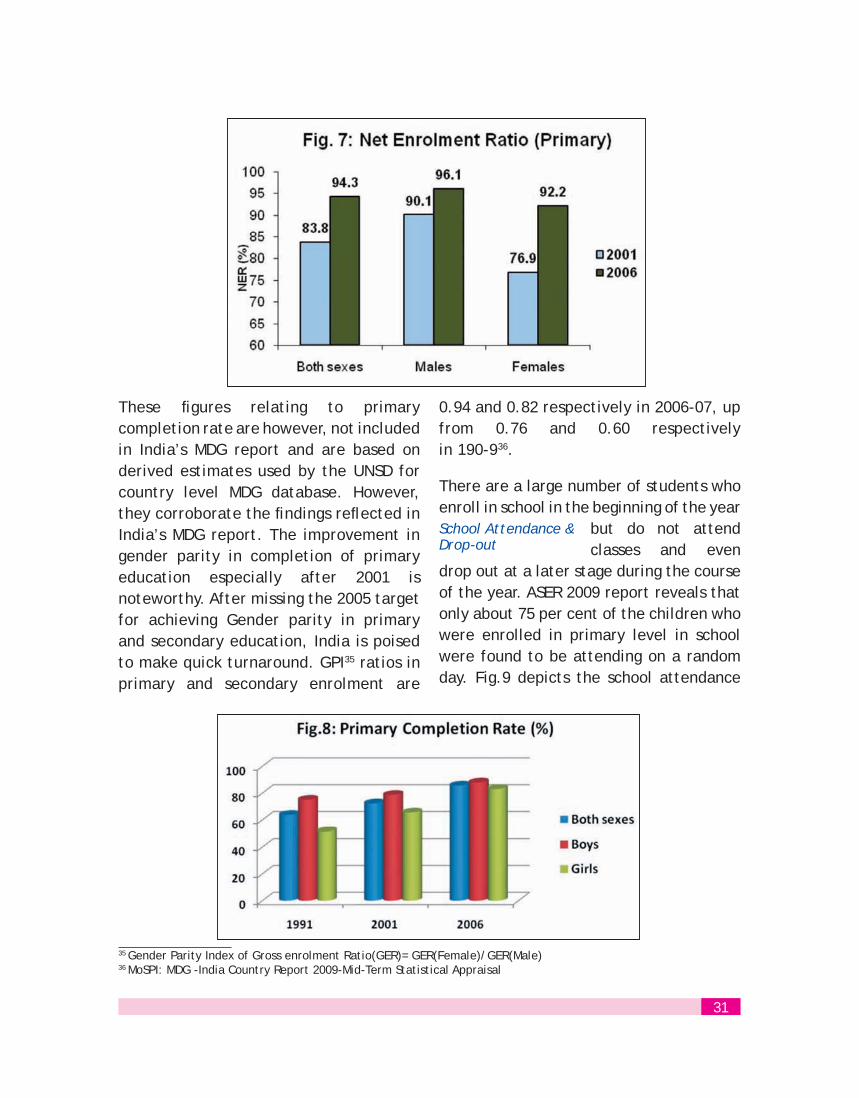
The sustainability of the NER at this level of attainment will however, largely depend on sustained improvement in survival rate29 in the primary stage upto Grade V, which has risen from 62% in 1999 to 72% in 2007-08. About 9.36% of children who got enrolled in Grade I to Grade V, dropped out of the system before completing the primary schooling during 2007-08 against 9.96% during the previous year30. Fig.7 (next page) gives the net enrolment ratio in primary education in 2001 and 200631. According to the recent independent study by the Ministry of Human Resource Development, in India an estimated 3.7 per cent of children in the age-group 6-10 and 5.2 per cent in the age-group 11-13 were out school in 200832.In terms of numbers about eight million children in India in the age-group 6-13 are out of school, about 6.7 million in rural and 1.3 million in urban aeas33
Enrolment of girls in primary school has been particularly good and seems to be catching up with that of boys. The primary completion rate also improved significantly as will be seen from Fig.834. For completion of primary education, the GPI took a leap from 0.69 in 1990-91 to 0.94 in 2006-07.
26 http://www.childinfo.org/education_challenge.html27 Proportion of pupils enrolled in primary grades (I-V) among total number of children in the age Group 6-11 years 28 Proportion of pupils of official school age of 6-11 years who are enrolled in primary grades I-V29 Proportion of pupils starting Grade I who reach Grade V30 MoSPI: MDG -India Country Report 2009-Mid-Term Statistical Appraisal31 http://unstats.un.org/unsd/mdg/32 Out of School = Never attended +Dropped Out. SSA covers children in the age-group 6-13, which equals to eight
years of schooling;, 6-10 for primary level and 10-13 years for middle level 33 The Annual Status of Education Report (ASER) 2009, estimates the not in school children at 4.0 per cent 34 http://unstats.un.org/unsd/mdg/
30
35 Gender Parity Index of Gross enrolment Ratio(GER)= GER(Female)/GER(Male)36 MoSPI: MDG -India Country Report 2009-Mid-Term Statistical Appraisal
These figures relating to primary completion rate are however, not included in India’s MDG report and are based on derived estimates used by the UNSD for country level MDG database. However, they corroborate the findings reflected in India’s MDG report. The improvement in gender parity in completion of primary education especially after 2001 is noteworthy. After missing the 2005 target for achieving Gender parity in primary and secondary education, India is poised to make quick turnaround. GPI35 ratios in primary and secondary enrolment are
0.94 and 0.82 respectively in 2006-07, up from 0.76 and 0.60 respectively in 190-936.
There are a large number of students who enroll in school in the beginning of the year
but do not attend classes and even
drop out at a later stage during the course of the year. ASER 2009 report reveals that only about 75 per cent of the children who were enrolled in primary level in school were found to be attending on a random day. Fig.9 depicts the school attendance
School Attendance & Drop-out
31
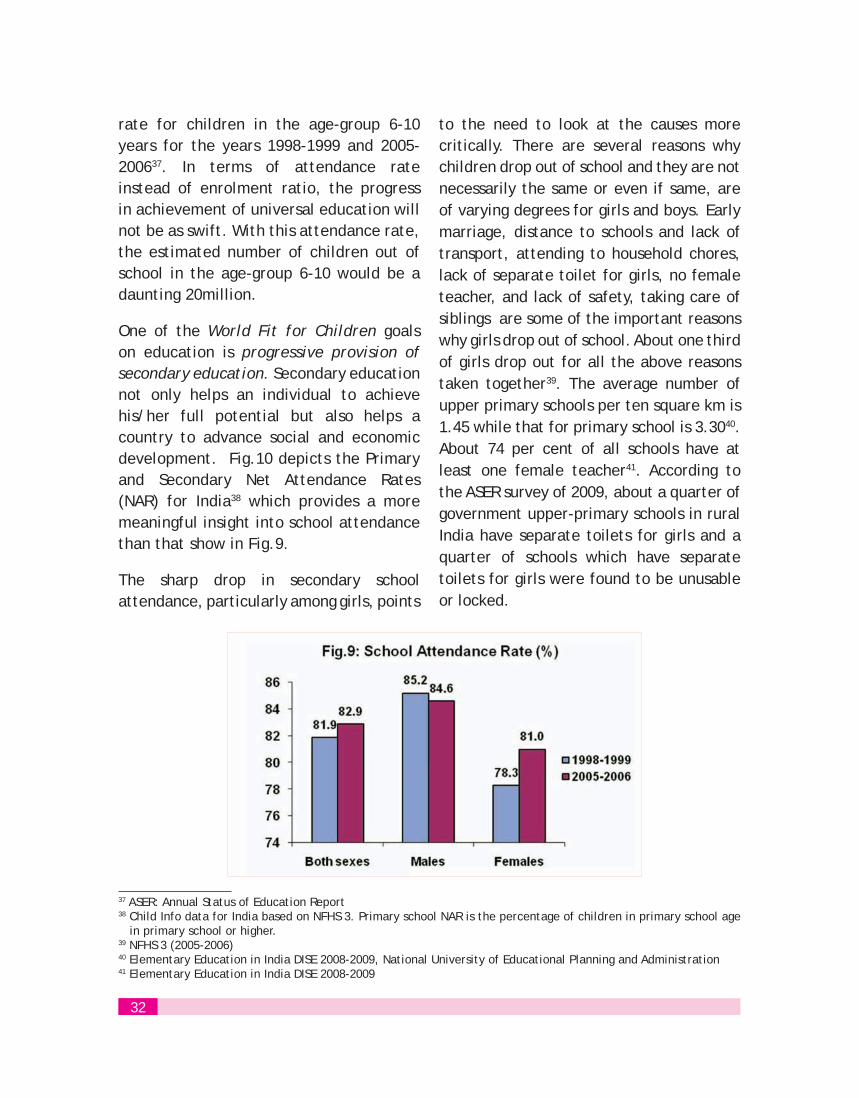
rate for children in the age-group 6-10 years for the years 1998-1999 and 2005-200637. In terms of attendance rate instead of enrolment ratio, the progress in achievement of universal education will not be as swift. With this attendance rate, the estimated number of children out of school in the age-group 6-10 would be a daunting 20million.
One of the World Fit for Children goals on education is progressive provision of secondary education. Secondary education not only helps an individual to achieve his/her full potential but also helps a country to advance social and economic development. Fig.10 depicts the Primary and Secondary Net Attendance Rates (NAR) for India38 which provides a more meaningful insight into school attendance than that show in Fig.9.
The sharp drop in secondary school attendance, particularly among girls, points
to the need to look at the causes more critically. There are several reasons why children drop out of school and they are not necessarily the same or even if same, are of varying degrees for girls and boys. Early marriage, distance to schools and lack of transport, attending to household chores, lack of separate toilet for girls, no female teacher, and lack of safety, taking care of siblings are some of the important reasons why girls drop out of school. About one third of girls drop out for all the above reasons taken together39. The average number of upper primary schools per ten square km is 1.45 while that for primary school is 3.3040.About 74 per cent of all schools have at least one female teacher41. According to the ASER survey of 2009, about a quarter of government upper-primary schools in rural India have separate toilets for girls and a quarter of schools which have separate toilets for girls were found to be unusable or locked.
37 ASER: Annual Status of Education Report38 Child Info data for India based on NFHS 3. Primary school NAR is the percentage of children in primary school age
in primary school or higher.39 NFHS 3 (2005-2006) 40 Elementary Education in India DISE 2008-2009, National University of Educational Planning and Administration 41 Elementary Education in India DISE 2008-2009
32

The World fit for Children (WFFC) goal: ‘Ensure that, by 2015, all children have access to and complete primary education that is free, compulsory and of good quality’ specifically addresses the issue of quality primary education. This is appropriate not only because India is reaching the goal of universal primary education but also because the learning achievements, when compared with expected notional levels for primary grade students, are quite unsatisfactory as is revealed by ASER 2009. It is seen that almost half of the students studying in Class five cannot read
and comprehend a Standard II text and more than 60 per cent cannot do a simple division.
The first five years of life are that of rapid and critical development in a child. ‘Early childhood care and education are the first among six “Education for All” goals the world is committed to achieving by 2015. In rural India, about 30 per cent of children of age three and 20 per cent of age four do not attend any pre-school. More than 50 per cent of children of age five are already in regular schools42.
42 ASER 2009. There is no administrative statistical system in the country that collects data on pre-school
Issues:
Specific cohort based estimates of primary completion rate, attendance rate, a)dropout rate, survival to grade V rate are not available from administrative statistics particularly at sub-national levels.
Information on quality of learning, skills at national and disaggregated sub-national b)levels is still not mainstreamed for determination of intervention strategies.
33
Child Protection
Most of the child protection parameters are not visible in national statistics. While systematic data and information on child protection issues are not readily available, the National Commission for the Protection of Child Rights (NCPCR) (established by the Commissions for Protection of Child Rights Act, 2005) is engaged in ensuring the safeguards for rights provided under this Act, investigate complaints, and have the powers of a civil court in trying cases. For establishing a well organised data system on protection issues, it is important to address several challenges related to infrastructure, capacity development (mass information and awareness, availability of teachers and training), functional redressal
mechanisms and effective monitoring system. Fundamental to protection is registration of births.
In India, the registration of births and deaths is compulsory under the Registration
of Births and Deaths (RBD) Act, 1969,
which came into force in1970. Being a signatory to the United Nations Convention on the Rights of the Child (UNCRC), India is committed to ensuring universal birth registration, which is also reflected in several national policies, such as, the National Population Policy, 2000 and the National Plan of Action for Children, 2005. In India, an estimated 27 million births take place every year. The current level of birth registration in the country is 69 per cent. Thus around 30 per cent (about 8 million)
Birth Registration
Challenges:
Existing education MIS is highly deficient in capturing required age-specific dynamic a)data from schools and other educational institutions. Data available through DISE system do not have acceptance for administrative purposes due to problem of coverage and validation.
There is a need to have more frequent nationwide Education Surveys at regular b)intervals covering major aspects of school education.
Rationalisation of data elements in administrative returns and survey schedules c)keeping in view the objectives and uses of the results in policy formulation and research.
Prospects:
The proposed institutional mechanism, i.e. Central Bureau of Education Statistics (CBES) aided by appropriate legal instruments and real time reporting system, is expected to facilitate production of frequent estimates on the basic education indicators for education MIS.
34
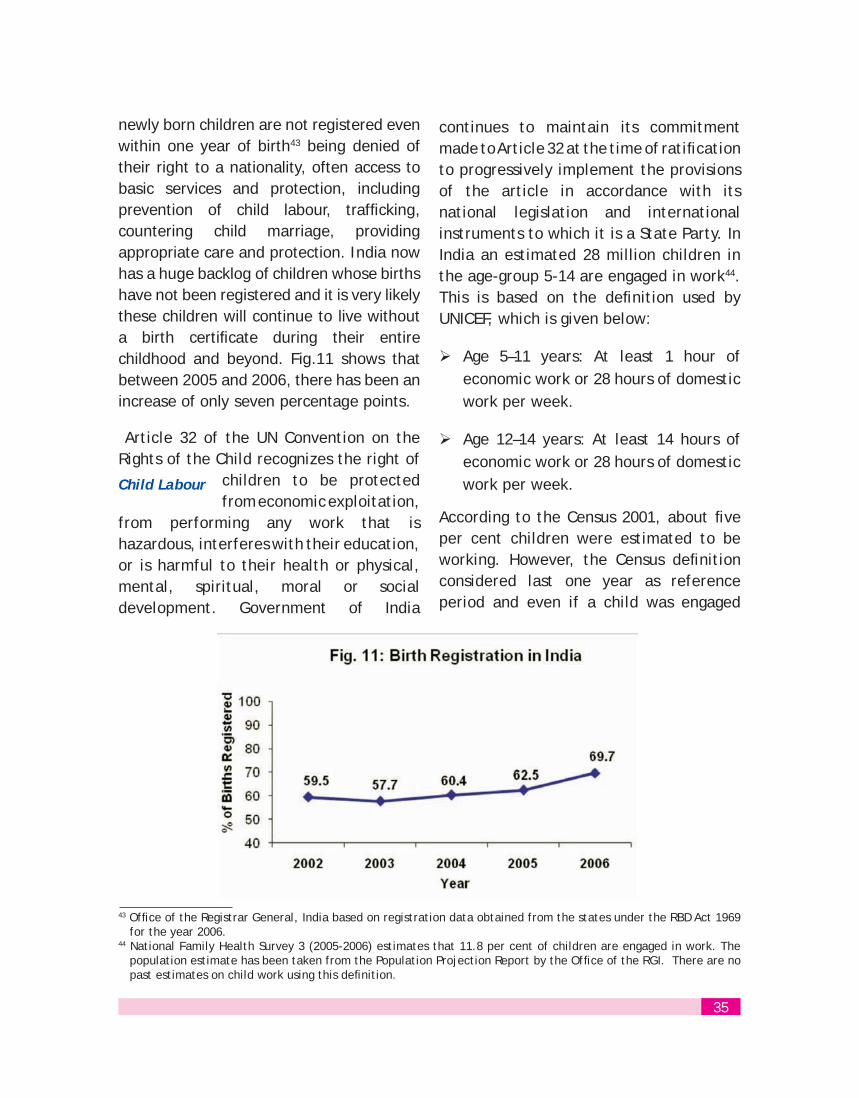
newly born children are not registered even within one year of birth43 being denied of their right to a nationality, often access to basic services and protection, including prevention of child labour, trafficking, countering child marriage, providing appropriate care and protection. India now has a huge backlog of children whose births have not been registered and it is very likely these children will continue to live without a birth certificate during their entire childhood and beyond. Fig.11 shows that between 2005 and 2006, there has been an increase of only seven percentage points.
Article 32 of the UN Convention on the Rights of the Child recognizes the right of
children to be protected from economic exploitation,
from performing any work that is hazardous, interferes with their education, or is harmful to their health or physical, mental, spiritual, moral or social development. Government of India
Child Labour
continues to maintain its commitment made to Article 32 at the time of ratification to progressively implement the provisions of the article in accordance with its national legislation and international instruments to which it is a State Party. In India an estimated 28 million children in the age-group 5-14 are engaged in work44.This is based on the definition used by UNICEF, which is given below:
Age 5–11 years: At least 1 hour of
economic work or 28 hours of domestic work per week.
Age 12–14 years: At least 14 hours of
economic work or 28 hours of domestic work per week.
According to the Census 2001, about five per cent children were estimated to be working. However, the Census definition considered last one year as reference period and even if a child was engaged
43 Office of the Registrar General, India based on registration data obtained from the states under the RBD Act 1969 for the year 2006.
44 National Family Health Survey 3 (2005-2006) estimates that 11.8 per cent of children are engaged in work. The population estimate has been taken from the Population Projection Report by the Office of the RGI. There are no past estimates on child work using this definition.
35
for one day of economic activity, which included work for family business and farm. This did not include any household chores.While there is no difference in work participation rates between boys and girls, the rate in rural area (13 per cent) is significantly higher than that in urban areas (9 per cent). The work participation rates increases with age and at all ages, girls are more likely to be involved in household chores or family work.
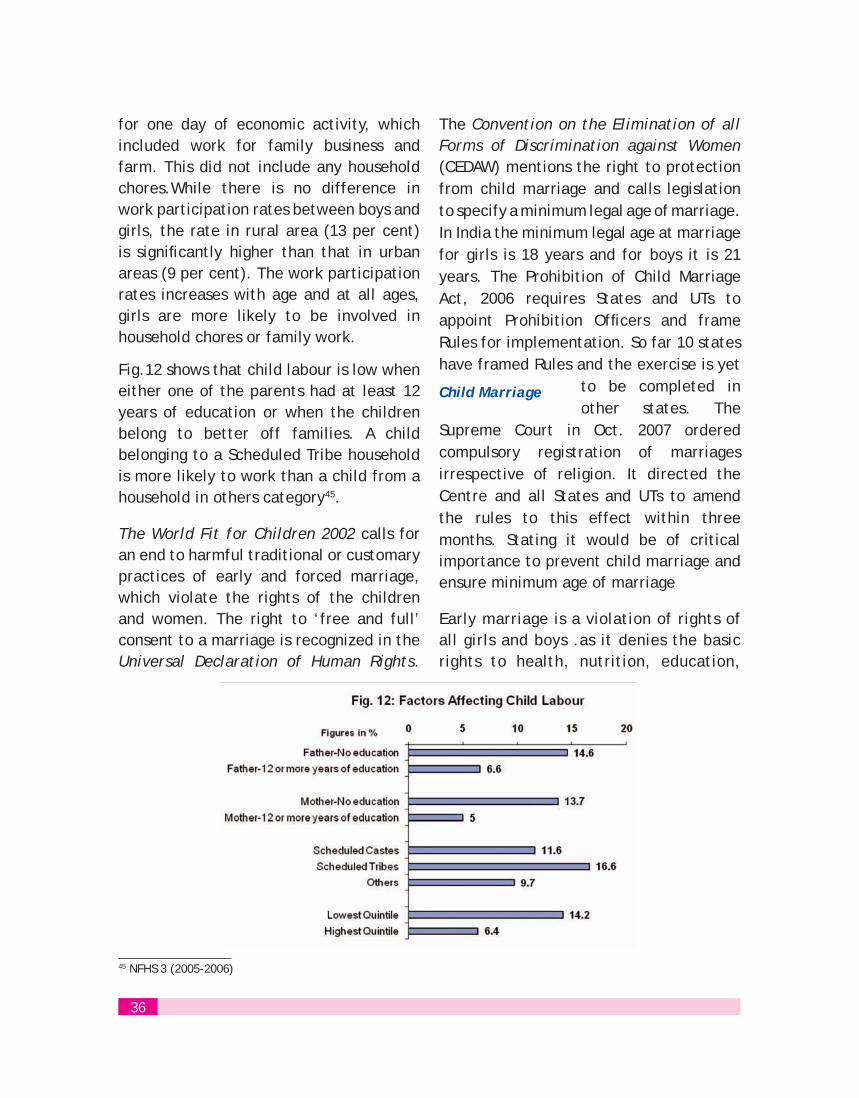
Fig.12 shows that child labour is low when either one of the parents had at least 12 years of education or when the children belong to better off families. A child belonging to a Scheduled Tribe household is more likely to work than a child from a household in others category45.
The World Fit for Children 2002 calls for an end to harmful traditional or customary practices of early and forced marriage, which violate the rights of the children and women. The right to ‘free and full’ consent to a marriage is recognized in the Universal Declaration of Human Rights.
The Convention on the Elimination of all Forms of Discrimination against Women(CEDAW) mentions the right to protection from child marriage and calls legislation to specify a minimum legal age of marriage. In India the minimum legal age at marriage for girls is 18 years and for boys it is 21 years. The Prohibition of Child Marriage Act, 2006 requires States and UTs to appoint Prohibition Officers and frame Rules for implementation. So far 10 states have framed Rules and the exercise is yet
to be completed in other states. The
Supreme Court in Oct. 2007 ordered compulsory registration of marriages irrespective of religion. It directed the Centre and all States and UTs to amend the rules to this effect within three months. Stating it would be of critical importance to prevent child marriage and ensure minimum age of marriage
Early marriage is a violation of rights of all girls and boys .as it denies the basic rights to health, nutrition, education,
Child Marriage
45 NFHS 3 (2005-2006)
36
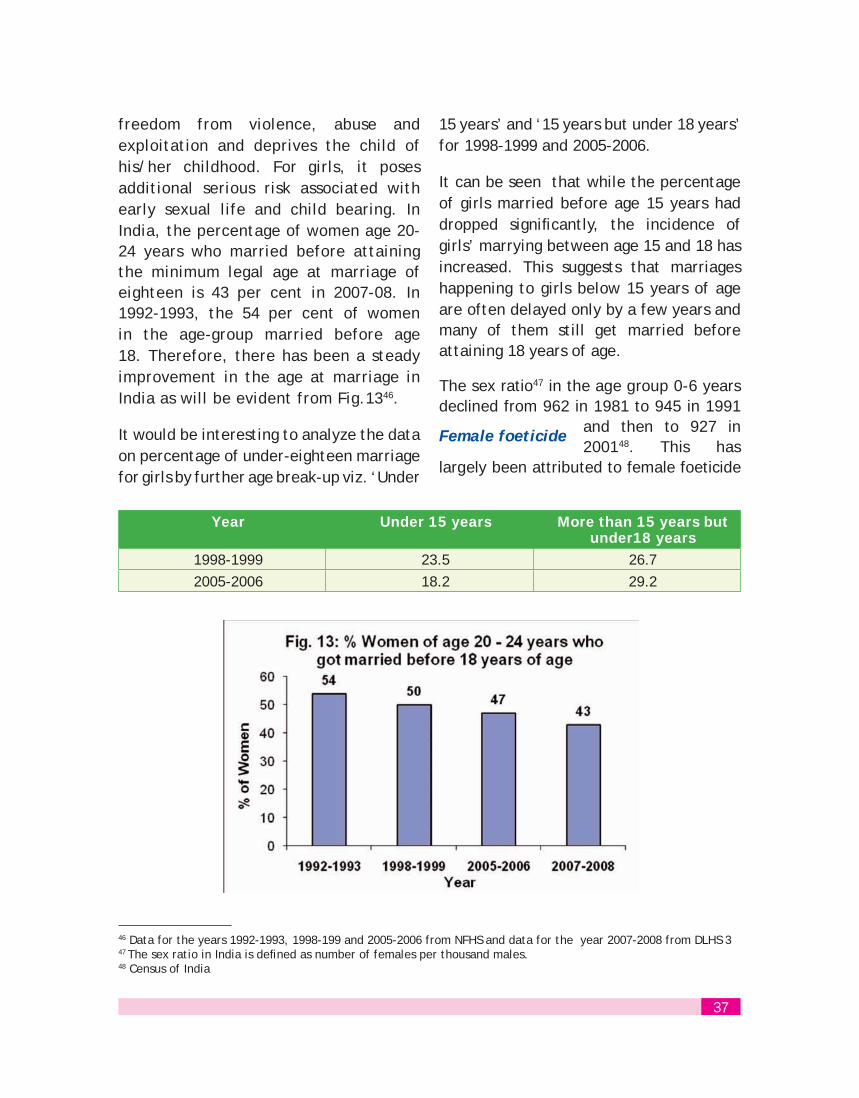
freedom from violence, abuse and exploitation and deprives the child of his/her childhood. For girls, it poses additional serious risk associated with early sexual life and child bearing. In India, the percentage of women age 20-24 years who married before attaining the minimum legal age at marriage of eighteen is 43 per cent in 2007-08. In 1992-1993, the 54 per cent of women in the age-group married before age 18. Therefore, there has been a steady improvement in the age at marriage in India as will be evident from Fig.1346.
It would be interesting to analyze the data on percentage of under-eighteen marriage for girls by further age break-up viz. ‘Under
15 years’ and ‘15 years but under 18 years’ for 1998-1999 and 2005-2006.
It can be seen that while the percentage of girls married before age 15 years had dropped significantly, the incidence of girls’ marrying between age 15 and 18 has increased. This suggests that marriages happening to girls below 15 years of age are often delayed only by a few years and many of them still get married before attaining 18 years of age.
The sex ratio47 in the age group 0-6 years declined from 962 in 1981 to 945 in 1991
and then to 927 in 200148. This has
largely been attributed to female foeticide
Female foeticide
46 Data for the years 1992-1993, 1998-199 and 2005-2006 from NFHS and data for the year 2007-2008 from DLHS 347 The sex ratio in India is defined as number of females per thousand males. 48 Census of India
Year Under 15 years More than 15 years but under18 years
1998-1999 23.5 26.72005-2006 18.2 29.2
37
in some parts of the country49. In India, 682 thousand female foetuses were destroyed between 2001 and 2005, which is 18 to 19 hundred every day50. The Government of India has set a goal of improving the child sex ratio to 935 by
2011-2012 and 950 by 2016-2017. In the country 328 districts have sex ratios below 950. The challenge is to monitor the sex ratio at birth at regular intervals, which is possible through a complete birth registration system.
Issues:
Registration of births and deaths is still not all pervasive. This is more of an a)administrative issue than a statistical one.
There is hardly any data available on juvenile victims or offenders, orphan and b)destitute children (including street children), child abuse, children in difficult circumstances etc.
Challenges:
Developing appropriate survey techniques for studying the incidences of violation a)of child rights and their availability of redressal measures.
Information related to child protection indicators are mostly beyond the scope of b)official statistical system.
Prospects:
NSO led concurrent monitoring of child related indicators are likely to cover up some of the major data gaps, particularly in the areas of child protection.
New Initiatives in Child Statistics
Public-Private Partnership
The magnitude and intensity of the development problems certainly call for a separate focus on issues relating to statistics on children; especially to meet the requirement of concurrent monitoring. One of the ways is to establish an institutional mechanism to coordinate efforts in improving
statistics on children in the country - a Forum with exclusive focus on statistics on children. Recognizing that there are several organizations and institutions within and outside the government who are engaged in collection, collation and dissemination of data on children and also recognizing the fact that it is neither possible nor desirable for the government to engage in data collection on all aspects of children, the Forum can serve as a larger alliance beyond government
49 The ratio at age group 0-6 is not only because of female foeticide abortion affecting the sex ratio at birth but also due to neglect of girl child leading to higher death mortality rates among girls. Therefore, sex ratio at birth is the crucial indicator that needs to be tracked.
50 ESTIMATION OF MISSING GIRLS AT BIRTH AND JUVENILE AGES IN INDIA by P.M. Kulkarni Professor, Centre for the Study of Regional Development School of Social Sciences, Jawaharlal Nehru University for UNFPA India
38
departments to include all major stakeholders including organizations and institutions from outside the government and the international agencies. Keeping this in view, the 15th
Conference of Central and State Statistical Organizations (COCSSO) held in Gandhinagar on 7-8 February 2008 therefore, resolved
“To establish a Forum on Child Statistics represented by various concerned stakeholders, including international agencies and NGOs to foster coordination and collaboration, and to improve the scope, content, quality, consistency and reporting of data on children keeping National Plan of Action for Children 2005 as the basis.”
NSO led efforts in collaboration with MoWCD, MoHRD, UNICEF and a few non-government organizations to set up India Forum on Child Statistics (INFOCS) as a society of
institutional members are going to be a reality in institutionalizing coordination and collaboration amongst the stakeholders for improving the scope, content, quality, consistency and timely reporting of data on children to enable informed policy decisions and planning.
MOSPI has decided to undertake a Survey on Measuring of Outcomes for Children starting 2010. The survey which has been approved by the Planning Commission in principle will be large scale longitudinal survey not only aimed at providing much more regular data on outcome level for key indicators on women and children but also help understand better the changes over time on various behavioral aspects of child care and development. UNICEF will support the project until the end of the 11th five year plan after which the Ministry plans to take it up as a regular scheme.
39
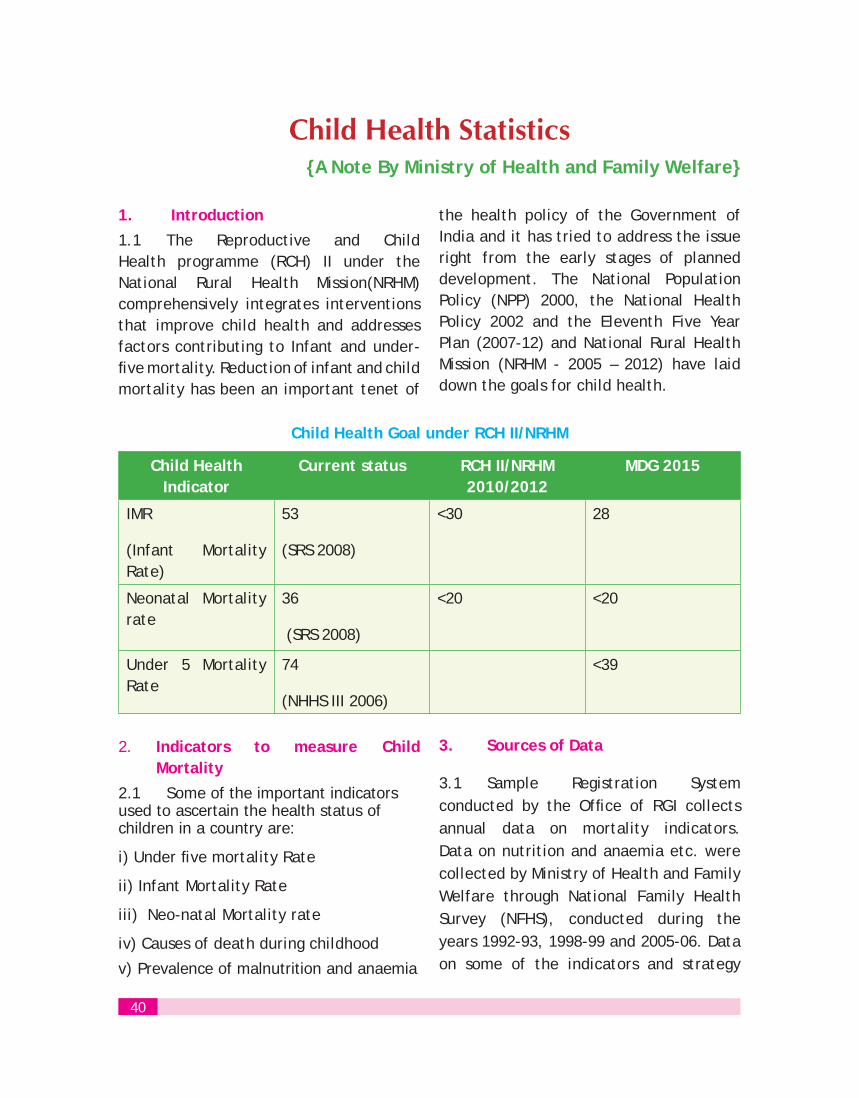
1. Introduction
1.1 The Reproductive and Child Health programme (RCH) II under the National Rural Health Mission(NRHM) comprehensively integrates interventions that improve child health and addresses factors contributing to Infant and under-five mortality. Reduction of infant and child mortality has been an important tenet of
Child Health Statistics{A Note By Ministry of Health and Family Welfare}
the health policy of the Government of India and it has tried to address the issue right from the early stages of planned development. The National Population Policy (NPP) 2000, the National Health Policy 2002 and the Eleventh Five Year Plan (2007-12) and National Rural Health Mission (NRHM - 2005 – 2012) have laid down the goals for child health.
Child Health Goal under RCH II/NRHM
Child Health Indicator
Current status RCH II/NRHM 2010/2012
MDG 2015
IMR
(Infant Mortality Rate)
53
(SRS 2008)
<30 28
Neonatal Mortality rate
36
(SRS 2008)
<20 <20
Under 5 Mortality Rate
74
(NHHS III 2006)
<39
2. Indicators to measure Child Mortality
2.1 Some of the important indicators used to ascertain the health status of children in a country are:
i) Under five mortality Rate
ii) Infant Mortality Rate
iii) Neo-natal Mortality rate
iv) Causes of death during childhood
v) Prevalence of malnutrition and anaemia
3. Sources of Data
3.1 Sample Registration System conducted by the Office of RGI collects annual data on mortality indicators. Data on nutrition and anaemia etc. were collected by Ministry of Health and Family Welfare through National Family Health Survey (NFHS), conducted during the years 1992-93, 1998-99 and 2005-06. Data on some of the indicators and strategy
40
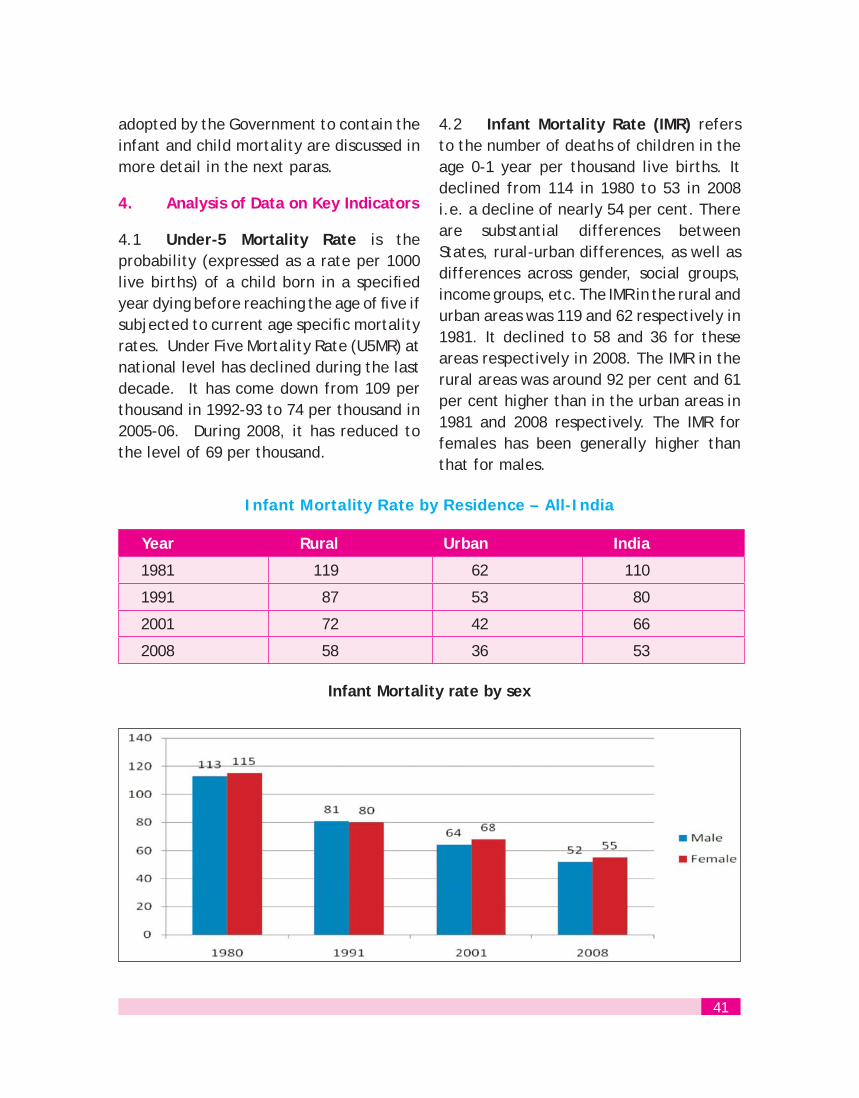
adopted by the Government to contain theinfant and child mortality are discussed in more detail in the next paras.
4. Analysis of Data on Key Indicators
4.1 Under-5 Mortality Rate is the probability (expressed as a rate per 1000 live births) of a child born in a specified year dying before reaching the age of five if subjected to current age specific mortality rates. Under Five Mortality Rate (U5MR) at national level has declined during the last decade. It has come down from 109 per thousand in 1992-93 to 74 per thousand in 2005-06. During 2008, it has reduced to the level of 69 per thousand.
4.2 Infant Mortality Rate (IMR) refersto the number of deaths of children in the age 0-1 year per thousand live births. It declined from 114 in 1980 to 53 in 2008 i.e. a decline of nearly 54 per cent. There are substantial differences between States, rural-urban differences, as well as differences across gender, social groups, income groups, etc. The IMR in the rural and urban areas was 119 and 62 respectively in 1981. It declined to 58 and 36 for these areas respectively in 2008. The IMR in the rural areas was around 92 per cent and 61 per cent higher than in the urban areas in 1981 and 2008 respectively. The IMR for females has been generally higher than that for males.
Infant Mortality Rate by Residence – All-India
Year Rural Urban India
1981 119 62 110
1991 87 53 80
2001 72 42 66
2008 58 36 53
Infant Mortality rate by sex
41
4.3 The inter-state differences have widened, if one looks at it in terms of ratio of States with highest IMR to that with the lowest IMR. In 1971, the IMR in UP and Kerala was 167 and 58 respectively, giving a factor of 3:1. In 2008, the IMR in Madhya Pradesh and Kerala was 70 and 12 respectively, the IMR in Madhya Pradesh, being 6 times higher than that in Kerala. Even in the year 2008, the IMR in as many as eight States (Madhya Pradesh, Orissa, Uttar Pradesh, Assam, Rajasthan, Chhattisgarh, Meghalaya and Bihar) was either higher or marginally lower than what it was in Kerala in 1971. Further, about 38% per cent of all infant deaths in India are concentrated in two states of Uttar Pradesh and Bihar. About 60 per cent of all infant deaths in India are concentrated in five states (Bihar, Madhya Pradesh, Rajasthan Uttar Pradesh and Orissa). Regional disparities remain a concern, with the IMR varying greatly between states ranging from 70 in Madhya Pradesh to 10 in Goa.
4.4 The Neo-Natal Mortality Rate is the number of children dying within 28 days of birth per 1000 live births and early neo-natal mortality rate relates to those who die within a week of birth. In 2008, the ‘neo-natal’ and ‘early neo-natal mortality’ rate was 35 and 27 respectively.
4.5 Of the 8.8 million under-five deaths that occur globally, 1.83 million
occur in India alone. Approximately 27 million children are born every year in India out of which about 1.4 million children die before one year of age and approx 0.92 million newborns die within one month of age. 51 percent of under-five deaths continue to occur in the first month of life and 77% of neonatal deaths occur in first week of life.
4.6 The factors like rural/urban residence, mother’s literacy, caste, etc are associated with IMR. According to National Family Health Survey (NFHS) – III conducted in 2005-06, the IMR was around 70 per 1000 live births in case of mothers with no education as compared to 26 for mothers having completed more than 12 years of education. The IMR in case of SCs, STs, OBCs and Others was 66.4, 62.1, 56.6 and 48.9 respectively. The demographic characteristics associated with differences in infant mortality include birth order (highest mortality for birth orders 1 and above 6), mother’s age at child birth (higher infant and child mortality for mother’s age at child birth of 15-20 years and at around 35 years), interval between births, etc. Other factors that particularly help in reducing the neo-natal mortality include antenatal care visits made by the mother during pregnancy, in particular the tetanus immunization of pregnant mothers, delivery of children at medical facility, etc.
42
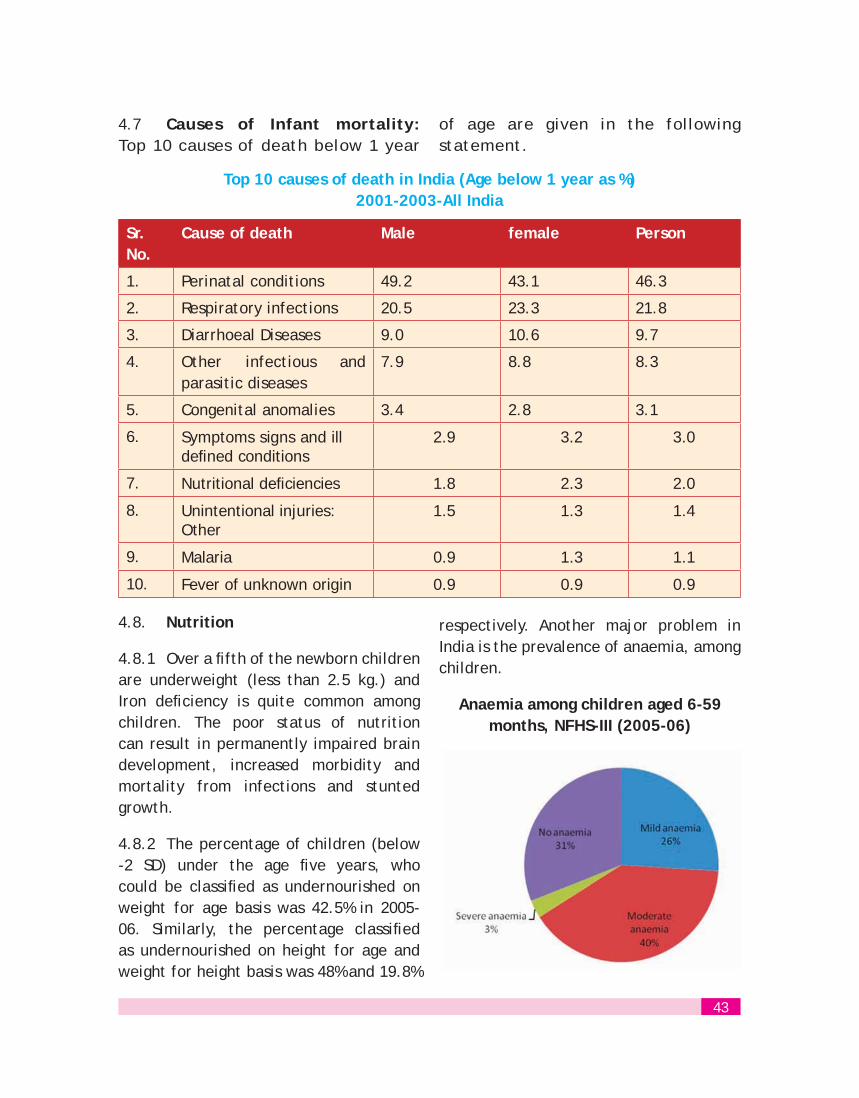
4.7 Causes of Infant mortality:Top 10 causes of death below 1 year
of age are given in the following statement.
Top 10 causes of death in India (Age below 1 year as %)2001-2003-All India
Sr. No.
Cause of death Male female Person
1. Perinatal conditions 49.2 43.1 46.3
2. Respiratory infections 20.5 23.3 21.8
3. Diarrhoeal Diseases 9.0 10.6 9.7
4. Other infectious and parasitic diseases
7.9 8.8 8.3
5. Congenital anomalies 3.4 2.8 3.1
6. Symptoms signs and ill defined conditions
2.9 3.2 3.0
7. Nutritional deficiencies 1.8 2.3 2.0
8. Unintentional injuries: Other
1.5 1.3 1.4
9. Malaria 0.9 1.3 1.1
10. Fever of unknown origin 0.9 0.9 0.9
4.8. Nutrition
4.8.1 Over a fifth of the newborn children are underweight (less than 2.5 kg.) and Iron deficiency is quite common among children. The poor status of nutrition can result in permanently impaired brain development, increased morbidity and mortality from infections and stunted growth.
4.8.2 The percentage of children (below -2 SD) under the age five years, who could be classified as undernourished on weight for age basis was 42.5% in 2005-06. Similarly, the percentage classified as undernourished on height for age and weight for height basis was 48% and 19.8%
respectively. Another major problem in India is the prevalence of anaemia, among children.
Anaemia among children aged 6-59 months, NFHS-III (2005-06)
43
4.8.3 Sixty-nine per cent of the children
in the age group 6-59 months suffered from anaemia. The factors that affected the anthropometric indices among children included birth interval, birth order, size at the time of birth, place of residence (greater level of undernourishment among rural than urban children), level of mother’s education (mothers with higher levels of education having much lower proportion of under-nourished children vis-à-vis mothers with no or little education levels), mother’s own nutritional status and wealth index (prevalence of undernourishment varying inversely with the wealth index).
4.8.4 The proportion of under-weight children was in the range of 25-35% in some of the Northern states viz. Delhi, Haryana, J&K and Punjab, most of the North Eastern states as well as in Kerala and Goa. On the other hand it was around 50% or higher in Bihar, Jharkhand and Madhya Pradesh.
5. Strategy Adopted by the Government to reduce Infant and Child Mortality
5.1 The strategy for child health care aims to reduce under-five child mortality through interventions at every level of service delivery and through improved child care practices and child nutrition. One major component of the strategy is training to the Anganwadi workers and ANMs for early diagnosis and referral to facilities. At the facility level, the focus is on strengthening capacity to cope with essential newborn care in newborn corners in every facility and promptly treat or refer sick newborns and sick children to more
specialized newborn stabilization units or special newborn care units at the district hospital.
5.2 Infant and young child feeding programme has been undertaken to improve child nutritional status and promote exclusive breastfeeding. School health programmes have been launched nation-wide and is currently being implemented in 33 states/UTs.
5.3 Another aspect of the strategy is in scaling up the universal access to immunization with particular focus on eradicating polio. More effort at micro-planning, more mobilization of beneficiaries by ASHAs, improved cold chain management, Vitamin A administration, pediatric anemia management and periodic de-worming are also a part of this programme.
5.4 The initiative taken by the government to reduce infant and child mortality include launching of Navjaat Shishu Suraksha Karyakram (Basic newborn care and Resuscitation) in September 2009, Infant and young child feeding, Vitamin A and Iron and Folic Acid supplementation, early detection and appropriate management of Acute Respiratory Infections, Diarrhea and other infections, Integrated management of neonatal and childhood Illnesses (IMNCI), Facility Based Integrated management of neonatal and childhood Illnesses(F-IMNCI), Home Based Care of Newborns and Management of children with malnutrition. Some of the recent initiatives are:
44
i) Expanding training of ASHAs for home-based newborn and child care and develop a policy framework for constituting community-based women empowerment groups under the leadership of the women Panchayat members but also consisting of other women networks that may be existing in the village. The aim of such a strategic direction would be to one day ensure that the female functionaries–ASHA, Angan Wadi Worker, ANM—become accountable to and work with these groups to help them realize their well-being and rights;
ii) Strengthen all primary and secondary health care facilities providing institutional
delivery with capacity for new born care through stricter supervision and monitoring;
iii) More closely monitor the immunization program by listing the mothers and the children for tracking their care;
iv) Include in the immunization programme protocol the second dose for measles and a catch-up campaign for measles so as to reduce the incidence of mortality on account of this disease, which is estimated to be almost 4 per cent, and;
v) To tighten overall supervision, particularly in the 235 laggard districts.
45
SCHEMES FOR DEVELOPMENT AND PROTECTION OF CHILDREN
{ Paper contributed by Ministry of Women and Child Development}
The important schemes for welfare, development and protection of children of the Ministry of Women and Child Development are Integrated Child Development Services (ICDS) Scheme, and Integrated Child Protection Scheme (ICPS).
Integrated Child Development Services (ICDS) Scheme
The Integrated Child Development Services (ICDS) Scheme is one of the flag-ship programmes of the Government of India. It represents one of the world’s largest and most unique programme for Early Childhood Care and Education. The beneficiaries under the Scheme are children in the age group of 0-6 years and pregnant and lactating mothers. The scheme seeks:
To imi. prove the nutritional and health status of children in the age group 0-6 years;
To lay the foundation for proper ii. psychological, physical and social development of the child;
To reduce the incidence of mortality, iii. morbidity, malnutrition and school dropout;
To achieve effective co-ordination of iv. policy and implementation amongst the various departments to promote child development; and
To enhance the capability of the mother v. to look after the normal health and nutritional needs of the child through proper nutrition and health education.
The Scheme offers a package of 6 services
sui. pplementary nutrition,
pre-school non-formal education,ii.
nutrition & health education,iii.
immunization,iv.
health check-up andv.
referravi. l services
out of which the last three are related to health and are provided by Ministry of Health and Family Welfare through NRHM & Health system.
46
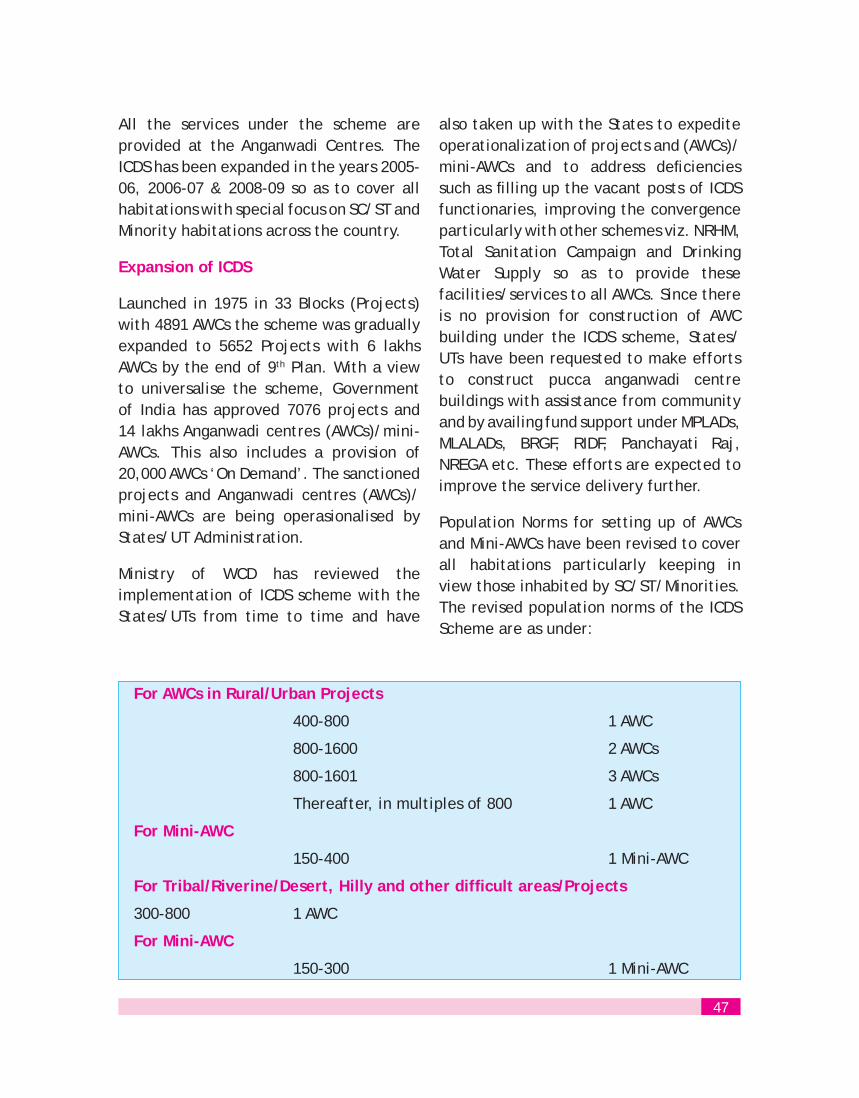
All the services under the scheme are provided at the Anganwadi Centres. The ICDS has been expanded in the years 2005-06, 2006-07 & 2008-09 so as to cover all habitations with special focus on SC/ST and Minority habitations across the country.
Expansion of ICDS
Launched in 1975 in 33 Blocks (Projects) with 4891 AWCs the scheme was gradually expanded to 5652 Projects with 6 lakhs AWCs by the end of 9th Plan. With a view to universalise the scheme, Government of India has approved 7076 projects and 14 lakhs Anganwadi centres (AWCs)/mini-AWCs. This also includes a provision of 20,000 AWCs ‘On Demand’. The sanctioned projects and Anganwadi centres (AWCs)/mini-AWCs are being operasionalised by States/UT Administration.
Ministry of WCD has reviewed the implementation of ICDS scheme with the States/UTs from time to time and have
also taken up with the States to expedite operationalization of projects and (AWCs)/mini-AWCs and to address deficiencies such as filling up the vacant posts of ICDS functionaries, improving the convergence particularly with other schemes viz. NRHM, Total Sanitation Campaign and Drinking Water Supply so as to provide these facilities/services to all AWCs. Since there is no provision for construction of AWC building under the ICDS scheme, States/UTs have been requested to make efforts to construct pucca anganwadi centre buildings with assistance from community and by availing fund support under MPLADs, MLALADs, BRGF, RIDF, Panchayati Raj, NREGA etc. These efforts are expected to improve the service delivery further.
Population Norms for setting up of AWCs and Mini-AWCs have been revised to cover all habitations particularly keeping in view those inhabited by SC/ST/Minorities. The revised population norms of the ICDS Scheme are as under:
For AWCs in Rural/Urban Projects
400-800 1 AWC
800-1600 2 AWCs
800-1601 3 AWCs
Thereafter, in multiples of 800 1 AWC
For Mini-AWC
150-400 1 Mini-AWC
For Tribal/Riverine/Desert, Hilly and other difficult areas/Projects
300-800 1 AWC
For Mini-AWC
150-300 1 Mini-AWC
47
Under ICDS, the effort is to provide daily nutritional supplements to bridge the gap between the Recommended Dietary Allowance (RDA) and the Average Daily Intake (ADI). Under the revised Nutritional and Feeding Norms for Supplementary Nutrition, State Governments/UTs have been mandated to provide more than one meal to the children who come to AWCs which include providing a morning snack in the form of milk/ banana/egg/ seasonal fruits/ micro-nutrient fortified food followed by a Hot cooked Meal. For children below 3 years of age and pregnant and lactating women, age appropriate Take Home Ration (THR) is to be provided. Besides, for severely underweight children in the age group of 6 months to 6 years, States/UTs have been mandated to give additional food items in the form of micro-nutrient fortified food and/or energy dense food as THR. These norms have also been endorsed by the Apex court in their order dated 22nd April 2009.
All 0-6 years children and Pregnant & Lactating mothers are eligible for availing of the services under ICDS. BPL is not acriteria for registration of beneficiaries under ICDS. The Scheme is universal in coverage for these categories.
Coverage under the ICDS Scheme
As on 31.12.2009, number of children (6 months to 6 years) and pregnant & lactating mothers who received supplementary nutrition were respectively 718.45 lakhs & 156.86 lakhs, a total of 875.31 lakhs. Also, number of children (3-6 years) who received pre-school education as on
31.12.2009 was 335.72 lakhs. State/UT wise-data is also available.
Integrated Child Protection Scheme (ICPS)
An examination of child protection schemes conducted in 2006, by the new Ministry of Women and Child Development, revealed major shortcomings and gaps in the existing child protection institutions, policies, programmes and in implementation at all levels. In response to these issues, the Integrated Child Protection scheme (ICPS, Feb 2009) was formulated by the Ministry, which is currently being implemented. This includes merging of the components of three erstwhile schemes namely i) A Programme for Juvenile Justice (ii) An Integrated Programme for Street Children and (iii) Scheme for Assistance to Homes [Shishu Greh], to promote In-country Adoption and also new interventions to cover gaps in these.
Objectives of ICPS
The objectives of the scheme are improvement in the well being of children in difficult circumstances, as well as to the reduction of vulnerabilities to situations and actions that lead to abuse, neglect, exploitation, abandonment and separation of children from their families. These will be achieved by; i) improved access to and quality of child protection services; (ii) raised public awareness about the reality of child rights, situation and protection in India; (iii) clearly articulated responsibilities and enforced accountability for child protection (iv) established and functioning structures
48

at all government levels for delivery of statutory and support services to children in difficult circumstances; (v) introduced and operational evidence based monitoring and evaluation.
Target Group under ICPS are:
Children in need of care and protection • (as listed in the Juvenile Justice (Care and Protection Act) 2000
Child in conflict with law; who is alleged • to have committed an offence
Child in contact with law; who has come • into contact with the law as a victim, witness or any other circumstance
Any other vulnerable Child (including • but not limited to) – e.g. children of migrant families, Children living on the streets, SCs /STs, Child beggars, exploited/trafficked/ drug-affected children, Children of prisoners, children of women in prostitution and Children affected/infected with HIV/AIDS
The services that are strengthened/introduced and provided finances for, under ICPS are:
Institutional Services: Shelter Homes; • Children’s Homes; Observation Homes; Special Homes; and Specialized services for children with special needs (disabled & children affected by HIV/AIDS)
Service delivery structures for the • above services at Central, State and District levels
Emergency outreach services for • children in difficult circumstances through Childline
Open shelters for children in need in • urban and semi-urban areas
Family based non institutional care • through: Sponsorship; Foster Care; Adoption; and After Care Programme
General grant-in-aid for need based/ • innovative interventions
Child Tracking System including a • website for missing children
Advocacy, public education and • communication
Training and capacity building•
Cost sharing ration under ICPS
The Scheme is being implemented through the State Governments/ Union Territory Administrations and the expenditure sharing ratio between the Centre and the States/NGOs is as below:
90:10 for all the scheme components, • for the States of the North East and Jammu & Kashmir
90:10 for all the scheme components • with NGO participation
100% funding by the Centre to the • Childline services
100% funding by the Centre to all • service delivery structural mechanisms such as NIPCCD & its Regional Centres, Central Adoption Resource Agency,
49
Central Project Support Unit, and State Project Support Unit
35:65 for the States other than the • North East and Jammu & Kashmir, for the statutory bodies provided under the Juvenile Justice Act, i.e., Juvenile Justice Boards and Child Welfare Committees
75:25 for other structural components • in the States other than the North East and Jammu & Kashmir.
Implementation Status
Twenty States have signed MOUs for implementation of this scheme covering four hundred and thirteen districts upto April 2010. These include, Andhra Pradesh, Orissa, Chhattisgarh, Madhya Pradesh, Nagaland, Manipur, Assam, Kerala, West Bengal, Rajasthan, Tripura, Tamil Nadu, Goa, Gujarat, Delhi, Haryana, Karnataka, Bihar, Mizoram and Sikkim.
50


Address by Shri Sriprakash Jaiswal, Hon’ble Minister of State (Independent Charge) for Statistics and Programme Implementation and Ministry of Coal
at the17th Conference of Central and State Statistical
OrganizationsFebruary 8, 2010
Thiruvananthapuram, Kerala
Prof. Radhakrishna, Chairman, National Statistical Commission; Dr. Pronab Sen, Secretary, Ministry of Statistics & Programme Implementation; Smt. Neela Gangadharan, Chief Secretary, Government of Kerala; Shri S.K. Das, Director General, CSO; Shri Teeka Ram Meena, Secretary, Planning & Economic Affairs, Government of Kerala; Members of National Statistical Commission; Senior Officers of Central and State Governments; Members of Media; Ladies and Gentlemen.
It gives me immense pleasure to be amongst all of you today in this beautiful city of Thiruvananthapuram, which is the capital city of Kerala, fondly referred to as “God’s Own Country”. I am happy to be associated with this 17th Conference of the Central and State Statistical Organisations, a forum set up to strengthen the coordination of statistical activities between the Central Statistical Office and Central Ministries on the one hand, and between the Central Statistical Office and State Directorates of Economics and Statistics on the other.
I am told that the Conference provides an important platform to Statisticians of the Centre and States to discuss statistical issues of common interest, and provide an overall perspective to the development of statistical system in the country. I am sure that the participants in this 17th Conference would take advantage of this platform with the common objective of making available timely, reliable and credible data to planners and policy makers in the Government. With the gradual opening of the economy, rapid liberalization of domestic economic activities and the resulting acceleration in the rate of economic growth, it is important that the Official Statisticians in the country gear themselves, and make available new data sets in a time bound manner, required for planning purposes.
I understand that the main sources of statistics in India and elsewhere are administrative statistics which are generally collected by State Governments as a part of administrative activities. This
53

data consists of statutory administrative returns, and data derived as a by-product of general administration. Administrative statistics are very much needed for effective planning of censuses and sample surveys. The state of the Indian Statistical System thus depends largely on the state of functioning of the Administrative Statistical System. I am told that today, the statistics generated as a part of the administrative activity, is far from satisfactory. The data collected through the administrative statistical system today suffers from incomplete coverage; delays in availability of information, and; un-satisfactory quality. Lack of effective coordination between different statistical agencies is another reason for poor quality of data collected as a part of administrative activity.
I am happy to note that to remedy the situation; my Ministry has taken up the task of strengthening the statistical system in the States and Union Territories. I congratulate Dr. Pronab Sen and his team for this long awaited initiative. It is important that unless the State Statistical Machinery is strengthened, our mandate of providing timely and reliable statistics to Planners for objective planning cannot be fulfilled. I am sure that all the States and UTs will take full advantage of the Centrally Sponsored Scheme, called India Statistical Strengthening Project, briefly ISSP, launched by my Ministry to augment their infrastructure and also to build the capacity of statistical personnel in the States. In the process, the statistics generated as a bi-product of administrative activity would also be taken up for improvements.
I would, however, like to add here that while implementing the scheme; it should be ensured that the State Strategic Plans have a component of sustainability on their own through their resources. While the Central Government, with the assistance of the international agency, which is supporting the strengthening of State Statistical System, can provide support initially, this cannot continue indefinitely. I hope that while reviewing the progress of implementation of ISSP in this Conference, the issue of “sustenance” shall also be discussed and finally included in the State Plans.
The topic of Consumer Price Indices by States, which has been slotted for this two day conference, is also very relevant, crucial and timely. Changes in the prices of goods and services affect the different segments of the population differently. Thus, measuring prices and their rate of change over time has been crucial to almost every economic issue from the conduct of monetary policy to measuring inter-temporal and inter-regional economic issues. At a time, when rise in the prices of commodities, particularly food items has been a matter of concern to the Government, it is important that price variations are correctly reflected in the price indices we produce. It is not only important for Planners and Policy makers for taking appropriate corrective measures, but also important for Statisticians in order to maintain the trust of people at large in the statistics, which government produces. I understand that Dr. Rangarajan Commission had also felt the need for bringing uniformity in
54
methodology in the computation of price indices, compiled by States and UTs, so that meaningful analysis of regional price variation can be made. I hope that the Conference would bring out solid recommendations on this issue so that Central Statistical Office under my Ministry could take further action in a time bound manner in consultation with the Technical Advisory Committee on prices, working in the Ministry.
Before I close, I would like to briefly touch on an important issue, that is, timeliness in processing of data and dissemination of statistics. Making available timely statistics is very crucial otherwise its utility is eroded, and thus the credibility of Government Statisticians. At a time, when Government has spent millions of rupees in introduction of information technology in Government, it should be used fully to our advantage for reducing the time lag in dissemination of statistics.
I would also like to mention about retaining the credibility of official statistics in the eyes of Users. The Statistical Agencies need to adopt standards and protocols strictly according to professional considerations, including scientific principles and professional ethics. Methods and procedures for collection, processing, storage and presentation should be based upon only the professional considerations. The Statistical Agencies must be extremely rigorous with respect to the standards that data collection must meet the methods of processing data, and the derivation of the results. In addition, they must instill in their staff an ethos of quality on a par with such high standards. It is important so that the trust of public in statistics is not eroded.
With these words, I formally inaugurate the 17th Conference of Central and State Statistical Organizations, and wish you all success in your deliberations.
Thank you.
55
Inaugural Address on the Statistics Day 2009 byProf. Suresh D. Tendulkar, Chairman, Economic
Advisory Council to the Prime MinisterJune 29, 2009
New Delhi
Shri Sriprakash Jaiswal ji, Minister of State (Independent Charge) for Statistics & Programme Implementation; Dr. Pronab Sen, Chief Statistician of India; Prof. Atanu Biswas, C. R. Rao Awardee for the year 2008-09; DG, CSO; DG, NSSO; Members of National Statistical Commission; Senior Officers from various Ministries and Departments of Government; Ladies and Gentlemen.
2. It is a matter of great pleasure for me to be here today on the occasion of 3rd
Statistics Day, being organised by Ministry of Statistics & Programme Implementation. India is one of the few countries of the world, which celebrates Statistics Day, even though this has been strongly recommended by the United Nations in view of growing importance of Statistics in diverse fields. It is being organized annually on the birth anniversary of the late Prof. P.C. Mahalanobis. The Professor, as he was known at the Indian Statistical Institute which he founded in 1932, was a physicist by training. But this abstract branch of science did not seem to interest him much as he has just one scientific paper in physics in the voluminous writing that he did during his long and illustrious career. Instead, he seemed to be continuously obsessed with
the quest for practical problems in search of scientific and quantitative solutions that made a difference to the lives of people. It was in this process that he applied the then existing elementary methods and developed newer and more sophisticated statistical techniques and pioneered, along with R. A. Fisher and Karl Pearson, statistics as a scientific discipline distinct from Mathematics towards the beginning of the twentieth century. In his capacity as Honorary Statistical Adviser to the Government of India immediately after independence in 1947, he was instrumental in conceiving and establishing the National Sample Survey Organization as well as the Central Statistical Organization, the two pillars of the Indian Statistical System. For this reason, he can truly be described as the architect of the modern Indian Official Statistical System. It was, therefore, a fitting tribute to the memory of Professor P. C. Mahalanobis that his birthday, 29th
June, was declared as the Statistics Day by the Government of India three years ago. On the first Statics day in 2007, the Prime Minister Dr. Manmohan Singh graced this occasion and paid rich tributes to the multifarious contributions of Professor Mahalanobis. The post-independence India owes much to the versatile contributions of
56
Professor Mahalanobis. He was not just an eminent statistician and architect of India’s Second Five Year Plan but also headed the Income Distribution Committee to examine the distributional consequences of the first decade of planned development. His contributions to Statistics are numerous and impressive. He developed the large scale sampling theory and advocated and established the usefulness of sampling methods as a cost effective and efficient substitute for Censuses. He paid minute attention to the methods of data collection, data validation and data processing which he described as ‘statistical crafts’ and regarded these crafts to be as important as statistical techniques of inference. For him, statistics was basically what he called ‘ a key technology’ that provided analytical quantitative tools for testing the validity of any scientific hypothesis, whether in natural or social sciences. Consequently, the Bachelor of Statistics course that he inspired at the Indian Statistical Institute required students to get exposure to both natural and social sciences. The Indian Statistical Institute at Kolkatta, which he founded, was possibly the first organization in the world that was devoted to teaching and research in statistics and demonstrating the important role of statistics in inter-disciplinary research. It was because of his foresight that the ISI received worldwide recognition as the Indian School of Statistics, based on its fundamental contributions to statistical science, and the outstanding Statisticians it produced.
3. It is a matter of satisfaction to note that the Ministry of Statistics and
Programme Implementation has decided to select one topic of current importance every year on the Statistics Day, take a review of statistics generated in that field, identify the gaps, and take appropriate measures throughout the year to improve the quality of statistics in that field. In this connection, selecting “Price Statistics” as theme during 2009 is very appropriate.
4. Changes in the prices of goods and services which result from the interaction and shifts in the demand and supply in the interconnected markets, affect different segments of the population differently. Thus measuring prices and their rate of change over time has become crucial to almost every economic issue, from the conduct of monetary policy to measuring inter-temporal and inter-regional economic progress. Central and State Government agencies collect the data on prices for varied purposes. Despite their importance in everyday life as well as for government policy, the data on prices, both for the wholesale price index and consumer prices indices are not satisfactory. On account of the existing deficiencies such as outdated base years, involvement of multiple data collection agencies, use of varying concepts and definitions, non-existence of an exclusive field agency, non-standard specifications, repetition of prices due to non-response, and the meager honorarium to data collectors, we face formidable hurdles in producing timely, accurate and relevant price data. It is important that we review the position and take immediate corrective measures. We must enhance the reliability and societal creditability of price data. Further, with the rising
57
importance of the services sector in contributing significantly to country’s GDP, the major lacuna in price statistics has been the total absence of price indices for services. This raises conceptual issues of measurement and methods and options for collection that need to be urgently addressed. Initially, we could start with indices for certain individual services like banking and then gradually expand the scope to have an eventual general price index of services on the lines of the wholesale price index for commodities with which it could be merged. Another important issue is that because of its ready availability with shorter periodicity, we use the wholesale price index (WPI) to measure the rate of inflation in India. The WPI is possibly a better approximation to the producer price index because of the inclusion and relatively large weight of intermediate and capital goods and absence of the coverage of of services. It is an unsatisfactory indicator of rate of change of prices of consumer goods with which our everyday experience of inflation is associated. The divergence between the WPI and consumer price changes, reasons for which are well-known among the official statisticians, has in recent times been rising and inadvertently contributing to the erosion of the credibility of WPI in the minds of the general population.
5. The Consumer Price Index (CPI) is widely used virtually all over the world to measure the changes in cost of living of the population. It is also used for a variety of other purposes and is also viewed as an indicator of the effectiveness of Government’s anti-inflation economic
policies. In India, however, we do not have CPI for the entire population but we have CPIs for some segments of the population. in the absence of an all India CPI, as noted earlier, the WPI is currently used as the commonest measure of inflation in India, though as argued earlier, it is an inadequate indicator. I hope that the Central Statistical Organization, which took up this issue some time back, would introduce an All India Consumer Price Indices for Rural and Urban populations before we celebrate the Statistics Day 2010 next year.
6. There is also a need to bring uniformity of methodology in the computation of price indices compiled by the States and Union Territories so that meaningful analysis of regional price variation can be made. The Central Statistical Organization, which is an apex body for the purpose, should suggest measures to ensure uniformity in compilation of CPI number by the States and UTs, and this perhaps can be an issue for taking up in the Conference of Central and State Statistical Organizations.
7. I would also like to emphasize the need to unify the system of price data collection in such a way that the proposed mechanism should take into account the requirements of, at least, all central agencies compiling the price indices. The proposed system should be streamlined and strengthened in such a way that effective participation of both the Central and the State agencies is ensured. The system would also facilitate the compilation of CPI for rural and urban areas with a
58
substantial saving in the cost of price data collection. For speeder transmission of price data, appropriate tools of information technology should be deployed.
8. I am happy to know that the Collection of Statistics Act, 1953 has been replaced by the Collection of Statistics Act, 2008, which has since been published in the official Gazette on 9th January, 2009. I am sure that it would now be possible for all data collection agencies to also collect price data with legislative support, which I hope will improve response and quality of price data.
9. Before I close, I must mention that to retain credibility of official statistics in the eyes of the users, the statistical agencies need to adopt standards and protocols strictly according to professional
considerations, including scientific principles and professional ethics, and the methods and procedures for the collection, processing, storage and presentation of statistical data. The Statistical Agencies must be extremely rigorous with respect to the standards that data collection must meet, the methods of processing data, and the derivation of the results. In addition, they must instill in their staff an ethos of quality on a par with such high standards. It is important so that the trust of public in statistics is not eroded.
10. With these words, I convey my greetings to you on Statistics Day 2009, and congratulate the Ministry for selecting “Price Statistics” as the theme for the year 2009. I wish you fruitful deliberations during the Technical Session.
Thank you.
59

61

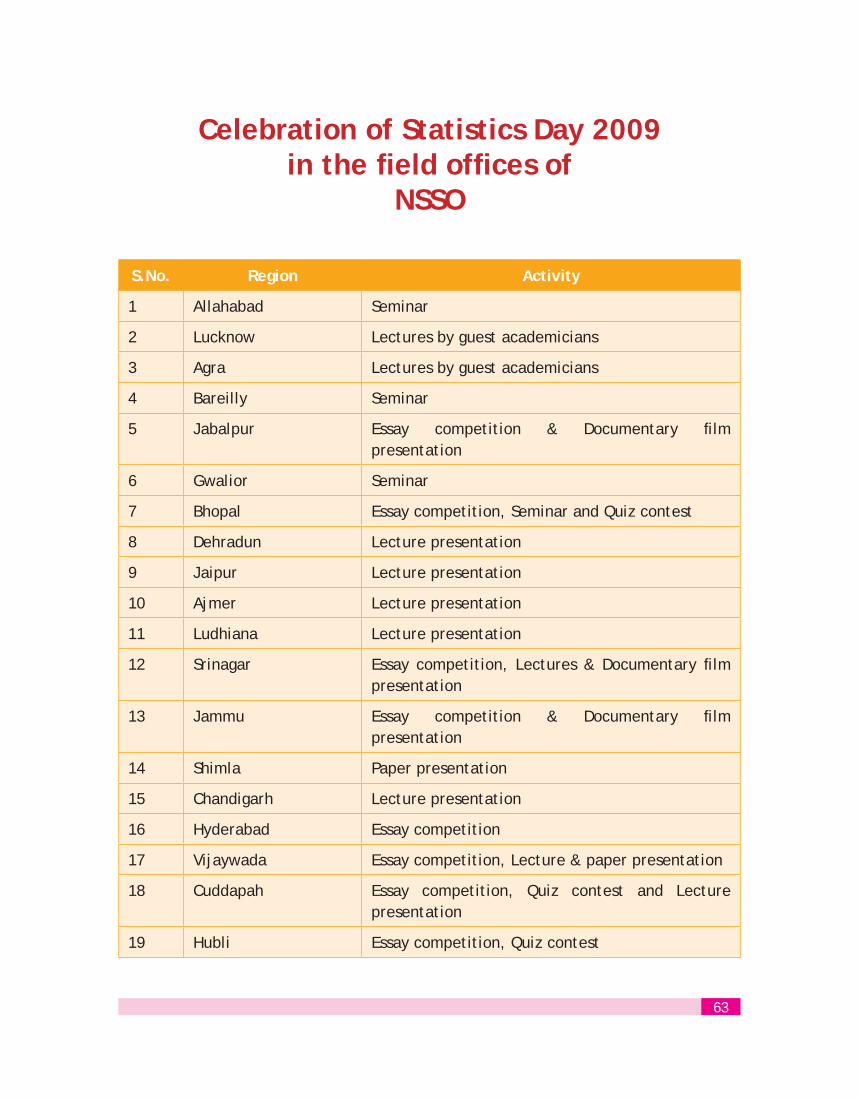
Celebration of Statistics Day 2009 in the field offices of
NSSO
S.No. Region Activity
1 Allahabad Seminar
2 Lucknow Lectures by guest academicians
3 Agra Lectures by guest academicians
4 Bareilly Seminar
5 Jabalpur Essay competition & Documentary film presentation
6 Gwalior Seminar
7 Bhopal Essay competition, Seminar and Quiz contest
8 Dehradun Lecture presentation
9 Jaipur Lecture presentation
10 Ajmer Lecture presentation
11 Ludhiana Lecture presentation
12 Srinagar Essay competition, Lectures & Documentary film presentation
13 Jammu Essay competition & Documentary film presentation
14 Shimla Paper presentation
15 Chandigarh Lecture presentation
16 Hyderabad Essay competition
17 Vijaywada Essay competition, Lecture & paper presentation
18 Cuddapah Essay competition, Quiz contest and Lecture presentation
19 Hubli Essay competition, Quiz contest
63
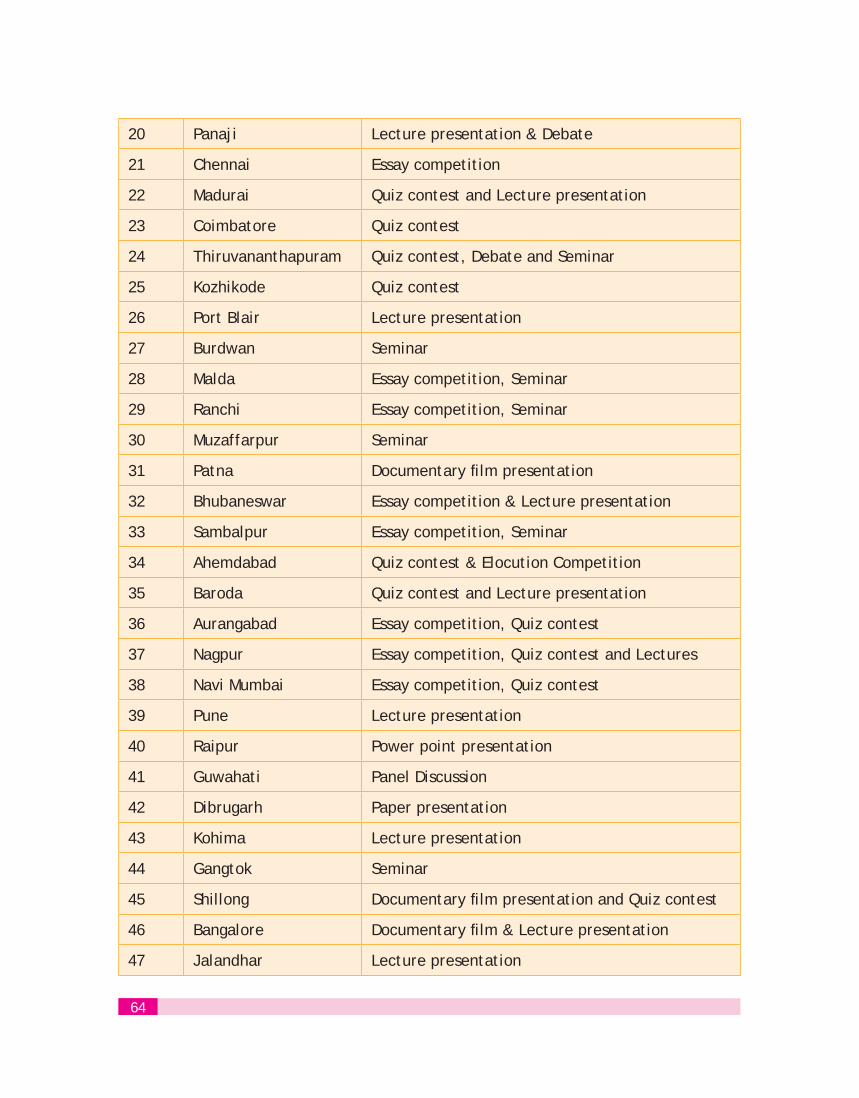
20 Panaji Lecture presentation & Debate
21 Chennai Essay competition
22 Madurai Quiz contest and Lecture presentation
23 Coimbatore Quiz contest
24 Thiruvananthapuram Quiz contest, Debate and Seminar
25 Kozhikode Quiz contest
26 Port Blair Lecture presentation
27 Burdwan Seminar
28 Malda Essay competition, Seminar
29 Ranchi Essay competition, Seminar
30 Muzaffarpur Seminar
31 Patna Documentary film presentation
32 Bhubaneswar Essay competition & Lecture presentation
33 Sambalpur Essay competition, Seminar
34 Ahemdabad Quiz contest & Elocution Competition
35 Baroda Quiz contest and Lecture presentation
36 Aurangabad Essay competition, Quiz contest
37 Nagpur Essay competition, Quiz contest and Lectures
38 Navi Mumbai Essay competition, Quiz contest
39 Pune Lecture presentation
40 Raipur Power point presentation
41 Guwahati Panel Discussion
42 Dibrugarh Paper presentation
43 Kohima Lecture presentation
44 Gangtok Seminar
45 Shillong Documentary film presentation and Quiz contest
46 Bangalore Documentary film & Lecture presentation
47 Jalandhar Lecture presentation
64

The value of Statistics in the economic life of every nation has come to be universally recognized. The economist; administrator or politician requires Statistics to support his arguments and to elucidate the problems he handles.
Even an ordinary citizen today is unwilling to accept a proposition unless it is supported by facts and figures. As statistics relate to facts, they are the raw materials on which conclusions can be based and principles enunciated. According to Dr. Bowley, “statistics is the science of the measurement of the social organism regarded as a whole, in all its manifestations.” In studying the economic progress of a people, population growth, biological variations, incidence of disease on a population in given period, growth of education, conditions of public health and many other social phenomena, special statistical methods and technique are employed.
The social life in the modern age is so complex and such sweeping changes are taking place through scientific and technological progress that mere ideas cannot be the basis of human endeavours. In order to give a concrete shape to ideas, we require detailed statistics relating to the particular aspect of social life which is intended to be tackled. We require not
only a correct evaluation of the problems but also a correct assessment of needs in order to initiate measures for satisfying them. The failure of many schemes of social betterment is traceable to a lack of real connection between actual conditions and the remedies adopted. So the value of up-to-date Statistics in the making of progressive schemes of social development is very important.
According to Prof. P. C. Mahalanobis, the great Indian Statistician, “Statistics was to be used for better understanding and reporting of scientific and engineering data and decision making for the welfare of society.”
Explaining the phrase in relation to development planning in India Prof. Mahalanobis points out “Our aim is to solve the problem of poverty, that is, to find a feasible method of bringing about continuing economic development of the country. It would be necessary to use much scientific and technical knowledge and also to organize continuing research at various levels for the purpose. But research is not our primary objective; the aim is to solve our particular problem. When a practicing physician gives medical treatment to a patient he uses much scientific knowledge and may even do some research, but the chief aim is to cure the patient. His
IMPORTANCE OF STATISTICS IN ECONOMIC AND SOCIAL LIFE
{Lecture delivered by Mr. Manik Lal Das, Superintendent, NSSO(FOD), Jorhat on Statistics Day 2009}
65
observations or experiment on the patient may add to medical knowledge but the treatment given is not primarily for purpose of research. The intention is important. Our studies also have the primarily aim of solving a particular problem (and not of doing any theoretical research of its own sake)” India has to carry out several five year plans which require a mass of statistical knowledge and information. The second five year plan has been aptly called statistical and was framed by prof. P. C. Mahalanobis.
India enjoys a proud place at the global level in the field of Statistics for work of Prof. P. C. Mahalanobis.
We entered the era of planning in 1950. Main requirement of planning is the reliable data; with documentation of first five Year Plan it was felt by the National Income Committee that there was scarcity of data
in the field of production, consumption and other aspects of economic life. The severe need was felt by the planners for reliable and objective data in regard to these fields, Prof. P. C. Mahanalobis, honorary Statistical adviser to the Cabinet formulated scheme for data collection in an integrated and co-ordinated fashion and as a result, NSSO came into existence. The NSSO is a flagship of the Indian Statistical System.
The statistics of India have largely originated as a bye-product of administrative activities, such as the collection of land revenue, or from the need of information relating to emergencies such as famines or droughts.
Lastly, we can say - “people survey for people development, share your growth and project our socio-economic life through Statistics.”
66
THE FATHER OF INDIAN STATISTICS{Lecture delivered by Mr. M. Adhikary
Investigator, NSSO(FOD), TEZPUR on Statistics Day 2009
Professor Prasanta Chandra Mahalanobis is revered as the Father of the Indian statistical system. He established the National Sample Survey in 1950, with the active support of the then Prime Minister, Pandit Jawaharlal Nehru, and guided its work in its early years. Many considered the establishment of NSS, to be the finest creation of Prof. Mahalanobis, a visionary with illustrious achievements in diverse fields.
In recognition to the notable contributions made by Professor Mahalanobis in the fields of economic planning and statistical development in the post-independence era, the Government of India has decided to designate 29th June, his birth anniversary as ‘Statistics Day.’
Mahalanobis belonged to a family of Bengali landed gentry who lived in Bikrampur (now in Bangladesh). His grandfather Gurucharan Mahalanobis moved to Calcutta in 1854 and built up a business, starting a chemist shop in 1860. Gurucharan was actively involved in social movements such as the Brahmo Samaj, acting as its Treasurer and President. His house on 210 Cornwallis Street was the centre of the Brahmo Samaj. Gurucharan married a widow against social traditions. His elder son Subodhchandra (1867-1954) was the father of P. C. Mahalanobis. He was a distinguished educationist who studied
physiology at Edinburgh University and later became a Professor at the Presidency College became head of the department of Physiology. Subodhchandra also became a member of the Senate of the Calcutta University. Born in the house at 210 Cornwallis Street on 29th June, 1893, P. C. Mahalanobis, grew up in a socially active family surrounded by intellectuals and reformers.
Mahalanobis received his early schooling at the Brahmo Boys School in Calcutta graduating in 1908. he ten joined the Presidency College, Calcutta and received a B. Sc degree with honours in physics in 1912. He left for England in 1913 to join Cambridge. He however missed a train and stayed with a friend at King’s College, Cambridge. He was impressed by the Chapel there and his host’s friend M.A. Candeth suggested that he could try joining there, which he did. He did well in his studies, but also took an interest in cross-country walking and punting on the river. He interacted with the mathematical genius Srinivasa Ramanujam during the latter’s time at Cambridge. After his Tripos in physics, Mahalanobis worked with C.T.R Wilson at the Cavendish Laboratory. He took a short break and went to India and here he was introduced to the Principal of Presidency College and was invited to take classes in physics.
67
He went back to England and was introduced to the journal Biometrika. This interested him so much that he bought a complete set and took them to India. He discovered the utility of statistics to problems in meterology, anthropology and began working on it on his journey back to India.
In Calcutta, Mahalanobis met Nirmalkumari, daughter of Herambhachandra Maitra a leading educationist and member of the Brahmo Samaj. They married on 27th
February 1923 although her father did not completely approve of it. The contention was partly due to Mahalanobis’ opposition of various clauses in the membership of the student wing of the Brahmo Samaj, including restraining members from drinking and smoking.
Many colleagues of Mahalanobis took an interest in statistics and the group grew in the Statistical Laboratory located in his room at the Presidency College, Calcutta. They established the Indian Statistical Institue (ISI) which was initially in the Physics Department of the Presidency College. In 1933, the journal Sankhya was founded.
In 1959, the Institute was declared as an Institute of national importance and a deemed university.
In later life, Mahalanobis was a member of
the planning commission and contributed prominently to newly independent India’s five-year plans starting from the second. In the second five-year plan he emphasised industrialization on the basis of a two-sector model.
Mahalanobis also had an abiding interest in cultural pursuits and served as secretary to Rabindranath Tagore, particularly during the latter’s foreign travels, and also worked at his Visva-Bharati University, for some time. He received one of the highest civilian awards, the Padma Vibhushan from the Government of India for his contribution to science and services to the country.
Mahalanobis died on 28th June, 1972, a day before his seventy-ninth birthday. Even at this age, he was still active doing research work and discharging his duties as the Secretary and Director of the Indian Statistical Institute and as the Honorary Statistical Advisor to the Cabinet of the Government of India.
The nation acknowledged his contribution by offering him the Padma Vibhushan award in 1968.
The Government of India decided in 2006 to celebrate his birthday, 29th June as National Statistical Day and we gathered here today to pay our sincere homage to the father on Indian Statistics and the sculptor of NSSO.
68

Various statistical activities, such as crop-cutting surveys, socio-economic surveys, economic census, agriculture census, demographic census etc, being conducted in India are well known world-wide for their size and technical efficacy. Data captured through these surveys and censuses are utilised to ensure planned development and formulating policies for economic development. Collection, tabulation and analysis of development statistics are primarily done by statisticians. Though people are aware of many of these statistical activities and organizations or agencies involved in accomplishing them, knowledge about achievements and contributions of statisticians those raised these strong-pillars of development is utterly limited. It is so because of two main reasons. Firstly, very few people prefer opting statistics as career due to having chances mainly to deal only with data and information throughout their life. General human response is another reason since an entertaining movie is greatly accepted but efforts put in creating an artistic master-piece is rarely publicised. Despite this, it is an established fact that a star-performer always gets recognised. He shines and twinkles in the sky of his own domain. In Indian statistical paradise also there is a star that has not only established base for
Indian statistical system putting in place necessary infrastructure and suggesting strategic steps for planning but also showed path to the world with his remarkable vision for statistics.
This brightened star-statistician, Professor Prasanta Chandra Mahalanobis, once again appeared full-shine and twinkled graciously in 2007 when his birthday on 29 June was celebrated by the centre and states with great pump and show declaring it as ‘Statistics Day’. A notification to this effect was published in the Gazette of India (Extraordinary, Part I – Section 1, Number 146) on 05 June 2007 and thereafter Ministry of Statistics and Programme Implementation issued an office order on 06 June 2007. First Statistics Day was inaugurated by Hon’ble Prime Minister, Dr. Manmohan Singh, who released a brochure, ‘Statistics Day – 2007’, on the occasion. National award in statistics (2006-07) initiated in the honour of another great statistician of India, Professor C. R. Rao was presented by Mr. G. K. Vasan, State Minister (Independent Charge) to Professor Ayendra Nath Basu. Joint recipients of Mahalanobis Award (2007), Professor S. C. Tendulkar, Chairman of the National Statistical Commission and Professor I. P. David of Philippines addressed the august
REMEMBERING PROFESSOR PRASANTACHANDRA MAHALANOBIS
{A Special Article on the Occasion of Statistics Day 2009 byMr. Pankaj Naithani, Joint Director, DES, Uttarakhand}
69
gathering shedding light on achievements and contribution of Professor Mahalanobis. Second Statistics Day was inaugurated by Mr. Pranab Mukherjee, Hon’ble Minister of External Affairs on 29 June 2008 in a programme presided by Mr. G. K. Vasan, State Minister (Independent Charge), Ministry of Statistics and Programme Implementation. Mr. Mukherjee also unveiled version-2.0 of DevInfo, a collection of development statistics and information prepared with joint efforts by the Ministry of Statistics and Programme Implementation and UNICEF. During both these programmes prizes were also distributed to students of post-graduate those were winner of essay competitions organised by the Central Statistics Organisation. On the occasion of Third Statistics Day, which shall be celebrated this year on 29 June, birthday of Professor Mahalanobis, one gets a chance to pay attribute and homage to Professor Mahalanobis remembering his world-renowned achievements and contribution in raising cornerstones of Indian Statistical System.
Professor Mahalanobis was born on 29 June 1983 in a progressive Brahmo family of Kolkata. After completing his primary education from Brahmo Boys School, Kolkata in 1908, he did Honours in Physics from Presidency College, Kolkata in the year 1912. Thereafter he proceeded to King’s College, Cambridge for higher education and completed ‘Tripos in Natural Sciences’ in 1915. He returned back to India in the same year and preferred joining Presidency College as Professor in Physics. He retired in 1948 as Principal of Presidency College. However, from time-to-time he also served
at various prestigious positions such as Meteorologist (1922-26), Member of Planning Commission (1953-68) and Chief Executive of Indian Statistical Institute (till last day of his life).
Although principally he was a physicist, his fascination towards statistics is merely a chance, which itself is basis of Theory of Probability. During his stay at Cambridge, his tutor Mr. W. H. Macaulay suggested him to go through Biometrika, a journal edited by Mr. Karl Pearson. He got so impressed with Biometrika that while returning India he brought a complete set of available volumes of it. In 1920 he met Mr. Nelson Annandale, Director of Zoological Survey of India, who persuaded him to analyse anthropological measurements collected on Anglo-Indians of Kolkata. This meeting resulted into publication of his first scientific research paper in 1922. He coined D2 – Statistics, which is known as Mahalanobis Distance Measure, and used it for divergence based grouping.
In 1922 Northern Bengal was badly hit by drastic-flood, which fetched his attention for extensive analysis of 50 years’ statistics on rain and flood. Based on his analysis he suggested a low cost plan to drain flood-water, contrasting with views of many engineering experts. However, on being implemented his plan was found fruitful and workable. While estimating possible error in results of agricultural experiments in 1924, he met Sir Ronald A. Fisher, who is known as Father of Statistics. This meeting lasted into a life-long friendship. His crop-cutting surveys for estimation of agricultural production are still relevant
70
due to their design. He initiated sample surveys in 1937 for estimating production and area under Jute. He succeeded in proving scientifically that sometimes survey results do exhibit pattern similar as that of complete enumeration or census. Moreover, these could be attained with lesser cost and time. This particular achievement of him became a boon to statistics in the form of Large Sample Surveys. He conducted various surveys on consumer-expenditure, tea-drinking habits, public opinion, plant diseases etc during 1937-44. Pilot surveys those were conceptualized and conducted by Professor Mahalanobis later on become base for sequential sampling. This fact was revealed in his book by Mr. Abraham Wald, who was developer of sequential sampling methods. Due to his creditable achievements in the field of sampling surveys Professor Mahalanobis was elected as Chairman of the United Nations Sub-Commission on Statistical Sampling in 1947. He held this position for next five years.
He was bestowed with various prestigious awards and numbers of honourable degrees were also conferred to him. He received the Weldon Medal (1944) from Oxford University and Padam-Vibhushan (1968) from Government of India. He was elected as Fellow of Royal Society of Landon (1945), President of Indian Science Congress (1950), Fellow of Econometric Society of America (1951), Fellow of Pakistan Statistical Association (1952), Honorary Fellow of Royal Statistical Society of England (1954), Foreign-Member of Soviet Academy of Sciences (1959) and Fellow of
American Statistical Association (1961).
A laboratory, which was established in his chamber at the Presidency College, Kolkata, witnessed birth of Indian Statistical Institute (ISI) on 17 December 1931 when he held a meeting with Mr. P. N. Banerjee, Mr. Nikhil Ranjan Sen and Sir R. N. Mukherjee. Later ISI was formally registered on 28 April 1932 under the Societies Registration Act (1860). Initially this institute contributed from Physics Department of the college. However, with passage of time other statisticians such as S. S. Bose, J. M. Sengupta, R. C. Bose, S. N. Roy, K. R. Nair, D. B. Lehari and many more got associated with Professor Mahalanobis and institute expanded tremendously gaining international repute. Professor Mahalanobis successfully attracted specialist statisticians from different disciplines such as Professor C. R. Rao, G. Kallianpur, S. K. Mitra, K. R. Parthsharthi, S. R. S. Varadhan, J. B. S. Haldane, R. A. Fisher and A. N. Kolmogrov, to visit the institute as regular guest faculty. He started publication of Sankhya, astatistical journal of the institute, in 1933. His continuous and sustained efforts made ISI an institution of academic excellence and international repute. Government of India also attributed achievements of the institute passing Indian Statistical Institute Act in 1959, and thereby recognising it as an institute of national importance giving it the status of Deemed University.
After independence in 1947, there appeared genuine need of establishing fundamentally pure statistical system to ensure socio-economic development of
71
the country. Professor Mahalanobis was appointed Honorary Statistical Advisor by the Government of India in 1949. Central Statistical Unit was established under his guidance and supervision. It later, in 1951, became Central Statistical Organisation (CSO). Prime objective of this organisation was to coordinate with various ministries those were performing statistical activities and help those providing necessary technical inputs. However, persisting data-gaps in the field of socio-economy simultaneously paved way to install another organisation. Consequently, on the recommendation of the National Income Committee, which was chaired by Professor Mahalanobis, National Sample Survey came into existence in 1950 with its mandate to capture data conducting socio-economic surveys in various fields. This unit finally got established as National Sample Survey Organisation (NSSO) in 1970.
Due to his vision and contemporary work-style Professor Mahalanobis had tremendous support and help from Pandit Jawahar Lal Nehru. Being member of the Planning Commission he prepared Second Plan document in 1954 at the ISI itself. He visualised that development-models of advance countries were not suitable for India, and, therefore, he conceptualised two-sector development model for India. His model, which was technically different from Leontief’s Input-Output model, could ensure faster industrialisation in India. Pandit Nehru invited Mr. Chau-en-Lai, Prime Minister of China and Mr. Ho-Chi-Minh, President of Vietnam to visit India
and specifically ISI. Mr. Lai and Mr. Minh visited ISI on 9 September 1956 and 13 February 1958 respectively. Mr. Lai was very impressed and he instantaneously assured Professor Mahalanobis sending statisticians from his country for study and training in the institute. This way ISI opened up a newer way of academic-bridging between India and neighbouring countries.
Professor Mahalanobis uttered a precious four-step strategy while he motivated statisticians to contribute for growth and development of the nation. According to him, they should first analyse and extract results from data collected through properly designed surveys. In next step, these results be used for selecting suitable and beneficial development schemes. During implementation of a scheme of choice, works done under it be analysed for their concurrence with pre-set objectives. Finally, mid-term corrections be done whenever conducted works are not found in consonance with goals of the scheme. This particular approach suggested by him in respect of plan implementation has stand test of time and it is relevant even today. This expresses his fore-sightedness and conceptualisation-ability. He was a complete statistician in himself. This ‘Renaissance-man and Scientist’ even completed last year of his life and departed for holy-journey on 28 June 1972. He still twinkles in statistical paradise as usual and shows path to various statisticians, economists and planners world-over.
72
We are living in the age of science and technology. According to “J.F. Kennedy” it is a push button age. Push button cannot do anything unless or until it involves some statistics in it. Science in itself is dependent on statistics. Statistics has blessed us with many changes. It is a wonderland of countless miracles and marvels. The fairy tales of yesterday have become true & real. We can say that present age is the age of Statistics. The influence of Statistics can be seen in every walk of life. Statistics has made man’s life a lot more comfortable & much easier than it was ever before.
Every day we come across a lot of information in the form of facts, numerical figures, tables, graphs etc. These are provided by newspapers, televisions, magazines & other means of communication. These may relate to cricket batting or bowling averages, profits of a company, temperatures of cities, expenditures in various sectors of a five year plan, polling results & so on. These facts or figures, which are numerical or otherwise, collected with a definite purpose are called data. Data is the plural form of the Latin word “DATUM”.
Our world is becoming more & more information oriented. Every part of our lives utilizes data in one form or the other. So, it becomes essential for us to know how
to extract meaningful information from such data. This extraction of meaningful information is studied in a branch of mathematics called “STATISTICS”.
The word “STATISTICS” appears to have been derived from the Latin word “STATUS”meaning “a (political) state”. In its origin, statistics was simply the collection of data on different aspects of the life of people, useful to the state. Over the period of time , however, its scope broadened & statistics began to concern itself not only with the collection & presentation of data but also with the interpretation & drawing of inferences from the data. Statistics deals with collection, oganisation, analysis & interpretation of data. The word “Statistics” has different meaning in different contexts.
The numerical data may include a (i) number of educational institutions of India, literacy rate of various states, etc.
The subject, which deals with the (ii) collection, presentation, analysis of data as well as drawing of meaningful conclusions from the data.
Archaic laws with remnants of colonial legacies & policies particularly those relating to our economy & planning have to be changed to make better laws & a vibrant economy suited to the Diaspora
STATISTICS IN DAILY LIFE{Lecture delivered by Shri B.S. Bhan, SSS Grade –I
NSSO (FOD) Jammu on the Statistics Day function 2009}
73

of our society which will ensure a truly transparent governance & a fair deed to the all classes of people.
The importance of fool proof statistical data for further planning can hardly be emphasized. The Planning Commission can evolve genuine five year plans only on the basis of factual statistical data. Through statistics we can differentiate general masses by a section of our population, though small is very rich. Most of our people are poor. Similarly with regard to education some are illiterate & some are literate. Some of us may be living in luxury, others live at the starvation level, below poverty level, or at that level or a little higher. Above them is a class which we call the creamy layer. Some amongst us are lucky enough to get opportunity for advancement while others lack them. There is a lot of inequality and each group requires serious attention. We have read that some criminals becoming respectable legislators. There is no measuring rod for dividing the haves and the have-nots, the affluent and the deprived.
While statistics give a meaningful direction to government planning in executing different projects and programmes, in daily life also it helps us to achieve better results.
If we plan a party or a get together, statistics plays a vital role. On the occasion of a marriage, we need figures and statistics otherwise there will be chaos and confusion.
Statistics has become not only a very important but also a popular subject
among general masses and scholars. Statistics in daily life has today become a part of our everyday domestic and business activity. The head of the family works out his monthly or weekly or daily income so as to meet his expenditure. His best effort is to cut his coat according to his cloth. We are talking of the common man which has been substituted by the phrase “Aam Aadmi” now. He has to look to his resources so as to not to overstep his daily spending because that will lend him in misery. Today young couples plan their family and budget to meet their needs priority wise. Even small children have become conscious of the importance of daily statistics because it enables them to plan their future.
After achieving independence in 1947, statistics came into lime light. India’s first Prime Minister Pt. Jawahar Lal Nehru was distressed to see the economic condition of his countrymen. His visits to some foreign countries surprised him to see their huge domestic products, their national income and the giant steps on the road to progress. Pt. Nehru was a great visionary. He understood that the Indian people were living in miserable conditions because our economy had got shattered by the British selfish rule. Eighty percent of our population was living in villages which were backward. They were dependent upon primitive methods of agriculture making a hand to mouth living. He felt that the need of the hour was to make economic planning an integral part of the government working. This could be possible when our planning process had a strong database and was possible only
74

through statistics. Central government, State Government, Planners, Scholars are dependent upon daily statistics, like for example every Government is eager to see what is our national income, growth of GDP, socio economic conditions of the country, agricultural statistics to see the total land use and total agricultural production. This is only due to statistical data that Government collects from different agencies from time to time to plan better future of the country.
Late Professor P.C. Mahalanobis was very much interested in statistics and became one of the leading statisticians of India. In other words, we can say that father of the statistics in India is late Prof. P.C. Mahalanobis. He popularized statistics in India. Presently, we have two statistical institutes one at Kolkata & other at New Delhi.
You will kindly agree that our daily life today rotates around figures & statistics.
Barter system was a primitive method of our living & existence. Today, we have standard weights & measures to make us feel secure. Take any article of daily life need, say fruit juice. The carton has detailed statistics printed on it. What is the weight of the juice, the date of its manufacture, how long it can last, nutritional details, composition etc. I hope this example is sufficient enough to give an idea of what facts & figures mean to us & how important they are to come to a decision whether we should purchase or not to purchase a particular item at a given time. This is only due to statistics which is available in our daily life.
We should salute late Prof. P.C. Mahalanobis the great son of India who has introduced statistics & even today we are using statistics in almost every sphere which makes our daily life happier to live in this busy world.
75
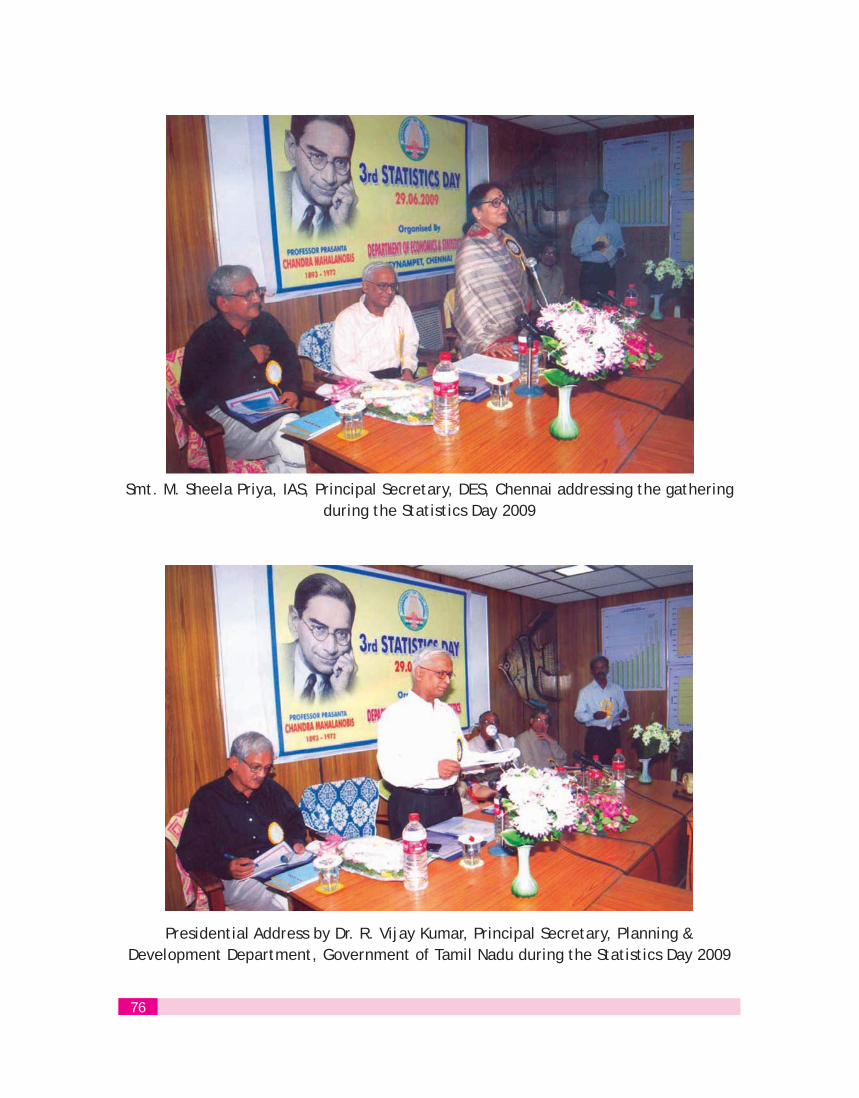
Smt. M. Sheela Priya, IAS, Principal Secretary, DES, Chennai addressing the gatheringduring the Statistics Day 2009
Presidential Address by Dr. R. Vijay Kumar, Principal Secretary, Planning & Development Department, Government of Tamil Nadu during the Statistics Day 2009
76
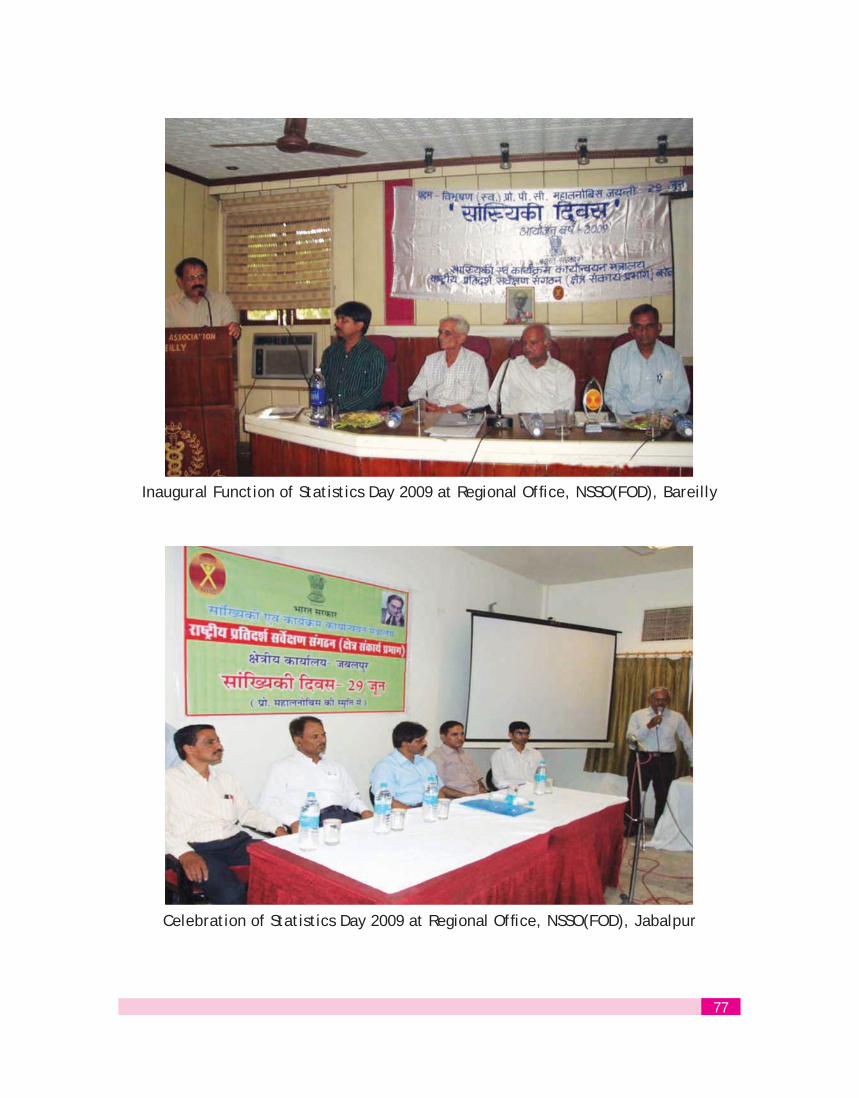
Inaugural Function of Statistics Day 2009 at Regional Office, NSSO(FOD), Bareilly
Celebration of Statistics Day 2009 at Regional Office, NSSO(FOD), Jabalpur
77
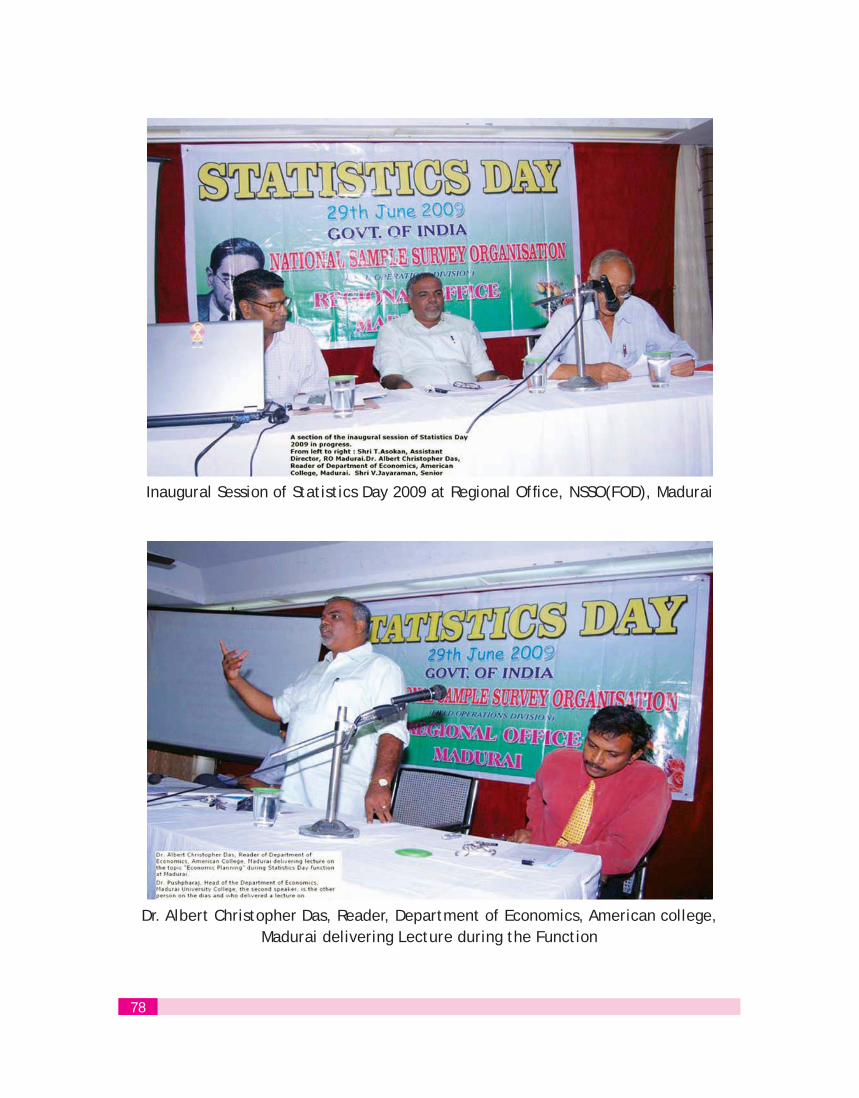
Inaugural Session of Statistics Day 2009 at Regional Office, NSSO(FOD), Madurai
Dr. Albert Christopher Das, Reader, Department of Economics, American college, Madurai delivering Lecture during the Function
78
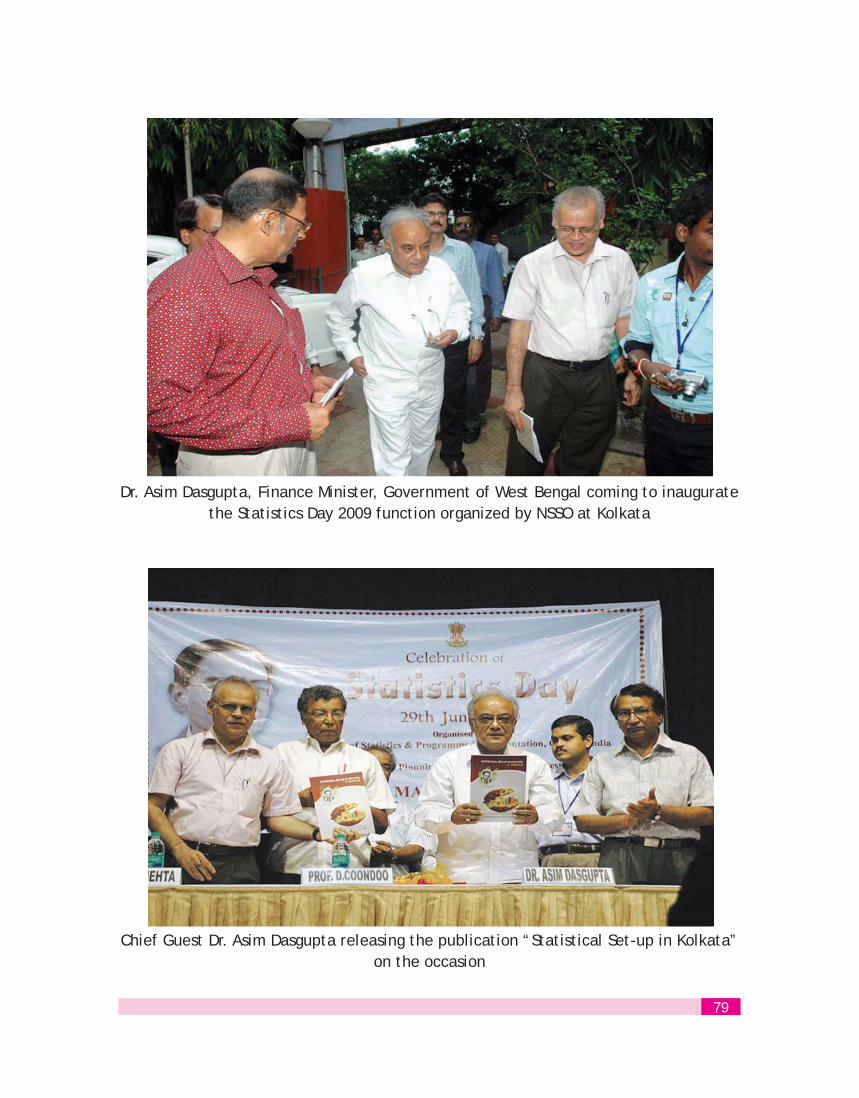
Dr. Asim Dasgupta, Finance Minister, Government of West Bengal coming to inaugurate the Statistics Day 2009 function organized by NSSO at Kolkata
Chief Guest Dr. Asim Dasgupta releasing the publication “Statistical Set-up in Kolkata” on the occasion
79
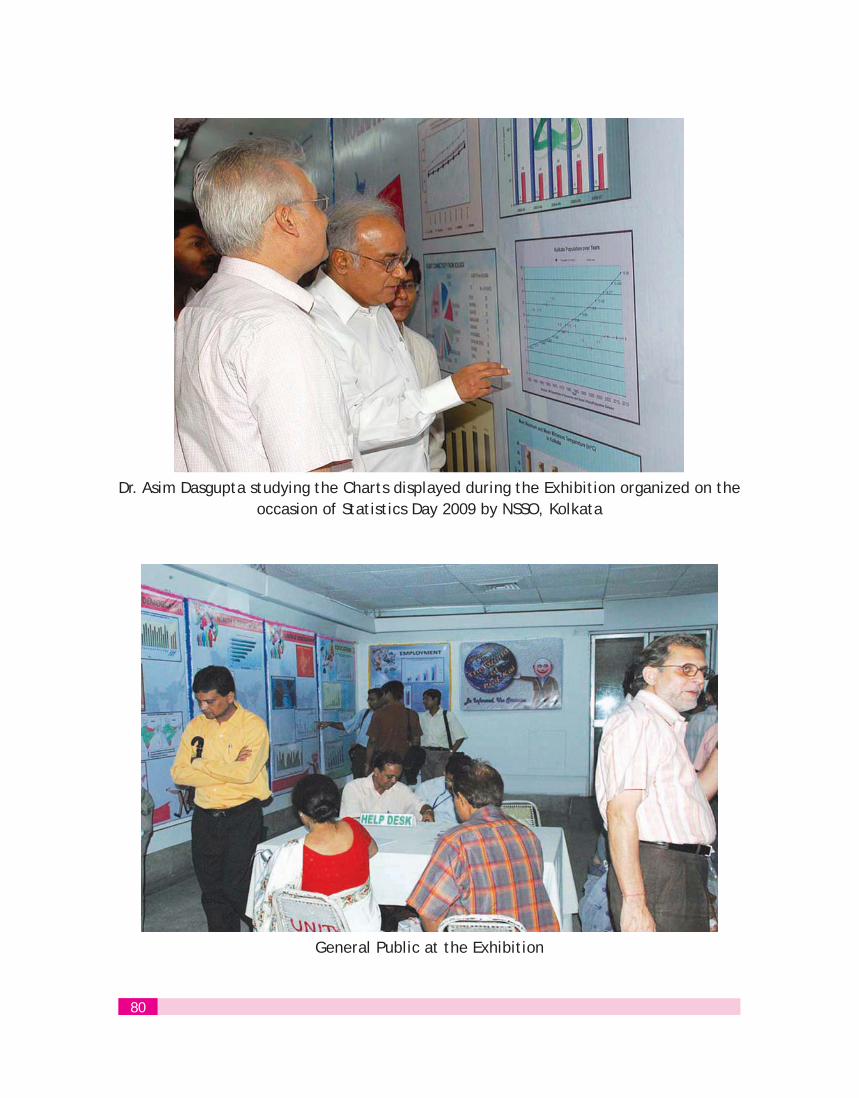
Dr. Asim Dasgupta studying the Charts displayed during the Exhibition organized on the occasion of Statistics Day 2009 by NSSO, Kolkata
General Public at the Exhibition
80
Extracts of PM's address at the National Conference of Ministers In-Charge of Statistics of States and UTs on September 9, 2008 at New Delhi
“.......... As our
economy m
odernises,
the differe
nt arms of
government
and every
economic
actor, be
it a farme
r or a
worker, a
domestic or
foreign in
vestor, or
a consumer
, or a
researcher
, all of the
m need acc
urate and r
eliable info
rmation.
Reliable sta
tistical dat
a are of c
rucial impo
rtance for
the
formulation
of macro-
economic pol
icies and p
rogrammes
and for
assessing t
he impact
of specifi
c policies i
n terms of
achieving
their goals
and objectiv
es.........”

We are commit
ted
- To make avai
lable data/
statistics on
key parame
ters to Planner
s and
Policy makers
in Government an
d outside\
- To improve th
e quality and
reliability o
f existing dat
a sets
- To make availa
ble new data
sets on emer
ging fields
to meet the
demand
of policy mak
ers and plan
ners
- To reduce the
time lag in
bringing out
Statistics