states district court district of new jersey patrick brady, et al., plaintiff, v. air line pilots...
TRANSCRIPT

UNITED STATES DISTRICT COURT DISTRICT OF NEW JERSEY PATRICK BRADY, et al.,
Plaintiff, v. AIR LINE PILOTS ASSOCIATION INTERNATIONAL,
Defendant.
Civil Action No. 02-2917 (JEI)
EXPERT REPORT OF JAMES S. FELTMAN, CPA
SENIOR MANAGING DIRECTOR, MESIROW FINANCIAL CONSULTING, LLC
March 15, 2013 James S. Feltman Senior Managing Director Mesirow Financial Consulting, LLC 666 Third Avenue, 21st Floor New York, New York 10017 [email protected]

TABLE OF CONTENTS I. Introduction ............................................................................................................................ 1
A. Retention and Scope ........................................................................................................ 1 B. Qualifications ................................................................................................................... 1 C. Fees .................................................................................................................................. 2 D. Documents Considered .................................................................................................... 2 E. Principal Opinions and Conclusions ................................................................................ 3 F. History of TWA’s Financial Difficulties ......................................................................... 5
II. Financial Condition of TWA ................................................................................................. 7 A. Insufficient Revenue Generating Capabilities ................................................................. 8
1. Traffic ........................................................................................................................ 8 2. Yield ........................................................................................................................... 9
B. High Operating Cost Structure....................................................................................... 11 1. Fuel .......................................................................................................................... 11 2. Aircraft Rent ............................................................................................................ 12 3. Labor ........................................................................................................................ 13
C. Poor Financial Performance ........................................................................................... 14 D. Inadequate Capital Resources and Liquidity ................................................................. 18 E. Other Observable Market Evidence ............................................................................... 23 F. Solvency ......................................................................................................................... 25
1. Market Approach ..................................................................................................... 26 2. Income Approach ..................................................................................................... 27 3. Fair Market Valuation Conclusion........................................................................... 29
III. TWA’s Inability to Operate as a Stand Alone Airline ......................................................... 30 A. Industry Consolidation ................................................................................................... 31 B. Network Structure .......................................................................................................... 34 C. Regional Affiliates ......................................................................................................... 37 D. Pricing Pressure ............................................................................................................. 40
IV. Conclusion ........................................................................................................................... 44
LIST OF FIGURES Figure 1 : TWA’s Comparative Market Share (RPMs) .............................................................. 8 Figure 2 : TWA’s Relative Market Share ................................................................................... 9 Figure 3 : TWA’s Comparative Yield ...................................................................................... 10 Figure 4 : TWA’s RASM and CASM ...................................................................................... 16 Figure 5 : TWA’s Operating and EBITDA Margin ................................................................. 17 Figure 6 : TWA’s Unsecured and Secured Public Debt Pricing .............................................. 24 Figure 7 : TWA’s Credit Ratings ............................................................................................. 24 Figure 8 : TWA’s Share Pricing vs. Airline Index ................................................................... 25 Figure 9 : Non-Stop and Connecting Traffic at Hub Airports .................................................. 35 Figure 10 : Overview of Major Carriers’ RJ Operations ........................................................... 39 Figure 11 : Pricing Impact of Southwest Airlines ..................................................................... 42 Figure 12 : Cumulative Discount Received by Karabu ............................................................. 43

ii
LIST OF TABLES Table 1 : Fuel Expense Summary ........................................................................................... 12 Table 2 : Rent Expense Summary ........................................................................................... 13 Table 3 : Labor Expense Summary ......................................................................................... 14 Table 4 : Key Income Statement Metrics ................................................................................ 18 Table 5 : TWA’s Capitalization .............................................................................................. 20 Table 6 : Key Liquidity Metrics .............................................................................................. 21 Table 7 : Guideline Publicly Traded Company Method Conclusions .................................... 27 Table 8 : WACC Overview ..................................................................................................... 28 Table 9 : Income Approach Conclusions ................................................................................ 29 Table 10 : Hub Airports of TWA and Other Major Carriers .................................................... 36 Table 11 : Overview of RJ-Related Scope Clause Provisions .................................................. 38
EXHIBITS
Exhibit 1 - Curriculum Vitae of James S. Feltman Exhibit 2 - Documents Considered Exhibit 3 - Summary of Solvency Analysis Exhibit 4 - Market Approach: Guideline Publicly Traded Company Method Exhibit 5 - Income Approach: Capitalized Cash Flow Method Exhibit 6 - Weighted Average Cost of Capital Analysis Exhibit 7 - Description of Guideline Companies Exhibit 8 - Timeline of M&A Activity in Airline Industry Exhibit 9 - Timeline of Bankruptcy Activity in Airline Industry

I. INTRODUCTION
A. RETENTION AND SCOPE I have been retained by Paul, Weiss, Rifkind, Wharton & Garrison, LLP to analyze the
financial condition of Trans World Airlines, Inc. (“TWA” or the “Company”) at the time of its
third bankruptcy filing and acquisition by AMR Corporation (or its designee, “American”), and
to assess the viability of TWA as a stand-alone, going-concern airline. My analysis responds to
Plaintiffs’ experts’ assumptions and opinions regarding TWA’s financial viability and the pre-
merger career expectations and long-term job security of its pilots. My findings are included
herein (the “Report”). I reserve the right to supplement, modify, or amend this Report and my
testimony as necessary to address any relevant information that may become available to me
after the date of this Report.
B. QUALIFICATIONS I am a Senior Managing Director at Mesirow Financial Consulting, LLC (“MFC”), a
leading provider of financial advisory services and a wholly owned subsidiary of Mesirow
Financial Holdings, Inc. (“Mesirow Financial”). On September 16, 2004, Mesirow Financial
acquired the U.S. Corporate Recovery practice of KPMG LLP (“KPMG”) and renamed the
practice Mesirow Financial Consulting, LLC. At the time of the acquisition, I was a Partner at
KPMG, one of the world’s largest accounting and consulting firms. Prior to joining KPMG, I
was a Partner at Arthur Andersen LLP, for approximately ten years.
Since 1988, I have served continuously as a Bankruptcy Examiner, a Chapter 11 Trustee
or a Liquidating Trustee. As a court appointed examiner, I carried out duties prescribed to me by
the Bankruptcy Court, including conducting examinations into failed companies on more than a
dozen occasions. From approximately 1992 to 2004, I served as a Chapter 7 Panel Trustee in the
2
Southern District of Florida in over 15,000 cases. In this government appointed role (by the
United States Department of Justice), my work included examining business failures.
I am a Certified Public Accountant (CPA) and a Certified Fraud Examiner (CFE), and I
am certified in financial forensics (CFF). I have over 30 years of experience in, among other
things, financial analysis, valuations and damages analysis, corporate restructuring matters,
accounting, auditing, and forensic investigations. I have testified and been qualified as an expert
in numerous trials, depositions and evidentiary matters in various state and federal courts in a
range of financial and investigatory matters.
I have extensive experience in the airline industry in a variety of roles over nearly 20
years. Selected engagements include major global passenger carriers, including AMR
Corporation, Delta Air Lines, Inc., UAL Corporation and the world’s largest 747 cargo operator,
Atlas Air Worldwide Holdings Inc., among others. Information on these engagements, as well as
my additional airline industry experience, is set forth in my Curriculum Vitae, which is attached
hereto, and incorporated herein by reference, as Exhibit 1.
C. FEES MFC is being compensated in connection with the preparation of this Report and any
testimony I may provide in this matter at my usual rate of $950 per hour. Compensation to MFC
is not contingent in any way upon the outcome of this case.
D. DOCUMENTS CONSIDERED In the course of my analysis, I reviewed documents from a variety of sources, including
publicly available information, pleadings and other papers filed with the Bankruptcy Court
related to TWA’s Chapter 11 proceedings, and documents and testimony produced or made

3
available to me in the course of this case. A listing of documents considered is presented in
Exhibit 2.
E. PRINCIPAL OPINIONS AND CONCLUSIONS In their expert reports and deposition testimony, Plaintiffs’ experts Rikk Salamat and
Henry Farber have expressed certain opinions and made certain assumptions regarding the
financial condition of TWA around the time of its acquisition by American. Specifically,
although Mr. Salamat testified that an airline’s “financial health” and “whether it was in or out of
bankruptcy” are significant factors in a pilot’s pre-transaction career expectations, he repeatedly
distinguishes between TWA and other airline carriers in significant financial distress.1 Dr.
Farber’s report is based on his analysis of arbitration decisions from “comparable” airline
transactions “in which the acquired airline, like TWA, was in financial difficulties but still flying
at the time the deal was struck.”2 Dr. Farber further opined that “TWA was in a weakened
financial state” but “the adverse effect of TWA’s financial position would be mitigated by the
fact that TWA was still flying.”3 According to Dr. Farber, “bankruptcy is clearly not an
indicator that an airline is going to cease flying” because the only clear indicator that an airline
will cease flying is if you “[s]how up at the airport and the plane didn’t take off.”4
These opinions are crucial to the conclusions these experts have drawn concerning
damages and the outcome of a seniority integration under the hypothetical conditions presented
in their reports. Mr. Salamat, in constructing his “but-for” seniority list and damages model,
determined that TWA’s financial condition was not comparable to airlines that have liquidated.5
1 Deposition of Rikk Salamat (“Salamat Deposition”), dated January 29, 2013 at 86:24-87:01, and Expert Report of Rikk Salamat, dated October 12, 2012 (“Salamat Report”) at 24 and 27. 2 Expert Report of Henry Farber, dated October 12, 2012 (“Farber Report”) at 5 (emphasis added). 3 Farber Report at 19. 4 Deposition of Henry Farber (“Farber Deposition”), dated January 23, 2013 at 43:15-44:21. 5 Salamat Report at 24 and 27.

4
In addition, Mr. Salamat testified that the financial condition of the airlines involved in a
transaction is “most relevant in how [the arbitration awards Mr. Salamat used to construct his
“but-for” seniority list] are fashioned,” and that his damages model took into account the TWA
pilots’ pre-transaction career expectations based on TWA’s financial condition.6 Dr. Farber, in
turn, testified that if the American transaction was TWA’s only alternative to liquidation, it
would affect his analysis because he “would have had to select [his] comparable[] [arbitrations]
differently”—resulting in a different “but-for” seniority list.7 Neither of Plaintiffs’ experts,
however, conducted a detailed analysis of TWA’s financial condition or competitive prospects
during the relevant period.8
I have conducted such an analysis, as described below, and on the basis of this analysis I
conclude that Mr. Salamat and Dr. Farber are incorrect in assuming that TWA was a financially
viable airline that had the wherewithal to survive as a going concern at the time of its acquisition
by American. To the contrary, my principal opinions and conclusions are that:
TWA’s economic resources were inadequate to self-fund critical elements of its going-concern operations. As a result, TWA’s only remaining strategic options were to sell its remaining assets or liquidate.
TWA’s cash position and near-term liquidity were insufficient to meet its operational requirements. TWA’s access to short-term borrowing was significantly constrained; the transaction with American was the only alternative for TWA to quickly access cash and to avoid liquidation.
TWA was insolvent on December 31, 2000, March 31, 2001 and June 30, 2001.9
TWA’s business model was uncompetitive relative to the industry in which it operated. TWA’s business model had significant structural
6 Salamat Deposition, dated January 31, 2013, at 8:13-18 and 94:09-95:04. 7 Farber Deposition, dated January 22, 2013 at 139:3-8. 8 Salamat Deposition, dated January 29, 2013 at 50:21-51:07; Salamat Deposition, dated January 31, 2013, at 95:14-16; Farber Deposition, dated January 22, 2013 at 79:05-84:15. 9 December 31, 2000, March 31, 2001 and June 30, 2001 (“Valuation Dates”) were selected as valuation dates as these quarter-end dates encompass the time periods prior, during and subsequent to the announcement and closing of the transaction.

5
deficiencies such that its competitive position among its peer group (major carriers) would not have permitted an organic self-funded solution.
F. HISTORY OF TWA’S FINANCIAL DIFFICULTIES By early January 2001, TWA was in severe financial distress and at the brink of
liquidation. Its dire financial condition was the continuation of a long history of financial
challenges. I review that history briefly here, because I believe it is important to have a complete
understanding of the predicament in which TWA and its pilots found themselves at the time of
the American transaction.
As of January 2001, TWA had not earned a profit in the past decade.10 As TWA CEO
William Compton explained, “TWA has not worked as a stand alone [company] . . . for three
decades . . . If you go back over the last 30 years, this company has only generated an operating
profit perhaps a handful of times, with 20 different CEOs.”11 In 1992, and again in 1995, TWA
filed for Chapter 11 bankruptcy, each time emerging as a smaller carrier. While TWA was able
to reduce and restructure its outstanding indebtedness to some degree through two prior Chapter
11 filings, the viability of TWA was contingent upon its ability to generate revenues, control
costs and attract new capital. These factors were of particular significance to TWA, as it had
fewer internal financial resources and less access to external capital than most of its major
competitors.12 Unable to generate sufficient revenues to cover its rising costs, and with
constrained access to outside capital, TWA once again filed for bankruptcy protection—its third
bankruptcy filing—in 2001.
During and immediately prior to its third bankruptcy, TWA’s liquidity situation was
more dire than at the time of each of its previous two bankruptcies. By January 2001 there was
10 Affidavit of Michael Palumbo in support of First Day Motions at 13, ¶32 (“Palumbo Affadavit”); In re: TRANS WORLD AIRLINES, INC., et al., March 9, 2001 Testimony of Scott Schwartz at 149:19. 11 In re: TRANS WORLD AIRLINES, INC., et al., March 10, 2001 Testimony of William Compton (“2001 Compton Transcript”) at 464:20. 12 Palumbo Affidavit at 11, ¶26.

6
grave doubt as to whether TWA could finance another bankruptcy.13 At the time of its third
filing, the general sentiment in the market was that this bankruptcy filing for TWA would not be
a reorganization, but rather a liquidation.14 In an attempt to avoid liquidation, TWA and
American engaged in negotiations whereby American would provide TWA debtor-in-possession
(“DIP”) financing to fund TWA’s immediate liquidity needs, and American would purchase
substantially all of TWA’s assets and offer employment to substantially all of TWA’s labor-
represented employees. As further explained below, the transaction with American was TWA’s
only viable alternative to liquidation.15
13 Deposition of William Compton, dated January 18, 2013 (“Compton Deposition”) at 106:7-106:19. 14 IN RE: TRANS WORLD AIRLINES INC., et. al., Proceeding Transcripts of Michael Palumbo, dated January 27, 2001 (“2001 Palumbo Transcript”) at 27:21-28:13. 15 Deposition of Michael Palumbo, dated January 21, 2013 (“Palumbo Deposition”) at 128:25-130:1; Compton Deposition at 45:25-46:14.

7
II. FINANCIAL CONDITION OF TWA
The first step in my analysis involved assessing the financial condition of TWA.
Plaintiffs’ experts assumed that TWA was a financially viable airline. That assumption informed
their views of the pre-transaction career expectations, long-term job security, and proper
seniority placement of the TWA pilots, because there is a high degree of correlation between the
TWA pilots’ career expectations and the financial viability and value of TWA.16 Plaintiffs’
experts recognized the relationship between these factors but made no attempt to perform any
independent analysis as to the financial condition of TWA,17 and admittedly were not qualified
to perform such analysis.18 Dr. Farber testified that to determine whether TWA was likely to
cease flying, he would need to “look at their financial situation…[including] what their cash flow
looked like, …their revenues, fixed expenses, and…projections…for passengers.”19 I have
performed such analysis, as described below.
Based on my analysis, as further discussed below, it is my opinion that TWA's financial
condition and its ability to meet its financial obligations were significantly impaired as a result of
the Company’s:
Insufficient revenue generating capabilities, including the adverse effects on yield resulting from competition with Southwest Airlines Co. (“Southwest Airlines”) and the Karabu Corporation (“Karabu”) discounted ticket arrangement between TWA and Carl Icahn;
High operating costs, including fuel, aircraft rent and labor expenses;
Poor financial performance; and
Inadequate capital resources.
16 See Farber Deposition at 75:7-75:14, 83:6-83:12, 124:4-124:8, 135:11-135:22, 154:14-154:17, 214:22-214:23 and 112:18-112:21; Salamat Deposition 91:1-91:7 and 94:22-95:1. 17 Farber Deposition at 79:5-81:1 and 124:9-124:18; Salamat Deposition at 87:9-87:14. 18 Farber Deposition at 84:12-84:15; Salamat Deposition at 87:15-87:19. 19 Farber Deposition at 135:19-135:23.

8
These factors directly impaired TWA’s ability to maintain adequate liquidity to fund its
operations and to meet its financial obligations.
A. INSUFFICIENT REVENUE GENERATING CAPABILITIES
1. Traffic
The two primary components to revenue generation in the airline industry are traffic and
yield. Traffic is the starting point in analyzing TWA’s revenue, and can be measured in terms of
revenue passenger miles (“RPMs”). RPMs equal the total number of paying passengers times
the distance flown. When analyzing TWA, it is useful to compare its RPMs to those of the other
major carriers, to determine the Company’s revenue generating capabilities relative to its peers.
This analysis is also called a market share analysis. As displayed in Figure 1 below, relative to
the other major carriers, TWA was a much smaller airline. This posed a significant competitive
challenge for TWA, as it was a smaller player among larger competitors in a consolidating
industry.20 Figure 1 below details TWA’s market share compared to the other major carriers as
of 2000.
Figure 1 : TWA’s Comparative Market Share (RPMs)
AirTran, 0.6% Alaska, 1.8%
America West, 2.9%
American, 17.7%
AmTran, 1.8%
Continental, 9.7%
Delta, 16.7%Northwest, 12.0%
Southwest, 6.4%
TWA, 4.1%
United, 19.2%
US Airways, 7.1%
Source: SEC filings (Form 10-K). TWA's RPMs obtained from Bureau of Transportation Statistics T-100 Segment data.
20 Deposition of David Resnick, dated January 16, 2013 (“Resnick Deposition”) at 18:22-19:2.

9
Changes in TWA’s RPMs, relative to the other major carriers,21 may be examined to
determine whether the Company was gaining or losing market share.22 The data shows that since
emerging from bankruptcy in 1995, TWA continued to lose market share relative to the other
major carriers until approximately 1998, when TWA’s market share stabilized at approximately
4.1%. The loss of market share was due in part to TWA retiring older widebody aircraft and
eliminating unprofitable routes from its network in 1997 and 1998.23 Due to competitive
implications (discussed in greater detail below), TWA was unable to profitability recapture the
market share it lost by increasing traffic (RPMs). Figure 2 below details the decline in TWA’s
market share, as a percentage of the total market share of the other major carriers.
Figure 2 : TWA’s Relative Market Share
3.5%
3.7%
3.9%
4.1%
4.3%
4.5%
4.7%
4.9%
5.1%
1996 1997 1998 1999 2000
TWA Relative Market Share (RPMs)
Source: TWA SEC filings (Form 10-K). 2000 RPMs obtained from Bureau of Transportation Statistics T-100 Segment data..
2. Yield
TWA’s traffic performance must be viewed in conjunction with its yield, which
historically was lower than that of the other major carriers. Yield is a function of passenger
21 TWA’s relative market share computed by dividing TWA’s RPMs by the total RPMs of the other major carriers (including TWA). 22 Standard & Poor’s Industry Surveys: Airlines (July 20, 2000), at 24. 23 Trans World Airlines, Inc., Annual Report (Form 10-K) (December 31, 1998), at 38.

10
revenue generated divided by RPMs, and measures the average level of fares at which an airline
is selling product.24 A carrier’s influence over its yield is dependent on the price elasticity of
demand for the products it is offering, as well as the level of competition in the markets it serves.
TWA’s yield was constrained, in part, due to the adverse effects of a discounted ticket program
between the Company and Karabu, along with the downward pricing pressure imposed by
Southwest Airlines at TWA’s hub, Lambert St. Louis International Airport (“STL”) (both of
which are addressed in greater detail in Section III below). Furthermore, TWA had trouble
getting passengers to pay a premium fare for its seats (attracting business travelers), especially in
its domestic system.25 This was largely attributable to the weakness in TWA’s network structure
(also addressed in greater detail in Section III below). Due to these factors, as displayed in
Figure 3 below, TWA’s yield was much lower than the average yield of the other major carriers.
Figure 3 : TWA’s Comparative Yield
10.0
10.5
11.0
11.5
12.0
12.5
13.0
13.5
1996 1997 1998 1999 2000
(In
Cen
ts)
TWA Yield Average Peer Group Yield
Source: SEC filings (Form 10-K). TWA's 2000 Yield obtained from Standard & Poors Industry Surveys, Airlines, September 26, 2002..
The decline in TWA’s yield from 1998 to 1999 resulted from a diversion of higher
yielding business passengers due to uncertainty surrounding the outcome of labor negotiations
24 Standard & Poor’s Industry Surveys: Airlines (July 20, 2000), at 24-25. 25 CIBC Oppenhiemer, Equity Research: Trans World Airlines, Inc. (April 28, 1999), at 2.

11
between the Company and the International Association of Machinists and Aerospace Workers
(“IAM”).26 The threatened mechanics’ strike in 1999 hurt TWA’s high-yield and connecting
flight bookings. As a result, the airline turned to lower yielding distribution channels such as
Priceline.com to fill its seats.27 Although TWA improved its yield in 2000 (due to higher overall
industry fare levels and improved TWA marketing efforts), the improved yield was too little too
late because TWA was unable to control its rising unit costs.28
B. HIGH OPERATING COST STRUCTURE When evaluating an airline from a credit or equity perspective, an analysis of the carrier’s
cost performance is often even more important than its ability to increase revenue through traffic
or yield growth.29 Despite modest improvements in TWA’s traffic and yield in 1999 and 2000,
TWA’s operational costs – specifically fuel, labor and aircraft rent – increased at a much greater
rate, more than offsetting any financial benefit of its increased revenues.
1. Fuel
TWA was particularly vulnerable to variations in fuel prices because, unlike some of its
major competitors, it was only able to hedge its exposure to jet fuel market risk on a limited
basis.30 Because TWA’s credit worthiness was below investment grade, it would have had to
cash collateralize its fuel hedging position against potential movements in price.31 As discussed
below, TWA did not have available cash to meet counterparty requirements, and thus could not
26 Trans World Airlines, Inc., Annual Report (Form 10-K) (December 31, 1999), at 34. 27 Deutsche Bank, Airline Industry 2Q99 Preview: Industry Overview Sector: Air Transportation (July 13, 1999), at 13. 28 Trans World Airlines, Inc., Quarterly Report (Form 10-Q) (September 30, 2000), at 14. 29 Standard & Poor’s Industry Surveys: Airlines (July 20, 2000), at 25. 30 Palumbo Affidavit at 11, ¶27. TWA’s Form 10-K noted that TWA hedged a “minor portion of its fuel requirements” and, at the end of 1999, “did not hold any contracts to hedge future jet fuel costs.” Trans World Airlines, Inc., Annual Report (Form 10-K) (December 31, 1999), at 43. 31 Contemporaneous bankruptcy testimony from David Resnick, TWA’s investment banker, confirms my analysis. At the January 27, 2001 hearing in the TWA bankruptcy, Resnick testified that TWA “doesn’t have the creditworthiness” to hedge its fuel expenses. In re TWA, January 27, 2001 Testimony of David Resnick, at 34:11.

12
hedge against rising fuel costs.32 During 1999 and 2000, airlines that failed to hedge fuel
purchases, like TWA, paid approximately 35% to 40% more than those that did hedge fuel
purchases.33
In the second half of 1999 and into 2000, the price of fuel increased significantly and, as
a result, so did TWA’s fuel expense. Moreover, every one-cent increase in the average cost per
gallon of jet fuel resulted in an increase in TWA’s fuel expense of approximately $6.8 million
per year.34 This had an extremely negative impact on TWA because the increase in cost was not
offset by increases in fares or fuel surcharges.35 As such, TWA's fuel expenses went from 12.0%
of revenue in 1999 to 17.9% of revenue during the first quarter of 2001. Table 1 below presents
a historical annual summary of TWA’s fuel expenses.
Table 1 : Fuel Expense Summary
Quarter Ended(USD in Thousands) 12/31/1996 12/31/1997 12/31/1998 12/31/1999 12/31/2000 3/31/2001
Trans World Airlines, Inc.(1)
Fuel Expense 585,163$ 480,853$ 344,603$ 396,517$ 612,158$ 140,929$ As a % of Revenue 16.5% 14.4% 10.6% 12.0% 17.0% 17.9%
Peer Group Average (2) 14.4% 13.9% 10.7% 10.8% 15.8% 16.3%
Historical Year Ended
(1) TWA's 2000 fuel expense (and revenue) computed utilizing the actual results for 11 months ended November 2000 plus Management's estimate for December 2000 per the November 2000 TWA Financial Management Report [ALPA 054447]. TWA's Q1 2001 fuel expense (and revenue) computed utilizing the actual results forthe 3 months ended March 2001 per the March 2001 TWA Financial Management Report [ALPA 054307].(2) Calculated as the average from the guideline company set.
2. Aircraft Rent
The negative impact of TWA’s rising fuel costs on its financial condition was
compounded by its aircraft modernization costs and uncompetitive lease rates. Due to TWA’s
need and desire to modernize its fleet upon emerging from bankruptcy in 1995, TWA found
itself in a “seller’s market” where it was forced to take many aircraft deliveries at above-market
32 Palumbo Deposition at 32:22-33:13. 33 Standard & Poor’s Industry Surveys: Airlines (July 20, 2000), at 26. 34 Palumbo Affidavit at 11, ¶27. 35 Palumbo Deposition at 31:23-32:6.

13
rates.36 Further impacting TWA’s lease rates was its low credit rating, which also caused the
Company to accept above-market lease rates. Between these two factors, any potential long-
term benefits of a younger fleet were offset by TWA’s higher aircraft lease costs.37 As TWA
took delivery of new leased aircraft, TWA's aircraft rent expense increased approximately 84%
from $303 million in 1996 to $556 million in 2000. TWA’s total rent expense, as a percentage
of revenue, increased from approximately 9% of revenue in 1996 to 24% of revenue as of March
31, 2001. As of December 31, 2000, 177 of TWA’s 201 aircraft were under operating leases (15
of the remaining 24 aircraft were under capital leases).38 As explained in further detail below,
TWA did not have the available capital resources to meet its future minimum lease obligations or
to purchase replacement aircraft. Table 2 below presents a historical summary of TWA’s aircraft
rent expenses, which consistently increased from 1996 to 2001 (both in dollars and as a
percentage of revenue) and was much higher as a percentage of revenue than that of its peers.
Table 2 : Rent Expense Summary
Quarter Ended(USD in Thousands) 12/31/1996 12/31/1997 12/31/1998 12/31/1999 12/31/2000 3/31/2001
Trans World Airlines, Inc.(1)
Aircraft Rent 302,990$ 262,793$ 331,071$ 425,672$ 556,306$ 141,894$ Other Rent - 175,489 193,446 199,208 197,506 47,664 Total Rent 302,990$ 438,282$ 524,517$ 624,880$ 753,812$ 189,558$ As a % of Revenue 8.5% 13.2% 16.1% 18.9% 20.9% 24.1%
Peer Group Average (2) 11.5% 10.9% 10.5% 10.5% 10.4% 11.2%
Historical Year Ended
(1) TWA's 2000 aircraft rent expense (and revenue) computed utilizing the actual results for 11 months ended November 2000 plus Management's estimate forDecember 2000 per the November 2000 TWA Financial Management Report [ALPA 054447]. TWA's Q1 2001 aircraft rent expense (and revenue) computedutilizing the actual results for the 3 months ended March 2001 per the March 2001 TWA Financial Management Report [ALPA 054307].(2) Calculated as the average from the guideline company set.
3. Labor
In addition to rising fuel and aircraft rent costs, TWA’s labor costs also were increasing
in the time period leading up to its third bankruptcy filing. Although the number of TWA's
36 Palumbo Affidavit at 10, ¶23. 37 Palumbo Deposition at 39:13-39:18. 38 Palumbo Affidavit at 10, ¶22.

14
employees decreased 2.5% for the first nine months of 2000, the potential labor cost savings
from these reductions were offset by the August 1, 1999 and August 1, 2000 salary increases to
IAM-represented employees, Air Line Pilots Association (“ALPA”)-represented employees, and
non-contract employees.39 Table 3 below details a historical annual summary of TWA’s labor
expenses, which as a percentage of revenue, was much higher than that of its peers:
Table 3 : Labor Expense Summary
Quarter Ended(USD in Thousands) 12/31/1996 12/31/1997 12/31/1998 12/31/1999 12/31/2000 3/31/2001
Trans World Airlines, Inc.(1)
Labor Expense 1,254,341$ 1,228,315$ 1,226,420$ 1,270,645$ 1,336,592$ 325,813$ As a % of Revenue 35.3% 36.9% 37.6% 38.4% 37.1% 41.3%
Peer Group Average (2) 28.9% 28.9% 30.0% 30.3% 30.6% 33.9%
Historical Year Ended
(1) TWA's 2000 labor expense (and revenue) computed utilizing the actual results for 11 months ended November 2000 plus Management's estimate for December2000 per the November 2000 TWA Financial Management Report [ALPA 054447]. TWA's Q1 2001 labor expense (and revenue) computed utilizing the actualresults for the 3 months ended March 2001 per the March 2001 TWA Financial Management Report [ALPA 054307].(2) Calculated as the average from the guideline company set.
C. POOR FINANCIAL PERFORMANCE As a result of TWA’s inability to generate sufficient revenues, combined with its
increasing operating cost structure, TWA’s financial performance deteriorated significantly in
the period leading up to its bankruptcy filing in 2001. After emerging from bankruptcy in 1995,
TWA was unable to generate an operating profit (see Table 4 below). As explained by one
analyst, “while TWA has undertaken a well-defined series of initiatives to increase revenues and
reduce costs – the simple fact is that the profits remain distinctly elusive. As the new millennium
approaches, it appears TWA will have racked up about $3.7 billion in losses for the past
decade.”40 Consistent with my observations and conclusions contained herein, American’s
management believed that TWA was losing money for the following reasons:
39 Palumbo Affidavit at 12, ¶28. These salary increases were aimed to restore union employees’ salaries from concessions given in TWA’s prior two bankruptcies, and to bring them more in line with industry averages. Trans World Airlines, Inc., Annual Report (Form 10-K) (December 31, 1999), at 13-14. 40 PaineWebber Incorporated, The Investext Group, Morning Meeting Note: Airlines: Sept. Earnings – Day 3; AMR, TWA, UAL & U (October 21, 1999), at 3.

15
TWA was over-leveraged with expensive aircraft leases;
TWA, due to financial weakness, had no ability to protect itself from high fuel prices through hedging;
TWA was saddled with the Carl Icahn agreement to sell him discounted tickets, which disrupted the Company’s whole pricing program; and
TWA had limited revenue-generating ability because it was a one-hub operation.41
TWA’s infrastructure cost versus its capacity to generate revenues was dramatically out
of sync.42 This is evident when comparing TWA’s unit revenues to its unit costs, or revenues per
available seat-mile (“RASM”) and costs per available seat-mile (“CASM”). Small fluctuations
in these metrics significantly affect a carrier’s financial results, especially in the case of TWA,
which had fewer internal financial resources and less access to external capital than many of its
major competitors.43 As displayed in Figure 4 below, the spread between TWA’s RASM and
CASM became inverted between 1998 and 1999.44 This gap significantly widened upon filing
for bankruptcy in 2001, due to a drastic reduction in the Company’s revenue. Generally
speaking, such an inverse relationship implies that the more TWA flew, the more money it lost.
A passenger carrier that continues to present a negative spread in its RASM / CASM
relationship and derivatively presents a negative operating margin is not financially viable.
TWA and its competitors measured these types of metrics in tenths of a cent, because when
multiplied by billions of available seat miles (“ASMs”), the economic consequences were
significant. Figure 4 below details the inverse relationship between TWA’s RASM and CASM.
41 ABN AMRO Equities: The Four Horsemen of the Apocalypse Plague of the Airlines (May 2001), at 16-17. 42 Palumbo Deposition at 17:1-17:8. 43 Palumbo Affidavit at 11, ¶26. 44 CASM as reported in TWA’s SEC filings, which excludes IAS, Getaway, earned stock, contract ratification and other special charges.

16
Figure 4 : TWA’s RASM and CASM
8.0
8.2
8.4
8.6
8.8
9.0
9.2
9.4
9.6
9.8
10.0
1996 1997 1998 1999 2000 Q1 2001
(In
Cen
ts)
CASM RASM
Source: TWA SEC filings (Form 10-K), TWA Financial Management Reports and Bureau of Transportation Statistics T-100 Segment data..
Operating margin is one key metric used to evaluate a carrier’s overall performance when
comparing its revenue generating activities to the costs of providing flight services. A positive
operating margin means that a carrier’s flight activities contribute to support the costs of business
overhead and interest costs on debts not directly associated with aircraft financing. Operating
margin is a critical component of Earnings before Interest, Taxes, Depreciation and
Amortization, or EBITDA, another key metric used to measure a passenger carrier’s cash
generating capability. From 1996 through 2001, TWA did not generate a positive operating
margin, and by 2000, TWA’s EBITDA margin had turned negative as well. Figure 5 below
details the deterioration in TWA’s operating and EBITDA margin.

17
Figure 5 : TWA’s Operating and EBITDA Margin
-20%
-15%
-10%
-5%
0%
5%
10%
1996 1997 1998 1999 2000 Q1 2001
EBITDA Margin Operating Margin
Source: TWA SEC filings (Form 10-K) and TWA Financial Management Reports. .
From an income statement perspective, TWA’s financial performance significantly
deteriorated beginning in 1999. Table 4 below summarizes the historical financial performance
of TWA, and shows that in the five years prior to TWA filing for bankruptcy in 2001, the
Company accumulated an aggregate $480 million and $1.1 billion in operating and net losses,
respectively. For the three months ended March 31, 2001, TWA’s operating losses totaled $126
million, a 21.3% increase from the same period in the prior year ($104 million).

18
Table 4 : Key Income Statement Metrics
Historical Year Ended Quarter Ended(USD in Thousands) 12/31/1996 12/31/1997 12/31/1998 12/31/1999 12/31/2000* 3/31/2001*
Revenue 3,554,407$ 3,327,952$ 3,259,147$ 3,308,712$ 3,605,854$ 787,973$
Operating Expenses (3,667,019) (3,357,212) (3,281,674) (3,441,831) (3,788,194) (913,981)
Operating Income (112,612)$ (29,260)$ (22,527)$ (133,119)$ (182,340)$ (126,008)$ Operating Income Margin -3.2% -0.9% -0.7% -4.0% -5.1% -16.0%
Net Income (284,815)$ (110,835)$ (120,481)$ (353,402)$ (213,414)$ (156,702)$ Net Income Margin -8.0% -3.3% -3.7% -10.7% -5.9% -19.9%
EBITDA 49,210$ 121,121$ 130,470$ 7,789$ (52,699)$ (93,670)$ EBITDA Margin 1.4% 3.6% 4.0% 0.2% -1.5% -11.9%
EBITDAR 352,200$ 559,403$ 654,987$ 632,669$ 701,113$ 95,888$ EBITDAR Margin 9.9% 16.8% 20.1% 19.1% 19.4% 12.2%
*TWA's 2000 results computed utilizing the actual results for 11 months ended November 2000 plus Management's estimate for December 2000 perthe November 2000 TWA Financial Management Report [ALPA 054447]. TWA's Q1 2001 results computed utilizing the actual results for the 3months ended March 2001 per the March 2001 TWA Financial Management Report [ALPA 054307].
D. INADEQUATE CAPITAL RESOURCES AND LIQUIDITY TWA’s ability to maintain adequate capital and liquidity to fund its operations and meet
its financial obligations depended on its ability to improve operating results by generating
increased revenues and controlling costs or, if insufficient, on its ability to attract new capital.45
Due to TWA’s inability to improve its operating performance, TWA explored strategic
alternatives (discussed in greater detail below) and other methods to externally recapitalize.
TWA’s capital raising efforts included (1) shopping its interest in Worldspan, and (2) soliciting
capital markets (investors and insurance companies), non-traditional financing sources (aircraft
lessors) and asset based lenders in an attempt to find a counterparty to refinance its $100 million
accounts receivable financing which matured on January 15, 2001 (discussed in greater detail
below). Ultimately, these efforts proved unsuccessful.46
45 Trans World Airlines, Inc., Annual Report (Form 10-K) (December 31, 1999), at F-10. 46 2001 Palumbo Transcript at 21:24-32:14.

19
By December 31, 2000, TWA had utilized all of its available credit lines and had no
undrawn debt capacity. Substantially all of TWA’s strategic assets, including its owned aircraft,
ground equipment, gates, parts inventory, and slots were pledged to secure various issues of
outstanding indebtedness of TWA. TWA found itself with few strategic assets that it could
readily monetize, as most were subject to various liens and security interests which would
restrict and/or limit TWA’s ability to realize any significant proceeds from the sale thereof.47
TWA’s only material unencumbered assets were its 26.3% interest in Worldspan and its interest
in Equant N.V., which represented a potential source of collateral for TWA.48 TWA’s books and
records reflected a negative net worth of approximately $440 million, or approximately 21.5% of
its asset base, as of December 31, 2000. TWA’s negative net worth would further deteriorate as
assets were shed in bankruptcy and marked to market. Generally, capital intensive businesses
that have negative net worth over multiple reporting periods are considered to be “at risk” for
bankruptcy or liquidation. As displayed in Table 5 below, TWA was over-levered and had
negative net worth over multiple reporting periods, and was book insolvent.
47 Trans World Airlines, Inc., Annual Report (Form 10-K) (December 31, 1999). See also Palumbo Affidavit at 11, ¶26 (noting that “TWA…has fewer internal financial resources and less access to external capital than many of its major competitors. The reduction in the amounts of TWA's available cash and cash equivalents, coupled with TWA's already extremely limited amount of strategic assets available to support additional indebtedness, have made TWA extremely susceptible to liquidity shortfalls, particularly those caused by external events.”). 48 Trans World Airlines, Inc., Quarterly Report (Form 10-Q) (September 30, 2000). The estimated fair value of TWA’s interest in Equant N.V. was approximately $27 million. The estimated fair value of TWA’s interest in Worldspan was approximately $200 million to $300 million. 2001 Palumbo Transcript at 23:13-23:15.

20
Table 5 : TWA’s Capitalization
Historical Year Ended(USD in Thousands) 12/31/1996 12/31/1997 12/31/1998 12/31/1999 12/31/2000*
Capitalization
9.8% A/R Asset Backed, Series 1997-1 -$ 100,000$ 100,000$ 100,000$ 12% Senior Secured Notes due 1998 111,799 - - - 12% Senior Secured Notes due 2002 - 43,255 44,427 45,821 11.5% Senior Secured Notes due 2004 - 138,360 138,522 138,704 11.375% Senior Unsecured Notes due 2006 - - 150,000 150,000 8% IAM Backpay Notes 12,090 13,354 14,936 16,927 PBGC Notes 198,672 141,243 - - Worldspan Note 31,224 31,224 31,224 - Capital Leases 263,291 219,990 200,911 165,807 Other Debt 347,147 320,496 204,801 216,537
Total Funded Debt 964,223$ 1,007,922$ 884,821$ 833,796$ 815,043$
PV of Operating Leases (7x) 2,120,930 3,067,974 3,671,619 4,374,160 5,276,684 Total Debt 3,085,153$ 4,075,896$ 4,556,440$ 5,207,956$ 6,091,727$ % of Total Capital 92.8% 93.8% 96.1% n/m n/m
Preferred Stock 96$ 121$ 119$ 123$ 92$ Stockholders' Equity 238,009 268,163 185,203 (171,033) (439,596) Total Equity 238,105$ 268,284$ 185,322$ (170,910)$ (439,504)$
% of Total Capital 7.2% 6.2% 3.9% n/m n/m
Total Capital 3,323,258 4,344,180 4,741,762 5,037,046 5,652,223
Cash Flow Coverage
Funded Debt / EBITDA 19.59x 8.32x 6.51x n/m n/m
Total Debt / EBITDAR 8.76x 7.29x 6.90x 8.23x 8.69x
Detail Not Available
*TWA's 2000 balance sheet and income statement amounts obtained from the March 2001 TWA Financial Management Report [ALPA 054309] andthe November 2000 TWA Financial Management Report [ALPA 054447], respectively.
By December 31, 2000, TWA's consolidated cash and cash equivalents balance had
declined below the minimum levels needed to continue operations. The Company had $329
million in debt maturing in one year or less and had accumulated a significant working capital
deficiency. This significantly constrained the Company’s liquidity. Table 6 below details
TWA’s liquidity constraints and it inability to meet it current maturing obligations.

21
Table 6 : Key Liquidity Metrics
Historical Year Ended(USD in Thousands) 12/31/1996 12/31/1997 12/31/1998 12/31/1999 12/31/2000*
Cash 181,586$ 237,765$ 252,408$ 180,443$ 102,115$ Less: Current Maturities (134,948) (88,460) (149,403) (105,744) (329,287)
Excess (Deficit) 46,638$ 149,305$ 103,005$ 74,699$ (227,172)$
Cash 181,586$ 237,765$ 252,408$ 180,443$ 102,115$ As a % of Revenue 5.1% 7.1% 7.7% 5.5% 2.8%
Net Working Capital (incl. cash) (201,468)$ (215,528)$ (248,022)$ (365,259)$ (586,281)$ As a % of Revenue -5.7% -6.5% -7.6% -11.0% -16.3%
Current Ratio 65.0% 67.6% 60.4% 51.0% 31.3%(Current Assets / Current Liabilities)
*TWA's 2000 balance sheet amounts obtained from the March 2001 TWA Financial Management Report [ALPA 054309].
Included in TWA’s $329 million current debt maturities was the $100 million
outstanding balance of the Company's 9.8% Airline Receivable Asset Backed Notes (“AR
Notes”), which matured on January 15, 2001.49 Compounding TWA’s immediate cash needs to
repay the AR Notes, the Company also experienced its largest operating losses and lowest cash
balances during the first quarter of the year, as a result of cyclicality in the industry.50 TWA
anticipated expending net cash of approximately $70 million to $80 million for the month of
January 2001 under normal operating conditions.51 Between TWA’s maturing AR Notes and
January’s net cash needs, the Company did not have sufficient cash to continue operating.52 As
an illustrative example of how dire TWA’s cash position was, at December 31, 2000 TWA had
approximately $102 million in cash, or 2.8% of revenues, while the average cash balance of
TWA’s peer group was $1.0 billion, or 12.2% of revenue.
49 Trans World Airlines, Inc., Annual Report (Form 10-K) (December 31, 1999), at F-10; 2001 Palumbo Transcript at 11:23-12:3. 50 Trans World Airlines, Inc., Annual Report (Form 10-K) (December 31, 1999), at 40. 51 2001 Palumbo Transcript at 12:3-12:6. 52 2001 Palumbo Transcript at 11:21-12:10; Palumbo Deposition at 117:14-117:17.

22
During the course of TWA’s restructuring efforts, American commenced an acquisition
of substantially all of the assets of the Company, whereby American initially provided
approximately $200 million of DIP financing to fund TWA’s immediate liquidity needs. The
Bankruptcy Code offers DIP lenders superior seniority and enhanced security as an incentive to
lend to a company that otherwise would not be able to attract financing. American’s DIP
financing was secured by certain TWA receivables generated post-petition, and by liens on
substantially all of the Company’s assets. As part of the Chapter 11 proceeding, TWA obtained
Bankruptcy Court authorization to sell its assets to American in the context of an open auction
with court approved bidding procedures. The DIP financing from American allowed TWA to
continue operations and implement a Chapter 11 plan that maximized value for the benefit of all
creditors and other parties of interest.53
TWA initially drew approximately $145 million on American’s DIP facility, of which,
approximately $80 million was used to pay down the AR Notes and $65 million was used to
cover the Company’s working capital deficit.54 Shortly after drawing down the $145 million,
TWA needed an additional $130 million to fund its deteriorating operations and to restore
payments on its operating fleet,55 which TWA had deferred under Section 1110 of the
Bankruptcy Code. Absent the ability to make lease payments, TWA would have lost lease rights
to its operating fleet and, as a result, its ability to generate revenues. TWA therefore would have
had to terminate operations and proceed to liquidation.56 Based on my experience advising
financially distressed carriers in connection with aircraft lessors, the threat of repossession of
aircraft is of sufficient gravity to force lessees into making aircraft lease payments. Furthermore,
53 Palumbo Affidavit at 13-14. 54 2001 Palumbo Transcript at 12:20-13:7. 55 Palumbo Deposition at 123:14-124:21. 56 Palumbo Deposition at 123:14-124:21.
23
the inability of a passenger carrier to have certainty around its flight schedule is a basis to curtail
operations and avoid stranding passengers and the adverse publicity arising from an event of this
nature. Prior to American’s financing, TWA’s “self-help” efforts were an attempt to keep the
Company viable long enough until it found a strategic solution. The American transaction was
just that, and as explained by Mr. Compton, it was the equivalent of TWA catching the “Hail
Mary” pass.57 American’s DIP financing provided TWA with the only viable alternative to
immediate liquidation.58
E. OTHER OBSERVABLE MARKET EVIDENCE The financial deterioration of TWA can also be seen in the market pricing of TWA’s
publicly-traded secured debt, unsecured debt and equity share price. As displayed in Figure 6
below, TWA’s publicly-traded debt was priced at a significant discount to face value, which is
generally indicative of investors’ expectations that the company may default on its future debt
payments. The pricing of TWA’s debt was inversely correlated to the market’s estimate of the
probability of default by TWA. Figure 6 and Figure 7 below detail the trading prices of certain
TWA secured and unsecured bonds and TWA’s credit rating from the major rating agencies.
57 2001 Compton Transcript at 464:3-464:12. 58 2001 Palumbo Transcript at 15:11-15:14; Palumbo Deposition at 119:1-124:21; 2001 Compton Transcript at 383:5-383:13.

24
Figure 6 : TWA’s Unsecured and Secured Public Debt Pricing
0
10
20
30
40
50
60
70
80
90
100
Dec-98 Mar-99 Jun-99 Sep-99 Dec-99 Mar-00 Jun-00 Sep-00
Pric
e
Unsecured Senior Note (11.375% Mar. 06) Secured Senior Note (11.5% Dec. 04)
Figure 7 : TWA’s Credit Ratings
DateSenior Debt
Rating Classification
Senior Debt
Rating Classification
Jan-96 CCC Extremely Speculative WR Withdrawn
Mar-98 CCC Extremely Speculative B2 Highly Speculative
Jan-01 D In Default Caa1 Substantial Risks
Source: Bloomberg Database
Standard and Poor's Moody's
Given the deep discounts at which TWA’s debt was priced, it is not surprising to see that
TWA’s equity share price dropped significantly over the same time period. By the end of 2000,
TWA’s stock price effectively represented “option value,” as the underlying fundamentals of the
business did not support any intrinsic equity value. Figure 8 below details TWA’s share price
compared to the XAL equity index (a composite of the equity prices of the major airline
companies).

25
Figure 8 : TWA’s Share Pricing vs. Airline Index
$-
$2
$4
$6
$8
$10
$12
$14
$16
$-
$50
$100
$150
$200
$250
1998 1999 2000 2001
TWA
Pric
e
XA
L Pr
ice
XAL Index TWAIQ US Equity
My analysis of the market pricing of TWA’s publicly-traded secured debt, unsecured
debt, and equity share pricing presents observable market evidence that TWA was in severe
financial distress and confirms my conclusion that Company was not a financially viable airline.
F. SOLVENCY My analysis above demonstrates that by January 2001, TWA was in severe financial
distress and facing imminent liquidation. Given its mounting losses, unsustainably high cost
structure, and poor liquidity, I would expect to find that TWA was insolvent as of the time of its
bankruptcy filing. To test this assumption, I have performed an analysis of TWA’s solvency at
December 31, 2000, March 31, 2001 and June 30, 2001 (Valuation Dates) – the date range
covering the announcement and closing of the American transaction. To determine the solvency
of TWA, I performed a fair market valuation of TWA’s business. In estimating the Fair Market
Value59 (“FMV”) of the Total Invested Capital60 (“TIC”) of TWA, I used two standard valuation
59 Fair Market Value is defined as “the price at which the property would change hands between a willing buyer and a willing seller when the former is not under any compulsion to buy and the latter is not under any compulsion to sell, both parties having reasonable knowledge of relevant facts.” [IRS Revenue Ruling 59-60].

26
approaches: the Market Approach and the Income Approach.61 I valued TWA by applying these
techniques under the premise of the Company’s assets’ value to a prudent investor contemplating
retention and use of the assets in an ongoing business. A summary of my solvency analysis can
be found at Exhibit 3.
1. Market Approach
The Market Approach indicates the FMV of the invested capital of a business based on a
company’s market capitalization (if publicly-traded) and a comparison of the business to
comparable publicly-traded companies in its industry. Here, I estimate this approach using the
Guideline Publicly Traded Company Method.62
The Guideline Publicly Traded Company Method provides an indication of the FMV of
the invested capital of a business by comparing it to publicly-traded companies in similar lines of
business. An analysis of the market multiples of companies engaged in similar lines of business
yields insight into investor perceptions and, therefore, the value of the subject business. These
multiples are then applied to the operating results of the subject business to estimate the FMV of
the invested capital on a marketable, minority basis. One then considers an equity control
premium, if applicable, to indicate the FMV of the business on a marketable, controlling basis.63
In my application of the Guideline Publicly Traded Method, I considered publicly-traded
60 Total Invested Capital is defined as the sum of the market value of equity, gross debt, preferred stock, capitalized leases, and the present value of operating leases. 61 Another method for estimating the FMV of TWA could include the Underlying Asset Approach. However, I did not perform the Underlying Asset Approach as this approach is generally inappropriate for valuing a business under a going concern premise of value. 62 Additional Market Approaches include the Guideline Merged and Acquired Company Method and the Quoted Market Price Method. I did not perform the Guideline Merged and Acquired Company Method due to a lack of a sufficient number of transactions with available financial data pertaining to the operating lease obligations of the target companies. I did not directly rely on the Quoted Market Price Method, as this reflected the anticipated recovery/liquidation values for investors based on the merger terms with American. However, given the deep discounts at which TWA’s debt was trading and the negligible value of its equity shares, I did consider this method as evidence that the marketplace did not expect all creditors to receive full value on their claims, supporting my conclusion that TWA was insolvent at December 31, 2000. 63 A premium for control is applicable to the equity value of a company. In the case of TWA, my analysis showed that there was no equity value in the business and, therefore, I did not apply an equity control premium.

27
companies with similar lines of business, basis of competition, target markets, etc. A brief
description of the companies selected for the Guideline Publicly Traded Company Method for
TWA can be found at Exhibit 7.
For the basis of my analysis, I relied on two commonly used multiples: TIC to Revenue
and TIC to Earnings before Interest, Taxes, Depreciation, Amortization, and Rent
(“EBITDAR”).64 Note that I considered operating lease/rent expenses for TWA and the
Guideline Companies to be off-balance sheet debt and capitalized these amounts accordingly.65
Table 7 below details the FMV of the TIC of TWA and the resulting equity surplus / (deficit) as
of each Valuation Date. Under the Market Approach, TWA was insolvent at each Valuation
Date.
Table 7 : Guideline Publicly Traded Company Method Conclusions
TIC / Revenue Multiple TIC / EBITDAR Multiple
Valuation Date TICEquity Surplus /
(Deficit) TICEquity Surplus /
(Deficit) December 31, 2000 $ 3.61 billion $ (1.30 billion) $ 3.23 billion $ (1.68 billion)
March 31, 2001 3.80 billion (1.27 billion) 3.32 billion (1.75 billion)
June 30, 2001 3.57 billion (1.46 billion) 3.64 billion (1.39 billion)
Reference Exhibits 4-A, 4-B, and 4-C for detailed calculations leading to the above concluded values.
2. Income Approach
The Income Approach indicates the FMV of the invested capital of a business based on
the value of the cash flows that the business can be expected to generate in the future. The
Discounted Cash Flow Method, an application of the Income Approach, is comprised of four
steps:
1. Estimate the future cash flows for a certain discrete projection period;
64 EBITDAR is commonly used in the airline industry as rent and ownership costs can vary significantly among airlines due to differences in the way airlines finance their aircraft and other asset acquisitions. 65 See Page 14 of Exhibits 4-A, 4-B, and 4-C for capitalized lease analysis.

28
2. Discount these cash flows to their present value equivalents at a rate of return that considers the relative risk of achieving the cash flows and the time value of money;
3. Estimate the residual value of cash flows subsequent to the discrete projection period; and
4. Combine the present value of the residual cash flows with the discrete projection period cash flows to indicate the FMV of the invested capital of the business on a marketable, controlling basis.
In my application of the Discounted Cash Flow Method, I applied a variation commonly
referred to as the Capitalized Cash Flow Method.66 As part of my analysis I reviewed TWA’s
2001 budget; however, I did not view this budget to be a reliable estimate of the Company’s
future performance and, therefore, did not utilize this budget. Rather, in my application of the
Capitalized Cash Flow Method, I analyzed TWA’s historical cash flows to form a basis for
estimating a normalized residual cash flow.67 The normalized available cash flows were then
capitalized using a rate calculated by subtracting the residual growth rate from the respective
weighted average cost of capital (“WACC”). The WACC is an overall rate based upon the
individual rates of return for equity and interest-bearing debt. Table 8 below details the
estimated WACC for TWA as of each Valuation Date:
Table 8 : WACC Overview
Valuation Date WACCDecember 31, 2000 11.9%
March 31, 2001 11.4%
June 30, 2001 10.7%
Reference Exhibit 6 for detailed WACC calculations.
66 James R. Hitchner, Financial Valuation, Applications and Models, Third Edition, 2011, at 139. 67 In calculating the normalized cash flows, I excluded TWA’s operating lease/rent expense from the cash flows. I capitalized this operating lease/rent expense and considered it as a debt obligation.

29
The capitalized residual cash flow equals the FMV of the Total Invested Capital of TWA
and represents the amount an investor would pay today for the rights to the cash flows of the
business into perpetuity. Table 9 below details the FMV of the Total Invested Capital of TWA
and the resulting equity surplus / (deficit) as of each Valuation Date. Under the Income
Approach, TWA was insolvent at each Valuation Date.
Table 9 : Income Approach Conclusions
Valuation Date TIC Value Equity Surplus / (Deficit) December 31, 2000 $ 3.63 billion $ (1.28 billion)
March 31, 2001 3.80 billion (1.27 billion)
June 30, 2001 3.68 billion (1.35 billion)
Reference Exhibit 5 for detailed calculations leading to the above concluded values.
3. Fair Market Valuation Conclusion
Based on my application of the Market Approach and the Income Approach as described
above, I conclude that TWA (on a standalone basis) was balance sheet insolvent as of December
31, 2000, March 31, 2001 and June 30, 2001.

30
III. TWA’S INABILITY TO OPERATE AS A STAND ALONE AIRLINE
TWA’s Chapter 11 filings in 1992 and 1995 were unsuccessful in that they did not
prevent successive bankruptcy filings. For the reasons stated herein, TWA’s business model was
uncompetitive relative to the state of the industry in which it operated. After emerging from
bankruptcy in 1995, TWA’s competitive position among major carriers prohibited an organic
turnaround due to its lack of financial resources. As a result, Chapter 11 was not a solution to
TWA’s problems in 2001.68 Plaintiffs’ experts fail to recognize that a successful reorganization
and the ability to operate as a stand-alone airline was not an option for TWA in 2001.
Furthermore, Plaintiffs’ experts performed no independent analysis to determine the likelihood
of a successful TWA reorganization, but assumed as much:69
“Filing for bankruptcy has very little to do, if anything to do, with whether you stop flying…most of the airlines we fly every day have been in bankruptcy at one point or another it seems to me, and they don't stop flying. So I didn't really take very seriously that TWA was just going to stop flying.”70
In fact, the opposite is true. Few airlines that have filed for bankruptcy are still in business
today. In 2005, the United States Government Accountability Office performed a study and
determined that of the 146 airline Chapter 11 filings since 1979, only 16 airlines were still in
business.71 Bankruptcy protection was costly to debtor airlines, usually resulted in a loss of
control by shareholders (and occasionally management) and initially damaged relations with
employees, investors, and suppliers. While bankruptcy provided some immediate protection
68 Additionally, TWA did not have adequate resources to finance its Chapter 11 proceeding in 2001. See Palumbo Deposition at 99:1-99:10. 69 Dr. Farber believes that the only clear indicator that an airline will cease flying is if you “[s]how up at the airport and the plane didn’t take off.” Farber Deposition (Day 2) 43:15-55:21. 70 Farber Deposition (Day 1) 83:6-83:12 and 169:17-169:25. 71 United States Government Accountability Office, Testimony before the committee on Transportation and Infrastructure, Subcommittee on Aviation: Commercial Aviation: Preliminary Observations on Legacy Airlines’ Financial Condition, Bankruptcy, and Pension Issues (June 22, 2005), GAO-05-835T at 10.

31
from creditors, most airlines that filed for bankruptcy were not able to avoid a subsequent
bankruptcy or liquidation.72
Below I address those factors that contributed to TWA’s deteriorating financial condition
and prohibited a stand-alone operation.
A. INDUSTRY CONSOLIDATION TWA’s domestic services were subject to intense competition from other carriers due to
the ease with which carriers, through strategic acquisitions and otherwise, could enter new
domestic markets and be extremely competitive.73 Since deregulation, consolidation through
mergers, acquisitions, and bankruptcies has been a major trend within the airline industry.74 As a
result, major airlines gained market share and control over markets and competing airlines. This
concentration was further compounded through global marketing alliances and code-sharing
agreements with regional carriers.75 TWA's major competitors expanded their international
operations and increased their domestic market presence, and thereby strengthened their overall
operations to the detriment of TWA.76
Many of TWA’s competitors increased their domestic market presence and expanded
international operations by transporting passengers connecting with or otherwise traveling on
alliance carriers. Such alliances further intensified the competitive environment in which TWA
operated.77 TWA’s competitors formed four major global airline alliances: (1) Star Alliance
anchored by United Airlines and Lufthansa; (2) Oneworld with American and British Airways;
72 United States Government Accountability Office, Testimony before the committee on Transportation and Infrastructure, Subcommittee on Aviation: Commercial Aviation: Preliminary Observations on Legacy Airlines’ Financial Condition, Bankruptcy, and Pension Issues (June 22, 2005), GAO-05-835T at 3. 73 Trans World Airlines, Inc., Quarterly Report (Form 10-Q) (September 30, 2000), at 10. 74 Reference Exhibit 8 and Exhibit 9 for a timeline of M&A activity and bankruptcies in the airline industry since deregulation. 75 Standard & Poor’s Industry Surveys: Airlines (July 20, 2000), at 7. 76 Trans World Airlines, Inc., Quarterly Report (Form 10-Q) (September 30, 2000), at 10. 77 Trans World Airlines, Inc., Quarterly Report (Form 10-Q) (September 30, 2000), at 10.

32
(3) the SkyTeam alliance between Delta and Air France; and (4) Wings, which included KLM
and Northwest Airlines.78 These alliances allowed carriers to enter domestic and international
markets that were otherwise too expensive to serve with their own aircraft, or were restricted
under a bilateral aviation agreement with another nation.79 These aligned airlines were able to
offer a higher level of flight frequencies and, as a result, capture significant market share in a
given market while driving out other airlines with lesser presence by making it unprofitable for
them to compete.80 These benefits were accomplished without requiring substantial investment
in additional aircraft, airport facilities, or route authority. Furthermore, aligned airlines were
able to recognize cost savings by (1) sharing cargo and passenger terminal facilities, (2)
integrating frequent-flyer programs, (3) consolidating sales, maintenance, and administrative
operations, (4) combining information technologies, (5) coordinating advertising, and (6)
engaging in joint procurement where feasible.81 With limited options for alliance partners, TWA
needed to find a strategic partner in order to remain competitive in a consolidating industry and
survive as a stand-alone airline.82
TWA had discussions with essentially every airline that was certified in the U.S. in an
attempt to find a strategic partner, including extensive discussions with America West,
Northwest, Continental, Delta and American.83 There was not a point in time subsequent to
emerging from bankruptcy in 1995 where TWA was not seeking a strategic partner.84 A merger
was TWA’s only option to preserve a going-concern value because TWA was a structurally
flawed airline, from both a financial and network perspective, and was not viable on its own.
78 Standard & Poor’s Industry Surveys: Airlines (July 20, 2000), at 15. 79 Standard & Poor’s Industry Surveys: Airlines (July 20, 2000), at 14. 80 United States Government Accountability Office, Report to Congressional Requesters, Aviation Competition: Effects on Consumers From Domestic Airline Alliances Vary (January 1999), GAO/T-RCED-99-37at 26. 81 Standard & Poor’s Industry Surveys: Airlines (July 20, 2000), at 15. 82 Palumbo Deposition at 98:13-99:14. 83 Palumbo Deposition at 99:19-100:3. 84 Palumbo Deposition at 97:23-98:1 and 97:4-97:8.

33
Mergers and acquisitions were used in the airline industry as a means to increase
revenues and expand networks by offering more seamless travel to more destinations. Mergers
and acquisitions also provided for cost savings benefits resulting from the (1) combination of
complementary assets, (2) elimination of duplicative activities and respective costs, and/or (3)
reduction in capacity, including the elimination of inefficient (or redundant) hubs or routes.
Mergers and acquisitions also permitted for other cost savings through facility consolidation,
procurement savings, and working capital and balance sheet restructuring, such as renegotiation
of aircraft leases.85 For TWA, a merger was the only potential solution to the Company’s
liquidity and operational challenges.86 Unfortunately for TWA, almost everyone TWA engaged
in discussions with saw no value in TWA as a going concern:87
"We recognized the viability of our airline was at stake, and we went knocking on doors to find a solution. There is not an airline of any size in America that we did not approach. There is not an airline of any size in America that did not have the opportunity to step in and join with us. No one was interested in TWA as a going concern."88
At the time of the American transaction, airline analysts recognized the unattractiveness
of TWA as a merger candidate due to its “weak financial and operational positions.”89 Only
American saw value in acquiring the struggling airline and preserving the flying franchise (to the
surprise of TWA),90 and was willing to provide much-needed DIP financing.91 The American
85 United States General Accounting Office, Testimony before the Committee on Commerce, Science, and Transportation, U.S. Senate, Airline Mergers: Issues Raised by the Proposed Merger of United and Continental Airlines (May 27, 2010), GAO-10-778T at 6. 86 Palumbo Deposition at 97:15-97:20. 87 Compton Deposition at 53:3-53:8 and Compton Deposition at 34:13-34:20. 88 Compton Deposition at 52:11-52:17. 89 ING Barings, Airline Consolidation: Short-Term Pain for Long-Term Gain (June 29, 2000), at 7. 90 Palumbo Deposition at 109:15-110:2. 91 Compton Deposition at 53:3-53:8. At the January 10, 2001 bankruptcy hearing, Palumbo testified that “while there were discussions,” no one other than American was willing to provide TWA with DIP financing. In re: TWA, January 10, 2001 Testimony of Michael Palumbo, at 58:11-59:24. Contemporaneous testimony from the bankruptcy proceeding confirms that TWA unsuccessfully attempted to obtain funding from the traditional capital markets, reinsurance agencies, and non-traditional lenders. See 2001 Palumbo Transcript, at 25:19-28:13.

34
transaction was the only alternative for TWA’s survival and, in part, saved thousands of jobs for
TWA employees:
“In our opinion, TWA employees are the luckiest employees in the world. They not only have had their jobs saved by AMR Corp., which acquired the defunct TWA assets in bankruptcy court, but now work for a much more stable airline and at higher wages to boot. It is almost as if the 20,000 employees have ‘hit the jackpot,’ in our view….What does AMR Corp. get out of the deal? The elimination of a failing carrier that was heavily discounting ticket prices and disrupting the whole pricing structure.”92
“TWA employees may be willing to accept the kind of seniority dilution that would be needed to appease American's workers, because the alternative might ultimately be no job for TWA staff.”93
Although Dr. Farber referred to a hypothetical transaction with Carl Icahn as an
alternative to the American transaction, he did not conduct any independent analysis of the
purported Icahn transaction or identify other viable alternative transactions.94 Based on my
review of TWA’s financial condition, and particularly the significant ongoing costs of the Icahn-
imposed Karabu ticketing agreement (discussed below), a hypothetical Icahn transaction that
required maintaining the Karabu agreement was not a realistic alternative to the American
transaction. Moreover, during TWA’s bankruptcy proceedings, Judge Walsh addressed the
Icahn proposal as follows: “[he] had no realistic or detailed plan for preserving TWA as a
standalone entity . . . [a]t best it was simply an opener for discussion.”95
B. NETWORK STRUCTURE TWA’s ability to survive as a stand-alone airline, and its competitive viability, were
significantly impaired by being a single-hub carrier. Because TWA only had one hub, its
92ABN AMRO Equities: The Four Horsemen of the Apocalypse Plague of the Airlines (May 2001), at 64. 93 Credit Suisse First Boston, Morning Meeting Notes: AMR to Purchase TWA, Significant US Airways Assets and 49% of DC Air; Industry Consolidation is Taking Shape (January 11, 2001), at 3. 94 Farber Deposition at 135:1-135:10 and 167:5-167:15; Farber Deposition (Day 2) at 8:9-8:23; Salamat Deposition at 88:13-88:15. 95 In re TWA, April 2, 2001 Order ¶ 39.

35
percentage of connecting traffic, compared to non-stop traffic, was much higher than that of its
competitors. Hub airports permitted carriers to offer increased non-stop service as well as
increased frequency for connecting service.96 Non-stop service was higher-yielding than
connecting service, and allowed major carriers to maintain pricing, particularly in periods of
general industry revenue weakness.97 In hub markets, competing non-hub airlines could not
achieve the high traffic densities needed to schedule the frequent non-stop flights desired by
local business travelers.98 TWA displayed the greatest reliance on connecting traffic at 55.5%,
compared to the other major carriers. Figure 9 below details the relationship of connecting and
non-stop traffic for TWA and the other major carriers at their respective hub airports.
Figure 9 : Non-Stop and Connecting Traffic at Hub Airports
0%
10%
20%
30%
40%
50%
60%
70%
80%
90%
100%
Alaska Continental United AmericaWest
American Northwest USAirways
Delta TWA
Connecting Non-StopSource: Salomon Smith Barney, Airlines: 1999 Hub Factbook, 1998.
TWA suffered by comparison to most of its competitors who had multiple hub
airports.99 Since substantially all of TWA’s major connecting traffic had to flow through STL,
96 Transportation Research Board, Special Report 255: Entry and Competition in the U.S. Airline Industry, Issues and Opportunities (1999), at 66. 97 Salomon Smith Barney, Equity Research: Airlines: 1999 Hub Fact Book (February 1998), at 7. 98 Transportation Research Board, Special Report 255: Entry and Competition in the U.S. Airline Industry, Issues and Opportunities (1999), at 72. 99 Palumbo Deposition at 46:21-47:1.

36
TWA’s ability to compete with multiple-hub carriers was significantly constrained.100
Furthermore, having multiple hub airports provided carriers operational synergies between
nearby hubs, and allowed for staggered connecting service and useful redundancy in the event of
weather disruptions at one hub.101 No other major carrier had fewer than three hubs; TWA had
one. A single-hub airline was not able to generate the profitability to make it competitive among
other major carriers.102 A single-hub operation more-closely resembled that of a regional carrier
than that of a major carrier.103 Table 10 below details the number and location of the hub
airports for TWA and the major carriers:
Table 10 : Hub Airports of TWA and Other Major Carriers
1 Anchorage 1 Columbus 1 Chicago 1 Cleveland 1 Atlanta 1 Detroit 1 St. Louis 1 Chicago 1 Baltimore2 Portland 2 Las Vegas 2 Dallas 2 Houston 2 Cincinnati 2 Memphis 2 Denver 2 Charlotte3 Seattle 3 Phoenix 3 Miami 3 Newark 3 Dallas 3 Minneapolis 3 Los Angeles 3 Philadelphia
4 Salt Lake City 4 San Francisco 4 Pittsburgh5 Washington
Source: Salomon Smith Barney, Airlines: 1999 Hub Factbook, 1998.
TWA United US AirwaysAlaska America West American Continental Delta Northwest
Compounding TWA’s challenges of only having one hub, were the population and
business characteristics of St. Louis, MO. STL was a relatively weak hub compared to the hub
cities of its competitors. Hub airports generally require a degree of concentration of both
population and corporate headquarters to ensure a proper mix of business and leisure travel, and
to allow a carrier to sustain a revenue operation that is designed around an infrastructure cost.
By 2001, the corporate headquarter landscape of St. Louis had deteriorated, which resulted in a
decline in business activity and high-value business traffic at STL.104 TWA’s revenue potential
was limited as it was not able to service national corporate clients out of STL.105 In addition,
100 Resnick Deposition at 66:5-67:10; 2001 Palumbo Transcript at 29:15-29:24. 101 Salomon Smith Barney, Equity Research: Airlines: 1999 Hub Fact Book (February 1998), at 18. 102 IN RE: TRANS WORLD AIRLINES INC., et. al., Proceeding Transcripts of David Resnick, dated January 27, 2001 at 66:11-66:13. 103 Resnick Deposition at 66:5-67:10. 104 Palumbo Deposition at 47:14-48:13; 2001 Palumbo Transcript at 29:3-29:24. 105 Resnick Deposition at 68:9-68:18.

37
STL had a lot of competition from other Midwest cities.106 Simply put, Mr. Resnick explained
the characteristics of STL as follows: “[i]f you had to pick any place in the U.S., St. Louis
wouldn't have been your choice.”107
C. REGIONAL AFFILIATES TWA was constrained in its ability to utilize regional-jet service. This placed the
Company at a competitive disadvantage compared to the other major carriers. Regional service
allowed major carriers to provide service to smaller communities which otherwise could not
profitably support mainline operations.108 Major carriers were able to right-size their existing
mainline operations by adding regional service, whose seating capacity better matched existing
passenger traffic.109 As such, major carriers were able to transition unprofitable mainline
markets to regional affiliates, while continuing to feed profitable traffic flow from that market
into their hub networks.110 Regional service also allowed major carriers to extend their market
reach and efficiently provide new service in thin-traffic markets, and to realize the benefits of
increased traffic flow over their hub-and-spoke networks.111 Major carriers’ hubs were made
stronger through the addition of non-stop regional service in long, thin markets where traffic
would otherwise move over to competing hubs via connecting service.112 TWA’s ability to
106 Deutsche Bank, Airline Industry 3Q99 Preview: Industry Overview Sector: Air Transportation (October 14, 1999), at 6. 107 Resnick Deposition at 20:6-20:9. 108 United States General Accounting Office, Report to the Honorable Olympia J. Snowe, United States Senate: Aviation Competition: Regional Jet Service Yet to Reach Many Small Communities (February 2001), GAO-01-344 at 3. 109 United States General Accounting Office, Report to the Honorable Olympia J. Snowe, United States Senate: Aviation Competition: Regional Jet Service Yet to Reach Many Small Communities (February 2001), GAO-01-344 at 15. 110 Robinson-Humphrey: Eighth Annual Regional Airline Conference; The Source for Post-Deregulation Airlines (February 2, 1999), at 15. 111 Robinson-Humphrey: Eighth Annual Regional Airline Conference; The Source for Post-Deregulation Airlines (February 2, 1999), at 15. 112 Robinson-Humphrey: Eighth Annual Regional Airline Conference; The Source for Post-Deregulation Airlines (February 2, 1999), at 11.

38
utilize regional service was constrained due to scope-clause provisions and the Company’s poor
financial condition and credit worthiness.
Not all major carriers were able to participate equally in regional service due to
restrictions in pilot labor agreements, or “scope clauses.”113 Regional scope-clause provisions
differed from carrier to carrier, and placed restrictions on the number and/or size of regional jets
(“RJs”) a major carrier could operate. TWA’s scope-clause provisions were more restrictive, in
terms of the quantity of RJs the Company could operate, than those of the other major carriers.
Table 11 below details a summary of the regional scope-clause provisions included in TWA’s
and the other major carriers’ labor agreements. Compared to some of the other major carriers,
TWA’s scope-clause provisions were more restrictive in that they limited the Company’s ability
to utilize RJs.
Table 11 : Overview of RJ-Related Scope Clause Provisions
Major Airline Contract Term Main Provisions Relating to RJ UseAmerica West 1995-2000 There were no RJ-related scope restrictions.American 1997-2001 There was a limit of 67 RJs—with a maximum of 70 seats, a minimum of 45 seats, and an average of 50
seats—that applied to the airline’s entire commuter fleet. There was no limit on the number of RJs with fewerthan 45 seats.
Continental 1998-2002 There was no limit on the number of RJs that can be operated, but their size is limited to 59 seats; if this seatsize was exceeded, Continental pilots would be given the opportunity to fly RJs.
Delta 1996-2000 There was no limit on the number of RJs, but their size was generally limited to 70 seats.Northwest 1998-2002 There was a limit of 30 RJs until the number of narrow-body jets exceeded 347; then RJs could be added on a
one-for-one basis. The carrier could also place its code on 36 additional RJs operated by Mesaba (with lessthan 70 seats), and utilize other RJs operated by regional affiliates.
TWA 1998-2002 There was a limit of 30 RJs. The carrier could also operate 2 additional RJs for each additional aircraft in itsfleet above 180 until the fleet reached 188, and 1 additional RJ for each 2 additional aircraft above 188. RJ sizewas limited to 70 seats and cruise speed to 400 miles per hour.
United 1998-2000 This period’s agreement limited the maximum number of RJs to 65, with some provisions for adding more asthe overall fleet size increased.
2000-2004 This more-recent agreement allowed the carrier to deploy approximately 300 RJs by growing its mainline fleetand replacing 150 turboprops on a one-for-one basis.
US Airways 1998-2003 RJs were limited to either 35 total or 9 percent of the aircraft in US Airways’ fleet, whichever was larger. OnApril 7, 2000, the pilots and the airline signed an interim agreement allowing 35 additional 50-seat RJs.
Source: GAO, Aviation Competition, Regional Jet Service Yet to Reach Many Small Communities, February 2001, GAO-01-344.
113 RJ-related scope provisions in mainline pilot contracts continue to be a part of recent and ongoing negotiations between carriers and pilots. Scope clause agreements adopted in negotiations proximate to AMR’s acquisition of TWA generally allowed for significant increases in the number, but not in the seating capacity, of the regional jets that a carrier could operate with pilots not on that carrier’s seniority list.

39
In addition to TWA’s scope-clause provisions, its financial condition and
creditworthiness further impaired the Company’s ability to utilize regional service. During the
late-1990s, the market for regional service was a sellers’ market.114 Given the structure under
which major carriers purchased capacity with regional operators, the financial condition and
credit quality of the major airline was of significant importance to the regional operator. Since
TWA’s financial condition and credit quality was far less than that of its peers, there were more
attractive carriers for the regional operators to conduct business with.115 As displayed in Figure
10 below, TWA had fewer RJs in operation than that of the other major carriers.116
Figure 10 : Overview of Major Carriers’ RJ Operations 168
92 83
46 41
30 20
6
0
20
40
60
80
100
120
140
160
180
Delta Continental American United Northwest USAirways
AmericaWest
TWA
Source: GAO, Aviation Competition, Regional Jet Service Yet to Reach Many Small Communities, February 2001, GAO-01-344.
As Figure 10 illustrates, TWA thus was essentially locked out of the regional-jet market.
As a result, more of the regional revenues were flowing to the other carriers who had a greater
regional-service offering. TWA’s competitive position was negatively impacted, as traffic that
114 Palumbo Affidavit at 10, ¶23. 115 Palumbo Deposition at 50:25-54:5. 116 Number of RJs in operation as of October 2000.

40
otherwise would have found its way to STL instead found its way to competitors’ hubs more
efficiently and under better conditions.117
D. PRICING PRESSURE TWA’s potential for stand-alone viability was largely dependent on its ability to attract
higher-yield business travelers. TWA’s key initiatives were geared towards implementing
revenue-enhancing marketing initiatives and schedule realignments to appeal to business
travelers.118 Business travelers were relatively price-insensitive and permitted carriers to charge
a higher fare since travel was unrestricted and usually scheduled within short notice of
departure.119 Carriers relied upon business travelers to help cover the operating and capital costs
of maintaining schedule-intense networks.120 Major carriers’ profitability became increasingly
reliant on business travelers.121 This was also true for TWA. However, the Company’s
suboptimal network structure (as previously discussed) impaired its ability to attract high-value
business travelers. The only alternative for TWA was to try to capture a larger share of the
leisure market, which faced significant pricing pressure.
TWA also faced significant competition from Southwest Airlines, which was capturing
market share at STL. Southwest Airlines’ strategy was to serve short-haul, dense routes with
frequent flights. As such, Southwest Airlines did not rely on the traditional hub-and-spoke
network, and instead focused on markets with sufficient local traffic to sustain non-stop service.
This allowed for operating efficiencies, as Southwest Airlines minimized the amount of time its
aircraft were parked at gates. Southwest Airlines avoided congested airports in large cities, and
117 Palumbo Deposition at 50:25-54:5. 118 Trans World Airlines, Inc., Quarterly Report (Form 10-Q) (September 30, 2000), at 11. 119 Standard & Poor’s Industry Surveys: Airlines (July 20, 2000), at 16. 120 Transportation Research Board, Special Report 255: Entry and Competition in the U.S. Airline Industry, Issues and Opportunities (1999), at 4. 121 United States General Accounting Office, Report to Congressional Committees: Commercial Aviation: Legacy Airlines Must Further Reduce Costs to Restore Profitability (August 2004), GAO-04-836 at 15.

41
instead targeted many secondary, underused airports near larger cities. These airports usually
had fewer air traffic control delays, less congestion in aircraft and passenger ground handling,
and lower facility and service fees. As a result, Southwest Airlines was able to offer reduced
fares, which consequently resulted in increased passenger volume and market share.122
During the 1990s, the presence of Southwest Airlines was a key factor in competition and
pricing in the airline industry, and given its presence at STL, was an especially significant
competitive factor for TWA. Southwest Airlines constrained the price at which TWA could
charge passengers traveling on similar routes.123 Southwest Airlines had a significant impact on
TWA's pricing because, as a low-cost carrier, Southwest Airlines had lower operating costs than
TWA and was able to price more aggressively.124 The presence of Southwest Airlines on routes,
or even entry into end-point airports of a market pair, led to lower airfares.125 Figure 11 below
details the impact of Southwest Airlines’ fares on median fares of the major carriers, including
TWA.126
122 Transportation Research Board, Special Report 255: Entry and Competition in the U.S. Airline Industry, Issues and Opportunities (1999), at 50. 123 Palumbo Deposition at 49:12-50:2. 124 Resnick Deposition at 50:8-51:1. 125 United States General Accounting Office, Report to the Subcommittee on Aviation Operations, Safety, and Security, Committee on Commerce, Science, and Transportation, U.S. Senate: Airline Industry: Potential Mergers and Acquisitions Driven by Financial and Competitive Pressures (July 2008), GAO-08-845 at 39. 126 Long haul markets were not factored because Southwest Airlines carried few passengers beyond 1,500 miles.

42
Figure 11 : Pricing Impact of Southwest Airlines
$50
$70
$90
$110
$130
$150
$170
$190
$210
1992 1995 1998
(Med
ian
Fare
)
Major Carriers (Medium Haul) Southwest Airlines (Medium Haul)Major Carriers (Short Haul) Southwest Airlines (Short Haul)
Source: Transportation Research Board, Entry and Competition in the Airline Industry, Issues and Opportunities, 1999.
In addition to the pricing pressure from Southwest Airlines, TWA also experienced
pricing pressure from a discounted ticket program with Karabu, a company controlled by Carl
Icahn. In June of 1995 TWA and Karabu entered into a 99-month ticket agreement which
permitted Karabu to purchase discounted tickets from TWA.127 Through this agreement, Karabu
was able to purchase tickets from TWA at discounts ranging from 40% to 55%.128 The
agreement permitted Karabu to purchase two categories of discounted tickets: (1) "domestic
consolidator tickets," which were subject to a cap of $610 million, based on the full retail price
of tickets ($120 million in the first fifteen months and $70 million per year for seven consecutive
years through the term of the agreement), and (2) "system tickets," which were not subject to any
cap throughout the term of the agreement. Karabu would then market or sell the tickets through
travel agents or directly to the public at rates below what TWA was offering.129 As displayed in
Figure 12 below, from 1995 through 1999, the cumulative discounts received by Karabu
127 Trans World Airlines, Inc., Annual Report (Form 10-K) (December 31, 1999), at 24. 128 Karabu Ticket Program Agreement, between Trans World Airlines Inc. and Karabu Corp., dated June 14, 1995. 129 Trans World Airlines, Inc., Annual Report (Form 10-K) (December 31, 1999), at F-10; Compton Deposition at 23:10-24:7.

43
exceeded $411 million.130 Consequently, TWA’s revenue generating capabilities and its yield
were negatively impacted.
Figure 12 : Cumulative Discount Received by Karabu
0
100
200
300
400
500
600
700
800
900
1,000
1995 1996 1997 1998 1999
($ i
n M
illi
ons)
Ticket sales @ Full Published Fares Net Sales, After Applicable Discounts
Source: Trans World Airlines Form 10-K, December 31, 1999.
$411.2 Million
Cash flows from sales of discounted tickets to Karabu were applied to reduce certain
loans to TWA provided by entities controlled by Mr. Icahn ("Icahn Loans") and certain
promissory notes payable by TWA to the Pension Benefit Guaranty Corporation (the "PBGC").
By December 1997, TWA had repaid the outstanding balance of the Icahn Loans out of the
proceeds of a receivables securitization offering by the Company (AR Notes). By December
1998, TWA had repaid the PBGC promissory notes.131 This arrangement remained in place until
the day TWA’s assets were sold to American.132 When asked if the Karabu ticket program had
an impact on TWA's financial condition, Mr. Compton responded, “[i]t helped kill TWA.”133
130 Data for year-end 2000 not available. 131 Trans World Airlines, Inc., Annual Report (Form 10-K) (December 31, 1999), at F-12. 132 Compton Deposition at 23:10-24:22. 133 Compton Deposition at 24:10.

44
IV. CONCLUSION
By December 31, 2000, TWA was an airline on the verge of liquidation. TWA was beset
with major structural deficiencies that resulted in the Company’s gradual financial collapse, such
that it could not continue operations without rescue financing. TWA had virtually no
unencumbered resources from which to obtain financing under commercial terms and conditions.
American, under the special conditions of DIP financing, was able to advance funds to TWA and
purchase the Company in bankruptcy. The means by which American acquired TWA’s assets
explicitly demonstrates the lack of a viable business and a going concern. TWA’s poor operating
and financial condition was known to TWA’s management, its competitors, the equities and debt
markets, and airline industry analysts. Given TWA’s dire financial condition at December 31,
2000, it is unreasonable to assume that TWA would have continued as a going concern, or as an
entity that could have continued to meet its financial obligations for the foreseeable future,
including those of its unionized employees. As a result, I conclude that Plaintiffs’ experts are
incorrect in their assumption that TWA was financially or competitively viable as a stand-alone,
going-concern airline.
Respectfully submitted,
________________________ James S. Feltman Senior Managing Director Mesirow Financial Consulting, LLC 666 Third Avenue, 21st Floor New York, New York 10017 [email protected]

EXHIBIT 1
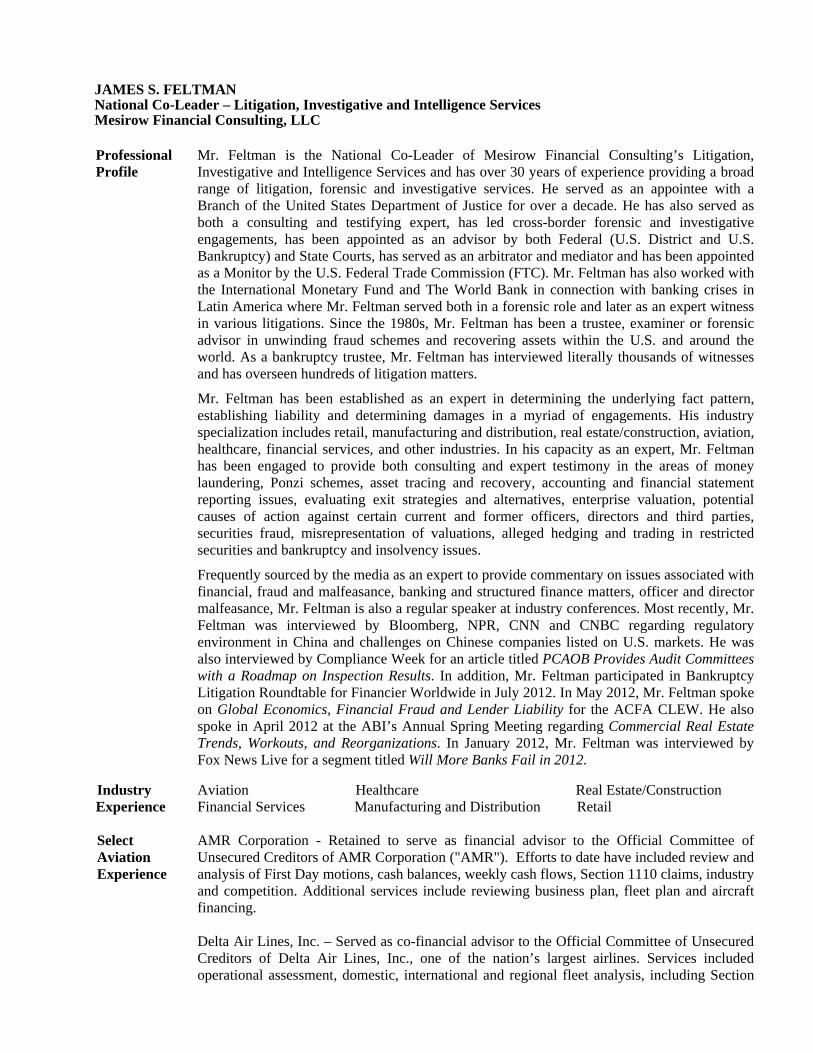
JAMES S. FELTMAN National Co-Leader – Litigation, Investigative and Intelligence Services Mesirow Financial Consulting, LLC
Professional Profile
Mr. Feltman is the National Co-Leader of Mesirow Financial Consulting’s Litigation, Investigative and Intelligence Services and has over 30 years of experience providing a broad range of litigation, forensic and investigative services. He served as an appointee with a Branch of the United States Department of Justice for over a decade. He has also served as both a consulting and testifying expert, has led cross-border forensic and investigative engagements, has been appointed as an advisor by both Federal (U.S. District and U.S. Bankruptcy) and State Courts, has served as an arbitrator and mediator and has been appointed as a Monitor by the U.S. Federal Trade Commission (FTC). Mr. Feltman has also worked with the International Monetary Fund and The World Bank in connection with banking crises in Latin America where Mr. Feltman served both in a forensic role and later as an expert witness in various litigations. Since the 1980s, Mr. Feltman has been a trustee, examiner or forensic advisor in unwinding fraud schemes and recovering assets within the U.S. and around the world. As a bankruptcy trustee, Mr. Feltman has interviewed literally thousands of witnesses and has overseen hundreds of litigation matters.
Mr. Feltman has been established as an expert in determining the underlying fact pattern, establishing liability and determining damages in a myriad of engagements. His industry specialization includes retail, manufacturing and distribution, real estate/construction, aviation, healthcare, financial services, and other industries. In his capacity as an expert, Mr. Feltman has been engaged to provide both consulting and expert testimony in the areas of money laundering, Ponzi schemes, asset tracing and recovery, accounting and financial statement reporting issues, evaluating exit strategies and alternatives, enterprise valuation, potential causes of action against certain current and former officers, directors and third parties, securities fraud, misrepresentation of valuations, alleged hedging and trading in restricted securities and bankruptcy and insolvency issues.
Frequently sourced by the media as an expert to provide commentary on issues associated with financial, fraud and malfeasance, banking and structured finance matters, officer and director malfeasance, Mr. Feltman is also a regular speaker at industry conferences. Most recently, Mr. Feltman was interviewed by Bloomberg, NPR, CNN and CNBC regarding regulatory environment in China and challenges on Chinese companies listed on U.S. markets. He was also interviewed by Compliance Week for an article titled PCAOB Provides Audit Committees with a Roadmap on Inspection Results. In addition, Mr. Feltman participated in Bankruptcy Litigation Roundtable for Financier Worldwide in July 2012. In May 2012, Mr. Feltman spoke on Global Economics, Financial Fraud and Lender Liability for the ACFA CLEW. He also spoke in April 2012 at the ABI’s Annual Spring Meeting regarding Commercial Real Estate Trends, Workouts, and Reorganizations. In January 2012, Mr. Feltman was interviewed by Fox News Live for a segment titled Will More Banks Fail in 2012.
Industry Experience
Aviation Financial Services
Healthcare Manufacturing and Distribution
Real Estate/Construction Retail
Select Aviation Experience
AMR Corporation - Retained to serve as financial advisor to the Official Committee of Unsecured Creditors of AMR Corporation ("AMR"). Efforts to date have included review and analysis of First Day motions, cash balances, weekly cash flows, Section 1110 claims, industry and competition. Additional services include reviewing business plan, fleet plan and aircraft financing. Delta Air Lines, Inc. – Served as co-financial advisor to the Official Committee of Unsecured Creditors of Delta Air Lines, Inc., one of the nation’s largest airlines. Services included operational assessment, domestic, international and regional fleet analysis, including Section

James S. Feltman Curriculum Vitae Page 2 of 9
1110 and related initiative, cost savings-structural and operational, fleet utilization, operational and financial analysis of the Plan of Transformation, merger and acquisition analysis and industry benchmarking. UAL Corporation – Served as financial advisor to the Official Committee of Unsecured Creditors of UAL Corporation (United Airlines), the nation’s second largest airline. Services included analyzing debtor-in-possession financing and liquidity, evaluating potential employee retention and severance plans, analyzing assumption and rejection issues regarding aircraft leases, licenses and executory contracts, monitoring financial results, reviewing business plans, analyzing valuation and distribution scenarios, evaluating merger and disposition scenarios and evaluating reorganization operating and financial strategies. Atlas Air Worldwide Holdings Inc. – Served as financial advisor to Atlas Air Worldwide Holdings Inc. in its Chapter 11 bankruptcy and related restructuring. The company is a worldwide cargo carrier that operates the largest Boeing 747 fleet in the world through its operating subsidiaries, Atlas Air, Inc. and Polar Air Cargo, Inc. Services included assessing the business plan and restructuring strategy, reviewing different plan scenarios and strategies, providing expert witness testimony on plan feasibility, analyzing substantive consolidation issues, reviewing financial and operating results, analyzing DIP financing and liquidity, analyzing assumption and rejection issues regarding executory contacts, analyzing creditor claims, and assisting in bankruptcy reporting requirements. Grupo Taca Holdings S.A. (“Grupo Taca”) and Affiliates – Grupo Taca is a privately owned group of repair station, freighter and national and international passenger carriers operating both a jet and turbo-prop fleet of approximately 100 aircraft. Post September 11, 2001, Mr. Feltman acted as the senior restructuring advisor to Grupo Taca and assisted the group of companies in an out-of-court arrangement with certain of its senior creditors. Aerial Transit – Aerial Transit was a company that transported cargo to the Caribbean and South America through Miami. The Company sought bankruptcy protection due to operational and financial issues. As a court-appointed Examiner and Liquidating Trustee, Mr. Feltman managed the Company’s business affairs and ultimately negotiated for sale of the aircraft, parts, accounts receivable and operating certificates. Aero Systems – Mr. Feltman acted as Liquidating Trustee to wind up sale and dissolution of bankrupt engine and overhaul service provider. AeroFloral – Mr. Feltman, acting as Trustee, managed the business affairs of and liquidated an air cargo carrier and refrigerated warehouse operator. This company specialized in the transport and distribution of perishable commodities including floral product and consumables (fruit, fish etc.). Aero Peru – Peru’s national airline, Aero Peru, carried both passengers and cargo, and sought the equivalent of bankruptcy protection in Peru. The Company’s U.S. operations were placed in an Ancillary Proceeding and Mr. Feltman was appointed as the Trustee for the U.S. component of the Aero Peru bankruptcy. Through negotiations and litigation both in the United States and Peru, Mr. Feltman liquidated the remaining assets and claims of the former airline. These negotiations included government agencies within Peru, labor unions and the Company’s former business partners, including foreign national airlines. Aviation Composites Services – Mr. Feltman, acting as Trustee, operated and liquidated an aircraft component overhaul and repair facility. This company specialized in the rebuilding

James S. Feltman Curriculum Vitae Page 3 of 9
and repair of aircraft frames, doors, flaps, rudders and wing parts. Fine Air Services Corp. – Fine Air was a large, privately owned international cargo carrier operating a 25 aircraft fleet. Fine Air’s primary business was as a schedule cargo carrier, operating on a worldwide basis. Mr. Feltman was the Senior Financial Advisor to the Company prior to and during the Company’s Chapter 11 bankruptcy. The Company was ultimately sold and is now operated under the name of it’s former subsidiary, Arrow Air. Gemini Air Cargo – A South Florida-based freighter ACMI and charter airline filed for Chapter 11 relief in late 2005. Mr. Feltman was retained by the DIP lender and equity sponsor to provide expert testimony on the value of the reorganized entity at exit from Chapter 11. The company submitted a plan of reorganization and has since successfully exited Chapter 11. International Aircraft Leasing – Mr. Feltman, acting as Chairman of the Creditors Committee, is negotiating various settlements of litigation matters including a $500MM+ failed leverage buyout of an aircraft lessor. Phoenix Continental Corp. – Mr. Feltman, acting as Trustee, operated and liquidated a privately owned aircraft leasing business. This company owned and leased approximately 40 aircraft located primarily within the contiguous United States. Piper Aircraft – Mr. Feltman, acting on behalf of a proposed acquirer, performed due diligence and related transaction services for the acquisition of the Piper Aircraft manufacturer. Rich International Airways – Rich International Airways was a large privately owned scheduled and chartered passenger airline operating internationally. Mr. Feltman was retained and acted as financial advisors for the Company, in conjunction with its Chapter 11 filing. Mr. Feltman was retained on a post-petition basis to act as Liquidating Trustee in the disposition of aircraft, engines and parts and to pursue litigation claims. Confidential - Mr. Feltman and Mesirow Financial Consulting were engaged by a publically traded regional passenger carrier to serve as investment bankers sourcing debt and equity in a recapitalization.
Education M.P.S., Cornell University B.A., University of Wisconsin, Madison
Professional Certifications
Certified Public Accountant - Florida Certified Fraud Examiner Certified in Financial Forensics
Professional Associations
American Bankruptcy Institute, board of directors - 4/02 - 4/08 American Institute of Certified Public Accountants, member Florida Institute of Certified Public Accountants, member
Honors and Awards
Fellow, American College of Bankruptcy

James S. Feltman Curriculum Vitae Page 4 of 9
Speaking Engagements
Compliance Week – January 2013 No Clear Solutions in Audit Standoff with China
Reuters.com – January 2013 Chinese Companies Retreat from U.S. Listings as Scrutiny Mounts
Bloomberg – December, 2012 SEC Auditor Case Seen Jeopardizing Chinese U.S. Listings
CNBC – December 2012 US/China Regulatory Standoff
National Public Radio – December, 2012 Feds Sue Chinese Audit Firms
Industry Week – December, 2012 Regulatory Clash: Lessons Learned through an East-Meets-West Dispute
Compliance Week – August 2012 PCAOB Provides Audit Committees with a Roadmap on Inspection Results
CNN – July 2012 Challenges for Chinese Companies listed on US markets
CNBC – July 2012 Regulatory Environment in China
Financier Worldwide – July 2012 Bankruptcy Litigation Roundtable (Article)
The Association of Commercial Finance Attorneys CLEW – May 2012 Global Economics, Financial Fraud and Lender Liability
The American Bankruptcy Institute 30th Annual Spring Meeting – April 2012 Commercial Real Estate Trends, Workouts, and Reorganizations
Fox News Live – January 2012 Will More Banks Fail in 2012?
Anti-Corruption Compliance Program – October 2011 The Gathering Storm: Anti-Corruption Compliance for Private Equity and Hedge Funds
National Conference of Bankruptcy Judges – October 2011 Financial Advisors in the Courtroom
Webinar – October 2011 China’s Red Flag: What Chinese companies must do to overcome issues surrounding transparency with the global investor community
The OffShore Alert Conference – April 2011 Offshore But Not Off-Limits: How Fraud Victims Can Obtain Relief in OFCs
The American Bankruptcy Institute 29th Annual Spring Meeting – March 2011 Cutting-Edge Litigation Issues: Ponzi Schemes, the Return of the Leveraged Buyouts, Valuation Disputes and More
American College of Bankruptcy – March 2011 Capital Markets Update
American Bankruptcy Institute – December 2010 Ponzi Scheme Cases: A New Look at Potential Sources of Recovery
FT Financial Restructuring Conference (London) – September 2010 Considerations for Turnaround Investing
American Bankruptcy Institute – July 2010 Ponzi Schemes and Other Scams for Bilking Money, from Madoff to Consumer Rip-offs
American Bankruptcy Institute – August 2009

James S. Feltman Curriculum Vitae Page 5 of 9
Ethical Issues for Lawyers Representing “Unusual” Clients American Bankruptcy Institute – August 2009
Prove It! Evidence in Bankruptcy Proceedings Kellogg Turnaround Management Conference – April, 2009
Negotiating in Creditors’ Committees Distressed Acquisitions for Strategic Advantage – September 2008
Analyzing the Risks of Absorbing a “Sick” Company – Do I Have the Right Team? VALCON – January 2008
Restructuring Options for Homebuilders, What's Different This Time? American Bankruptcy Institute – December 2007
Current Topics for Creditor Committees National Conference of Bankruptcy Judges – October 2007
Where Will Bankruptcy Work Come From in 2008? American Bankruptcy Institute – July 2007
Effective Pre-Bankruptcy Negotiating and Packaging American Bankruptcy Institute – July 2007
Drivers Impacting Credit and Capital Marketplace Association of Commercial Finance Attorneys – June 2007
Asset Based Lending American Bankruptcy Institute – Annual Spring Meeting, April 2007
Pensions and Benefits in Bankruptcy American Bankruptcy Institute – Caribbean Insolvency Symposium, February 2007
Liquidating Cross-Border Assets and Recovering Cross-Border Claims National Association of Credit Management, January 2007
Deepening Insolvency 13th Annual Aircraft Financing Forum, October 2006
The Bankruptcy & Restructuring Process: Current Airline and Creditor Issues American Bankruptcy Institute, September 2006
London International Insolvency Symposium - Aviation Panel National Association of Credit Management, January 2006
2006 Outlook and Current Topics (regarding distressed retailers) American Bankruptcy Institute, December 2005
Solemn Promise or Past Sin? Implications of Pension Terminations The Distressed Debt Summit, October 2005
Examining the Airline Industry: Where Does the Opportunity Lie? The Distressed Debt Summit, October 2005
Probing the Emerging Theory of Deepening Insolvency National Association of Credit Management, July 2004
Retailing Update National Association of Certified Valuation Analysts, June 2004
Exploring Investigative Techniques in Bankruptcy Fraud Cases American Conference Institute – Chapter 11 Finance, April 2004
Structuring Exit Financing & Post Confirmation Arrangements American Bankruptcy Institute, February 2004
Section 363 and the Emperor’s New Cloths – the Good, the Bad, and the Ugly of Asset Sales American Bankruptcy Institute, December 2003
Turf Wars Among Restructuring Professionals LatinFinance, November 2003
Turnaround Management and Corporate Restructuring in Latin America

James S. Feltman Curriculum Vitae Page 6 of 9
American Bankruptcy Institute, July 2003 Workout and Turnaround Skills
2003 Multi-Discipline Conference, July 2003 Bankruptcy / The Ins and Outs / New Developments and Solutions for Preferences
American Bankruptcy Institute, January 2003 New Developments in Corporate Fraud
American Institute of CPA’s, November 2002 Advanced Litigation Issues In Bankruptcy
American Bankruptcy Institute, April 2002 Various Topics In Bankruptcy
Renaissance American Management, Inc. & Beard Group, March 2002 Distressed Companies In Healthcare
Association of Insolvency & Restructuring Advisors, August 2001 Business Valuation in Bankruptcy
Renaissance American Management, Inc. & Beard Group, March, 2000 Healthcare Restructurings
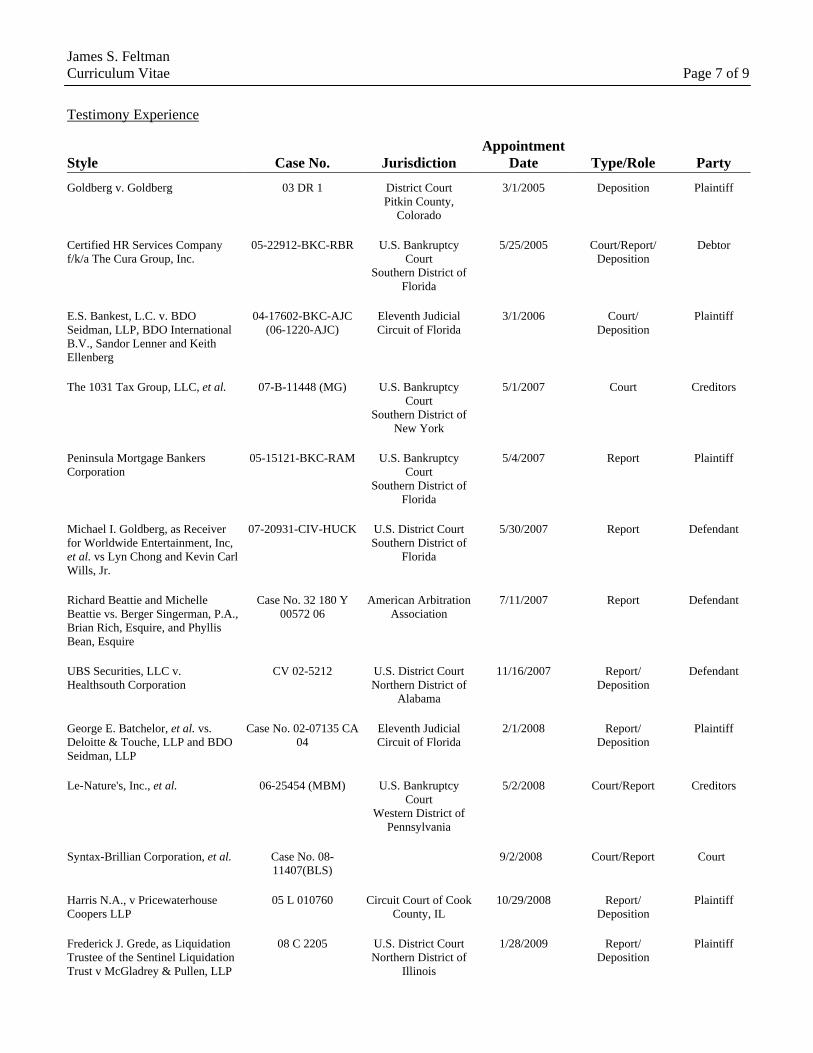
James S. Feltman Curriculum Vitae Page 7 of 9
Testimony Experience
Style Case No. Jurisdiction Appointment
Date Type/Role Party
Goldberg v. Goldberg 03 DR 1 District Court Pitkin County,
Colorado
3/1/2005 Deposition Plaintiff
Certified HR Services Company f/k/a The Cura Group, Inc.
05-22912-BKC-RBR U.S. Bankruptcy Court
Southern District of Florida
5/25/2005 Court/Report/ Deposition
Debtor
E.S. Bankest, L.C. v. BDO Seidman, LLP, BDO International B.V., Sandor Lenner and Keith Ellenberg
04-17602-BKC-AJC (06-1220-AJC)
Eleventh Judicial Circuit of Florida
3/1/2006 Court/ Deposition
Plaintiff
The 1031 Tax Group, LLC, et al. 07-B-11448 (MG) U.S. Bankruptcy Court
Southern District of New York
5/1/2007 Court Creditors
Peninsula Mortgage Bankers Corporation
05-15121-BKC-RAM U.S. Bankruptcy Court
Southern District of Florida
5/4/2007 Report Plaintiff
Michael I. Goldberg, as Receiver for Worldwide Entertainment, Inc, et al. vs Lyn Chong and Kevin Carl Wills, Jr.
07-20931-CIV-HUCK U.S. District CourtSouthern District of
Florida
5/30/2007 Report Defendant
Richard Beattie and Michelle Beattie vs. Berger Singerman, P.A., Brian Rich, Esquire, and Phyllis Bean, Esquire
Case No. 32 180 Y
00572 06 American Arbitration
Association 7/11/2007 Report Defendant
UBS Securities, LLC v. Healthsouth Corporation
CV 02-5212 U.S. District Court Northern District of
Alabama
11/16/2007 Report/ Deposition
Defendant
George E. Batchelor, et al. vs. Deloitte & Touche, LLP and BDO Seidman, LLP
Case No. 02-07135 CA 04
Eleventh Judicial Circuit of Florida
2/1/2008 Report/ Deposition
Plaintiff
Le-Nature's, Inc., et al. 06-25454 (MBM) U.S. Bankruptcy Court
Western District of Pennsylvania
5/2/2008 Court/Report Creditors
Syntax-Brillian Corporation, et al. Case No. 08-11407(BLS)
9/2/2008 Court/Report Court
Harris N.A., v Pricewaterhouse Coopers LLP
05 L 010760 Circuit Court of Cook County, IL
10/29/2008 Report/ Deposition
Plaintiff
Frederick J. Grede, as Liquidation Trustee of the Sentinel Liquidation Trust v McGladrey & Pullen, LLP
08 C 2205 U.S. District CourtNorthern District of
Illinois
1/28/2009 Report/ Deposition
Plaintiff

James S. Feltman Curriculum Vitae Page 8 of 9
Style Case No. Jurisdiction Appointment
Date Type/Role Party
and G. Victor Johnson
Frederick J. Grede, as Liquidation Trustee of the Sentinel Liquidation Trust v Bank of New York
08 C 2582 U.S. District Court -Northern District of
Illinois
1/28/2009 Court/Report/ Deposition
Plaintiff
Frederick J. Grede, as Liquidation Trustee of the Sentinel Liquidation Trust v FC Stone
09-00-136 U.S. District Court -Northern District of
Illinois
1/28/2009 Court/Report/ Deposition
Plaintiff
Frederick J. Grede, as Liquidation Trustee of the Sentinel Liquidation Trust v FTN
08 CV 6587
U.S. District Court -Northern District of
Illinois
1/28/2009 Report Plaintiff
Morton S. Goldfine, et al., v Barack Ferrazzano Kirschbaum Perlman & Nagelberg LLP, et al.
05 L 006360 Circuit Court of Cook County, IL
6/8/2009 Court/Report/ Deposition
Plaintiff
AASI Creditor Liquidating Trust v. Samsung Semiconductor, Inc.
Case No. 09-01443-LMI-A
U. S. District CourtSouthern District of
Florida
8/11/2009
Report Plaintiff
Tradewinds Airlines, Inc., Tradewinds Holdings, Inc., and Coreolis Holdings, Inc., Third-Party Plaintiffs v. C-S Aviation Services
03 CVS 12215 Superior Court County of Guilford,
North Carolina
9/15/2009 Court/Report/ Deposition
Plaintiff
Consejo De Defensa Del Estado De La Republica De Chile, v Espirito Santo Bank
09-20613-CIV-GRAHAM / TORRES
U. S. District CourtSouthern District of
Florida
9/20/2009 Report Defendant
Lakehouse West Ltd. et al. v Bank of America, N.A.
American Arbitration Association
10/1/2009 Court Defendant
Urbana Holdings, LLLP vs. Bank of America, N.A., Banc of America Securities, LCC, and Richard A. Gonsalves, individually
08-47824-CA-40 Circuit Court - Miami-Dade County,
Florida
10/1/2009 Report/ Deposition
Defendant
Amaranth, LLC vs. JP Morgan Chase and Company
Case No. 603756-07 Supreme Court of the State of New York
6/29/2010 Report Defendant
Howard M. Ehrenberg, Chapter 7 Trustee v BDO Seidman, LLP
Case No. 13 107 Y 0032909
American Arbitration Association
10/18/2010 Report Plaintiff
Rothstein Rosenfeldt Adler P.A. 09-34791-BKC-RBR U.S. Bankruptcy Court Southern
District of Florida
1/28/2011 Court/Report Plaintiff
SunTrust Bank, v Richard E. Larsen, Esq., as individual and Larsen & Associates, P.A.,
N/A 4/13/2011 Report Defendant
Fisher Island Investments, Inc.; Mutual Benefits Offshore Fund, Ltd., Little Rest Twelve Inc.
11-17047-BKC-AJC11-17051-BKC-AJC11-17061-BKC-AJC
U.S. Bankruptcy Court
Southern District of
4/19/2011 Court/Report Court

James S. Feltman Curriculum Vitae Page 9 of 9
Style Case No. Jurisdiction Appointment
Date Type/Role Party
Florida
Aurelius Capital Master, Ltd. and others v. The Minister for Finance –Republic of Ireland
4/1/2011 Report Plaintiff

EXHIBIT 2

Page 1 of 11
In performing my review and in preparing my expert report I, and others under my direction, have reviewed, in whole or in part, the following documents:
1. SEC Filings: o Trans World Airlines, Inc. September 30, 2000 Form 10Q o Trans World Airlines, Inc. June 30, 2000 Form 10Q o Trans World Airlines, Inc. March 30, 2000 Form 10Q o Trans World Airlines, Inc. December 31, 1999 Form 10K o Trans World Airlines, Inc. December 31, 1998 Form 10K o Trans World Airlines, Inc. December 31, 1997 Form 10K o AirTran Holdings, Inc. June 30, 2001 Form 10Q o AirTran Holdings, Inc. March 31, 2001 Form 10Q o AirTran Holdings, Inc. December 31, 2000 Form 10K o AirTran Holdings, Inc. June 30, 2000 Form 10Q o AirTran Holdings, Inc. March 31, 2000 Form 10Q o AirTran Holdings, Inc. December 31, 1999 Form 10K o AirTran Holdings, Inc. December 31, 1998 Form 10K o AirTran Holdings, Inc. December 31, 1997 Form 10K o Alaska Air Group, Inc. June 30, 2001 Form 10Q o Alaska Air Group, Inc. March 31, 2001 Form 10Q o Alaska Air Group, Inc. December 31, 2000 Form 10K o Alaska Air Group, Inc. June 30, 2000 Form 10Q o Alaska Air Group, Inc. March 31, 2000 Form 10Q o Alaska Air Group, Inc. December 31, 1999 Form 10K o Alaska Air Group, Inc. December 31, 1998 Form 10K o Alaska Air Group, Inc. December 31, 1997 Form 10K o America West Holdings Corporation June 30, 2001 Form 10Q o America West Holdings Corporation March 31, 2001 Form 10Q o America West Holdings Corporation December 31, 2000 Form 10K o America West Holdings Corporation June 30, 2000 Form 10Q o America West Holdings Corporation March 31, 2000 Form 10Q o America West Holdings Corporation December 31, 1999 Form 10K o America West Holdings Corporation December 31, 1998 Form 10K o America West Holdings Corporation December 31, 1997 Form 10K o AMR Corporation June 30, 2001 Form 10Q o AMR Corporation March 31, 2001 Form 10Q o AMR Corporation December 31, 2000 Form 10K o AMR Corporation June 30, 2000 Form 10Q o AMR Corporation March 31, 2000 Form 10Q o AMR Corporation December 31, 1999 Form 10K o AMR Corporation December 31, 1998 Form 10K o AMR Corporation December 31, 1997 Form 10K o AmTran, Inc. June 30, 2001 Form 10Q o AmTran, Inc. March 31, 2001 Form 10Q o AmTran, Inc. December 31, 2000 Form 10K

Page 2 of 11
o AmTran, Inc. June 30, 2000 Form 10Q o AmTran, Inc. March 31, 2000 Form 10Q o AmTran, Inc. December 31, 1999 Form 10K o AmTran, Inc. December 31, 1998 Form 10K o AmTran, Inc. December 31, 1997 Form 10K o Continental Airlines, Inc. June 30, 2001 Form 10Q o Continental Airlines, Inc. March 31, 2001 Form 10Q o Continental Airlines, Inc. December 31, 2000 Form 10K o Continental Airlines, Inc. June 30, 2000 Form 10Q o Continental Airlines, Inc. March 31, 2000 Form 10Q o Continental Airlines, Inc. December 31, 1999 Form 10K o Continental Airlines, Inc. December 31, 1998 Form 10K o Continental Airlines, Inc. December 31, 1997 Form 10K o Delta Air Lines, Inc. June 30, 2001 Form 10Q o Delta Air Lines, Inc. March 31, 2001 Form 10Q o Delta Air Lines, Inc. December 31, 2000 Form 10K o Delta Air Lines, Inc. June 30, 2000 Form 10K o Delta Air Lines, Inc. March 31, 2000 Form 10Q o Delta Air Lines, Inc. December 31, 1999 Form 10Q o Delta Air Lines, Inc. June 30, 1999 Form 10K o Delta Air Lines, Inc. December 31, 1998 Form 10Q o Delta Air Lines, Inc. June 30, 1998 Form 10K o Delta Air Lines, Inc. December 31, 1997 Form 10Q o Delta Air Lines, Inc. December 31, 1996 Form 10Q o Southwest Airlines Co. June 30, 2001 Form 10Q o Southwest Airlines Co. March 31, 2001 Form 10Q o Southwest Airlines Co. December 31, 2000 Form 10K o Southwest Airlines Co. June 30, 2000 Form 10Q o Southwest Airlines Co. March 31, 2000 Form 10Q o Southwest Airlines Co. December 31, 1999 Form 10K o Southwest Airlines Co. December 31, 1998 Form 10K o Southwest Airlines Co. December 31, 1997 Form 10K o Northwest Airlines Corporation June 30, 2001 Form 10Q o Northwest Airlines Corporation March 31, 2001 Form 10Q o Northwest Airlines Corporation December 31, 2000 Form 10K o Northwest Airlines Corporation June 30, 2000 Form 10Q o Northwest Airlines Corporation March 31, 2000 Form 10Q o Northwest Airlines Corporation December 31, 1999 Form 10K o Northwest Airlines Corporation December 31, 1998 Form 10K o Northwest Airlines Corporation December 31, 1997 Form 10K o UAL Corporation June 30, 2001 Form 10Q o UAL Corporation March 31, 2001 Form 10Q o UAL Corporation December 31, 2000 Form 10K o UAL Corporation June 30, 2000 Form 10Q o UAL Corporation March 31, 2000 Form 10Q o UAL Corporation December 31, 1999 Form 10K

Page 3 of 11
o UAL Corporation December 31, 1998 Form 10K o UAL Corporation December 31, 1997 Form 10K o US Airways Group, Inc. June 30, 2001 Form 10Q o US Airways Group, Inc. March 31, 2001 Form 10Q o US Airways Group, Inc. December 31, 2000 Form 10K o US Airways Group, Inc. June 30, 2000 Form 10Q o US Airways Group, Inc. March 31, 2000 Form 10Q o US Airways Group, Inc. December 31, 1999 Form 10K o US Airways Group, Inc. December 31, 1998 Form 10K o US Airways Group, Inc. December 31, 1997 Form 10K
2. Analyst Reports:
o Standard and Poor’s, Industry Surveys, Airlines, November 4, 1999 o Standard and Poor’s, Industry Surveys, Airlines, May 6, 1999 o Standard and Poor’s, Industry Surveys, Airlines, July 20, 2000 o Standard and Poor’s, Industry Surveys, Airlines, March 29, 2001 o Standard and Poor’s, Industry Surveys, Airlines, September 26, 2002 o Salomon Smith Barney, Equity Research: Airlines, June 4, 2001 o ABN AMRO, The Airline Industry- Major Carriers, May 2001 o ABN AMRO, The Four Horsemen of the Apocalypse Plague the Airlines,
May 2001 o ABN AMRO, The Airline Industry – Major Carriers, May 2001 o Credit Suisse First Boston, Equity Research, Airline Trends and Analysis,
May 2001 o ING Barings, Airlines, Massive Industry Consolidation May Not be as
Close as Many Think, January 29, 2001 o Morgan Stanley, Equity Research North America: Airlines, 4Q00
Earnings Preview, January 12, 2001 o ING Barings, Airlines Update – Q400 and Y200 Outlook, January 11,
2001 o Credit Suisse First Boston, AM Call, Airlines, AMR to Purchase TWA,
Significant US Airways Assets, January 11, 2001 o ING Barings, Airlines, Fourth-Quarter 2000 Earnings Under Continuing
Pressure from Fuel Costs, December 2000 o Salomon Smith Barney, Equity Research: Airlines, December 6, 2000 o ING Barings, Airlines, Third-Quarter 2000 Industry Report, November
21, 2000 o Credit Suisse First Boston, Equity Research: Airlines, UAL/US Airways
Merger Faces Uphill Battle; Impact of Election Outcome/Industry Developments May Surprise, November 14, 2000
o PaineWebber, Airlines: Day 4 - NWAC, TWA, UAL - UAL Rating Reduced, October 20, 2000
o ING Barings, Airlines, September Traffic Reports and Third-Quarter Outlook, October 13, 2000
o Salomon Smith Barney, Equity Research: Airlines, September 20, 2000 o Morgan Stanley, Airlines 2Q00 Recap, August 18, 2000

Page 4 of 11
o ING Barings, Mid-Year 2000 Airline Industry Report, August 2000 o Deutsche Bank, Airline Earnings Wrap-Up, August 7, 2000 o Morgan Stanley, Global Aviation Quarterly - Summer 2000 - Statistics for
Airline Investing, July 6, 2000 o ING Barings, Airline Consolidation: Short-Term Pain for Long-Term
Gain, June 29, 2000 o Morgan Stanley, U.S. Airlines EETC Update, June 6, 2000 o Salomon Smith Barney, 2001 Outlook, May 15, 2000 o Deutsche Bank , Airline Earnings Wrap-Up- A Review of 1Q00, May 10,
2000 o Salomon Smith Barney, Equity Research: Airlines, May 5, 2000 o Piper Jaffray, Airline EETCs, April 1, 2000 o Salomon Smith Barney, Equity Research: Airlines, March 17, 2000 o ING Barings, 2000 Industry Outlook, February 22, 2000 o Salomon Smith Barney, Equity Research: Airlines, December 23, 1999 o Donaldson, Lufkin & Jenrette, Transportation – Airlines, December 22,
1999 o Deutsche Bank, U.S. Airline Industry – 3Q99 Fleet and Capacity Update,
December 20, 1999 o The Buckingham Research Group, Airline Industry Review, December 14,
1999 o Salomon Smith Barney, Equity Research: Airlines, December 9, 1999 o Deutsche Bank, U.S. Airline Industry Monthly, December 6, 1999 o Deutsche Bank, U.S. Airline Industry Monthly, November 4, 1999 o CIBC World Markets, Airline Competition at the 50 Largest U.S. Airports
– Update, November 1, 1999 o PaineWebber, Airlines: Sept. Earnings – Day 3, October 21, 1999 o The Buckingham Research Group, Airline Industry Review, October 15,
1999 o Deutsche Bank, Airline Industry 3Q99 Preview, October 14, 1999 o Morgan Stanley, Equity Research Briefing Note, October 4, 1999 o Bear Sterns, Commercial Aviation: Will There Be a Winner?, October 1,
1999 o Donaldson, Lufkin & Jenrette, Airlines, September 10, 1999 o Salomon Smith Barney, Equity Research: Airlines, August 24, 1999 o Salomon Smith Barney, Equity Research: Airlines, August 3, 1999 o Deutsche Bank, Airline Industry 2Q99 Preview, July 13, 1999 o The Buckingham Research Group, Airline Industry Review, June 4, 1999 o Piper Jaffray, Airline EETCs, June 1, 1999 o Credit Suisse First Boston, Airlines: Pressures Mounting, But Few Major
Obstacles for the Majors After Four Great Years, June 1, 1999 o Salomon Smith Barney, Equity Research: Airlines – We Launch 2000
Estimates, May 20, 1999 o Salomon Smith Barney, Equity Research: Airlines – First Quarter 1999
Wrap-Up/Second Quarter 1999 Outlook, May 3, 1999 o Bear Sterns, Airline Management Survey, May 1, 1999

Page 5 of 11
o CIBC Oppenheimer, The U.S. Airline Industry, 1998-2003E — Aircraft Fleet Analysis, April 30, 1999
o Salomon Smith Barney, Airlines: 1999 Hub Factbook, February 26, 1998 o Salomon Smith Barney, 1999 Airline Fleet Handbook, February 26, 1999 o Salomon Smith Barney, Airlines: Fourth Quarter Wrap-Up/1999 Outlook,
February 9, 1999 o Robinson-Humphrey, Eight Annual Regional Airline Conference,
February 2, 1999 o CIBC Oppenheimer, Airline Competition at the 50 Largest U.S. Airports—
Update, December 18, 1998 o ING Barings, Expecting Better-than-Average Growth for Selective
Carriers, December 8, 1998 o Salomon Smith Barney, Airlines: Biting the Bullet on 1999, October 19,
1998 o BT Alex Brown Research, U.S. Airline Industry A Look At How The
Major And Regional Airlines Are Positioned To Weather The Next Recession, October 15, 1998
o Credit Suisse First Boston, The Radar Screen – Volume II, No. 22 What Will It Take to Turn Airline Stocks Around, September 15, 1998
o Warburg Dillon Read, Airline Quarterly Review, August 27, 1998 o ING Barings, The Airline Industry – 2Q98, August 10, 1998 o Salomon Smith Barney, Second Quarter Wrap-Up/Third Quarter Outlook,
July 31, 1998 o Salomon Smith Barney, U.S. Airline Valuation Guide, July 22, 1998 o Morgan Stanley, Airline Industry Review: Flying High, June 16, 1998 o Warburg Dillon Read, Airline Quarterly Review, May 27, 1998 o BT Alex Brown Research, U.S. Airlines Industry, March 26, 1998 o Salomon Smith Barney, Airline Competition at the 50 Largest U.S.
Airports—Update, March 12, 1998 o Donaldson, Lufkin & Jenrette, Equity Research: Airlines, March 10, 1998 o Robinson-Humphrey, Seventh Annual Regional Airline Conference,
February 3, 1998 o Morgan Stanley, Regional Airlines Monthly, January 14, 1998 o Credit Suisse First Boston, Radar Screen, The 1998 Collision Avoidance
System – Flying Over Obstacles to Outperformance, January 13, 1998 o Mergent Inc. – Company Report, Trans World Airlines, Inc., February 1,
2001 o Mergent Inc. – Company Report, Trans World Airlines, Inc., December 7,
2000 o Mergent Inc. – Company Report, Trans World Airlines, Inc., November 9,
2000 o Mergent Inc. – Company Report, Trans World Airlines, Inc., September
28, 2000 o CIBC World Markets, Lowering 3Q00 Forecast EPS, September 13, 2000 o Mergent Inc. – Company Report, Trans World Airlines, Inc., August 17,
2000
Page 6 of 11
o Mergent FIS – History & Debt, Trans World Airlines, Inc., July 25, 2000 o Mergent Inc. – Company Report, Trans World Airlines, Inc., July 21,
2000 o Mergent Inc. – Company Report, Trans World Airlines, Inc., June 15,
2000 o Mergent FIS – History & Debt, Trans World Airlines, Inc., April 4, 2000 o Mergent Inc. – Company Report, Trans World Airlines, Inc., March 30,
2000 o Salomon Smith Barney, TWA: 3Q99 Earnings Results, October 21, 1999 o CIBC World Markets, Lowering EPS Estimates, October 12, 1999 o CIBC World Markets, 1Q99 EPS Results, April 28, 1999 o ING Barings, Trans World Airlines New Management Making Progress,
August 11, 1998 o Salomon Smith Barney, Trans World Airlines, Uneven Turnaround in
Progress, July 21, 1998 o Morgan Stanley, Trans World Airlines, June 2, 1998
3. TWA Bankruptcy Documents: o Affidavit of Michael J. Palumbo, Executive Vice President and Chief
Financial Officer of the Debtors in Support of First Day Motions o Motion of the Debtors for an Order Pursuant to Sections 105(a), 363, and
1146(c) of the Bankruptcy Code (i) Authorizing the Debtors’ Sale of Substantially All of their Assets, Free and Clear of Liens, Claims, and Encumbrances, Subject to Higher and Better Offers (ii) Approving an Asset Purchase Agreement; and (iii) Approving the Assumption and Assignment of Certain Executory Contracts and Unexpired Leases in Connection with Such Sale
o Debtors’ Amended Motion for Order (A) Authorizing and Scheduling a Public Auction at which the Debtors will Solicit Bids for the Sale of Substantially All of their Assets, Free and Clear of Liens, Claims, and Encumbrances; (B) Approving Procedures for the Submission of Competing Offers; (C) Approving Certain Termination Rights, Expense Reimbursement and Other Bidding Rights Provisions; (D) Scheduling a Hearing to Consider Approval of Such Sale; and (E) Approving the Form and Manner of Notice of the Auction and Competing Offer Procedures Pursuant to Fed. R. Bankr. Proc. 2002
o Final Order (i) Authorizing Debtors to Enter into Postpetition Financing Agreement and Obtain Postpetition Financing Pursuant to Section 346(c) of the Bankruptcy Code and (ii) Granting Liens and Super-Priority Claims
o Order (A) Authorizing and Scheduling an Auction at which the Debtors will Solicit Bids for One or More Sales of or Other Transactions Concerning Substantially All of their Assets, Free and Clear of Liens, Claims, and Encumbrances; (B) Approving Procedures for the Submission of Competing Offers; (C) Approving Certain Termination Rights, Expense Reimbursement and Other Bidding Rights Provisions; (D) Scheduling a

Page 7 of 11
Hearing to Consider Approval of Such Transaction; and (E) Approving the Form and Manner of Notice of the Transactions and Competing Offer Procedures Pursuant to Fed. R. Bankr. Proc. 2002
o Palumbo Testimony, First Day Motions, January 10, 2001 o Judge Peter J. Walsh Opinion, April 2, 2001 o Notice of Appearance by Air Line Pilots Association and Request for
Service of Documents o Response of the Air Line Pilots Association to Objections of the Ad Hoc
Committee of Senior Noteholders and HSBC Bank USA, as Indenture Trustee, to Debtors’ Motion for An Order Approving the Sale of Substantially All of the Debtors’ Assets
o Statement of the Air Line Pilots Association to Debtors’ Motions for (a) Order Authorizing and Scheduling Public Auction and Approving Bidding Procedures, Termination Rights, Expense Reimbursement and Other Bidding Rights and Provisions and (b) Final Order Approving Post-Petition Financing and Granting Related Relief
o Opposition of AMR Corp., American Airlines, Inc., and AMR Finance, Inc. to Continental Airlines, Inc.’s Motion to Stay Bidding Procedures Order and Postpetition Financing Order Pending Appeal
o Response of AMR Corp., American Airlines, Inc., and AMR Finance, Inc. to Various Airport Authorities’ Motion for Reconsideration or to Alter/Amend Final Order Authorizing Debtors to Enter Into Postpetition Financing Agreement
o Objection of Statutory Committee of Unsecured Creditors to Debtors’ Motion for Authority to Sell Substantially All of their Assets, and to Assume and Assign Specified Executory Contracts to American Airlines, Inc.
o Opposition of Statutory Committee of Unsecured Creditors of Trans World Airlines, Inc. to Motion of Continental Airlines, Inc. for Stay Pending Appeal
o Response of Statutory Committee of Unsecured Creditors to Debtors’ Motion for Order Approving Procedures for, and Establishing the Date, Time, and Place for Hearing on (A) the Assumption, Assignment and/or modification of Certain Executory Contracts and Unexpired Leases; and (B) Rejection of Certain Executory Contracts and Unexpired Leases of the Debtors
o Notice of Continental Airlines, Inc.’s Motion to Stay Court’s Bidding Procedures Order and Postpetition Financing Order Pending Appeal, Pursuant to Fed. R. App. P. 8(A) and Fed. R. Civ. P. 62(C)
o Declaration of Bruce Grohsgal in Support of TWA’s Opposition to Motions for Stay by the High River Entities, the Official Committee of Unsecured Creditors and the Ad Hoc Committee of Senior Noteholders
o Motion to Shorten Time, and to Approve Form of Notice o Order Pursuant to Sections 105(a), 363, 365, and 1146(c) of the
Bankruptcy Code (i) Authorizing the Debtors’ Sale of Substantially All of their Assets, Free and Clear of Liens, Claims, and Encumbrances; (ii)

Page 8 of 11
Approving An Asset Purchase Agreement; and (iii) Approving the Assumption and Assignment of Certain Executory Contracts and Unexpired Leases in Connection with Such Sale
o Brief in Support of Motion for Order Directing the Appointment of an Official Committee of Equity Security Holders
o Notice of Appearance and Request for Service of Notices and Papers o Motion for Order Directing the Appointment of An Official Committee of
Equity Security Holders o Emergency Motion to Shorten Notice and for Expedited Hearing on the
Statutory Committee of Unsecured Creditors of Trans World Airlines, Inc., et al. Motion for Stay Pending Appeal Respecting Sale Order
o Motion by Trans World Airlines, Inc. for an Order Authorizing Rejection of Certain of Its Collective Bargaining Agreements Pursuant to 11 U.S.C. § 1113
o Declaration of Terry L. Hayes in Support of Motion Pursuant to 11 U.S.C. § 1113 to Reject Certain Collective Bargaining Agreements of Trans World Airlines, Inc.
o Notice of Emergency Motion and Motion of the Ad Hoc Committee of Senior Noteholders and HSBC Bank USA, as Indenture Trustee, for Stay Pending Appeal of Order Pursuant to Sections 105(a), 363, 365 and 1146(c) of the Bankruptcy Code (i) Authorizing the Debtors’ Sale of Substantially All of Their Assets, Free and Clear of Liens, Claims, and Encumbrances, Subject to Higher and Better Offers; (ii) Approving an Asset Purchase Agreement; and (iii) Approving the Assumption and Assignment of Certain Executory Contracts and Unexpired Leases in Connection with Such Sale
o Opposition of American Airlines, Inc. and AMR Finance, Inc. to the Emergency Motions of the Creditors Committee, the Ad Hoc Committee, and the High River Entities for Stay Pending Appeal of Order (i) Authorizing the Debtors Sale of Substantially All of their Assets, Free and Clear of Liens, Claims, and Encumbrances, Subject to Higher and Better Offers (ii) Approving an Asset Purchase Agreement; and (iii) Approving the Assumption and Assignment of Certain Executory Contracts and Unexpired Leases in Connection with Such Sale
o Objection of Air Line Pilots Association, International in Opposition to the Debtor TWA’s Motion for an Order Authorizing the Rejection of its Collective Bargaining Agreements Pursuant to 11 U.S.C. §1113 [Docket No. 986]
o Uncertified Transcript & Exhibits of Auction Proceedings Held at the Offices of Kirkland & Ellis, March 7, 2001
o Auction Proceedings Held at the Offices of Kirkland & Ellis, March 5, 2001
o Transcript of Proceedings before the Honorable Peter J. Walsh, Judge, March 9, 2001
o Transcript of Proceedings before the Honorable Peter J. Walsh, Judge, March 10, 2001
Page 9 of 11
o Transcript of Proceedings before the Honorable Peter J. Walsh, Judge, March 12, 2001
o First Day Motions before the Honorable Sue L. Robinson, Chief Judge, January10, 2001
o Transcript of Deposition of John Bachmann, January 24, 2001 o Transcript of Proceedings before the Honorable Sue L. Robinson, Chief
Judge, January 26, 2001 o Transcript of Proceedings before the Honorable Peter J. Walsh, Judge,
February 21, 2001 o Transcript of Proceedings before the Honorable Sue L. Robinson, Chief
Judge, January 27, 2001
4. Deposition Transcripts: o Deposition of Donald Carty, October 15, 2012 o Deposition of William Compton, January 18, 2013 o Deposition of Henry Farber, January 22, 2013 o Deposition of Henry Farber, January 23, 2013 o Deposition of Michael Palumbo, January 21, 2013 o Deposition of David Resnick, January 16, 2013 o Deposition of Rikk Salamat, January 29, 2013 o Deposition of Rikk Salamat, January 30, 2013 o Deposition of Rikk Salamat, January 31, 2013 o Deposition of Terry Hayes, January 28, 2013
5. Expert Reports:
o Expert Report of Rikk Salamat, October 12, 2012 o Expert Report of Rikk Salamat, December 31, 2012 o Expert Report of Henry Farber, October 12, 2012
6. Websites: o http://www.airlines.org/Pages/Home.aspx:
1. http://www.airlines.org/Pages/U.S.-Airline-Bankruptcies-and-Service-Cessations.aspx
2. http://www.airlines.org/Pages/U.S.-Airline-Mergers-and-Acquisitions.aspx
o http://www.dot.gov/ o http://www.rita.dot.gov/
7. TWA Internal Financial Statements:
o Trans World Airlines Financial Management Report, Month of January, 2001
o Trans World Airlines Financial Management Report, Month of February, 2001

Page 10 of 11
o Trans World Airlines Financial Management Report, Month of March, 2001
o Trans World Airlines Financial Management Report, Month of September, 2000
o Trans World Airlines Financial Management Report, Month of October, 2000
o Trans World Airlines Financial Management Report, Month of November, 2000
o Trans World Airlines Financial Management Report, Month of December, 2000
8. Other:
o United States General Accounting Office, Aviation Competition: Regional Jet Service Yet to Reach Many Small Communities, GAO-01-344
o United States General Accounting Office, Airline Competition: Issues Raised by Consolidation Proposals, GAO-01370T
o United States General Accounting Office, Commercial Aviation: Legacy Airlines Must Further Reduce Costs to Restore Profitability, GAO-04-836
o United States General Accounting Office, Commercial Aviation: Despite Industry Turmoil, Low-Cost Airlines Are Growing and Profitable, GAO-04-837T
o United States General Accounting Office, Commercial Aviation: Structural Costs Continue to Challenge Legacy Airlines’ Financial Performance, GAO-05-834T
o United States General Accounting Office, Commercial Aviation: Preliminary Observations on Legacy Airlines’ Financial Condition, Bankruptcy, and Pension Issues, GAO-05-835T
o United States General Accounting Office, Commercial Aviation: Bankruptcy and Pension Problems Are Symptoms of Underlying Structural Issues, GAO-05-945
o United States General Accounting Office, Airline Deregulation: Reregulating the Airline Industry Would Likely Reverse Consumer Benefits and Not Save Airline Pensions, GAO-06-630
o United States General Accounting Office, Airline Industry: Potential Mergers and Acquisitions Driven by Financial and Competitive Pressures, GAO-08-845
o United States General Accounting Office, Airline Mergers: Issues Raised by the Proposed Merger of United and Continental Airlines, GAO-10-778T
o United States General Accounting Office, Aviation Competition: International Aviation Alliances and the Influence of Airline Marketing Practices, GAO/T-RCED-98-131
o United States General Accounting Office, Aviation Competition: Proposed Domestic Airline Alliances Raise Serious Issues, GAO/T-RCED-98-215
o United States General Accounting Office, Aviation Competition: Effects on Consumers From Domestic Airline Alliances Vary, GAO/RCED-99-37
Page 11 of 11
o Transportation Research Board, Special Report 255: Entry and Competition in the U.S. Airline Industry, Issues and Opportunities
o Bloomberg Online Database o Blue Chip Economic Indicators, Top Analysts’ Forecasts Of The U.S.
Economic Outlook For The Year Ahead, Vol. 25, No. 10, October 10, 2000 o Ibbotson SBBI 2001 Valuation Yearbook o Ibbotson SBBI March 2001 Valuation Yearbook o Ibbotson SBBI June 2001 Valuation Yearbook o IRS Revenue Ruling 59 – 60 o James R. Hitchner, Financial Valuation, Applications and Models, Third
Edition, 2011 o 2000 Average State Tax Rate o 2001 Average State Tax Rate o Barra Beta o Federal Reserve Statistical Release January 2, 2001 o Federal Reserve Statistical Release April 2, 2001 o Federal Reserve Statistical Release July 2, 2001 o Karabu Ticket Program Agreement o Reuters Estimates Consensus Report, Alaska Air Group, Inc. o Reuters Estimates Consensus Report, AirTran Holdings, Inc. o Reuters Estimates Consensus Report, America West Holdings o Reuters Estimates Consensus Report, AMR Corporation o Reuters Estimates Consensus Report, Continental Airlines, Inc. o Reuters Estimates Consensus Report, Southwest Airlines Co. o Reuters Estimates Consensus Report, US Airways Group, Inc.

EXHIBIT 3

t
Trans World Airlines, Inc. Exhibit 3Solvency Analysis Page 1 of 1Summary(U.S. dollars in thousands) t
Market Approach Reference 12/31/2000 3/31/2001 6/30/2001
Guideline Publicly Traded Company Method Exhibit 4
TIC / LTM Revenue (1,300,377)$ (1,273,495)$ (1,455,327)$
TIC / LTM EBITDAR (1,681,414) (1,752,216)$ (1,393,328)$
Income Approach
Capitalized Cash Flow Method Exhibit 5 (1,277,066)$ (1,270,922)$ (1,349,425)$
Indicated Equity Surplus / (Deficit)

EXHIBIT 4
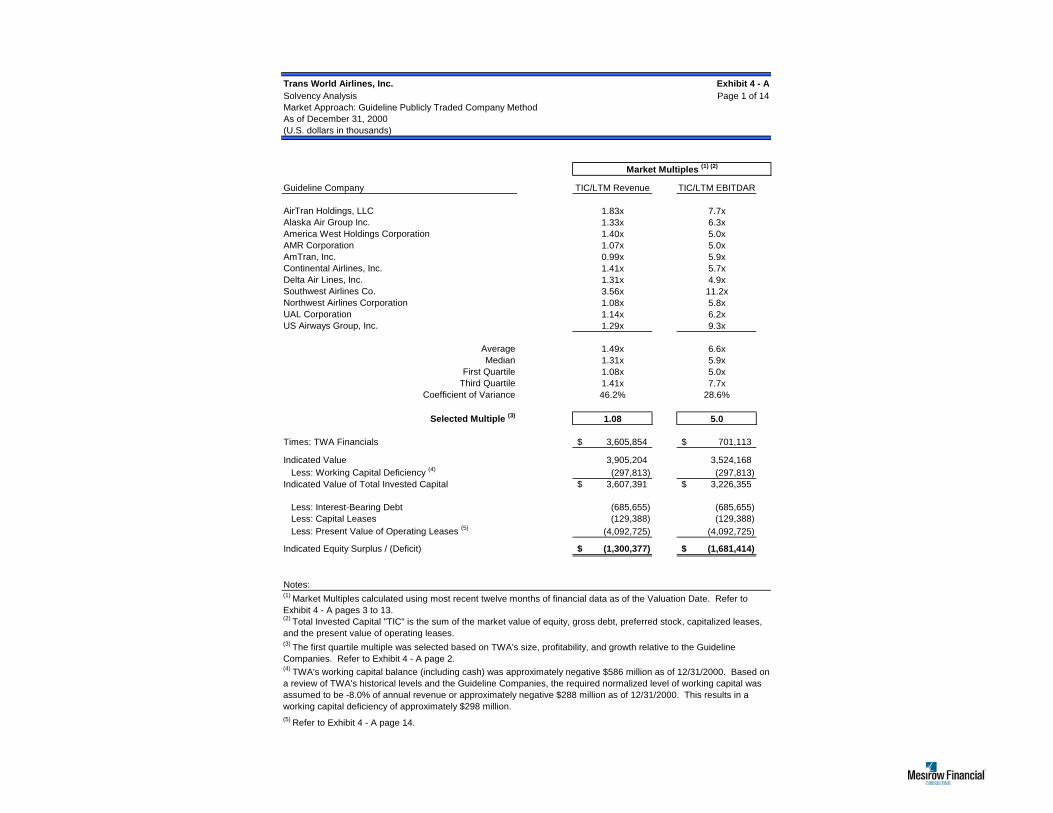
Trans World Airlines, Inc. Exhibit 4 - ASolvency Analysis Page 1 of 14Market Approach: Guideline Publicly Traded Company MethodAs of December 31, 2000(U.S. dollars in thousands)
Market Multiples (1) (2)
Guideline Company TIC/LTM Revenue TIC/LTM EBITDAR
AirTran Holdings, LLC 1.83x 7.7xAlaska Air Group Inc. 1.33x 6.3xAmerica West Holdings Corporation 1.40x 5.0xAMR Corporation 1.07x 5.0xAmTran, Inc. 0.99x 5.9xContinental Airlines, Inc. 1.41x 5.7xDelta Air Lines, Inc. 1.31x 4.9xSouthwest Airlines Co. 3.56x 11.2xNorthwest Airlines Corporation 1.08x 5.8xUAL Corporation 1.14x 6.2xUS Airways Group, Inc. 1.29x 9.3x
Average 1.49x 6.6xMedian 1.31x 5.9x
First Quartile 1.08x 5.0xThird Quartile 1.41x 7.7x
Coefficient of Variance 46.2% 28.6%
Selected Multiple (3) 1.08 5.0
Times: TWA Financials 3,605,854$ 701,113$
Indicated Value 3,905,204 3,524,168 Less: Working Capital Deficiency (4) (297,813) (297,813) Indicated Value of Total Invested Capital 3,607,391$ 3,226,355$
Less: Interest-Bearing Debt (685,655) (685,655) Less: Capital Leases (129,388) (129,388) Less: Present Value of Operating Leases (5) (4,092,725) (4,092,725)
Indicated Equity Surplus / (Deficit) (1,300,377)$ (1,681,414)$
Notes:
(5) Refer to Exhibit 4 - A page 14.
(2) Total Invested Capital "TIC" is the sum of the market value of equity, gross debt, preferred stock, capitalized leases, and the present value of operating leases.
(1) Market Multiples calculated using most recent twelve months of financial data as of the Valuation Date. Refer to Exhibit 4 - A pages 3 to 13.
(3) The first quartile multiple was selected based on TWA's size, profitability, and growth relative to the Guideline Companies. Refer to Exhibit 4 - A page 2.(4) TWA's working capital balance (including cash) was approximately negative $586 million as of 12/31/2000. Based on a review of TWA's historical levels and the Guideline Companies, the required normalized level of working capital was assumed to be -8.0% of annual revenue or approximately negative $288 million as of 12/31/2000. This results in a working capital deficiency of approximately $298 million.

Trans World Airlines, Inc. Exhibit 4 - A
Solvency Analysis Page 2 of 14Benchmarking AnalysisAs of December 31, 2000(U.S. dollars in millions)
AirTran Holdings, LLC 23.9% Southwest Airlines Co. 26.4% AirTran Holdings, LLC 25.4%Southwest Airlines Co. 19.3% AirTran Holdings, LLC 23.9% Southwest Airlines Co. 19.9%AmTran, Inc. 15.1% AMR Corporation 14.9% Trans World Airlines, Inc. 10.8%Continental Airlines, Inc. 14.6% Continental Airlines, Inc. 4.3% AMR Corporation 9.7%Delta Air Lines, Inc. 12.5% Delta Air Lines, Inc. 3.1% Continental Airlines, Inc. 6.6%AMR Corporation 11.1% Northwest Airlines Corporation -2.3% Delta Air Lines, Inc. 6.1%Northwest Airlines Corporation 11.1% UAL Corporation -24.2% Northwest Airlines Corporation 3.3%Trans World Airlines, Inc. 9.0% AmTran, Inc. -31.4% US Airways Group, Inc. -10.5%US Airways Group, Inc. 7.8% US Airways Group, Inc. -41.2% UAL Corporation -12.1%UAL Corporation 7.4% Alaska Air Group Inc. -48.1% AmTran, Inc. -16.5%America West Holdings Corporation 6.0% America West Holdings Corporation -49.2% America West Holdings Corporation -16.5%Alaska Air Group Inc. 4.6% Trans World Airlines, Inc. -776.6% Alaska Air Group Inc. -26.2%
Mean 11.9% Mean -75.0% Mean 0.0%Median 11.1% Median -13.2% Median 4.7%First Quartile 7.5% First Quartile -46.4% First Quartile -15.4%Third Quartile 15.0% Third Quartile 12.3% Third Quartile 10.5%
Southwest Airlines Co. 18.1% Southwest Airlines Co. 23.7% Southwest Airlines Co. 31.9%AirTran Holdings, LLC 13.0% Delta Air Lines, Inc. 17.5% America West Holdings Corporation 28.2%Delta Air Lines, Inc. 10.4% AirTran Holdings, LLC 17.2% Delta Air Lines, Inc. 26.5%AMR Corporation 7.0% AMR Corporation 13.1% Continental Airlines, Inc. 24.9%Continental Airlines, Inc. 6.9% Continental Airlines, Inc. 11.0% AirTran Holdings, LLC 23.8%Northwest Airlines Corporation 5.0% Northwest Airlines Corporation 10.4% AMR Corporation 21.3%UAL Corporation 3.4% AmTran, Inc. 9.9% Alaska Air Group Inc. 21.2%AmTran, Inc. 0.2% UAL Corporation 8.8% Trans World Airlines, Inc. 19.4%Alaska Air Group Inc. 0.2% Alaska Air Group Inc. 8.0% Northwest Airlines Corporation 18.6%America West Holdings Corporation 0.0% America West Holdings Corporation 8.5% UAL Corporation 18.6%US Airways Group, Inc. -0.6% US Airways Group, Inc. 3.4% AmTran, Inc. 16.7%Trans World Airlines, Inc. -5.1% Trans World Airlines, Inc. -1.5% US Airways Group, Inc. 13.8%
Mean 4.9% Mean 10.8% Mean 22.1%Median 4.2% Median 10.1% Median 21.2%First Quartile 0.0% First Quartile 8.1% First Quartile 18.6%Third Quartile 9.6% Third Quartile 16.2% Third Quartile 26.1%
Southwest Airlines Co. 16,904.6$ AMR Corporation 26,213.0$ AMR Corporation 19,703.0$ Delta Air Lines, Inc. 6,173.7 UAL Corporation 24,355.0 UAL Corporation 19,352.0 AMR Corporation 5,959.0 Delta Air Lines, Inc. 21,931.0 Delta Air Lines, Inc. 16,741.0 Continental Airlines, Inc. 3,017.5 Northwest Airlines Corporation 10,877.0 Northwest Airlines Corporation 11,415.0 US Airways Group, Inc. 2,717.9 Continental Airlines, Inc. 9,201.0 Continental Airlines, Inc. 9,899.0 Northwest Airlines Corporation 2,503.2 US Airways Group, Inc. 9,127.0 US Airways Group, Inc. 9,269.0 UAL Corporation 2,045.7 Southwest Airlines Co. 6,669.6 Southwest Airlines Co. 5,649.6 Alaska Air Group Inc. 787.1 Alaska Air Group Inc. 2,630.0 Trans World Airlines, Inc. 3,605.9 AirTran Holdings, LLC 477.2 Trans World Airlines, Inc. 2,012.1 America West Holdings Corporation 2,344.4 America West Holdings Corporation 430.5 America West Holdings Corporation 1,568.5 Alaska Air Group Inc. 2,177.2 AmTran, Inc. 165.1 AmTran, Inc. 1,032.4 AmTran, Inc. 1,291.6 Trans World Airlines, Inc. 75.8 AirTran Holdings, LLC 546.3 AirTran Holdings, LLC 624.1
Mean 3,438.1 Mean 9,680.2 Mean 8,506.0 Median 2,274.5 Median 7,898.3 Median 7,459.3 First Quartile 442.2 First Quartile 1,679.4 First Quartile 2,219.0 Third Quartile 5,223.6 Third Quartile 19,167.5 Third Quartile 15,409.5
Growth Growth Growth(LTM Revenue) (LTM EBITDA) (LTM EBITDAR)
Profitability Profitability Profitability(LTM EBIT Margin) (LTM EBITDA Margin) (LTM EBITDAR Margin)
Size Size Size(Market Value of Equity) (Total Assets) (LTM Revenue)

t
Trans World Airlines, Inc. Exhibit 4 - A
Solvency Analysis Page 3 of 14Market Approach: Guideline Publicly Traded Company MethodAs of December 31, 2000(U.S. dollars in thousands, except stock prices)
[A] [B] [C] = [A] * [B]Stock Price as of
12/31/00Shares
OutstandingMarket Value of
Equity (MVE)
7.25$ 65,823 477,217$
[D] [E] [F] [G] [H][I] =
[D] + [E] + [F] + [G] + [H]
Current Maturities of LT Debt
Long Term Debt Capital Leases
Preferred Stock
PV of Operating Leases Total Debt
62,491$ 365,412$ -$ -$ 235,317$ 663,220$
[C] [I] [J] = [C] + [I]Market Value of Equity
(MVE) Total DebtTotal Enterprise
Value
477,217$ 663,220$ 1,140,437$
[K] [L] [M] [N] = [K] + [L] + [M] [O]12 Months Ended
EBITDA12 Months Ended
Aircraft Rent12 Months Ended
Other Rent12 Months Ended
EBITDAR12 Months Ended
Revenue
107,229$ 12,616$ 28,752$ 148,597$ 624,094$
[J] [N] [P] = [J] / [N] [J] [O] [Q] = [J] / [O]
Total Enterprise Value12 Months Ended
EBITDARTEV/
EBITDARTotal Enterprise
Value12 Months Ended
RevenueTEV/
Revenue
1,140,437$ 148,597$ 7.67x 1,140,437$ 624,094$ 1.83x
Source: Bloomberg Database and December 31, 2000 Form 10-K
AirTran Holdings, LLC
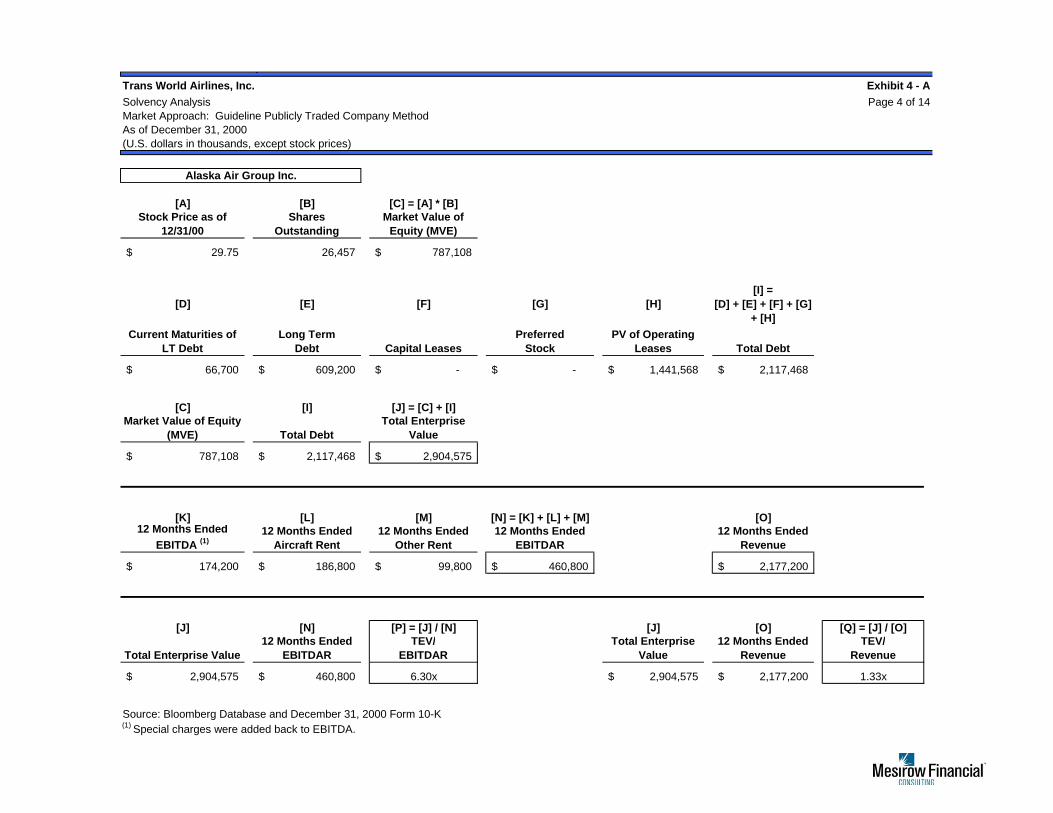
t
Trans World Airlines, Inc. Exhibit 4 - A
Solvency Analysis Page 4 of 14Market Approach: Guideline Publicly Traded Company MethodAs of December 31, 2000(U.S. dollars in thousands, except stock prices)
[A] [B] [C] = [A] * [B]Stock Price as of
12/31/00Shares
OutstandingMarket Value of
Equity (MVE)
29.75$ 26,457 787,108$
[D] [E] [F] [G] [H][I] =
[D] + [E] + [F] + [G] + [H]
Current Maturities of LT Debt
Long Term Debt Capital Leases
Preferred Stock
PV of Operating Leases Total Debt
66,700$ 609,200$ -$ -$ 1,441,568$ 2,117,468$
[C] [I] [J] = [C] + [I]Market Value of Equity
(MVE) Total DebtTotal Enterprise
Value
787,108$ 2,117,468$ 2,904,575$
[K] [L] [M] [N] = [K] + [L] + [M] [O]12 Months Ended
EBITDA (1)12 Months Ended
Aircraft Rent12 Months Ended
Other Rent12 Months Ended
EBITDAR12 Months Ended
Revenue
174,200$ 186,800$ 99,800$ 460,800$ 2,177,200$
[J] [N] [P] = [J] / [N] [J] [O] [Q] = [J] / [O]
Total Enterprise Value12 Months Ended
EBITDARTEV/
EBITDARTotal Enterprise
Value12 Months Ended
RevenueTEV/
Revenue
2,904,575$ 460,800$ 6.30x 2,904,575$ 2,177,200$ 1.33x
Source: Bloomberg Database and December 31, 2000 Form 10-K(1) Special charges were added back to EBITDA.
Alaska Air Group Inc.

t
Trans World Airlines, Inc. Exhibit 4 - A
Solvency Analysis Page 5 of 14Market Approach: Guideline Publicly Traded Company MethodAs of December 31, 2000(U.S. dollars in thousands, except stock prices)
[A] [B] [C] = [A] * [B]Stock Price as of
12/31/00Shares
OutstandingMarket Value of
Equity (MVE)
12.81$ 33,599 430,485$
[D] [E] [F] [G] [H][I] =
[D] + [E] + [F] + [G] + [H]
Current Maturities of LT Debt
Long Term Debt Capital Leases
Preferred Stock
PV of Operating Leases Total Debt
159,667$ 145,578$ -$ -$ 2,549,233$ 2,854,478$
[C] [I] [J] = [C] + [I]Market Value of Equity
(MVE) Total DebtTotal Enterprise
Value
430,485$ 2,854,478$ 3,284,962$
[K] [L] [M] [N] = [K] + [L] + [M] [O]12 Months Ended
EBITDA (1)12 Months Ended
Aircraft Rent12 Months Ended
Other Rent12 Months Ended
EBITDAR12 Months Ended
Revenue
198,671$ 331,005$ 130,680$ 660,356$ 2,344,354$
[J] [N] [P] = [J] / [N] [J] [O] [Q] = [J] / [O]
Total Enterprise Value12 Months Ended
EBITDARTEV/
EBITDARTotal Enterprise
Value12 Months Ended
RevenueTEV/
Revenue
3,284,962$ 660,356$ 4.97x 3,284,962$ 2,344,354$ 1.40x
Source: Bloomberg Database and December 31, 2000 Form 10-K(1) Non-recurring charges less a $4.1 million settlement recovery were added back to EBITDA.
America West Holdings Corporation

t
Trans World Airlines, Inc. Exhibit 4 - A
Solvency Analysis Page 6 of 14Market Approach: Guideline Publicly Traded Company MethodAs of December 31, 2000(U.S. dollars in thousands, except stock prices)
[A] [B] [C] = [A] * [B]Stock Price as of
12/31/00Shares
OutstandingMarket Value of
Equity (MVE)
39.19$ 152,063 5,958,951$
[D] [E] [F] [G] [H][I] =
[D] + [E] + [F] + [G] + [H]
Current Maturities of LT Debt
Long Term Debt Capital Leases
Preferred Stock
PV of Operating Leases Total Debt
569,000$ 4,151,000$ 1,550,000$ -$ 8,827,195$ 15,097,195$
[C] [I] [J] = [C] + [I]Market Value of Equity
(MVE) Total DebtTotal Enterprise
Value
5,958,951$ 15,097,195$ 21,056,146$
[K] [L] [M] [N] = [K] + [L] + [M] [O]12 Months Ended
EBITDA12 Months Ended
Aircraft Rent12 Months Ended
Other Rent12 Months Ended
EBITDAR12 Months Ended
Revenue
2,583,000$ 607,000$ 999,000$ 4,189,000$ 19,703,000$
[J] [N] [P] = [J] / [N] [J] [O] [Q] = [J] / [O]
Total Enterprise Value12 Months Ended
EBITDARTEV/
EBITDARTotal Enterprise
Value12 Months Ended
RevenueTEV/
Revenue
21,056,146$ 4,189,000$ 5.03x 21,056,146$ 19,703,000$ 1.07x
Source: Bloomberg Database and December 31, 2000 Form 10-K
AMR Corporation

t
Trans World Airlines, Inc. Exhibit 4 - A
Solvency Analysis Page 7 of 14Market Approach: Guideline Publicly Traded Company MethodAs of December 31, 2000(U.S. dollars in thousands, except stock prices)
[A] [B] [C] = [A] * [B]Stock Price as of
12/31/00Shares
OutstandingMarket Value of
Equity (MVE)
14.50$ 11,386 165,094$
[D] [E] [F] [G] [H][I] =
[D] + [E] + [F] + [G] + [H]
Current Maturities of LT Debt
Long Term Debt Capital Leases
Preferred Stock
PV of Operating Leases Total Debt
82,476$ 375,473$ -$ 80,000$ 570,691$ 1,108,640$
[C] [I] [J] = [C] + [I]Market Value of Equity
(MVE) Total DebtTotal Enterprise
Value
165,094$ 1,108,640$ 1,273,734$
[K] [L] [M] [N] = [K] + [L] + [M] [O]12 Months Ended
EBITDA12 Months Ended
Aircraft Rent12 Months Ended
Other Rent12 Months Ended
EBITDAR12 Months Ended
Revenue
127,611$ 72,145$ 15,817$ 215,573$ 1,291,553$
[J] [N] [P] = [J] / [N] [J] [O] [Q] = [J] / [O]
Total Enterprise Value12 Months Ended
EBITDARTEV/
EBITDARTotal Enterprise
Value12 Months Ended
RevenueTEV/
Revenue
1,273,734$ 215,573$ 5.91x 1,273,734$ 1,291,553$ 0.99x
Source: Bloomberg Database and December 31, 2000 Form 10-K
AmTran, Inc.

t
Trans World Airlines, Inc. Exhibit 4 - A
Solvency Analysis Page 8 of 14Market Approach: Guideline Publicly Traded Company MethodAs of December 31, 2000(U.S. dollars in thousands, except stock prices)
[A] [B] [C] = [A] * [B]Stock Price as of
12/31/00Shares
OutstandingMarket Value of
Equity (MVE)
51.63$ 58,450 3,017,500$
[D] [E] [F] [G] [H][I] =
[D] + [E] + [F] + [G] + [H]
Current Maturities of LT Debt
Long Term Debt Capital Leases
Preferred Stock
PV of Operating Leases Total Debt
304,000$ 3,616,000$ -$ -$ 7,005,649$ 10,925,649$
[C] [I] [J] = [C] + [I]Market Value of Equity
(MVE) Total DebtTotal Enterprise
Value
3,017,500$ 10,925,649$ 13,943,149$
[K] [L] [M] [N] = [K] + [L] + [M] [O]12 Months Ended
EBITDA12 Months Ended
Aircraft Rent12 Months Ended
Other Rent12 Months Ended
EBITDAR12 Months Ended
Revenue
1,086,000$ 844,000$ 532,000$ 2,462,000$ 9,899,000$
[J] [N] [P] = [J] / [N] [J] [O] [Q] = [J] / [O]
Total Enterprise Value12 Months Ended
EBITDARTEV/
EBITDARTotal Enterprise
Value12 Months Ended
RevenueTEV/
Revenue
13,943,149$ 2,462,000$ 5.66x 13,943,149$ 9,899,000$ 1.41x
Source: Bloomberg Database and December 31, 2000 Form 10-K
Continental Airlines, Inc.

t
Trans World Airlines, Inc. Exhibit 4 - A
Solvency Analysis Page 9 of 14Market Approach: Guideline Publicly Traded Company MethodAs of December 31, 2000(U.S. dollars in thousands, except stock prices)
[A] [B] [C] = [A] * [B]Stock Price as of
12/31/00Shares
OutstandingMarket Value of
Equity (MVE)
50.19$ 123,013 6,173,734$
[D] [E] [F] [G] [H][I] =
[D] + [E] + [F] + [G] + [H]
Current Maturities of LT Debt
Long Term Debt Capital Leases
Preferred Stock
PV of Operating Leases Total Debt
62,000$ 5,797,000$ 139,000$ 234,000$ 9,447,518$ 15,679,518$
[C] [I] [J] = [C] + [I]Market Value of Equity
(MVE) Total DebtTotal Enterprise
Value
6,173,734$ 15,679,518$ 21,853,251$
[K] [L] [M] [N] = [K] + [L] + [M] [O]12 Months Ended
EBITDA12 Months Ended
Aircraft Rent12 Months Ended
Other Rent12 Months Ended
EBITDAR12 Months Ended
Revenue
2,932,000$ 741,000$ 771,000$ 4,444,000$ 16,741,000$
[J] [N] [P] = [J] / [N] [J] [O] [Q] = [J] / [O]
Total Enterprise Value12 Months Ended
EBITDARTEV/
EBITDARTotal Enterprise
Value12 Months Ended
RevenueTEV/
Revenue
21,853,251$ 4,444,000$ 4.92x 21,853,251$ 16,741,000$ 1.31x
Source: Bloomberg Database and December 31, 2000 Form 10-K
Delta Air Lines, Inc.

t
Trans World Airlines, Inc. Exhibit 4 - A
Solvency Analysis Page 10 of 14Market Approach: Guideline Publicly Traded Company MethodAs of December 31, 2000(U.S. dollars in thousands, except stock prices)
[A] [B] [C] = [A] * [B]Stock Price as of
12/31/00Shares
OutstandingMarket Value of
Equity (MVE)
33.53$ 504,162 16,904,552$
[D] [E] [F] [G] [H][I] =
[D] + [E] + [F] + [G] + [H]
Current Maturities of LT Debt
Long Term Debt Capital Leases
Preferred Stock
PV of Operating Leases Total Debt
108,752$ 760,992$ -$ -$ 2,326,166$ 3,195,910$
[C] [I] [J] = [C] + [I]Market Value of Equity
(MVE) Total DebtTotal Enterprise
Value
16,904,552$ 3,195,910$ 20,100,461$
[K] [L] [M] [N] = [K] + [L] + [M] [O]12 Months Ended
EBITDA12 Months Ended
Aircraft Rent12 Months Ended
Other Rent12 Months Ended
EBITDAR12 Months Ended
Revenue
1,338,749$ 196,328$ 265,106$ 1,800,183$ 5,649,560$
[J] [N] [P] = [J] / [N] [J] [O] [Q] = [J] / [O]
Total Enterprise Value12 Months Ended
EBITDARTEV/
EBITDARTotal Enterprise
Value12 Months Ended
RevenueTEV/
Revenue
20,100,461$ 1,800,183$ 11.17x 20,100,461$ 5,649,560$ 3.56x
Source: Bloomberg Database and December 31, 2000 Form 10-K
Southwest Airlines Co.

t
Trans World Airlines, Inc. Exhibit 4 - A
Solvency Analysis Page 11 of 14Market Approach: Guideline Publicly Traded Company MethodAs of December 31, 2000(U.S. dollars in thousands, except stock prices)
[A] [B] [C] = [A] * [B]Stock Price as of
12/31/00Shares
OutstandingMarket Value of
Equity (MVE)
30.13$ 83,094 2,503,212$
[D] [E] [F] [G] [H][I] =
[D] + [E] + [F] + [G] + [H]
Current Maturities of LT Debt
Long Term Debt Capital Leases
Preferred Stock
PV of Operating Leases Total Debt
191,000$ 3,609,000$ 556,000$ 232,000$ 5,271,436$ 9,859,436$
[C] [I] [J] = [C] + [I]Market Value of Equity
(MVE) Total DebtTotal Enterprise
Value
2,503,212$ 9,859,436$ 12,362,647$
[K] [L] [M] [N] = [K] + [L] + [M] [O]12 Months Ended
EBITDA12 Months Ended
Aircraft Rent12 Months Ended
Other Rent12 Months Ended
EBITDAR12 Months Ended
Revenue
1,186,000$ 423,000$ 513,000$ 2,122,000$ 11,415,000$
[J] [N] [P] = [J] / [N] [J] [O] [Q] = [J] / [O]
Total Enterprise Value12 Months Ended
EBITDARTEV/
EBITDARTotal Enterprise
Value12 Months Ended
RevenueTEV/
Revenue
12,362,647$ 2,122,000$ 5.83x 12,362,647$ 11,415,000$ 1.08x
Source: Bloomberg Database and December 31, 2000 Form 10-K
Northwest Airlines Corporation

t
Trans World Airlines, Inc. Exhibit 4 - A
Solvency Analysis Page 12 of 14Market Approach: Guideline Publicly Traded Company MethodAs of December 31, 2000(U.S. dollars in thousands, except stock prices)
[A] [B] [C] = [A] * [B]Stock Price as of
12/31/00Shares
OutstandingMarket Value of
Equity (MVE)
38.94$ 52,539 2,045,725$
[D] [E] [F] [G] [H][I] =
[D] + [E] + [F] + [G] + [H]
Current Maturities of LT Debt
Long Term Debt Capital Leases
Preferred Stock
PV of Operating Leases Total Debt
170,000$ 4,787,000$ 2,530,000$ 266,000$ 12,317,701$ 20,070,701$
[C] [I] [J] = [C] + [I]Market Value of Equity
(MVE) Total DebtTotal Enterprise
Value
2,045,725$ 20,070,701$ 22,116,426$
[K] [L] [M] [N] = [K] + [L] + [M] [O]12 Months Ended
EBITDA12 Months Ended
Aircraft Rent12 Months Ended
Other Rent12 Months Ended
EBITDAR12 Months Ended
Revenue
1,712,000$ 919,000$ 959,000$ 3,590,000$ 19,352,000$
[J] [N] [P] = [J] / [N] [J] [O] [Q] = [J] / [O]
Total Enterprise Value12 Months Ended
EBITDARTEV/
EBITDARTotal Enterprise
Value12 Months Ended
RevenueTEV/
Revenue
22,116,426$ 3,590,000$ 6.16x 22,116,426$ 19,352,000$ 1.14x
Source: Bloomberg Database and December 31, 2000 Form 10-K
UAL Corporation

t
Trans World Airlines, Inc. Exhibit 4 - A
Solvency Analysis Page 13 of 14Market Approach: Guideline Publicly Traded Company MethodAs of December 31, 2000(U.S. dollars in thousands, except stock prices)
[A] [B] [C] = [A] * [B]Stock Price as of
12/31/00Shares
OutstandingMarket Value of
Equity (MVE)
40.56$ 67,006 2,717,931$
[D] [E] [F] [G] [H][I] =
[D] + [E] + [F] + [G] + [H]
Current Maturities of LT Debt
Long Term Debt Capital Leases
Preferred Stock
PV of Operating Leases Total Debt
284,000$ 2,688,000$ -$ -$ 6,241,544$ 9,213,544$
[C] [I] [J] = [C] + [I]Market Value of Equity
(MVE) Total DebtTotal Enterprise
Value
2,717,931$ 9,213,544$ 11,931,475$
[K] [L] [M] [N] = [K] + [L] + [M] [O]12 Months Ended
EBITDA12 Months Ended
Aircraft Rent12 Months Ended
Other Rent12 Months Ended
EBITDAR12 Months Ended
Revenue
316,000$ 519,000$ 448,000$ 1,283,000$ 9,269,000$
[J] [N] [P] = [J] / [N] [J] [O] [Q] = [J] / [O]
Total Enterprise Value12 Months Ended
EBITDARTEV/
EBITDARTotal Enterprise
Value12 Months Ended
RevenueTEV/
Revenue
11,931,475$ 1,283,000$ 9.30x 11,931,475$ 9,269,000$ 1.29x
Source: Bloomberg Database and December 31, 2000 Form 10-K
US Airways Group, Inc.

Trans World Airlines, Inc. Exhibit 4 - ASolvency Analysis Page 14 of 14Present Value of Operating LeasesAs of December 31, 2000(U.S. dollars in thousands)
Midpoint Convention TWA AirTran Alaska America West AMR AmTran Continental Delta Southwest Northwest UAL US Airways
2001 0.500 552,708$ 33,015$ 185,600$ 369,670$ 984,000$ 83,734$ 859,000$ 1,204,000$ 274,564$ 655,000$ 1,553,000$ 945,000$ 2002 1.500 538,040 33,571 163,800 336,141 921,000 80,194 814,000 1,218,000 262,142 668,000 1,496,000 835,0002003 2.500 528,320 34,233 146,100 283,386 931,000 74,303 766,000 1,189,000 237,627 650,000 1,513,000 818,0002004 3.500 517,836 27,274 120,500 235,472 913,000 73,954 709,000 1,153,000 213,782 641,000 1,522,000 795,0002005 4.500 507,560 25,969 115,600 220,327 900,000 71,763 688,000 1,138,000 203,385 622,000 1,526,000 778,0002006 5.500 497,488 24,726 110,899 206,156 887,185 69,637 667,622 1,123,195 193,494 603,563 1,530,011 761,3642007 6.500 487,616 23,543 106,390 192,897 874,553 67,574 647,848 1,108,583 184,083 585,673 1,534,032 745,0832008 7.500 477,940 22,417 102,063 180,490 862,100 65,572 628,659 1,094,161 175,131 568,313 1,538,063 729,1502009 8.500 468,455 21,344 97,913 168,881 849,825 63,629 610,039 1,079,926 166,613 551,467 1,542,105 713,5582010 9.500 459,159 20,323 93,932 158,019 837,724 61,744 591,970 1,065,877 158,510 535,121 1,546,158 698,3002011 10.500 365,036 19,351 90,112 147,856 825,796 59,915 574,436 1,052,010 150,801 519,260 1,550,222 683,3682012 11.500 18,425 86,448 138,346 814,038 58,140 557,422 1,038,324 143,467 503,868 1,554,296 668,7552013 12.500 17,543 82,932 129,448 802,447 56,417 540,911 1,024,816 136,490 488,933 1,558,381 654,4542014 13.500 16,704 79,560 121,122 791,021 54,746 524,890 631,108 129,852 474,440 1,562,476 362,9692015 14.500 5,091 76,325 113,332 779,758 53,124 509,343 123,537 460,377 1,566,5832016 15.500 62,126 106,043 768,655 51,550 494,257 117,529 446,731 1,241,6742017 16.500 99,222 757,710 13,795 39,604 22,284 186,2532018 17.500 58,531 746,9222019 18.500 708,265
Pretax Cost of Debt (2) 12.39% 12.39% 9.41% 10.78% 8.59% 12.39% 10.87% 8.40% 7.79% 10.87% 9.41% 12.39%
PV of Operating Leases (3) 3,132,536$ 185,271$ 1,019,303$ 1,828,213$ 8,351,586$ 510,202$ 5,371,947$ 9,330,553$ 1,826,511$ 4,677,307$ 12,936,102$ 5,340,632$
7x 2001 Operating Leases (4) 3,868,956$ 231,105$ 1,299,200$ 2,587,690$ 6,888,000$ 586,138$ 6,013,000$ 8,428,000$ 1,921,948$ 4,585,000$ 10,871,000$ 6,615,000$
7x 2000 Operating Leases (5) 5,276,684$ 289,576$ 2,006,200$ 3,231,795$ 11,242,000$ 615,734$ 9,632,000$ 10,584,000$ 3,230,038$ 6,552,000$ 13,146,000$ 6,769,000$
Average Operating Leases 4,092,725$ 235,317$ 1,441,568$ 2,549,233$ 8,827,195$ 570,691$ 7,005,649$ 9,447,518$ 2,326,166$ 5,271,436$ 12,317,701$ 6,241,544$
Partial Period Adjustment 1.000
Notes:
(2) Cost of debt is based on the yield of the bond index corresponding to each companies respective credit rating. Source: Bloomberg(3) Present value calculated using the respective cost of debt and applies the midpoint discounting convention. Note, this calculation excludes new lease commitments entered into after December 31, 2000.(4) Calculated as seven times the respective 2001 estimated future operating lease expense per each companies December 31, 2000 Form 10-K (as shown above).(5) Calculated as seven times the respective 2000 historical operating lease expense per each companies December 31, 2000 Form 10-K. Refer to Exhibit 4 - A pages 3 to 13 for fiscal year 2000 operating leases.
(1) Estimated future lease payments for Guideline Companies through 2005 obtained from the respective December 31, 2000 Form 10-Ks. After 2005, the lease payments were gradually reduced until the cumulative amount equaled the "2006 and subsequent" balance shown in each Form 10-K. For TWA, the 2000 Form 10-K was unavailable therefore we used the 1999 Form 10-K and followed the same process.
Estimated Lease Payments Required Under Operating Leases (1)

Trans World Airlines, Inc. Exhibit 4 - BSolvency Analysis Page 1 of 14Market Approach: Guideline Publicly Traded Company MethodAs of March 31, 2001(U.S. dollars in thousands)
Market Multiples (1) (2)
Comparable Company TIC/LTM Revenue TIC/LTM EBITDAR
AirTran Holdings, LLC 1.70x 6.9xAlaska Air Group Inc. 1.26x 6.2xAmerica West Holdings Corporation 1.31x 4.9xAMR Corporation 1.05x 5.2xAmTran, Inc. 0.95x 5.7xContinental Airlines, Inc. 1.34x 5.4xDelta Air Lines, Inc. 1.24x 5.1xSouthwest Airlines Co. 2.86x 8.9xNorthwest Airlines Corporation 1.12x 6.8xUAL Corporation 1.14x 7.5xUS Airways Group, Inc. 1.25x 9.5x
Average 1.38x 6.6xMedian 1.25x 6.2x
First Quartile 1.12x 5.2xThird Quartile 1.34x 7.5x
Coefficient of Variance 36.3% 22.7%
Selected Multiple (3) 1.12 5.2
Times: TWA Financials 3,584,831$ 686,391$
Indicated Value 4,017,003 3,538,283 Less: Working Capital Deficiency (4) (216,647) (216,647) Indicated Value of Total Invested Capital 3,800,357$ 3,321,636$
Less: Interest-Bearing Debt (5) (880,972) (880,972) Less: Capital Leases (117,810) (117,810) Less: Present Value of Operating Leases (6) (4,075,070) (4,075,070)
Indicated Value of Equity (1,273,495)$ (1,752,216)$
Notes:
(5) Includes $200 million debtor-in-possession financing. (6) Refer to Exhibit 4 - B page 14.
(1) Market Multiples calculated using most recent twelve months of financial data as of the Valuation Date. Refer to Exhibit 4 - B pages 3 to 13.(2) Total Invested Capital "TIC" is the sum of the market value of equity, gross debt, preferred stock, capitalized leases, and the present value of operating leases.
(4) TWA's working capital balance (including cash) was approximately negative $503 million as of 3/31/2001. Based on a review of TWA's historical levels and the Guideline Companies, the required normalized level of working capital was assumed to be -8.0% of annual revenue or approximately negative $287 million as of 3/31/2001. This results in a working capital deficiency of approximately $217 million.
(3) The first quartile multiple was selected based on TWA's size, profitability, and growth relative to the Guideline Companies. Refer to Exhibit 4 - B page 2.
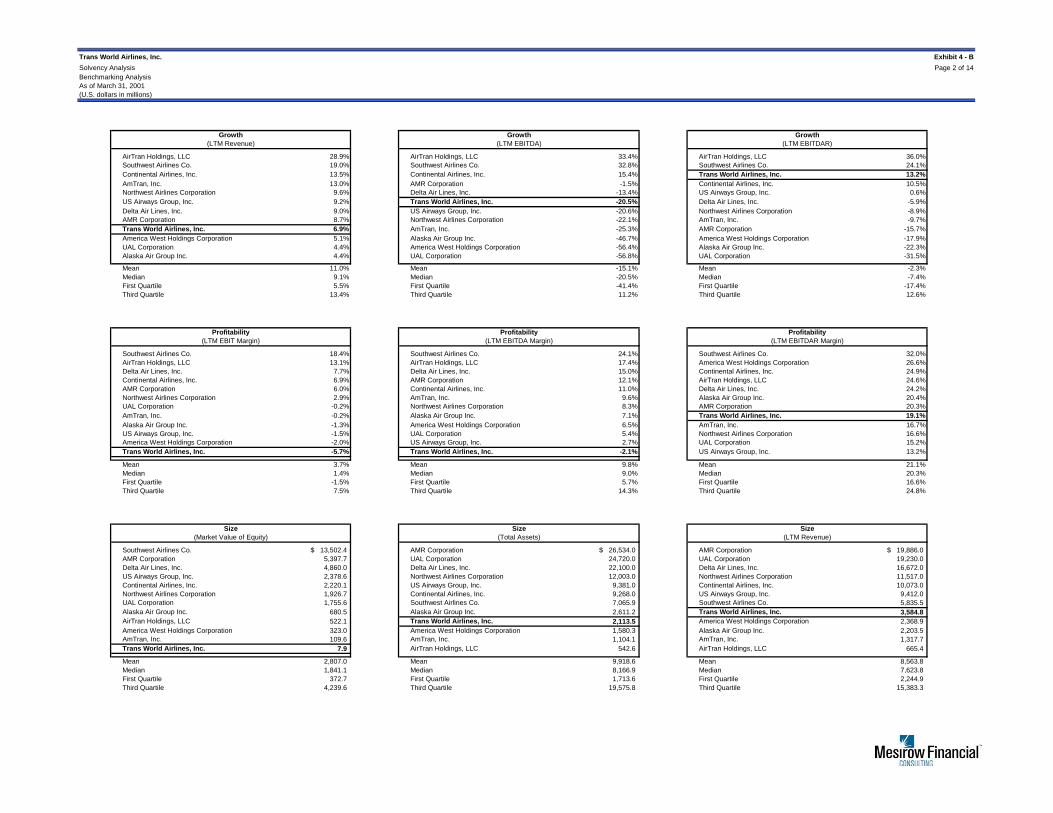
Trans World Airlines, Inc. Exhibit 4 - B
Solvency Analysis Page 2 of 14Benchmarking AnalysisAs of March 31, 2001(U.S. dollars in millions)
AirTran Holdings, LLC 28.9% AirTran Holdings, LLC 33.4% AirTran Holdings, LLC 36.0%Southwest Airlines Co. 19.0% Southwest Airlines Co. 32.8% Southwest Airlines Co. 24.1%Continental Airlines, Inc. 13.5% Continental Airlines, Inc. 15.4% Trans World Airlines, Inc. 13.2%AmTran, Inc. 13.0% AMR Corporation -1.5% Continental Airlines, Inc. 10.5%Northwest Airlines Corporation 9.6% Delta Air Lines, Inc. -13.4% US Airways Group, Inc. 0.6%US Airways Group, Inc. 9.2% Trans World Airlines, Inc. -20.5% Delta Air Lines, Inc. -5.9%Delta Air Lines, Inc. 9.0% US Airways Group, Inc. -20.6% Northwest Airlines Corporation -8.9%AMR Corporation 8.7% Northwest Airlines Corporation -22.1% AmTran, Inc. -9.7%Trans World Airlines, Inc. 6.9% AmTran, Inc. -25.3% AMR Corporation -15.7%America West Holdings Corporation 5.1% Alaska Air Group Inc. -46.7% America West Holdings Corporation -17.9%UAL Corporation 4.4% America West Holdings Corporation -56.4% Alaska Air Group Inc. -22.3%Alaska Air Group Inc. 4.4% UAL Corporation -56.8% UAL Corporation -31.5%
Mean 11.0% Mean -15.1% Mean -2.3%Median 9.1% Median -20.5% Median -7.4%First Quartile 5.5% First Quartile -41.4% First Quartile -17.4%Third Quartile 13.4% Third Quartile 11.2% Third Quartile 12.6%
Southwest Airlines Co. 18.4% Southwest Airlines Co. 24.1% Southwest Airlines Co. 32.0%AirTran Holdings, LLC 13.1% AirTran Holdings, LLC 17.4% America West Holdings Corporation 26.6%Delta Air Lines, Inc. 7.7% Delta Air Lines, Inc. 15.0% Continental Airlines, Inc. 24.9%Continental Airlines, Inc. 6.9% AMR Corporation 12.1% AirTran Holdings, LLC 24.6%AMR Corporation 6.0% Continental Airlines, Inc. 11.0% Delta Air Lines, Inc. 24.2%Northwest Airlines Corporation 2.9% AmTran, Inc. 9.6% Alaska Air Group Inc. 20.4%UAL Corporation -0.2% Northwest Airlines Corporation 8.3% AMR Corporation 20.3%AmTran, Inc. -0.2% Alaska Air Group Inc. 7.1% Trans World Airlines, Inc. 19.1%Alaska Air Group Inc. -1.3% America West Holdings Corporation 6.5% AmTran, Inc. 16.7%US Airways Group, Inc. -1.5% UAL Corporation 5.4% Northwest Airlines Corporation 16.6%America West Holdings Corporation -2.0% US Airways Group, Inc. 2.7% UAL Corporation 15.2%Trans World Airlines, Inc. -5.7% Trans World Airlines, Inc. -2.1% US Airways Group, Inc. 13.2%
Mean 3.7% Mean 9.8% Mean 21.1%Median 1.4% Median 9.0% Median 20.3%First Quartile -1.5% First Quartile 5.7% First Quartile 16.6%Third Quartile 7.5% Third Quartile 14.3% Third Quartile 24.8%
Southwest Airlines Co. 13,502.4$ AMR Corporation 26,534.0$ AMR Corporation 19,886.0$ AMR Corporation 5,397.7 UAL Corporation 24,720.0 UAL Corporation 19,230.0 Delta Air Lines, Inc. 4,860.0 Delta Air Lines, Inc. 22,100.0 Delta Air Lines, Inc. 16,672.0 US Airways Group, Inc. 2,378.6 Northwest Airlines Corporation 12,003.0 Northwest Airlines Corporation 11,517.0 Continental Airlines, Inc. 2,220.1 US Airways Group, Inc. 9,381.0 Continental Airlines, Inc. 10,073.0 Northwest Airlines Corporation 1,926.7 Continental Airlines, Inc. 9,268.0 US Airways Group, Inc. 9,412.0 UAL Corporation 1,755.6 Southwest Airlines Co. 7,065.9 Southwest Airlines Co. 5,835.5 Alaska Air Group Inc. 680.5 Alaska Air Group Inc. 2,611.2 Trans World Airlines, Inc. 3,584.8 AirTran Holdings, LLC 522.1 Trans World Airlines, Inc. 2,113.5 America West Holdings Corporation 2,368.9 America West Holdings Corporation 323.0 America West Holdings Corporation 1,580.3 Alaska Air Group Inc. 2,203.5 AmTran, Inc. 109.6 AmTran, Inc. 1,104.1 AmTran, Inc. 1,317.7 Trans World Airlines, Inc. 7.9 AirTran Holdings, LLC 542.6 AirTran Holdings, LLC 665.4
Mean 2,807.0 Mean 9,918.6 Mean 8,563.8 Median 1,841.1 Median 8,166.9 Median 7,623.8 First Quartile 372.7 First Quartile 1,713.6 First Quartile 2,244.9 Third Quartile 4,239.6 Third Quartile 19,575.8 Third Quartile 15,383.3
Growth Growth Growth(LTM Revenue) (LTM EBITDA) (LTM EBITDAR)
Profitability Profitability Profitability(LTM EBIT Margin) (LTM EBITDA Margin) (LTM EBITDAR Margin)
Size Size Size(Market Value of Equity) (Total Assets) (LTM Revenue)

t
Trans World Airlines, Inc. Exhibit 4 - B
Solvency Analysis Page 3 of 14Market Approach: Guideline Publicly Traded Company MethodAs of March 31, 2001(U.S. dollars in thousands, except stock prices)
[A] [B] [C] = [A] * [B]Stock Price as of
3/31/01Shares
OutstandingMarket Value of
Equity (MVE)
7.84$ 66,591 522,073$
[D] [E] [F] [G] [H][I] =
[D] + [E] + [F] + [G] + [H]
Current Maturities of LT Debt
Long Term Debt Capital Leases
Preferred Stock
PV of Operating Leases Total Debt
68,246$ 295,718$ -$ -$ 247,301$ 611,265$
[C] [I] [J] = [C] + [I]Market Value of Equity
(MVE) Total DebtTotal Enterprise
Value
522,073$ 611,265$ 1,133,339$
[K] [L] [M] [N] = [M] + [L] - [K]3 Months Ended
3/31/0012 Months Ended
12/31/003 Months Ended
3/31/01LTM
3/31/01
Revenue 132,408$ 624,094$ 173,743$ 665,429$
[O] [P] [Q] [R] = [Q] + [P] - [O]3 Months Ended
3/31/0012 Months Ended
12/31/003 Months Ended
3/31/01LTM
3/31/01
EBITDA 17,712$ 107,229$ 26,386$ 115,903$
Aircraft Rent 1,897 12,616 5,747 16,466
Other Rent 7,032 28,752 9,302 31,022
EBITDAR 26,641$ 148,597$ 41,435$ 163,391$
[J] [R] [S] = [J] / [R] [J] [N] [T] = [J] / [N]
Total Enterprise ValueLTM
EBITDARTEV/
EBITDARTotal Enterprise
ValueLTM
RevenueTEV/
Revenue
1,133,339$ 163,391$ 6.94x 1,133,339$ 665,429$ 1.70x
Source: Bloomberg Database, December 31, 2000 Form 10-K and March 31, 2001 Form 10-Q.
AirTran Holdings, LLC
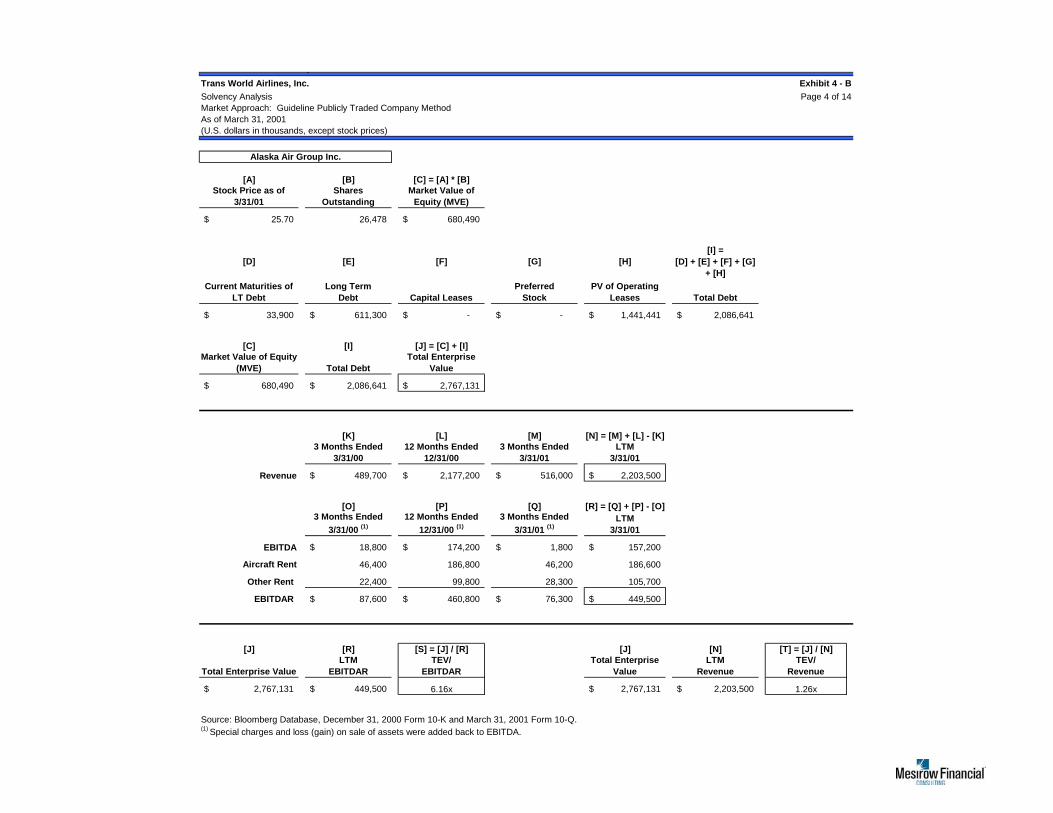
t
Trans World Airlines, Inc. Exhibit 4 - B
Solvency Analysis Page 4 of 14Market Approach: Guideline Publicly Traded Company MethodAs of March 31, 2001(U.S. dollars in thousands, except stock prices)
[A] [B] [C] = [A] * [B]Stock Price as of
3/31/01Shares
OutstandingMarket Value of
Equity (MVE)
25.70$ 26,478 680,490$
[D] [E] [F] [G] [H][I] =
[D] + [E] + [F] + [G] + [H]
Current Maturities of LT Debt
Long Term Debt Capital Leases
Preferred Stock
PV of Operating Leases Total Debt
33,900$ 611,300$ -$ -$ 1,441,441$ 2,086,641$
[C] [I] [J] = [C] + [I]Market Value of Equity
(MVE) Total DebtTotal Enterprise
Value
680,490$ 2,086,641$ 2,767,131$
[K] [L] [M] [N] = [M] + [L] - [K]3 Months Ended
3/31/0012 Months Ended
12/31/003 Months Ended
3/31/01LTM
3/31/01
Revenue 489,700$ 2,177,200$ 516,000$ 2,203,500$
[O] [P] [Q] [R] = [Q] + [P] - [O]3 Months Ended
3/31/00 (1)
12 Months Ended
12/31/00 (1)
3 Months Ended
3/31/01 (1)LTM
3/31/01
EBITDA 18,800$ 174,200$ 1,800$ 157,200$
Aircraft Rent 46,400 186,800 46,200 186,600
Other Rent 22,400 99,800 28,300 105,700
EBITDAR 87,600$ 460,800$ 76,300$ 449,500$
[J] [R] [S] = [J] / [R] [J] [N] [T] = [J] / [N]
Total Enterprise ValueLTM
EBITDARTEV/
EBITDARTotal Enterprise
ValueLTM
RevenueTEV/
Revenue
2,767,131$ 449,500$ 6.16x 2,767,131$ 2,203,500$ 1.26x
Source: Bloomberg Database, December 31, 2000 Form 10-K and March 31, 2001 Form 10-Q.(1) Special charges and loss (gain) on sale of assets were added back to EBITDA.
Alaska Air Group Inc.
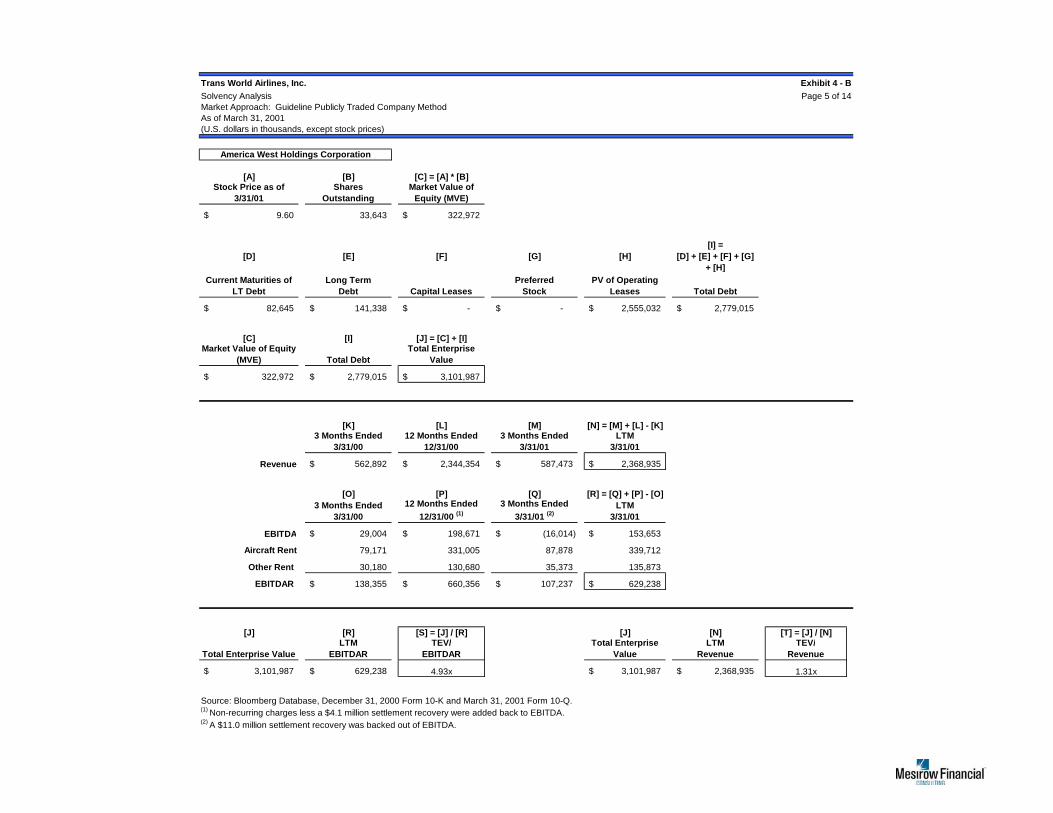
t
Trans World Airlines, Inc. Exhibit 4 - B
Solvency Analysis Page 5 of 14Market Approach: Guideline Publicly Traded Company MethodAs of March 31, 2001(U.S. dollars in thousands, except stock prices)
[A] [B] [C] = [A] * [B]Stock Price as of
3/31/01Shares
OutstandingMarket Value of
Equity (MVE)
9.60$ 33,643 322,972$
[D] [E] [F] [G] [H][I] =
[D] + [E] + [F] + [G] + [H]
Current Maturities of LT Debt
Long Term Debt Capital Leases
Preferred Stock
PV of Operating Leases Total Debt
82,645$ 141,338$ -$ -$ 2,555,032$ 2,779,015$
[C] [I] [J] = [C] + [I]Market Value of Equity
(MVE) Total DebtTotal Enterprise
Value
322,972$ 2,779,015$ 3,101,987$
[K] [L] [M] [N] = [M] + [L] - [K]3 Months Ended
3/31/0012 Months Ended
12/31/003 Months Ended
3/31/01LTM
3/31/01
Revenue 562,892$ 2,344,354$ 587,473$ 2,368,935$
[O] [P] [Q] [R] = [Q] + [P] - [O]3 Months Ended
3/31/00
12 Months Ended
12/31/00 (1)
3 Months Ended
3/31/01 (2)LTM
3/31/01
EBITDA 29,004$ 198,671$ (16,014)$ 153,653$
Aircraft Rent 79,171 331,005 87,878 339,712
Other Rent 30,180 130,680 35,373 135,873
EBITDAR 138,355$ 660,356$ 107,237$ 629,238$
[J] [R] [S] = [J] / [R] [J] [N] [T] = [J] / [N]
Total Enterprise ValueLTM
EBITDARTEV/
EBITDARTotal Enterprise
ValueLTM
RevenueTEV/
Revenue
3,101,987$ 629,238$ 4.93x 3,101,987$ 2,368,935$ 1.31x
Source: Bloomberg Database, December 31, 2000 Form 10-K and March 31, 2001 Form 10-Q.(1) Non-recurring charges less a $4.1 million settlement recovery were added back to EBITDA.(2) A $11.0 million settlement recovery was backed out of EBITDA.
America West Holdings Corporation
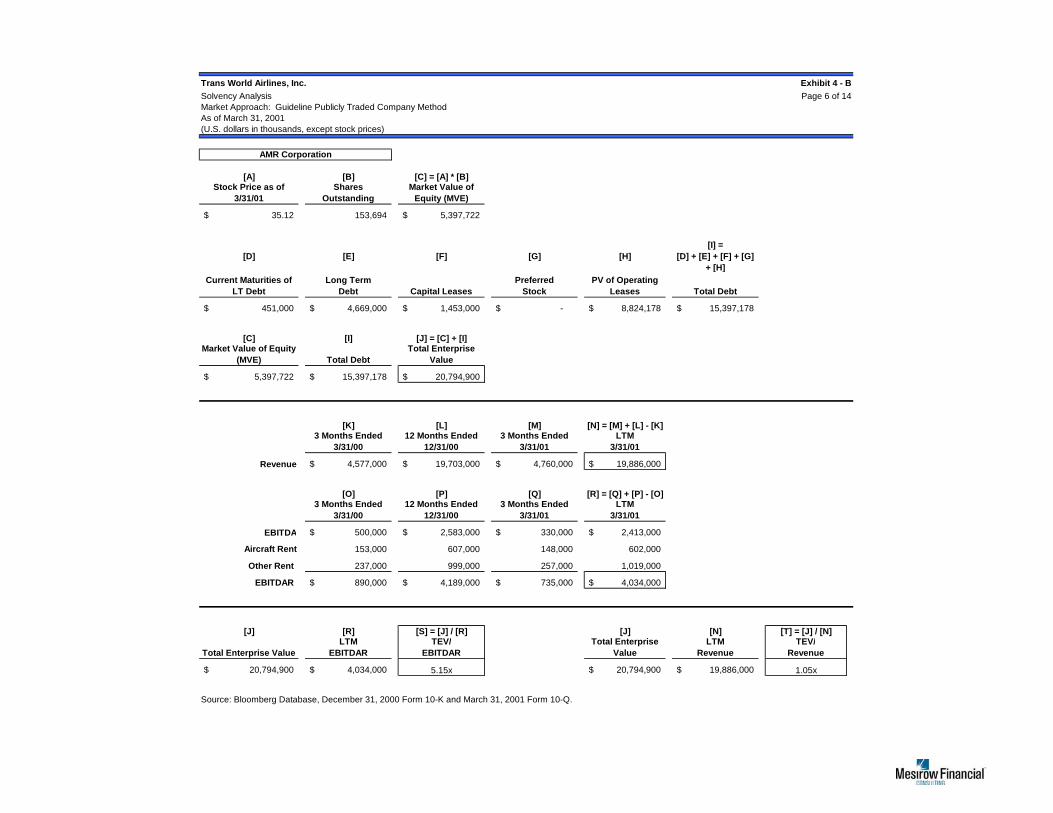
t
Trans World Airlines, Inc. Exhibit 4 - B
Solvency Analysis Page 6 of 14Market Approach: Guideline Publicly Traded Company MethodAs of March 31, 2001(U.S. dollars in thousands, except stock prices)
[A] [B] [C] = [A] * [B]Stock Price as of
3/31/01Shares
OutstandingMarket Value of
Equity (MVE)
35.12$ 153,694 5,397,722$
[D] [E] [F] [G] [H][I] =
[D] + [E] + [F] + [G] + [H]
Current Maturities of LT Debt
Long Term Debt Capital Leases
Preferred Stock
PV of Operating Leases Total Debt
451,000$ 4,669,000$ 1,453,000$ -$ 8,824,178$ 15,397,178$
[C] [I] [J] = [C] + [I]Market Value of Equity
(MVE) Total DebtTotal Enterprise
Value
5,397,722$ 15,397,178$ 20,794,900$
[K] [L] [M] [N] = [M] + [L] - [K]3 Months Ended
3/31/0012 Months Ended
12/31/003 Months Ended
3/31/01LTM
3/31/01
Revenue 4,577,000$ 19,703,000$ 4,760,000$ 19,886,000$
[O] [P] [Q] [R] = [Q] + [P] - [O]3 Months Ended
3/31/0012 Months Ended
12/31/003 Months Ended
3/31/01LTM
3/31/01
EBITDA 500,000$ 2,583,000$ 330,000$ 2,413,000$
Aircraft Rent 153,000 607,000 148,000 602,000
Other Rent 237,000 999,000 257,000 1,019,000
EBITDAR 890,000$ 4,189,000$ 735,000$ 4,034,000$
[J] [R] [S] = [J] / [R] [J] [N] [T] = [J] / [N]
Total Enterprise ValueLTM
EBITDARTEV/
EBITDARTotal Enterprise
ValueLTM
RevenueTEV/
Revenue
20,794,900$ 4,034,000$ 5.15x 20,794,900$ 19,886,000$ 1.05x
Source: Bloomberg Database, December 31, 2000 Form 10-K and March 31, 2001 Form 10-Q.
AMR Corporation

t
Trans World Airlines, Inc. Exhibit 4 - B
Solvency Analysis Page 7 of 14Market Approach: Guideline Publicly Traded Company MethodAs of March 31, 2001(U.S. dollars in thousands, except stock prices)
[A] [B] [C] = [A] * [B]Stock Price as of
3/31/01Shares
OutstandingMarket Value of
Equity (MVE)
9.63$ 11,384 109,568$
[D] [E] [F] [G] [H][I] =
[D] + [E] + [F] + [G] + [H]
Current Maturities of LT Debt
Long Term Debt Capital Leases
Preferred Stock
PV of Operating Leases Total Debt
108,905$ 380,002$ -$ 80,000$ 575,335$ 1,144,242$
[C] [I] [J] = [C] + [I]Market Value of Equity
(MVE) Total DebtTotal Enterprise
Value
109,568$ 1,144,242$ 1,253,811$
[K] [L] [M] [N] = [M] + [L] - [K]3 Months Ended
3/31/0012 Months Ended
12/31/003 Months Ended
3/31/01LTM
3/31/01
Revenue 321,336$ 1,291,553$ 347,485$ 1,317,702$
[O] [P] [Q] [R] = [Q] + [P] - [O]3 Months Ended
3/31/0012 Months Ended
12/31/003 Months Ended
3/31/01LTM
3/31/01
EBITDA 34,136$ 127,611$ 33,264$ 126,739$
Aircraft Rent 16,086 72,145 19,989 76,048
Other Rent 3,699 15,817 4,501 16,619
EBITDAR 53,921$ 215,573$ 57,754$ 219,406$
[J] [R] [S] = [J] / [R] [J] [N] [T] = [J] / [N]
Total Enterprise ValueLTM
EBITDARTEV/
EBITDARTotal Enterprise
ValueLTM
RevenueTEV/
Revenue
1,253,811$ 219,406$ 5.71x 1,253,811$ 1,317,702$ 0.95x
Source: Bloomberg Database, December 31, 2000 Form 10-K and March 31, 2001 Form 10-Q.
AmTran, Inc.

t
Trans World Airlines, Inc. Exhibit 4 - B
Solvency Analysis Page 8 of 14Market Approach: Guideline Publicly Traded Company MethodAs of March 31, 2001(U.S. dollars in thousands, except stock prices)
[A] [B] [C] = [A] * [B]Stock Price as of
3/31/01Shares
OutstandingMarket Value of
Equity (MVE)
41.40$ 53,625 2,220,069$
[D] [E] [F] [G] [H][I] =
[D] + [E] + [F] + [G] + [H]
Current Maturities of LT Debt
Long Term Debt Capital Leases
Preferred Stock
PV of Operating Leases Total Debt
361,000$ 3,882,000$ -$ -$ 6,995,978$ 11,238,978$
[C] [I] [J] = [C] + [I]Market Value of Equity
(MVE) Total DebtTotal Enterprise
Value
2,220,069$ 11,238,978$ 13,459,046$
[K] [L] [M] [N] = [M] + [L] - [K]3 Months Ended
3/31/0012 Months Ended
12/31/003 Months Ended
3/31/01LTM
3/31/01
Revenue 2,277,000$ 9,899,000$ 2,451,000$ 10,073,000$
[O] [P] [Q] [R] = [Q] + [P] - [O]3 Months Ended
3/31/0012 Months Ended
12/31/003 Months Ended
3/31/01LTM
3/31/01
EBITDA 158,000$ 1,086,000$ 181,000$ 1,109,000$
Aircraft Rent 206,000 844,000 214,000 852,000
Other Rent 129,000 532,000 141,000 544,000
EBITDAR 493,000$ 2,462,000$ 536,000$ 2,505,000$
[J] [R] [S] = [J] / [R] [J] [N] [T] = [J] / [N]
Total Enterprise ValueLTM
EBITDARTEV/
EBITDARTotal Enterprise
ValueLTM
RevenueTEV/
Revenue
13,459,046$ 2,505,000$ 5.37x 13,459,046$ 10,073,000$ 1.34x
Source: Bloomberg Database, December 31, 2000 Form 10-K and March 31, 2001 Form 10-Q.
Continental Airlines, Inc.

t
Trans World Airlines, Inc. Exhibit 4 - B
Solvency Analysis Page 9 of 14Market Approach: Guideline Publicly Traded Company MethodAs of March 31, 2001(U.S. dollars in thousands, except stock prices)
[A] [B] [C] = [A] * [B]Stock Price as of
3/31/01Shares
OutstandingMarket Value of
Equity (MVE)
39.50$ 123,038 4,859,999$
[D] [E] [F] [G] [H][I] =
[D] + [E] + [F] + [G] + [H]
Current Maturities of LT Debt
Long Term Debt Capital Leases
Preferred Stock
PV of Operating Leases Total Debt
63,000$ 5,896,000$ 134,000$ 233,000$ 9,437,765$ 15,763,765$
[C] [I] [J] = [C] + [I]Market Value of Equity
(MVE) Total DebtTotal Enterprise
Value
4,859,999$ 15,763,765$ 20,623,764$
[K] [L] [M] [N] = [M] + [L] - [K]3 Months Ended
3/31/0012 Months Ended
12/31/003 Months Ended
3/31/01LTM
3/31/01
Revenue 3,911,000$ 16,741,000$ 3,842,000$ 16,672,000$
[O] [P] [Q] [R] = [Q] + [P] - [O]3 Months Ended
3/31/00
12 Months Ended
12/31/00 (1)3 Months Ended
3/31/01LTM
3/31/01
EBITDA 640,000$ 2,932,000$ 209,000$ 2,501,000$
Aircraft Rent 185,000 741,000 188,000 744,000
Other Rent 188,000 771,000 202,000 785,000
EBITDAR 1,013,000$ 4,444,000$ 599,000$ 4,030,000$
[J] [R] [S] = [J] / [R] [J] [N] [T] = [J] / [N]
Total Enterprise ValueLTM
EBITDARTEV/
EBITDARTotal Enterprise
ValueLTM
RevenueTEV/
Revenue
20,623,764$ 4,030,000$ 5.12x 20,623,764$ 16,672,000$ 1.24x
Source: Bloomberg Database, December 31, 2000 Form 10-K and March 31, 2001 Form 10-Q.(1) Asset writedowns and other special charges were added back to EBITDA.
Delta Air Lines, Inc.

t
Trans World Airlines, Inc. Exhibit 4 - B
Solvency Analysis Page 10 of 14Market Approach: Guideline Publicly Traded Company MethodAs of March 31, 2001(U.S. dollars in thousands, except stock prices)
[A] [B] [C] = [A] * [B]Stock Price as of
3/31/01Shares
OutstandingMarket Value of
Equity (MVE)
17.75$ 760,700 13,502,425$
[D] [E] [F] [G] [H][I] =
[D] + [E] + [F] + [G] + [H]
Current Maturities of LT Debt
Long Term Debt Capital Leases
Preferred Stock
PV of Operating Leases Total Debt
110,136$ 754,686$ -$ -$ 2,327,883$ 3,192,705$
[C] [I] [J] = [C] + [I]Market Value of Equity
(MVE) Total DebtTotal Enterprise
Value
13,502,425$ 3,192,705$ 16,695,130$
[K] [L] [M] [N] = [M] + [L] - [K]3 Months Ended
3/31/0012 Months Ended
12/31/003 Months Ended
3/31/01LTM
3/31/01
Revenue 1,242,647$ 5,649,560$ 1,428,617$ 5,835,530$
[O] [P] [Q] [R] = [Q] + [P] - [O]3 Months Ended
3/31/0012 Months Ended
12/31/003 Months Ended
3/31/01LTM
3/31/01
EBITDA 222,106$ 1,338,749$ 287,849$ 1,404,492$
Aircraft Rent 49,347 196,328 48,045 195,026
Other Rent 65,019 265,106 70,018 270,105
EBITDAR 336,472$ 1,800,183$ 405,912$ 1,869,623$
[J] [R] [S] = [J] / [R] [J] [N] [T] = [J] / [N]
Total Enterprise ValueLTM
EBITDARTEV/
EBITDARTotal Enterprise
ValueLTM
RevenueTEV/
Revenue
16,695,130$ 1,869,623$ 8.93x 16,695,130$ 5,835,530$ 2.86x
Source: Bloomberg Database, December 31, 2000 Form 10-K and March 31, 2001 Form 10-Q.
Southwest Airlines Co.

t
Trans World Airlines, Inc. Exhibit 4 - B
Solvency Analysis Page 11 of 14Market Approach: Guideline Publicly Traded Company MethodAs of March 31, 2001(U.S. dollars in thousands, except stock prices)
[A] [B] [C] = [A] * [B]Stock Price as of
3/31/01Shares
OutstandingMarket Value of
Equity (MVE)
22.63$ 85,156 1,926,662$
[D] [E] [F] [G] [H][I] =
[D] + [E] + [F] + [G] + [H]
Current Maturities of LT Debt
Long Term Debt Capital Leases
Preferred Stock
PV of Operating Leases Total Debt
1,375,000$ 3,629,000$ 481,000$ 230,000$ 5,263,779$ 10,978,779$
[C] [I] [J] = [C] + [I]Market Value of Equity
(MVE) Total DebtTotal Enterprise
Value
1,926,662$ 10,978,779$ 12,905,441$
[K] [L] [M] [N] = [M] + [L] - [K]3 Months Ended
3/31/0012 Months Ended
12/31/003 Months Ended
3/31/01LTM
3/31/01
Revenue 2,509,000$ 11,415,000$ 2,611,000$ 11,517,000$
[O] [P] [Q] [R] = [Q] + [P] - [O]3 Months Ended
3/31/0012 Months Ended
12/31/003 Months Ended
3/31/01LTM
3/31/01
EBITDA 118,000$ 1,186,000$ (108,000)$ 960,000$
Aircraft Rent 100,000 423,000 109,000 432,000
Other Rent 124,000 513,000 130,000 519,000
EBITDAR 342,000$ 2,122,000$ 131,000$ 1,911,000$
[J] [R] [S] = [J] / [R] [J] [N] [T] = [J] / [N]
Total Enterprise ValueLTM
EBITDARTEV/
EBITDARTotal Enterprise
ValueLTM
RevenueTEV/
Revenue
12,905,441$ 1,911,000$ 6.75x 12,905,441$ 11,517,000$ 1.12x
Source: Bloomberg Database, December 31, 2000 Form 10-K and March 31, 2001 Form 10-Q.
Northwest Airlines Corporation

t
Trans World Airlines, Inc. Exhibit 4 - B
Solvency Analysis Page 12 of 14Market Approach: Guideline Publicly Traded Company MethodAs of March 31, 2001(U.S. dollars in thousands, except stock prices)
[A] [B] [C] = [A] * [B]Stock Price as of
3/31/01Shares
OutstandingMarket Value of
Equity (MVE)
33.05$ 53,118 1,755,562$
[D] [E] [F] [G] [H][I] =
[D] + [E] + [F] + [G] + [H]
Current Maturities of LT Debt
Long Term Debt Capital Leases
Preferred Stock
PV of Operating Leases Total Debt
417,000$ 4,958,000$ 2,157,000$ 476,000$ 12,178,131$ 20,186,131$
[C] [I] [J] = [C] + [I]Market Value of Equity
(MVE) Total DebtTotal Enterprise
Value
1,755,562$ 20,186,131$ 21,941,693$
[K] [L] [M] [N] = [M] + [L] - [K]3 Months Ended
3/31/0012 Months Ended
12/31/003 Months Ended
3/31/01LTM
3/31/01
Revenue 4,546,000$ 19,352,000$ 4,424,000$ 19,230,000$
[O] [P] [Q] [R] = [Q] + [P] - [O]3 Months Ended
3/31/00 (1)12 Months Ended
12/31/003 Months Ended
3/31/01LTM
3/31/01
EBITDA 525,000$ 1,712,000$ (139,000)$ 1,048,000$
Aircraft Rent 222,000 919,000 208,000 905,000
Other Rent 229,000 959,000 235,000 965,000
EBITDAR 976,000$ 3,590,000$ 304,000$ 2,918,000$
[J] [R] [S] = [J] / [R] [J] [N] [T] = [J] / [N]
Total Enterprise ValueLTM
EBITDARTEV/
EBITDARTotal Enterprise
ValueLTM
RevenueTEV/
Revenue
21,941,693$ 2,918,000$ 7.52x 21,941,693$ 19,230,000$ 1.14x
Source: Bloomberg Database, December 31, 2000 Form 10-K and March 31, 2001 Form 10-Q.(1) Special charges were added back to EBITDA.
UAL Corporation

t
Trans World Airlines, Inc. Exhibit 4 - B
Solvency Analysis Page 13 of 14Market Approach: Guideline Publicly Traded Company MethodAs of March 31, 2001(U.S. dollars in thousands, except stock prices)
[A] [B] [C] = [A] * [B]Stock Price as of
3/31/01Shares
OutstandingMarket Value of
Equity (MVE)
35.45$ 67,096 2,378,553$
[D] [E] [F] [G] [H][I] =
[D] + [E] + [F] + [G] + [H]
Current Maturities of LT Debt
Long Term Debt Capital Leases
Preferred Stock
PV of Operating Leases Total Debt
123,000$ 3,052,000$ -$ -$ 6,215,524$ 9,390,524$
[C] [I] [J] = [C] + [I]Market Value of Equity
(MVE) Total DebtTotal Enterprise
Value
2,378,553$ 9,390,524$ 11,769,077$
[K] [L] [M] [N] = [M] + [L] - [K]3 Months Ended
3/31/0012 Months Ended
12/31/003 Months Ended
3/31/01LTM
3/31/01
Revenue 2,098,000$ 9,269,000$ 2,241,000$ 9,412,000$
[O] [P] [Q] [R] = [Q] + [P] - [O]3 Months Ended
3/31/0012 Months Ended
12/31/003 Months Ended
3/31/01LTM
3/31/01
EBITDA (48,000)$ 316,000$ (110,000)$ 254,000$
Aircraft Rent 126,000 519,000 138,000 531,000
Other Rent 112,000 448,000 118,000 454,000
EBITDAR 190,000$ 1,283,000$ 146,000$ 1,239,000$
[J] [R] [S] = [J] / [R] [J] [N] [T] = [J] / [N]
Total Enterprise ValueLTM
EBITDARTEV/
EBITDARTotal Enterprise
ValueLTM
RevenueTEV/
Revenue
11,769,077$ 1,239,000$ 9.50x 11,769,077$ 9,412,000$ 1.25x
Source: Bloomberg Database, December 31, 2000 Form 10-K and March 31, 2001 Form 10-Q.
US Airways Group, Inc.
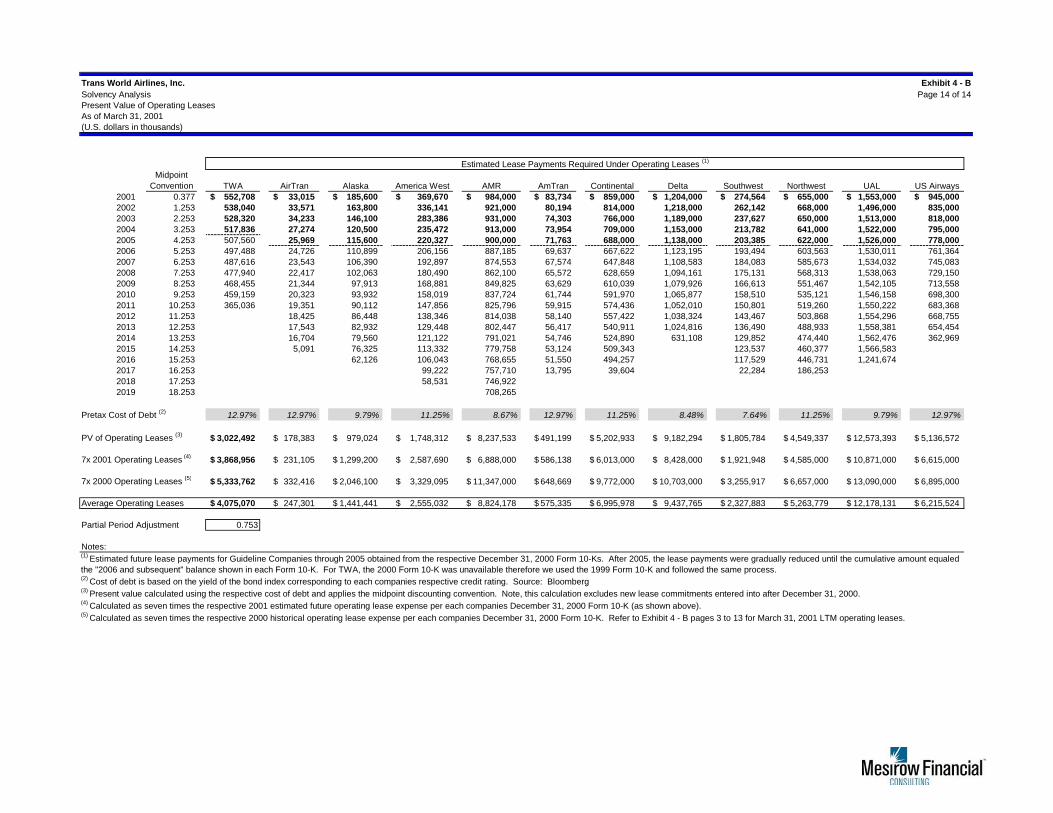
Trans World Airlines, Inc. Exhibit 4 - BSolvency Analysis Page 14 of 14Present Value of Operating LeasesAs of March 31, 2001(U.S. dollars in thousands)
Midpoint Convention TWA AirTran Alaska America West AMR AmTran Continental Delta Southwest Northwest UAL US Airways
2001 0.377 552,708$ 33,015$ 185,600$ 369,670$ 984,000$ 83,734$ 859,000$ 1,204,000$ 274,564$ 655,000$ 1,553,000$ 945,000$ 2002 1.253 538,040 33,571 163,800 336,141 921,000 80,194 814,000 1,218,000 262,142 668,000 1,496,000 835,0002003 2.253 528,320 34,233 146,100 283,386 931,000 74,303 766,000 1,189,000 237,627 650,000 1,513,000 818,0002004 3.253 517,836 27,274 120,500 235,472 913,000 73,954 709,000 1,153,000 213,782 641,000 1,522,000 795,0002005 4.253 507,560 25,969 115,600 220,327 900,000 71,763 688,000 1,138,000 203,385 622,000 1,526,000 778,0002006 5.253 497,488 24,726 110,899 206,156 887,185 69,637 667,622 1,123,195 193,494 603,563 1,530,011 761,3642007 6.253 487,616 23,543 106,390 192,897 874,553 67,574 647,848 1,108,583 184,083 585,673 1,534,032 745,0832008 7.253 477,940 22,417 102,063 180,490 862,100 65,572 628,659 1,094,161 175,131 568,313 1,538,063 729,1502009 8.253 468,455 21,344 97,913 168,881 849,825 63,629 610,039 1,079,926 166,613 551,467 1,542,105 713,5582010 9.253 459,159 20,323 93,932 158,019 837,724 61,744 591,970 1,065,877 158,510 535,121 1,546,158 698,3002011 10.253 365,036 19,351 90,112 147,856 825,796 59,915 574,436 1,052,010 150,801 519,260 1,550,222 683,3682012 11.253 18,425 86,448 138,346 814,038 58,140 557,422 1,038,324 143,467 503,868 1,554,296 668,7552013 12.253 17,543 82,932 129,448 802,447 56,417 540,911 1,024,816 136,490 488,933 1,558,381 654,4542014 13.253 16,704 79,560 121,122 791,021 54,746 524,890 631,108 129,852 474,440 1,562,476 362,9692015 14.253 5,091 76,325 113,332 779,758 53,124 509,343 123,537 460,377 1,566,5832016 15.253 62,126 106,043 768,655 51,550 494,257 117,529 446,731 1,241,6742017 16.253 99,222 757,710 13,795 39,604 22,284 186,2532018 17.253 58,531 746,9222019 18.253 708,265
Pretax Cost of Debt (2) 12.97% 12.97% 9.79% 11.25% 8.67% 12.97% 11.25% 8.48% 7.64% 11.25% 9.79% 12.97%
PV of Operating Leases (3) 3,022,492$ 178,383$ 979,024$ 1,748,312$ 8,237,533$ 491,199$ 5,202,933$ 9,182,294$ 1,805,784$ 4,549,337$ 12,573,393$ 5,136,572$
7x 2001 Operating Leases (4) 3,868,956$ 231,105$ 1,299,200$ 2,587,690$ 6,888,000$ 586,138$ 6,013,000$ 8,428,000$ 1,921,948$ 4,585,000$ 10,871,000$ 6,615,000$
7x 2000 Operating Leases (5) 5,333,762$ 332,416$ 2,046,100$ 3,329,095$ 11,347,000$ 648,669$ 9,772,000$ 10,703,000$ 3,255,917$ 6,657,000$ 13,090,000$ 6,895,000$
Average Operating Leases 4,075,070$ 247,301$ 1,441,441$ 2,555,032$ 8,824,178$ 575,335$ 6,995,978$ 9,437,765$ 2,327,883$ 5,263,779$ 12,178,131$ 6,215,524$
Partial Period Adjustment 0.753
Notes:
(2) Cost of debt is based on the yield of the bond index corresponding to each companies respective credit rating. Source: Bloomberg(3) Present value calculated using the respective cost of debt and applies the midpoint discounting convention. Note, this calculation excludes new lease commitments entered into after December 31, 2000.(4) Calculated as seven times the respective 2001 estimated future operating lease expense per each companies December 31, 2000 Form 10-K (as shown above).(5) Calculated as seven times the respective 2000 historical operating lease expense per each companies December 31, 2000 Form 10-K. Refer to Exhibit 4 - B pages 3 to 13 for March 31, 2001 LTM operating leases.
(1) Estimated future lease payments for Guideline Companies through 2005 obtained from the respective December 31, 2000 Form 10-Ks. After 2005, the lease payments were gradually reduced until the cumulative amount equaled the "2006 and subsequent" balance shown in each Form 10-K. For TWA, the 2000 Form 10-K was unavailable therefore we used the 1999 Form 10-K and followed the same process.
Estimated Lease Payments Required Under Operating Leases (1)
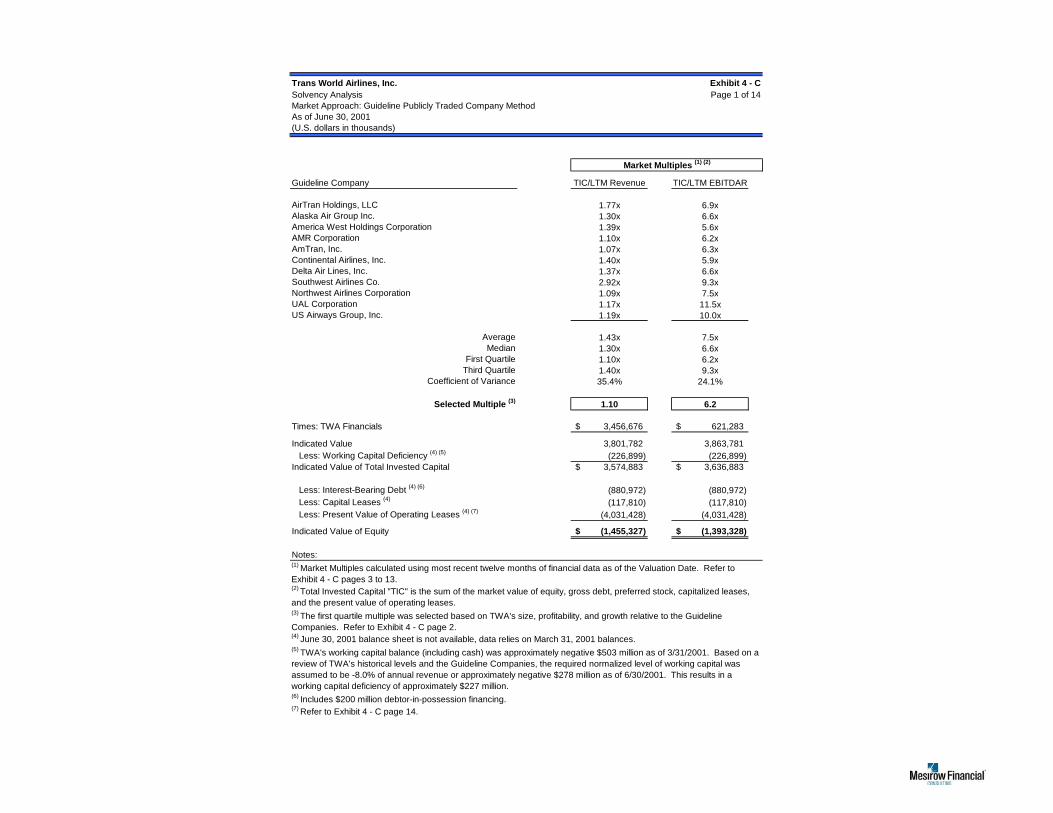
Trans World Airlines, Inc. Exhibit 4 - CSolvency Analysis Page 1 of 14Market Approach: Guideline Publicly Traded Company MethodAs of June 30, 2001(U.S. dollars in thousands)
Market Multiples (1) (2)
Guideline Company TIC/LTM Revenue TIC/LTM EBITDAR
AirTran Holdings, LLC 1.77x 6.9xAlaska Air Group Inc. 1.30x 6.6xAmerica West Holdings Corporation 1.39x 5.6xAMR Corporation 1.10x 6.2xAmTran, Inc. 1.07x 6.3xContinental Airlines, Inc. 1.40x 5.9xDelta Air Lines, Inc. 1.37x 6.6xSouthwest Airlines Co. 2.92x 9.3xNorthwest Airlines Corporation 1.09x 7.5xUAL Corporation 1.17x 11.5xUS Airways Group, Inc. 1.19x 10.0x
Average 1.43x 7.5xMedian 1.30x 6.6x
First Quartile 1.10x 6.2xThird Quartile 1.40x 9.3x
Coefficient of Variance 35.4% 24.1%
Selected Multiple (3) 1.10 6.2
Times: TWA Financials 3,456,676$ 621,283$
Indicated Value 3,801,782 3,863,781 Less: Working Capital Deficiency (4) (5) (226,899) (226,899) Indicated Value of Total Invested Capital 3,574,883$ 3,636,883$
Less: Interest-Bearing Debt (4) (6) (880,972) (880,972) Less: Capital Leases (4) (117,810) (117,810) Less: Present Value of Operating Leases (4) (7) (4,031,428) (4,031,428)
Indicated Value of Equity (1,455,327)$ (1,393,328)$
Notes:
(4) June 30, 2001 balance sheet is not available, data relies on March 31, 2001 balances.
(6) Includes $200 million debtor-in-possession financing. (7) Refer to Exhibit 4 - C page 14.
(2) Total Invested Capital "TIC" is the sum of the market value of equity, gross debt, preferred stock, capitalized leases, and the present value of operating leases.(3) The first quartile multiple was selected based on TWA's size, profitability, and growth relative to the Guideline Companies. Refer to Exhibit 4 - C page 2.
(1) Market Multiples calculated using most recent twelve months of financial data as of the Valuation Date. Refer to Exhibit 4 - C pages 3 to 13.
(5) TWA's working capital balance (including cash) was approximately negative $503 million as of 3/31/2001. Based on a review of TWA's historical levels and the Guideline Companies, the required normalized level of working capital was assumed to be -8.0% of annual revenue or approximately negative $278 million as of 6/30/2001. This results in a working capital deficiency of approximately $227 million.

Trans World Airlines, Inc. Exhibit 4 - C
Solvency Analysis Page 2 of 14Benchmarking AnalysisAs of June 30, 2001(U.S. dollars in millions)
AirTran Holdings, LLC 32.3% AirTran Holdings, LLC 35.9% AirTran Holdings, LLC 41.7%Southwest Airlines Co. 15.3% Southwest Airlines Co. 23.4% Southwest Airlines Co. 18.2%AmTran, Inc. 10.6% Continental Airlines, Inc. -3.7% Continental Airlines, Inc. 1.9%AMR Corporation 9.0% AmTran, Inc. -22.3% US Airways Group, Inc. -2.0%Continental Airlines, Inc. 8.6% AMR Corporation -27.9% Trans World Airlines, Inc. -2.7%US Airways Group, Inc. 8.0% Delta Air Lines, Inc. -39.9% AmTran, Inc. -6.2%Northwest Airlines Corporation 5.1% Northwest Airlines Corporation -44.4% AMR Corporation -12.9%Alaska Air Group Inc. 4.5% Alaska Air Group Inc. -48.3% Alaska Air Group Inc. -20.7%America West Holdings Corporation 1.5% US Airways Group, Inc. -48.4% Northwest Airlines Corporation -22.4%Trans World Airlines, Inc. 0.4% Trans World Airlines, Inc. -58.5% America West Holdings Corporation -24.0%Delta Air Lines, Inc. 0.4% America West Holdings Corporation -72.6% Delta Air Lines, Inc. -24.8%UAL Corporation -1.0% UAL Corporation -98.1% UAL Corporation -57.6%
Mean 7.9% Mean -33.7% Mean -9.3%Median 6.6% Median -42.2% Median -9.6%First Quartile 0.7% First Quartile -56.0% First Quartile -23.6%Third Quartile 10.2% Third Quartile -8.3% Third Quartile 0.9%
Southwest Airlines Co. 17.7% Southwest Airlines Co. 23.5% Southwest Airlines Co. 31.5%AirTran Holdings, LLC 13.5% AirTran Holdings, LLC 18.0% AirTran Holdings, LLC 25.7%Continental Airlines, Inc. 5.4% Delta Air Lines, Inc. 11.2% America West Holdings Corporation 24.6%Delta Air Lines, Inc. 3.4% Continental Airlines, Inc. 9.7% Continental Airlines, Inc. 23.8%AMR Corporation 2.8% AmTran, Inc. 9.5% Delta Air Lines, Inc. 20.7%Northwest Airlines Corporation 0.4% AMR Corporation 9.1% Alaska Air Group Inc. 19.7%AmTran, Inc. -0.3% Alaska Air Group Inc. 6.3% Trans World Airlines, Inc. 18.0%Alaska Air Group Inc. -2.4% Northwest Airlines Corporation 6.0% AMR Corporation 17.7%US Airways Group, Inc. -3.1% America West Holdings Corporation 3.8% AmTran, Inc. 16.8%America West Holdings Corporation -4.8% US Airways Group, Inc. 1.2% Northwest Airlines Corporation 14.5%UAL Corporation -5.6% UAL Corporation 0.3% US Airways Group, Inc. 12.0%Trans World Airlines, Inc. -6.7% Trans World Airlines, Inc. -3.1% UAL Corporation 10.2%
Mean 1.7% Mean 7.9% Mean 19.6%Median 0.1% Median 7.7% Median 18.9%First Quartile -4.4% First Quartile 1.9% First Quartile 15.1%Third Quartile 4.9% Third Quartile 10.8% Third Quartile 24.4%
Southwest Airlines Co. 14,102.3$ AMR Corporation 29,002.0$ AMR Corporation 20,458.0$ AMR Corporation 5,578.8 UAL Corporation 24,914.0 UAL Corporation 18,780.0 Delta Air Lines, Inc. 5,424.9 Delta Air Lines, Inc. 22,881.0 Delta Air Lines, Inc. 15,979.0 Continental Airlines, Inc. 2,693.2 Northwest Airlines Corporation 11,630.0 Northwest Airlines Corporation 11,347.0 Northwest Airlines Corporation 2,151.9 US Airways Group, Inc. 9,564.0 Continental Airlines, Inc. 10,059.0 UAL Corporation 1,898.4 Continental Airlines, Inc. 9,496.0 US Airways Group, Inc. 9,472.0 US Airways Group, Inc. 1,629.8 Southwest Airlines Co. 7,468.7 Southwest Airlines Co. 5,928.6 Alaska Air Group Inc. 765.6 Alaska Air Group Inc. 2,706.7 Trans World Airlines, Inc. 3,456.7 AirTran Holdings, LLC 683.4 Trans World Airlines, Inc. 2,113.5 America West Holdings Corporation 2,338.2 America West Holdings Corporation 335.4 America West Holdings Corporation 1,631.8 Alaska Air Group Inc. 2,230.0 AmTran, Inc. 251.1 AmTran, Inc. 1,106.5 AmTran, Inc. 1,343.0 Trans World Airlines, Inc. 3.2 AirTran Holdings, LLC 524.1 AirTran Holdings, LLC 710.4
Mean 2,959.8 Mean 10,253.2 Mean 8,508.5 Median 1,764.1 Median 8,482.3 Median 7,700.3 First Quartile 422.4 First Quartile 1,752.2 First Quartile 2,257.1 Third Quartile 4,741.9 Third Quartile 20,068.3 Third Quartile 14,821.0
Growth Growth Growth(LTM Revenue) (LTM EBITDA) (LTM EBITDAR)
Profitability Profitability Profitability(LTM EBIT Margin) (LTM EBITDA Margin) (LTM EBITDAR Margin)
Size Size Size(Market Value of Equity) (Total Assets) (LTM Revenue)

t
Trans World Airlines, Inc. Exhibit 4 - C
Solvency Analysis Page 3 of 14Market Approach: Guideline Publicly Traded Company MethodAs of June 30, 2001(U.S. dollars in thousands, except stock prices)
[A] [B] [C] = [A] * [B]Stock Price as of
6/30/01Shares
OutstandingMarket Value of
Equity (MVE)
10.25$ 66,676 683,429$
[D] [E] [F] [G] [H][I] =
[D] + [E] + [F] + [G] + [H]
Current Maturities of LT Debt
Long Term Debt Capital Leases
Preferred Stock
PV of Operating Leases Total Debt
47,275$ 261,248$ -$ -$ 266,606$ 575,129$
[C] [I] [J] = [C] + [I]Market Value of Equity
(MVE) Total DebtTotal Enterprise
Value
683,429$ 575,129$ 1,258,558$
[K] [L] [M] [N] = [M] + [L] - [K]6 Months Ended
6/30/0012 Months Ended
12/31/006 Months Ended
6/30/01LTM
6/30/01
Revenue 293,177$ 624,094$ 379,506$ 710,423$
[O] [P] [Q] [R] = [Q] + [P] - [O]6 Months Ended
6/30/0012 Months Ended
12/31/00
6 Months Ended
6/30/01 (1)LTM
6/30/01
EBITDA 55,257$ 107,229$ 75,711$ 127,683$
Aircraft Rent 4,992 12,616 14,068 21,692
Other Rent 13,739 28,752 18,177 33,190
EBITDAR 73,988$ 148,597$ 107,956$ 182,565$
[J] [R] [S] = [J] / [R] [J] [N] [T] = [J] / [N]
Total Enterprise ValueLTM
EBITDARTEV/
EBITDARTotal Enterprise
ValueLTM
RevenueTEV/
Revenue
1,258,558$ 182,565$ 6.89x 1,258,558$ 710,423$ 1.77x
Source: Bloomberg Database, December 31, 2000 Form 10-K and June 30, 2001 Form 10-Q.(1) Impairment loss/lease termination was added back to EBITDA.
AirTran Holdings, LLC

t
Trans World Airlines, Inc. Exhibit 4 - C
Solvency Analysis Page 4 of 14Market Approach: Guideline Publicly Traded Company MethodAs of June 30, 2001(U.S. dollars in thousands, except stock prices)
[A] [B] [C] = [A] * [B]Stock Price as of
6/30/01Shares
OutstandingMarket Value of
Equity (MVE)
28.90$ 26,492 765,608$
[D] [E] [F] [G] [H][I] =
[D] + [E] + [F] + [G] + [H]
Current Maturities of LT Debt
Long Term Debt Capital Leases
Preferred Stock
PV of Operating Leases Total Debt
38,600$ 656,000$ -$ -$ 1,443,571$ 2,138,171$
[C] [I] [J] = [C] + [I]Market Value of Equity
(MVE) Total DebtTotal Enterprise
Value
765,608$ 2,138,171$ 2,903,779$
[K] [L] [M] [N] = [M] + [L] - [K]6 Months Ended
6/30/0012 Months Ended
12/31/006 Months Ended
6/30/01LTM
6/30/01
Revenue 1,042,500$ 2,177,200$ 1,095,300$ 2,230,000$
[O] [P] [Q] [R] = [Q] + [P] - [O]3 Months Ended
3/31/00 (1)
12 Months Ended
12/31/00 (1)
3 Months Ended
3/31/01 (1)LTM
6/30/01
EBITDA 95,800$ 174,200$ 62,900$ 141,300$
Aircraft Rent 93,100 186,800 92,500 186,200
Other Rent 46,300 99,800 59,000 112,500
EBITDAR 235,200$ 460,800$ 214,400$ 440,000$
[J] [R] [S] = [J] / [R] [J] [N] [T] = [J] / [N]
Total Enterprise ValueLTM
EBITDARTEV/
EBITDARTotal Enterprise
ValueLTM
RevenueTEV/
Revenue
2,903,779$ 440,000$ 6.60x 2,903,779$ 2,230,000$ 1.30x
Source: Bloomberg Database, December 31, 2000 Form 10-K and June 30, 2001 Form 10-Q.(1) Special charges and loss (gain) on sale of assets were added back to EBITDA.
Alaska Air Group Inc.

t
Trans World Airlines, Inc. Exhibit 4 - C
Solvency Analysis Page 5 of 14Market Approach: Guideline Publicly Traded Company MethodAs of June 30, 2001(U.S. dollars in thousands, except stock prices)
[A] [B] [C] = [A] * [B]Stock Price as of
6/30/01Shares
OutstandingMarket Value of
Equity (MVE)
9.97$ 33,642 335,409$
[D] [E] [F] [G] [H][I] =
[D] + [E] + [F] + [G] + [H]
Current Maturities of LT Debt
Long Term Debt Capital Leases
Preferred Stock
PV of Operating Leases Total Debt
133,435$ 196,520$ -$ -$ 2,582,322$ 2,912,277$
[C] [I] [J] = [C] + [I]Market Value of Equity
(MVE) Total DebtTotal Enterprise
Value
335,409$ 2,912,277$ 3,247,686$
[K] [L] [M] [N] = [M] + [L] - [K]6 Months Ended
6/30/0012 Months Ended
12/31/006 Months Ended
6/30/01LTM
6/30/01
Revenue 1,180,819$ 2,344,354$ 1,174,672$ 2,338,207$
[O] [P] [Q] [R] = [Q] + [P] - [O]6 Months Ended
6/30/00
12 Months Ended
12/31/00 (1)
6 Months Ended
6/30/01 (2)LTM
6/30/01
EBITDA 95,731$ 198,671$ (13,305)$ 89,635$
Aircraft Rent 160,959 331,005 176,880 346,926
Other Rent 62,049 130,680 70,189 138,820
EBITDAR 318,739$ 660,356$ 233,764$ 575,381$
[J] [R] [S] = [J] / [R] [J] [N] [T] = [J] / [N]
Total Enterprise ValueLTM
EBITDARTEV/
EBITDARTotal Enterprise
ValueLTM
RevenueTEV/
Revenue
3,247,686$ 575,381$ 5.64x 3,247,686$ 2,338,207$ 1.39x
Source: Bloomberg Database, December 31, 2000 Form 10-K and June 30, 2001 Form 10-Q.(1) Non-recurring charges less a $4.1 million settlement recovery were added back to EBITDA.(2) Special charges less an $11.0 million settlement recovery were added back to EBITDA.
America West Holdings Corporation
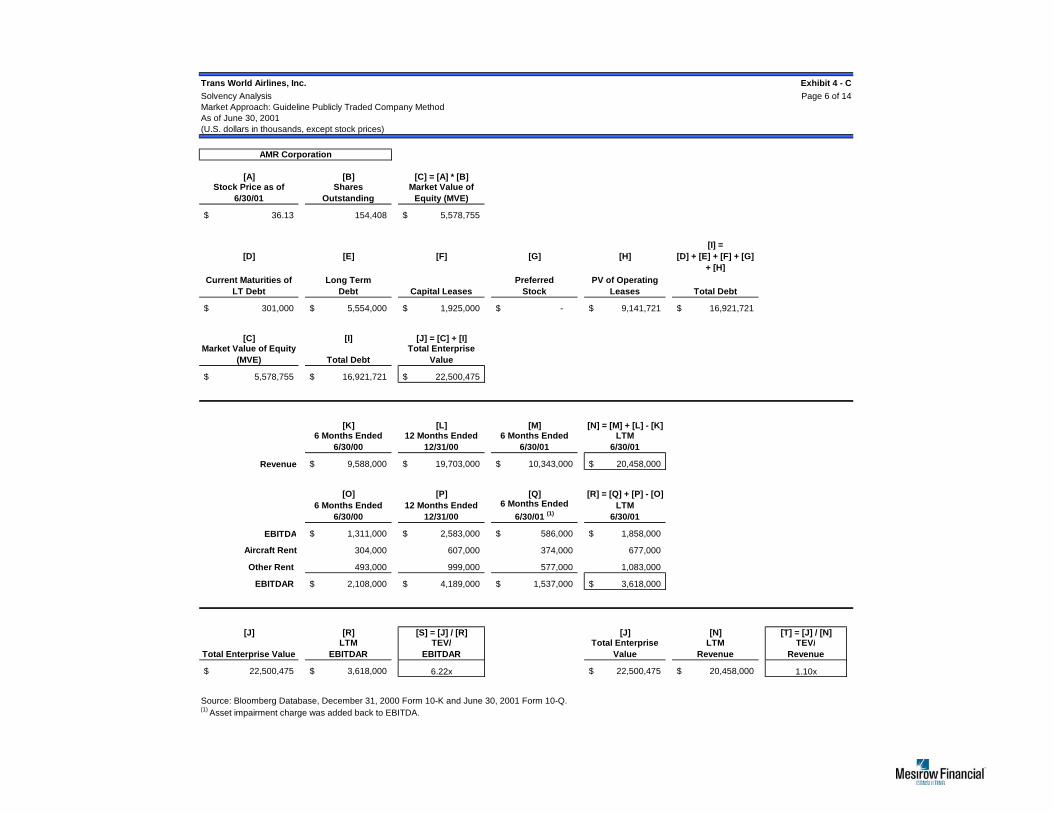
t
Trans World Airlines, Inc. Exhibit 4 - C
Solvency Analysis Page 6 of 14Market Approach: Guideline Publicly Traded Company MethodAs of June 30, 2001(U.S. dollars in thousands, except stock prices)
[A] [B] [C] = [A] * [B]Stock Price as of
6/30/01Shares
OutstandingMarket Value of
Equity (MVE)
36.13$ 154,408 5,578,755$
[D] [E] [F] [G] [H][I] =
[D] + [E] + [F] + [G] + [H]
Current Maturities of LT Debt
Long Term Debt Capital Leases
Preferred Stock
PV of Operating Leases Total Debt
301,000$ 5,554,000$ 1,925,000$ -$ 9,141,721$ 16,921,721$
[C] [I] [J] = [C] + [I]Market Value of Equity
(MVE) Total DebtTotal Enterprise
Value
5,578,755$ 16,921,721$ 22,500,475$
[K] [L] [M] [N] = [M] + [L] - [K]6 Months Ended
6/30/0012 Months Ended
12/31/006 Months Ended
6/30/01LTM
6/30/01
Revenue 9,588,000$ 19,703,000$ 10,343,000$ 20,458,000$
[O] [P] [Q] [R] = [Q] + [P] - [O]6 Months Ended
6/30/0012 Months Ended
12/31/00
6 Months Ended
6/30/01 (1)LTM
6/30/01
EBITDA 1,311,000$ 2,583,000$ 586,000$ 1,858,000$
Aircraft Rent 304,000 607,000 374,000 677,000
Other Rent 493,000 999,000 577,000 1,083,000
EBITDAR 2,108,000$ 4,189,000$ 1,537,000$ 3,618,000$
[J] [R] [S] = [J] / [R] [J] [N] [T] = [J] / [N]
Total Enterprise ValueLTM
EBITDARTEV/
EBITDARTotal Enterprise
ValueLTM
RevenueTEV/
Revenue
22,500,475$ 3,618,000$ 6.22x 22,500,475$ 20,458,000$ 1.10x
Source: Bloomberg Database, December 31, 2000 Form 10-K and June 30, 2001 Form 10-Q.(1) Asset impairment charge was added back to EBITDA.
AMR Corporation

t
Trans World Airlines, Inc. Exhibit 4 - C
Solvency Analysis Page 7 of 14Market Approach: Guideline Publicly Traded Company MethodAs of June 30, 2001(U.S. dollars in thousands, except stock prices)
[A] [B] [C] = [A] * [B]Stock Price as of
6/30/01Shares
OutstandingMarket Value of
Equity (MVE)
21.89$ 11,471 251,105$
[D] [E] [F] [G] [H][I] =
[D] + [E] + [F] + [G] + [H]
Current Maturities of LT Debt
Long Term Debt Capital Leases
Preferred Stock
PV of Operating Leases Total Debt
125,139$ 381,733$ -$ 80,000$ 595,958$ 1,182,830$
[C] [I] [J] = [C] + [I]Market Value of Equity
(MVE) Total DebtTotal Enterprise
Value
251,105$ 1,182,830$ 1,433,934$
[K] [L] [M] [N] = [M] + [L] - [K]6 Months Ended
6/30/0012 Months Ended
12/31/006 Months Ended
6/30/01LTM
6/30/01
Revenue 654,900$ 1,291,553$ 706,380$ 1,343,033$
[O] [P] [Q] [R] = [Q] + [P] - [O]6 Months Ended
6/30/0012 Months Ended
12/31/006 Months Ended
6/30/01LTM
6/30/01
EBITDA 83,539$ 127,611$ 83,569$ 127,641$
Aircraft Rent 32,862 72,145 41,395 80,678
Other Rent 7,622 15,817 9,323 17,518
EBITDAR 124,023$ 215,573$ 134,287$ 225,837$
[J] [R] [S] = [J] / [R] [J] [N] [T] = [J] / [N]
Total Enterprise ValueLTM
EBITDARTEV/
EBITDARTotal Enterprise
ValueLTM
RevenueTEV/
Revenue
1,433,934$ 225,837$ 6.35x 1,433,934$ 1,343,033$ 1.07x
Source: Bloomberg Database, December 31, 2000 Form 10-K and June 30, 2001 Form 10-Q.
AmTran, Inc.

t
Trans World Airlines, Inc. Exhibit 4 - C
Solvency Analysis Page 8 of 14Market Approach: Guideline Publicly Traded Company MethodAs of June 30, 2001(U.S. dollars in thousands, except stock prices)
[A] [B] [C] = [A] * [B]Stock Price as of
6/30/01Shares
OutstandingMarket Value of
Equity (MVE)
49.25$ 54,683 2,693,155$
[D] [E] [F] [G] [H][I] =
[D] + [E] + [F] + [G] + [H]
Current Maturities of LT Debt
Long Term Debt Capital Leases
Preferred Stock
PV of Operating Leases Total Debt
372,000$ 3,967,000$ -$ -$ 7,099,962$ 11,438,962$
[C] [I] [J] = [C] + [I]Market Value of Equity
(MVE) Total DebtTotal Enterprise
Value
2,693,155$ 11,438,962$ 14,132,117$
[K] [L] [M] [N] = [M] + [L] - [K]6 Months Ended
6/30/0012 Months Ended
12/31/006 Months Ended
6/30/01LTM
6/30/01
Revenue 4,848,000$ 9,899,000$ 5,008,000$ 10,059,000$
[O] [P] [Q] [R] = [Q] + [P] - [O]6 Months Ended
6/30/0012 Months Ended
12/31/006 Months Ended
6/30/01LTM
6/30/01
EBITDA 542,000$ 1,086,000$ 429,000$ 973,000$
Aircraft Rent 416,000 844,000 437,000 865,000
Other Rent 267,000 532,000 294,000 559,000
EBITDAR 1,225,000$ 2,462,000$ 1,160,000$ 2,397,000$
[J] [R] [S] = [J] / [R] [J] [N] [T] = [J] / [N]
Total Enterprise ValueLTM
EBITDARTEV/
EBITDARTotal Enterprise
ValueLTM
RevenueTEV/
Revenue
14,132,117$ 2,397,000$ 5.90x 14,132,117$ 10,059,000$ 1.40x
Source: Bloomberg Database, December 31, 2000 Form 10-K and June 30, 2001 Form 10-Q.
Continental Airlines, Inc.

t
Trans World Airlines, Inc. Exhibit 4 - C
Solvency Analysis Page 9 of 14Market Approach: Guideline Publicly Traded Company MethodAs of June 30, 2001(U.S. dollars in thousands, except stock prices)
[A] [B] [C] = [A] * [B]Stock Price as of
6/30/01Shares
OutstandingMarket Value of
Equity (MVE)
44.08$ 123,069 5,424,879$
[D] [E] [F] [G] [H][I] =
[D] + [E] + [F] + [G] + [H]
Current Maturities of LT Debt
Long Term Debt Capital Leases
Preferred Stock
PV of Operating Leases Total Debt
851,000$ 5,860,000$ 130,000$ 231,000$ 9,413,483$ 16,485,483$
[C] [I] [J] = [C] + [I]Market Value of Equity
(MVE) Total DebtTotal Enterprise
Value
5,424,879$ 16,485,483$ 21,910,361$
[K] [L] [M] [N] = [M] + [L] - [K]6 Months Ended
6/30/0012 Months Ended
12/31/006 Months Ended
6/30/01LTM
6/30/01
Revenue 8,380,000$ 16,741,000$ 7,618,000$ 15,979,000$
[O] [P] [Q] [R] = [Q] + [P] - [O]6 Months Ended
6/30/00 (1)
12 Months Ended
12/31/00 (1)
6 Months Ended
6/30/01 (1)LTM
6/30/01
EBITDA 1,634,000$ 2,932,000$ 486,000$ 1,784,000$
Aircraft Rent 371,000 741,000 374,000 744,000
Other Rent 383,000 771,000 398,000 786,000
EBITDAR 2,388,000$ 4,444,000$ 1,258,000$ 3,314,000$
[J] [R] [S] = [J] / [R] [J] [N] [T] = [J] / [N]
Total Enterprise ValueLTM
EBITDARTEV/
EBITDARTotal Enterprise
ValueLTM
RevenueTEV/
Revenue
21,910,361$ 3,314,000$ 6.61x 21,910,361$ 15,979,000$ 1.37x
Source: Bloomberg Database, December 31, 2000 Form 10-K and June 30, 2001 Form 10-Q.(1) Asset writedowns and other special charges were added back to EBITDA.
Delta Air Lines, Inc.
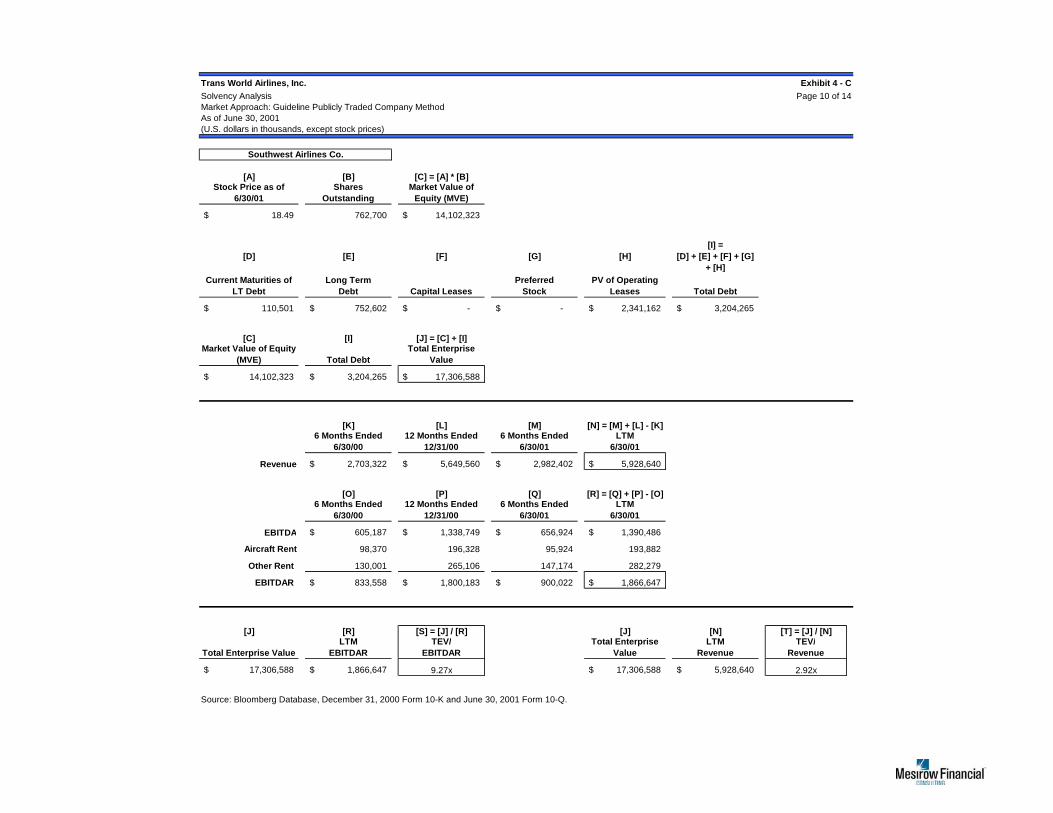
t
Trans World Airlines, Inc. Exhibit 4 - C
Solvency Analysis Page 10 of 14Market Approach: Guideline Publicly Traded Company MethodAs of June 30, 2001(U.S. dollars in thousands, except stock prices)
[A] [B] [C] = [A] * [B]Stock Price as of
6/30/01Shares
OutstandingMarket Value of
Equity (MVE)
18.49$ 762,700 14,102,323$
[D] [E] [F] [G] [H][I] =
[D] + [E] + [F] + [G] + [H]
Current Maturities of LT Debt
Long Term Debt Capital Leases
Preferred Stock
PV of Operating Leases Total Debt
110,501$ 752,602$ -$ -$ 2,341,162$ 3,204,265$
[C] [I] [J] = [C] + [I]Market Value of Equity
(MVE) Total DebtTotal Enterprise
Value
14,102,323$ 3,204,265$ 17,306,588$
[K] [L] [M] [N] = [M] + [L] - [K]6 Months Ended
6/30/0012 Months Ended
12/31/006 Months Ended
6/30/01LTM
6/30/01
Revenue 2,703,322$ 5,649,560$ 2,982,402$ 5,928,640$
[O] [P] [Q] [R] = [Q] + [P] - [O]6 Months Ended
6/30/0012 Months Ended
12/31/006 Months Ended
6/30/01LTM
6/30/01
EBITDA 605,187$ 1,338,749$ 656,924$ 1,390,486$
Aircraft Rent 98,370 196,328 95,924 193,882
Other Rent 130,001 265,106 147,174 282,279
EBITDAR 833,558$ 1,800,183$ 900,022$ 1,866,647$
[J] [R] [S] = [J] / [R] [J] [N] [T] = [J] / [N]
Total Enterprise ValueLTM
EBITDARTEV/
EBITDARTotal Enterprise
ValueLTM
RevenueTEV/
Revenue
17,306,588$ 1,866,647$ 9.27x 17,306,588$ 5,928,640$ 2.92x
Source: Bloomberg Database, December 31, 2000 Form 10-K and June 30, 2001 Form 10-Q.
Southwest Airlines Co.

t
Trans World Airlines, Inc. Exhibit 4 - C
Solvency Analysis Page 11 of 14Market Approach: Guideline Publicly Traded Company MethodAs of June 30, 2001(U.S. dollars in thousands, except stock prices)
[A] [B] [C] = [A] * [B]Stock Price as of
6/30/01Shares
OutstandingMarket Value of
Equity (MVE)
25.25$ 85,224 2,151,913$
[D] [E] [F] [G] [H][I] =
[D] + [E] + [F] + [G] + [H]
Current Maturities of LT Debt
Long Term Debt Capital Leases
Preferred Stock
PV of Operating Leases Total Debt
238,000$ 3,983,000$ 438,000$ 229,000$ 5,336,318$ 10,224,318$
[C] [I] [J] = [C] + [I]Market Value of Equity
(MVE) Total DebtTotal Enterprise
Value
2,151,913$ 10,224,318$ 12,376,231$
[K] [L] [M] [N] = [M] + [L] - [K]6 Months Ended
6/30/0012 Months Ended
12/31/006 Months Ended
6/30/01LTM
6/30/01
Revenue 5,394,000$ 11,415,000$ 5,326,000$ 11,347,000$
[O] [P] [Q] [R] = [Q] + [P] - [O]6 Months Ended
6/30/0012 Months Ended
12/31/006 Months Ended
6/30/01LTM
6/30/01
EBITDA 492,000$ 1,186,000$ (14,000)$ 680,000$
Aircraft Rent 205,000 423,000 220,000 438,000
Other Rent 252,000 513,000 264,000 525,000
EBITDAR 949,000$ 2,122,000$ 470,000$ 1,643,000$
[J] [R] [S] = [J] / [R] [J] [N] [T] = [J] / [N]
Total Enterprise ValueLTM
EBITDARTEV/
EBITDARTotal Enterprise
ValueLTM
RevenueTEV/
Revenue
12,376,231$ 1,643,000$ 7.53x 12,376,231$ 11,347,000$ 1.09x
Source: Bloomberg Database, December 31, 2000 Form 10-K and June 30, 2001 Form 10-Q.
Northwest Airlines Corporation

t
Trans World Airlines, Inc. Exhibit 4 - C
Solvency Analysis Page 12 of 14Market Approach: Guideline Publicly Traded Company MethodAs of June 30, 2001(U.S. dollars in thousands, except stock prices)
[A] [B] [C] = [A] * [B]Stock Price as of
6/30/01Shares
OutstandingMarket Value of
Equity (MVE)
35.15$ 54,009 1,898,432$
[D] [E] [F] [G] [H][I] =
[D] + [E] + [F] + [G] + [H]
Current Maturities of LT Debt
Long Term Debt Capital Leases
Preferred Stock
PV of Operating Leases Total Debt
930,000$ 4,619,000$ 2,061,000$ 443,000$ 12,071,175$ 20,124,175$
[C] [I] [J] = [C] + [I]Market Value of Equity
(MVE) Total DebtTotal Enterprise
Value
1,898,432$ 20,124,175$ 22,022,608$
[K] [L] [M] [N] = [M] + [L] - [K]6 Months Ended
6/30/0012 Months Ended
12/31/006 Months Ended
6/30/01LTM
6/30/01
Revenue 9,654,000$ 19,352,000$ 9,082,000$ 18,780,000$
[O] [P] [Q] [R] = [Q] + [P] - [O]6 Months Ended
6/30/00 (1)12 Months Ended
12/31/00
6 Months Ended
6/30/01 (1)LTM
6/30/01
EBITDA 1,438,000$ 1,712,000$ (224,000)$ 50,000$
Aircraft Rent 444,000 919,000 413,000 888,000
Other Rent 475,000 959,000 499,000 983,000
EBITDAR 2,357,000$ 3,590,000$ 688,000$ 1,921,000$
[J] [R] [S] = [J] / [R] [J] [N] [T] = [J] / [N]
Total Enterprise ValueLTM
EBITDARTEV/
EBITDARTotal Enterprise
ValueLTM
RevenueTEV/
Revenue
22,022,608$ 1,921,000$ 11.46x 22,022,608$ 18,780,000$ 1.17x
Source: Bloomberg Database, December 31, 2000 Form 10-K and June 30, 2001 Form 10-Q.(1) Special charges and US Airways merger related charges were added back to EBITDA.
UAL Corporation

t
Trans World Airlines, Inc. Exhibit 4 - C
Solvency Analysis Page 13 of 14Market Approach: Guideline Publicly Traded Company MethodAs of June 30, 2001(U.S. dollars in thousands, except stock prices)
[A] [B] [C] = [A] * [B]Stock Price as of
6/30/01Shares
OutstandingMarket Value of
Equity (MVE)
24.30$ 67,070 1,629,801$
[D] [E] [F] [G] [H][I] =
[D] + [E] + [F] + [G] + [H]
Current Maturities of LT Debt
Long Term Debt Capital Leases
Preferred Stock
PV of Operating Leases Total Debt
132,000$ 3,177,000$ -$ -$ 6,357,829$ 9,666,829$
[C] [I] [J] = [C] + [I]Market Value of Equity
(MVE) Total DebtTotal Enterprise
Value
1,629,801$ 9,666,829$ 11,296,630$
[K] [L] [M] [N] = [M] + [L] - [K]6 Months Ended
6/30/0012 Months Ended
12/31/006 Months Ended
6/30/01LTM
6/30/01
Revenue 4,531,000$ 9,269,000$ 4,734,000$ 9,472,000$
[O] [P] [Q] [R] = [Q] + [P] - [O]6 Months Ended
6/30/0012 Months Ended
12/31/006 Months Ended
6/30/01LTM
6/30/01
EBITDA 212,000$ 316,000$ 11,000$ 115,000$
Aircraft Rent 250,000 519,000 283,000 552,000
Other Rent 220,000 448,000 238,000 466,000
EBITDAR 682,000$ 1,283,000$ 532,000$ 1,133,000$
[J] [R] [S] = [J] / [R] [J] [N] [T] = [J] / [N]
Total Enterprise ValueLTM
EBITDARTEV/
EBITDARTotal Enterprise
ValueLTM
RevenueTEV/
Revenue
11,296,630$ 1,133,000$ 9.97x 11,296,630$ 9,472,000$ 1.19x
Source: Bloomberg Database, December 31, 2000 Form 10-K and June 30, 2001 Form 10-Q.
US Airways Group, Inc.

Trans World Airlines, Inc. Exhibit 4 - CSolvency Analysis Page 14 of 14Present Value of Operating LeasesAs of June 30, 2001(U.S. dollars in thousands)
Midpoint Convention TWA AirTran Alaska America West AMR AmTran Continental Delta Southwest Northwest UAL US Airways
2001 0.252 552,708$ 33,015$ 185,600$ 369,670$ 984,000$ 83,734$ 859,000$ 1,204,000$ 274,564$ 655,000$ 1,553,000$ 945,000$ 2002 1.004 538,040 33,571 163,800 336,141 921,000 80,194 814,000 1,218,000 262,142 668,000 1,496,000 835,0002003 2.004 528,320 34,233 146,100 283,386 931,000 74,303 766,000 1,189,000 237,627 650,000 1,513,000 818,0002004 3.004 517,836 27,274 120,500 235,472 913,000 73,954 709,000 1,153,000 213,782 641,000 1,522,000 795,0002005 4.004 507,560 25,969 115,600 220,327 900,000 71,763 688,000 1,138,000 203,385 622,000 1,526,000 778,0002006 5.004 497,488 24,726 110,899 206,156 887,185 69,637 667,622 1,123,195 193,494 603,563 1,530,011 761,3642007 6.004 487,616 23,543 106,390 192,897 874,553 67,574 647,848 1,108,583 184,083 585,673 1,534,032 745,0832008 7.004 477,940 22,417 102,063 180,490 862,100 65,572 628,659 1,094,161 175,131 568,313 1,538,063 729,1502009 8.004 468,455 21,344 97,913 168,881 849,825 63,629 610,039 1,079,926 166,613 551,467 1,542,105 713,5582010 9.004 459,159 20,323 93,932 158,019 837,724 61,744 591,970 1,065,877 158,510 535,121 1,546,158 698,3002011 10.004 365,036 19,351 90,112 147,856 825,796 59,915 574,436 1,052,010 150,801 519,260 1,550,222 683,3682012 11.004 18,425 86,448 138,346 814,038 58,140 557,422 1,038,324 143,467 503,868 1,554,296 668,7552013 12.004 17,543 82,932 129,448 802,447 56,417 540,911 1,024,816 136,490 488,933 1,558,381 654,4542014 13.004 16,704 79,560 121,122 791,021 54,746 524,890 631,108 129,852 474,440 1,562,476 362,9692015 14.004 5,091 76,325 113,332 779,758 53,124 509,343 123,537 460,377 1,566,5832016 15.004 62,126 106,043 768,655 51,550 494,257 117,529 446,731 1,241,6742017 16.004 99,222 757,710 13,795 39,604 22,284 186,2532018 17.004 58,531 746,9222019 18.004 708,265
Pretax Cost of Debt (2) 11.68% 11.68% 10.14% 10.46% 8.56% 11.68% 10.46% 8.40% 7.66% 10.46% 10.14% 11.68%
PV of Operating Leases (3) 3,115,748$ 184,538$ 940,614$ 1,759,055$ 8,217,163$ 514,364$ 5,318,885$ 9,102,448$ 1,768,412$ 4,682,954$ 12,245,526$ 5,332,488$
7x 2001 Operating Leases (4) 3,868,956$ 231,105$ 1,299,200$ 2,587,690$ 6,888,000$ 586,138$ 6,013,000$ 8,428,000$ 1,921,948$ 4,585,000$ 10,871,000$ 6,615,000$
7x 2000 Operating Leases (5) 5,109,581$ 384,174$ 2,090,900$ 3,400,222$ 12,320,000$ 687,372$ 9,968,000$ 10,710,000$ 3,333,127$ 6,741,000$ 13,097,000$ 7,126,000$
Average Operating Leases 4,031,428$ 266,606$ 1,443,571$ 2,582,322$ 9,141,721$ 595,958$ 7,099,962$ 9,413,483$ 2,341,162$ 5,336,318$ 12,071,175$ 6,357,829$
Partial Period Adjustment 0.504
Notes:
(2) Cost of debt is based on the yield of the bond index corresponding to each companies respective credit rating. Source: Bloomberg(3) Present value calculated using the respective cost of debt and applies the midpoint discounting convention. Note, this calculation excludes new lease commitments entered into after December 31, 2000.(4) Calculated as seven times the respective 2001 estimated future operating lease expense per each companies December 31, 2000 Form 10-K (as shown above).(5) Calculated as seven times the respective 2000 historical operating lease expense per each companies December 31, 2000 Form 10-K. Refer to Exhibit 4 - C pages 3 to 13 for June 30, 2001 LTM operating leases.
(1) Estimated future lease payments for Guideline Companies through 2005 obtained from the respective December 31, 2000 Form 10-Ks. After 2005, the lease payments were gradually reduced until the cumulative amount equaled the "2006 and subsequent" balance shown in each Form 10-K. For TWA, the 2000 Form 10-K was unavailable therefore we used the 1999 Form 10-K and followed the same process.
Estimated Lease Payments Required Under Operating Leases (1)

EXHIBIT 5

Trans World Airlines, Inc. Exhibit 5 - ASolvency Analysis Page 1 of 2As of December 31, 2000Income Approach: Capitalized Cash Flow Method(U.S. dollars in thousands)Summary
Present Value of Residual Available Cash Flow 3,928,515 Less: Working Capital Deficiency (1) (297,813) Indicated Value of Total Invested Capital 3,630,703
Less: Interest-Bearing Debt (685,655) Less: Capital Leases (129,388) Less: Present Value of Operating Leases (2) (4,092,725) Indicated Equity Surplus / (Deficit) (1,277,066)
Notes:
(2) Refer to Exhibit 4 - A page 14.
(1) TWA's working capital balance (including cash) was approximately negative $586 million as of 12/31/2000. Based on a review of TWA's historical levels and the Guideline Companies, the required normalized level of working capital was assumed to be -8.0% of annual revenue or approximately negative $288 million as of 12/31/2000. This results in a working capital deficiency of approximately $298 million.

Trans World Airlines, Inc. Exhibit 5 - ASolvency Analysis Page 2 of 2As of December 31, 2000Income Approach: Capitalized Cash Flow Method(U.S. dollars in thousands)Capitalized Cash Flow Model
Historical Year EndedNormalized
12/31/1996 12/31/1997 12/31/1998 12/31/1999 12/31/2000 Residual Year (1)
Total Revenue 3,554,407$ 3,327,952$ 3,259,147$ 3,308,712$ 3,605,854$ 3,699,606$ Revenue Growth -6.4% -2.1% 1.5% 9.0% 2.6%
Operating ExpensesSalaries and Benefits (1,254,341) (1,228,315) (1,226,420) (1,270,645) (1,336,592) (1,371,343) Aircraft Fuel and Oil (585,163) (480,853) (344,603) (396,517) (612,158) (628,074) Maintenance Related (208,183) (138,353) (129,663) (142,461) (120,580) (123,715) Sales Commissions (268,131) (242,135) (197,927) (180,532) (132,167) (135,603) Aircraft Rent (302,990) (262,793) (331,071) (425,672) (556,306) n/aOther Rent & Landing Fees - (175,489) (193,446) (199,208) (197,506) n/aDepreciation and Amortization (161,822) (150,381) (152,997) (140,908) (129,641) (133,012) All Other (886,389) (678,893) (705,547) (685,888) (703,244) (721,528) Total Operating Expenses (3,667,019) (3,357,212) (3,281,674) (3,441,831) (3,788,194) (3,113,276) Operating Income/EBIT (112,612) (29,260) (22,527) (133,119) (182,340) 586,330
Cash Flow
EBIT 586,330$ Less: Income Taxes (cash taxes) (230,428) Plus: Depreciation and Amortization 133,012 Less: Capital Expenditures (133,012) Less: Working Capital Investment (Increase)/Decrease 7,500 Available Cash Flow 363,403$
Residual CalculationResidual Cash Flow 363,403$ Divided By: Cap Rate (r-g) (2)
9.3%
Equal: Residual Value 3,928,515$
Margin Analysis
EBITDAR 352,200$ 559,403$ 654,987$ 632,669$ 701,113$ 719,342 EBITDAR as a % of Revenue 9.9% 16.8% 20.1% 19.1% 19.4% 19.4%
EBITDA 49,210$ 121,121$ 130,470$ 7,789$ (52,699)$ n/mEBITDA as a % of Revenue 1.4% 3.6% 4.0% 0.2% -1.5% n/m
EBIT (112,612)$ (29,260)$ (22,527)$ (133,119)$ (182,340)$ n/mEBIT as a % of Revenue -3.2% -0.9% -0.7% -4.0% -5.1% n/m
Notes:
(2) Residual calculation utilizes the Gordon Growth Model. The Cap Rate is calculated as the WACC of 11.9% minus the residual growth of 2.6%.
(1) Normalized residual year assumptions are as follows: Revenue is assumed to grow at an inflationary rate of 2.6% based on the forecasted consumer price index. Operating expenses are assumed to be consistent (as a percent of revenue) with FY 2000. Aircraft and other rent expenses were excluded and capitalized as a debt obligation. Capital expenditures and depreciation & amortization are assumed to offset.

Trans World Airlines, Inc. Exhibit 5 - BSolvency Analysis Page 1 of 2As of March 31, 2001Income Approach: Capitalized Cash Flow Method(U.S. dollars in thousands)Summary
Present Value of Residual Available Cash Flow 4,019,576 Less: Working Capital Deficiency (1) (216,647) Indicated Value of Total Invested Capital 3,802,930
Less: Interest-Bearing Debt (880,972) Less: Capital Leases (117,810) Less: Present Value of Operating Leases (2) (4,075,070) Indicated Equity Surplus / (Deficit) (1,270,922)
Notes:
(2) Refer to Exhibit 4 - B page 14.
(1) TWA's working capital balance (including cash) was approximately negative $503 million as of 3/31/2001. Based on a review of TWA's historical levels and the Guideline Companies, the required normalized level of working capital was assumed to be -8.0% of annual revenue or approximately negative $287 million as of 3/31/2001. This results in a working capital deficiency of approximately $217 million.

Trans World Airlines, Inc. Exhibit 5 - BSolvency Analysis Page 2 of 2As of March 31, 2001Income Approach: Capitalized Cash Flow Method(U.S. dollars in thousands)Capitalized Cash Flow Model
Historical Year Ended LTMNormalized
12/31/1996 12/31/1997 12/31/1998 12/31/1999 12/31/2000 3/31/2001 Residual Year (1)
Total Revenue 3,554,407$ 3,327,952$ 3,259,147$ 3,308,712$ 3,605,854$ 3,584,831$ 3,678,037$ Revenue Growth -6.4% -2.1% 1.5% 9.0% 2.6%
Operating ExpensesSalaries and Benefits (1,254,341) (1,228,315) (1,226,420) (1,270,645) (1,336,592) (1,330,255) (1,364,842) Aircraft Fuel and Oil (585,163) (480,853) (344,603) (396,517) (612,158) (612,623) (628,551) Maintenance Related (208,183) (138,353) (129,663) (142,461) (120,580) (119,007) (122,101) Sales Commissions (268,131) (242,135) (197,927) (180,532) (132,167) (127,020) (130,323) Aircraft Rent (302,990) (262,793) (331,071) (425,672) (556,306) (565,673) n/aOther Rent & Landing Fees - (175,489) (193,446) (199,208) (197,506) (196,293) n/aDepreciation and Amortization (161,822) (150,381) (152,997) (140,908) (129,641) (128,852) (132,202) All Other (886,389) (678,893) (705,547) (685,888) (703,244) (709,535) (727,983) Total Operating Expenses (3,667,019) (3,357,212) (3,281,674) (3,441,831) (3,788,194) (3,789,258) (3,106,002) Operating Income/EBIT (112,612) (29,260) (22,527) (133,119) (182,340) (204,427) 572,035
Cash Flow
EBIT 572,035$ Less: Income Taxes (cash taxes) (224,238) Plus: Depreciation and Amortization 132,202 Less: Capital Expenditures (132,202) Less: Working Capital Investment (Increase)/Decrease 7,456 Available Cash Flow 355,254$
Residual CalculationResidual Cash Flow 355,254$ Divided By: Cap Rate (r-g) (2)
8.8%
Equal: Residual Value 4,019,576$
Margin Analysis
EBITDAR 352,200$ 559,403$ 654,987$ 632,669$ 701,113$ 686,391$ 704,237 EBITDAR as a % of Revenue 9.9% 16.8% 20.1% 19.1% 19.4% 19.1% 19.1%
EBITDA 49,210$ 121,121$ 130,470$ 7,789$ (52,699)$ (75,575)$ n/mEBITDA as a % of Revenue 1.4% 3.6% 4.0% 0.2% -1.5% -2.1% n/m
EBIT (112,612)$ (29,260)$ (22,527)$ (133,119)$ (182,340)$ (204,427)$ n/mEBIT as a % of Revenue -3.2% -0.9% -0.7% -4.0% -5.1% -5.7% n/m
Notes:
(2) Residual calculation utilizes the Gordon Growth Model. The Cap Rate is calculated as the WACC of 11.4% minus the residual growth of 2.6%.
(1) Normalized residual year assumptions are as follows: Revenue is assumed to grow at an inflationary rate of 2.6% based on the forecasted consumer price index. Operating expenses are assumed to be consistent (as a percent of revenue) with LTM March 31, 2001. Aircraft and other rent expenses were excluded and capitalized as a debt obligation. Capital expenditures and depreciation & amortization are assumed to offset.

Trans World Airlines, Inc. Exhibit 5 - CSolvency Analysis Page 1 of 2As of June 30, 2001Income Approach: Capitalized Cash Flow Method(U.S. dollars in thousands)Summary
Present Value of Residual Available Cash Flow 3,907,684 Less: Working Capital Deficiency (1) (2) (226,899) Indicated Value of Total Invested Capital 3,680,785
Less: Interest-Bearing Debt (2) (880,972) Less: Capital Leases (2) (117,810) Less: Present Value of Operating Leases (3) (4,031,428) Indicated Equity Surplus / (Deficit) (1,349,425)
Notes:
(3) Refer to Exhibit 4 - C page 14.
(1) TWA's working capital balance (including cash) was approximately negative $503 million as of 3/31/2001. Based on a review of TWA's historical levels and the Guideline Companies, the required normalized level of working capital was assumed to be -8.0% of annual revenue or approximately negative $278 million as of 6/30/2001. This results in a working capital deficiency of approximately $227 million.(2) June 30, 2001 balance sheet is not available, data relies on March 31, 2001 balances.

Trans World Airlines, Inc. Exhibit 5 - CSolvency Analysis Page 2 of 2As of June 30, 2001Income Approach: Capitalized Cash Flow Method(U.S. dollars in thousands)Capitalized Cash Flow Model
Historical Year Ended LTMNormalized
12/31/1996 12/31/1997 12/31/1998 12/31/1999 12/31/2000 6/30/2001 Residual Year (1)
Total Revenue 3,554,407$ 3,327,952$ 3,259,147$ 3,308,712$ 3,605,854$ 3,456,676$ 3,546,550$ Revenue Growth -6.4% -2.1% 1.5% 9.0% 2.6%
Operating ExpensesSalaries and Benefits (1,254,341) (1,228,315) (1,226,420) (1,270,645) (1,336,592) (1,317,783) (1,352,046) Aircraft Fuel and Oil (585,163) (480,853) (344,603) (396,517) (612,158) (602,042) (617,696) Maintenance Related (208,183) (138,353) (129,663) (142,461) (120,580) (116,148) (119,168) Sales Commissions (268,131) (242,135) (197,927) (180,532) (132,167) (124,602) (127,842) Aircraft Rent (302,990) (262,793) (331,071) (425,672) (556,306) (511,210) n/aOther Rent & Landing Fees - (175,489) (193,446) (199,208) (197,506) (218,730) n/aDepreciation and Amortization (161,822) (150,381) (152,997) (140,908) (129,641) (124,388) (127,622) All Other (886,389) (678,893) (705,547) (685,888) (703,244) (674,817) (692,362) Total Operating Expenses (3,667,019) (3,357,212) (3,281,674) (3,441,831) (3,788,194) (3,689,721) (3,036,736) Operating Income/EBIT (112,612) (29,260) (22,527) (133,119) (182,340) (233,045) 509,814
Cash Flow
EBIT 509,814$ Less: Income Taxes (cash taxes) (199,847) Plus: Depreciation and Amortization 127,622 Less: Capital Expenditures (127,622) Less: Working Capital Investment (Increase)/Decrease 7,190 Available Cash Flow 317,157$
Residual CalculationResidual Cash Flow 317,157$ Divided By: Cap Rate (r-g) (2)
8.1%
Equal: Residual Value 3,907,684$
Margin Analysis
EBITDAR $352,200 $559,403 $654,987 $632,669 $701,113 $621,283 $637,436EBITDAR as a % of Revenue 9.9% 16.8% 20.1% 19.1% 19.4% 18.0% 18.0%
EBITDA $49,210 $121,121 $130,470 $7,789 ($52,699) ($108,657) n/mEBITDA as a % of Revenue 1.4% 3.6% 4.0% 0.2% -1.5% -3.1% n/m
EBIT ($112,612) ($29,260) ($22,527) ($133,119) ($182,340) ($233,045) n/mEBIT as a % of Revenue -3.2% -0.9% -0.7% -4.0% -5.1% -6.7% n/m
Notes:
(2) Residual calculation utilizes the Gordon Growth Model. The Cap Rate is calculated as the WACC of 10.7% minus the residual growth of 2.6%.
(1) Normalized residual year assumptions are as follows: Revenue is assumed to grow at an inflationary rate of 2.6% based on the forecasted consumer price index. Operating expenses are assumed to be consistent (as a percent of revenue) with LTM June 30, 2001. Aircraft and other rent expenses were excluded and capitalized as a debt obligation. Capital expenditures and depreciation & amortization are assumed to offset.

EXHIBIT 6

Trans World Airlines, Inc. Exhibit 6 - ASolvency Analysis Page 1 of 1Weighted Average Cost of Capital ("WACC")As of December 31, 2000(U.S. dollars in thousands, except stock prices)
Assumptions:
Risk-free Rate (rf) 5.59% (1)
Pretax Required Rate on Debt Capital (i) 12.39% (2)
Equity Risk Premium (rp) 7.80% (3)
Size Premium (sp) 2.60% (4)
Other Adjustment (Alpha) 10.00% (5)
Marginal Total Corporate Tax Rate - U.S. (t) 39.30% (6)
Guideline Company Analysis
Company Name
Beta
Levered (7)
Debt & Preferred
Stock (8) Stock Price x
Common Shares
Outstanding =Market Value of
EquityTotal
Capitalization Debt/ Equity Debt/ Capital Tax RateBeta
Unlevered
AirTran Holdings, LLC 0.85 663,220$ 7.25$ 65,823 477,217$ 1,140,437$ 139.0% 58.2% 39.3% 0.46Alaska Air Group Inc. 0.88 2,117,468 29.75 26,457 787,108 2,904,575 269.0% 72.9% 39.3% 0.33America West Holdings Corporation 0.93 2,854,478 12.81 33,599 430,485 3,284,962 663.1% 86.9% 39.3% 0.18AMR Corporation 0.99 15,097,195 39.19 152,063 5,958,951 21,056,146 253.4% 71.7% 39.3% 0.39AmTran, Inc. 0.49 1,108,640 14.50 11,386 165,094 1,273,734 671.5% 87.0% 39.3% 0.10Continental Airlines, Inc. 0.86 10,925,649 51.63 58,450 3,017,500 13,943,149 362.1% 78.4% 39.3% 0.27Delta Air Lines, Inc. 0.80 15,679,518 50.19 123,013 6,173,734 21,853,251 254.0% 71.7% 39.3% 0.31Southwest Airlines Co. 0.87 3,195,910 33.53 504,162 16,904,552 20,100,461 18.9% 15.9% 39.3% 0.78Northwest Airlines Corporation 0.85 9,859,436 30.13 83,094 2,503,212 12,362,647 393.9% 79.8% 39.3% 0.25UAL Corporation 0.90 20,070,701 38.94 52,539 2,045,725 22,116,426 981.1% 90.8% 39.3% 0.13US Airways Group, Inc. 0.92 9,213,544 40.56 67,006 2,717,931 11,931,475 339.0% 77.2% 39.3% 0.30
Median 0.87 77.2% 0.30
Concluded Unlevered Beta 0.30Concluded Debt/Capital 75.0%
Relevered Beta Analysis Indicated Debt-to-Equity ratio 300.0%
Beta Unlevered 0.30Indicated Debt-to-Equity Ratio 300.00%Marginal Total Corporate Tax Rate (t) 39.30%Beta Relevered (Betar) 0.85
Required Rate of Return on Equity Required Rate of Return on Debt
Modified Capital Asset Pricing Model ("MCAPM")Required Rate of Return on Equity = rf + (Betar x rp) + sp + Alpha Required Rate of Return on Debt = i x (1 - t)
Required Rate of Return on Equity = 5.59% + (0.85 x 7.8%) + 2.6% + 10% = 24.84% Required Rate of Return on Debt = 12.39% x (1 - 39.3%) = 7.52%
Required Rate of Return on Equity 24.8% Required Rate of Return on Debt 7.5%
Weighted Average Cost of Capital
Required Rates of Return Capital Structure Weighting
Required Rate of Return on Debt 7.5% x 75.0% = 5.6%Required Rate of Return on Equity 24.8% x 25.0% = 6.2%Weighted-Average Cost of Capital 11.9%
WACC Conclusion (9)11.9%
Notes:(1) U.S. 20-year Treasury note (source: Federal Reserve Statistical Release H-15)(2) Standard & Poor's B 10 year corporate Industry Bond Yield (source: Bloomberg)(3) Long-horizon equity risk permium per Ibbotson SBBI 2001 Yearbook(4) Size Premium per Ibbotson SBBI 2001 Yearbook (micro-capitalization S&P).
(6) Weighted average blended U.S. tax rate 2000.(7) Source: Barra(8) Includes short and long-term funded debt, preferred stock, capital leases and the PV of operating leases.
(5) A risk adjustment was made to the cost of equity to reflect additional company-specific risk characteristics of TWA (distressed financial condition, unfavorable leases, unattractive network structure, inability to hedge fuel prices, etc.). After applying this adjustment, it was noted that the resulting estimated equity return of 24.8% was significantly lower than the yield on TWA's unsecured debt (which is senior to equity) which ranged from 34% to 42% during the third quarter of 2000.
(9) WACC conclusion is also corroborated by the range (10.5% [Large Composite] to 14.5% [Small Composite]) for SIC code 4512 as published by Ibbotson Associates Cost of Capital 2001.

Trans World Airlines, Inc. Exhibit 6 - BSolvency Analysis Page 1 of 1Weighted Average Cost of Capital ("WACC")As of March 31, 2001(U.S. dollars in thousands, except stock prices)
Assumptions:
Risk-free Rate (rf) 5.60% (1)
Pretax Required Rate on Debt Capital (i) 12.97% (2)
Equity Risk Premium (rp) 7.80% (3)
Size Premium (sp) 2.60% (4)
Other Adjustment (Alpha) 10.00% (5)
Marginal Total Corporate Tax Rate - U.S. (t) 39.20% (6)
Guideline Company Analysis
Company Name
Beta
Levered (7)
Debt & Preferred
Stock (8) Stock Price x
Common Shares
Outstanding =Market Value of
EquityTotal
Capitalization Debt/ Equity Debt/ Capital Tax RateBeta
Unlevered
AirTran Holdings, LLC 1.02 611,265$ 7.84$ 66,591 522,073$ 1,133,339$ 117.1% 53.9% 39.2% 0.60Alaska Air Group Inc. 0.84 2,086,641 25.70 26,478 680,490 2,767,131 306.6% 75.4% 39.2% 0.29America West Holdings Corporation 0.79 2,779,015 9.60 33,643 322,972 3,101,987 860.5% 89.6% 39.2% 0.13AMR Corporation 1.03 15,397,178 35.12 153,694 5,397,722 20,794,900 285.3% 74.0% 39.2% 0.38AmTran, Inc. 0.53 1,144,242 9.63 11,384 109,568 1,253,811 1044.3% 91.3% 39.2% 0.07Continental Airlines, Inc. 0.89 11,238,978 41.40 53,625 2,220,069 13,459,046 506.2% 83.5% 39.2% 0.22Delta Air Lines, Inc. 0.87 15,763,765 39.50 123,038 4,859,999 20,623,764 324.4% 76.4% 39.2% 0.29Southwest Airlines Co. 0.97 3,192,705 17.75 760,700 13,502,425 16,695,130 23.6% 19.1% 39.2% 0.85Northwest Airlines Corporation 0.77 10,978,779 22.63 85,156 1,926,662 12,905,441 569.8% 85.1% 39.2% 0.17UAL Corporation 0.96 20,186,131 33.05 53,118 1,755,562 21,941,693 1149.8% 92.0% 39.2% 0.12US Airways Group, Inc. 0.95 9,390,524 35.45 67,096 2,378,553 11,769,077 394.8% 79.8% 39.2% 0.28
Median 0.89 79.8% 0.28
Concluded Unlevered Beta 0.28Concluded Debt/Capital 80.0%
Relevered Beta Analysis Indicated Debt-to-Equity ratio 400.0%
Beta Unlevered 0.28Indicated Debt-to-Equity Ratio 400.00%Marginal Total Corporate Tax Rate (t) 39.20%Beta Relevered (Betar) 0.95
Required Rate of Return on Equity Required Rate of Return on Debt
Modified Capital Asset Pricing Model ("MCAPM")Required Rate of Return on Equity = rf + (Betar x rp) + sp + Alpha Required Rate of Return on Debt = i x (1 - t)
Required Rate of Return on Equity = 5.6% + (0.95 x 7.8%) + 2.6% + 10% = 25.65% Required Rate of Return on Debt = 12.97% x (1 - 39.2%) = 7.89%
Required Rate of Return on Equity 25.6% Required Rate of Return on Debt 7.9%
Weighted Average Cost of Capital
Required Rates of Return Capital Structure Weighting
Required Rate of Return on Debt 7.9% x 80.0% = 6.3%Required Rate of Return on Equity 25.6% x 20.0% = 5.1%Weighted-Average Cost of Capital 11.4%
WACC Conclusion (9)11.4%
Notes:(1) U.S. 20-year Treasury note (source: Federal Reserve Statistical Release H-15)(2) Standard & Poor's B 10 year corporate Industry Bond Yield (source: Bloomberg)(3) Long-horizon equity risk permium per Ibbotson SBBI 2001 Yearbook(4) Size Premium per Ibbotson SBBI 2001 Yearbook (micro-capitalization S&P).
(6) Weighted average blended U.S. tax rate 2001.(7) Source: Barra(8) Includes short and long-term funded debt, preferred stock, capital leases and the PV of operating leases.
(5) A risk adjustment was made to the cost of equity to reflect additional company-specific risk characteristics of TWA (distressed financial condition, unfavorable leases, unattractive network structure, inability to hedge fuel prices, etc.). After applying this adjustment, it was noted that the resulting estimated equity return of 25.6% was significantly lower than the yield on TWA's unsecured debt (which is senior to equity) which ranged from 34% to 42% during the third quarter of 2000.
(9) WACC conclusion is also corroborated by the range (10.5% [Large Composite] to 14.5% [Small Composite]) for SIC code 4512 as published by Ibbotson Associates Cost of Capital 2001.

Trans World Airlines, Inc. Exhibit 6 - CSolvency Analysis Page 1 of 1Weighted Average Cost of Capital ("WACC")As of June 30, 2001(U.S. dollars in thousands, except stock prices)
Assumptions:
Risk-free Rate (rf) 5.91% (1)
Pretax Required Rate on Debt Capital (i) 11.68% (2)
Equity Risk Premium (rp) 7.80% (3)
Size Premium (sp) 2.60% (4)
Other Adjustment (Alpha) 10.00% (5)
Marginal Total Corporate Tax Rate - U.S. (t) 39.20% (6)
Guideline Company Analysis
Company Name
Beta
Levered (7)
Debt & Preferred
Stock (8) Stock Price x
Common Shares
Outstanding =Market Value of
EquityTotal
Capitalization Debt/ Equity Debt/ Capital Tax RateBeta
Unlevered
AirTran Holdings, LLC 1.12 575,129$ 10.25$ 66,676 683,429$ 1,258,558$ 84.2% 45.7% 39.2% 0.74Alaska Air Group Inc. 0.74 2,138,171 28.90 26,492 765,608 2,903,779 279.3% 73.6% 39.2% 0.27America West Holdings Corporation 0.86 2,912,277 9.97 33,642 335,409 3,247,686 868.3% 89.7% 39.2% 0.14AMR Corporation 0.92 16,921,721 36.13 154,408 5,578,755 22,500,475 303.3% 75.2% 39.2% 0.32AmTran, Inc. 0.76 1,182,830 21.89 11,471 251,105 1,433,934 471.1% 82.5% 39.2% 0.20Continental Airlines, Inc. 0.89 11,438,962 49.25 54,683 2,693,155 14,132,117 424.7% 80.9% 39.2% 0.25Delta Air Lines, Inc. 0.86 16,485,483 44.08 123,069 5,424,879 21,910,361 303.9% 75.2% 39.2% 0.30Southwest Airlines Co. 0.95 3,204,265 18.49 762,700 14,102,323 17,306,588 22.7% 18.5% 39.2% 0.84Northwest Airlines Corporation 0.77 10,224,318 25.25 85,224 2,151,913 12,376,231 475.1% 82.6% 39.2% 0.20UAL Corporation 0.95 20,124,175 35.15 54,009 1,898,432 22,022,608 1060.0% 91.4% 39.2% 0.13US Airways Group, Inc. 0.96 9,666,829 24.30 67,070 1,629,801 11,296,630 593.1% 85.6% 39.2% 0.21
Median 0.89 80.9% 0.25
Concluded Unlevered Beta 0.25Concluded Debt/Capital 80.0%
Relevered Beta Analysis Indicated Debt-to-Equity ratio 400.0%
Beta Unlevered 0.25Indicated Debt-to-Equity Ratio 400.00%Marginal Total Corporate Tax Rate (t) 39.20%Beta Relevered (Betar) 0.85
Required Rate of Return on Equity Required Rate of Return on Debt
Modified Capital Asset Pricing Model ("MCAPM")Required Rate of Return on Equity = rf + (Betar x rp) + sp + Alpha Required Rate of Return on Debt = i x (1 - t)
Required Rate of Return on Equity = 5.91% + (0.85 x 7.8%) + 2.6% + 10% = 25.18% Required Rate of Return on Debt = 11.68% x (1 - 39.2%) = 7.1%
Required Rate of Return on Equity 25.2% Required Rate of Return on Debt 7.1%
Weighted Average Cost of Capital
Required Rates of Return Capital Structure Weighting
Required Rate of Return on Debt 7.1% x 80.0% = 5.7%Required Rate of Return on Equity 25.2% x 20.0% = 5.0%Weighted-Average Cost of Capital 10.7%
WACC Conclusion (9)10.7%
Notes:(1) U.S. 20-year Treasury note (source: Federal Reserve Statistical Release H-15)(2) Standard & Poor's B 10 year corporate Industry Bond Yield (source: Bloomberg)(3) Long-horizon equity risk permium per Ibbotson SBBI 2001 Yearbook(4) Size Premium per Ibbotson SBBI 2001 Yearbook (micro-capitalization S&P).
(6) Weighted average blended U.S. tax rate 2001.(7) Source: Barra(8) Includes short and long-term funded debt, preferred stock, capital leases and the PV of operating leases.
(5) A risk adjustment was made to the cost of equity to reflect additional company-specific risk characteristics of TWA (distressed financial condition, unfavorable leases, unattractive network structure, inability to hedge fuel prices, etc.). After applying this adjustment, it was noted that the resulting estimated equity return of 25.2% was significantly lower than the yield on TWA's unsecured debt (which is senior to equity) which ranged from 34% to 42% during the third quarter of 2000.
(9) WACC conclusion is also corroborated by the range (11.1% [Large Composite] to 13.9% [Small Composite]) for SIC code 4512 as published by Ibbotson Associates Cost of Capital 2001.

EXHIBIT 7

Trans World Airlines, Inc. Exhibit 7Solvency Analysis Page 1 of 1Guideline Company Business DescriptionsAs of December 31, 2000
AirTran Holdings, LLC
All of the operations of AirTran Holdings, Inc. were conducted by its wholly owned subsidiary, AirTran Airways, Inc., which was the second- largest affordable- fare scheduled airline in the United States in terms of departures. They offered scheduled airline service serving short- haul markets, primarily from their hub in Atlanta, Georgia. As of December 31, 2000, they operated 55 aircraft making approximately 314 flights per day serving 34 cities throughout the eastern United States.
Alaska Air Group Inc. Alaska Air Group, Inc. was a holding company that incorporated in Delaware in 1985. Its two principal subsidiaries were Alaska Airlines, Inc. and Horizon Air Industries, Inc. Alaska was a major airline, operating an all- jet fleet, with its average passenger trip length of 886 miles. Horizon was a regional airline, operating jet and turboprop aircraft, and its average passenger trip was 283 miles.
America West Holdings Corporation
America West Holdings Corporation was the parent company of America West Airlines ("AWA") and The Leisure Company ("TLC"). AWA was the ninth largest commercial airline carrier in the United States, operating through its principal hubs located in Phoenix and Las Vegas, and a mini- hub located in Columbus, Ohio. AWA had the lowest cost structure of all major full- service domestic airlines in the United States. At December 31, 2000, AWA served 63 destinations, including seven destinations in Mexico and two in Canada, with a fleet of 138 aircraft and offered service to an additional 44 destinations through alliance arrangements with other airlines. TLC arranges and sells leisure travel products that may include airfare, hotel accommodations, ground transportation, and a variety of other travel options.
AMR Corporation AMR's principal subsidiary, American Airlines, Inc., was one of the largest scheduled passenger airlines in the world. At the end of 2000, American provided scheduled jet service to more than 169 destinations throughout North America, the Caribbean, Latin America, Europe and the Pacific. American was also one of the largest scheduled air freight carriers in the world, providing a full range of freight and mail services to shippers throughout its system.
AmTran, Inc. Amtran, Inc. owned American Trans Air, Inc., the 11th largest passenger airline in the United States (based on 2000 capacity and traffic) and a provider of airline- related services in selected markets. ATA was the largest commercial charter airline in the United States and the largest provider of passenger airline services to the U.S. military, in each case based on 2000 revenue.
Continental Airlines, Inc.
Continental Airlines, Inc. was a major United States air carrier engaged in the business of transporting passengers, cargo and mail. Continental was the fifth largest United States airline (as measured by 2000 revenue passenger miles) and, together with its wholly owned subsidiaries, Continental Express, Inc. and Continental Micronesia, Inc., served 230 airports worldwide at January 19, 2001. As of January 19, 2001, Continental flew to 136 domestic and 94 international destinations and offered additional connecting service through alliances with domestic and foreign carriers.
Delta Air Lines, Inc. Delta Air Lines, Inc. was a major air carrier that provided scheduled air transportation for passengers and freight throughout the United States and around the world. As of February 1, 2001, Delta served 201 domestic cities in 45 states, the District of Columbia, Puerto Rico and the United States Virgin Islands, as well as 50 cities in 32 countries in Europe, Latin America, Asia, the Caribbean and Canada.
Southwest Airlines Co.
Southwest Airlines Co. was a major domestic airline that provides primarily short haul, high- frequency, point- to- point, low- fare service. At year end 2000, Southwest operated 344 Boeing 737 aircraft and provided service to 58 airports in 57 cities in 29 states throughout the United States. Based on data for second quarter 2000 (the latest available data), Southwest Airlines was the 4th largest carrier in the United States based on domestic passengers boarded and the largest based on scheduled domestic departures.
Northwest Airlines Corporation
Northwest operated the world's fourth largest airline, as measured by 1999 revenue passenger miles, and was engaged in the business of transporting passengers and cargo. Northwest operated substantial domestic and international route networks and directly served more than 155 cities in 24 countries in North America, Asia and Europe.
UAL Corporation UAL Corporation was a holding company and its principal subsidiary was United Air Lines, Inc. United was the world' s largest airline as measured by revenue passenger miles flown, providing passenger service in 28 countries.
US Airways Group, Inc.
US Airways was a certificated air carrier engaged primarily in the business of transporting passengers, property and mail. In 2000, US Airways accounted for approximately 88% of the Company's operating revenues on a consolidated basis. US Airways enplaned almost 61 million passengers in 2000 and was the sixth largest domestic air carrier (as ranked by revenue passenger miles).
Source: Guideline Company December 31, 2000 Form 10‐K

EXHIBIT 8

US Air / Pacific Southwest Airlines
Alaska Airlines / Jet America
Continental Airlines / People Express / New York Air / Frontier Airlines
American Airlines / AirCal
Norwest Airlines / Republic Airlines
TWA / Ozark Air Lines
Delta Air Lines / Western Airlines
Southwest Airlines / Muse Airlines
Alaska Airlines / Horizon Air
US Air / Piedmont Airlines
American Airlines / Eastern Air Lines: Latin Routes
United Airlines / Pan Am: Latin & Caribbean Routes
Delta Air Lines / Atlantic Southeast Airlines
Delta Air Lines / Comair
AirTran Airways / Valujet
American Airlines / Reno Air
American Airlines / TWA
Pinnacle Airlines / ColganAir
Pan Am / National Airlines
Republic Airlines / Hughes Airwest
Continental Airlines / Texas Air Corporation
Airline Mergers and Acquisitions from 1979 – Present
North Central Airlines / Southern Airways / Hughes Airwest
1979 1980 1982 1985 1986 1987 1989 1990 1991 1992 1993 1997 1999 2001 2005 2007 2009 2010 2011
American Airlines / TWA: Heathrow Routes
Delta Air Lines / Pan Am Airlines (Shuttle and Atlantic Routes)
Southwest Airlines / Morris Airlines
SkyWest / Atlantic Southeast
US Airways / America West Airlines
Republic Airways / Shuttle America
Republic Airways / Frontier Airlines
Delta Air Lines / Northwest Airlines
Republic Airways / Midwest Airlines
SkyWest / Atlantic Southeast Airlines / ExpressJet Airlines
Pinnacle Airlines / Mesaba Airlines
United Airlines / Continental Airlines
Southwest Airlines / AirTran Airways
Source: Airlines for America (A4A).

EXHIBIT 9
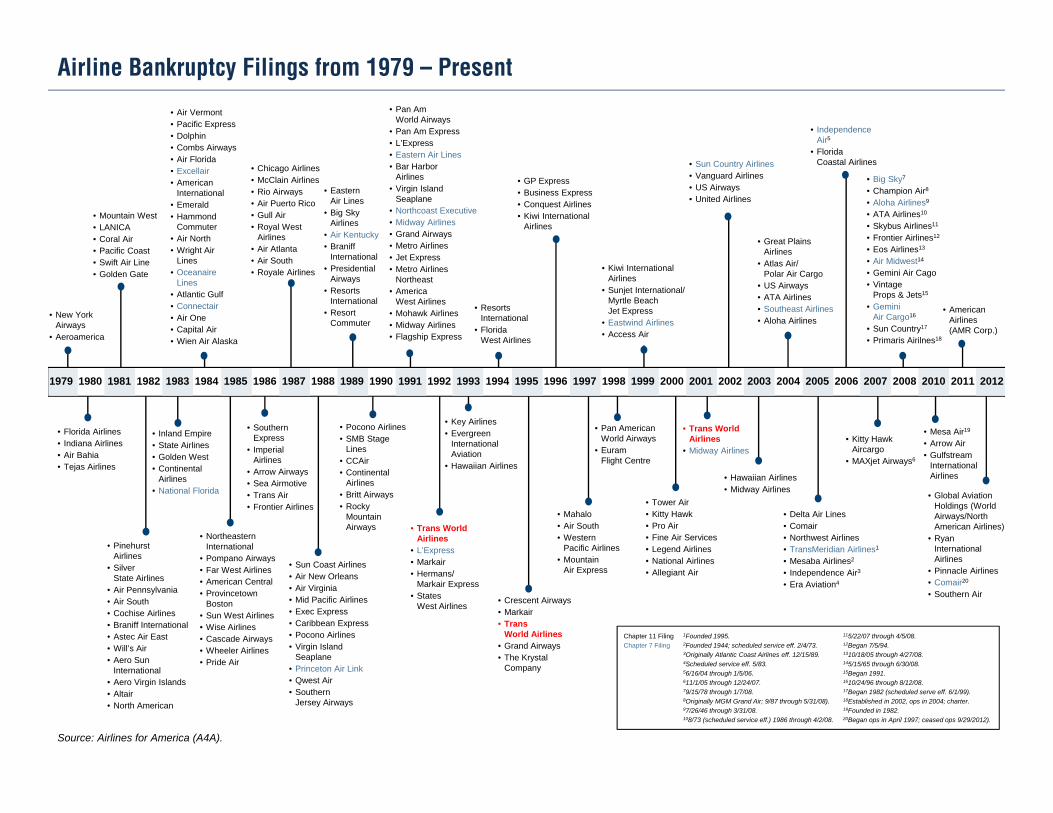
Airline Bankruptcy Filings from 1979 – Present
• New York Airways
• Aeroamerica
• Florida Airlines• Indiana Airlines• Air Bahia• Tejas Airlines
• Pinehurst Airlines
• Silver State Airlines
• Air Pennsylvania• Air South• Cochise Airlines• Braniff International• Astec Air East• Will’s Air• Aero Sun
International• Aero Virgin Islands• Altair• North American
• Mountain West• LANICA• Coral Air• Pacific Coast• Swift Air Line• Golden Gate
• Inland Empire• State Airlines• Golden West• Continental
Airlines• National Florida
• Air Vermont• Pacific Express• Dolphin• Combs Airways• Air Florida• Excellair• American
International• Emerald• Hammond
Commuter• Air North• Wright Air
Lines• Oceanaire
Lines• Atlantic Gulf• Connectair• Air One• Capital Air• Wien Air Alaska
• Northeastern International
• Pompano Airways• Far West Airlines• American Central• Provincetown
Boston• Sun West Airlines• Wise Airlines• Cascade Airways• Wheeler Airlines• Pride Air
• Southern Express
• Imperial Airlines
• Arrow Airways• Sea Airmotive• Trans Air• Frontier Airlines
• Chicago Airlines• McClain Airlines• Rio Airways• Air Puerto Rico• Gull Air• Royal West
Airlines• Air Atlanta• Air South• Royale Airlines
• Sun Coast Airlines• Air New Orleans• Air Virginia• Mid Pacific Airlines• Exec Express• Caribbean Express• Pocono Airlines• Virgin Island
Seaplane• Princeton Air Link• Qwest Air• Southern
Jersey Airways
• Eastern Air Lines
• Big Sky Airlines
• Air Kentucky• Braniff
International• Presidential
Airways• Resorts
International• Resort
Commuter
• Pocono Airlines• SMB Stage
Lines• CCAir• Continental
Airlines• Britt Airways• Rocky
Mountain Airways
• Pan Am World Airways
• Pan Am Express• L’Express• Eastern Air Lines• Bar Harbor
Airlines• Virgin Island
Seaplane• Northcoast Executive• Midway Airlines• Grand Airways• Metro Airlines• Jet Express• Metro Airlines
Northeast• America
West Airlines• Mohawk Airlines• Midway Airlines• Flagship Express
• Trans World Airlines
• L’Express• Markair• Hermans/
Markair Express• States
West Airlines
• Key Airlines• Evergreen
International Aviation
• Hawaiian Airlines
• Resorts International
• Florida West Airlines
• Crescent Airways• Markair• Trans
World Airlines• Grand Airways• The Krystal
Company
• GP Express• Business Express• Conquest Airlines• Kiwi International
Airlines
• Mahalo• Air South• Western
Pacific Airlines• Mountain
Air Express
• Pan American World Airways
• EuramFlight Centre
• Tower Air• Kitty Hawk• Pro Air• Fine Air Services• Legend Airlines• National Airlines• Allegiant Air
• Kiwi International Airlines
• Sunjet International/Myrtle Beach Jet Express
• Eastwind Airlines• Access Air
• Trans World Airlines
• Midway Airlines
• Sun Country Airlines• Vanguard Airlines• US Airways• United Airlines
• Hawaiian Airlines• Midway Airlines
• Great Plains Airlines
• Atlas Air/Polar Air Cargo
• US Airways• ATA Airlines• Southeast Airlines• Aloha Airlines
• Delta Air Lines• Comair• Northwest Airlines• TransMeridian Airlines1
• Mesaba Airlines2
• Independence Air3
• Era Aviation4
1Founded 1995.2Founded 1944; scheduled service eff. 2/4/73.3Originally Atlantic Coast Airlines eff. 12/15/89.4Scheduled service eff. 5/83.56/16/04 through 1/5/06.611/1/05 through 12/24/07.79/15/78 through 1/7/08.8Originally MGM Grand Air; 9/87 through 5/31/08).97/26/46 through 3/31/08.108/73 (scheduled service eff.) 1986 through 4/2/08.
• Independence Air5
• Florida Coastal Airlines
115/22/07 through 4/5/08.12Began 7/5/94.1310/18/05 through 4/27/08.145/15/65 through 6/30/08.15Began 1991.1610/24/96 through 8/12/08.17Began 1982 (scheduled serve eff. 6/1/99).18Established in 2002, ops in 2004; charter.19Founded in 1982.20Began ops in April 1997; ceased ops 9/29/2012).
• Kitty Hawk Aircargo
• MAXjet Airways6
1979 1980 1982 1985 1986 1987 1989 1990 1991 1992 1993 1997 1999 2001 2005 2007 2010 2011 20121981 1983 1984 1988 1994 1995 1996 1998 2000 2002 2003 2004 2006 2008
• Big Sky7
• Champion Air8
• Aloha Airlines9
• ATA Airlines10
• Skybus Airlines11
• Frontier Airlines12
• Eos Airlines13
• Air Midwest14
• Gemini Air Cago• Vintage
Props & Jets15
• Gemini Air Cargo16
• Sun Country17
• Primaris Airilnes18
• American Airlines (AMR Corp.)
• Mesa Air19
• Arrow Air• Gulfstream
International Airlines
• Global Aviation Holdings (World Airways/North American Airlines)
• Ryan International Airlines
• Pinnacle Airlines• Comair20
• Southern Air
Chapter 11 Filing
Chapter 7 Filing
Source: Airlines for America (A4A).