state water project power portfolio management
TRANSCRIPT

STATE WATER PROJECTPOWER PORTFOLIO MANAGEMENTIN AN EVOLVING POWER MARKET
June 19, 2019

THE DEPARTMENT OF WATER RESOURCES AND THE STATE WATER PROJECT (SWP)
Gove
rnor
Gav
in N
ewso
m
Nat
ural
Res
ourc
es A
genc
y
Depa
rtm
ent o
f Wat
er R
esou
rces
Provide Leadership for Planning and Managing California’s Water Resources
Ensure a Reliable Water Supply for California through Safe and Efficient Operation, Maintenance, and Management of the State Water Project
Utilize Leadership, Collaboration, and Strategic Partnerships to Build Capacity for Regional Water Sustainability through Local Technical and Financial
Assistance
Protect Lives, Infrastructure, and Environment through the Management of Dams, Floods, and Vital Ecosystems
Increase Resiliency to Reduce Residual Risk Resulting from Floods, Drought, and Climate Change
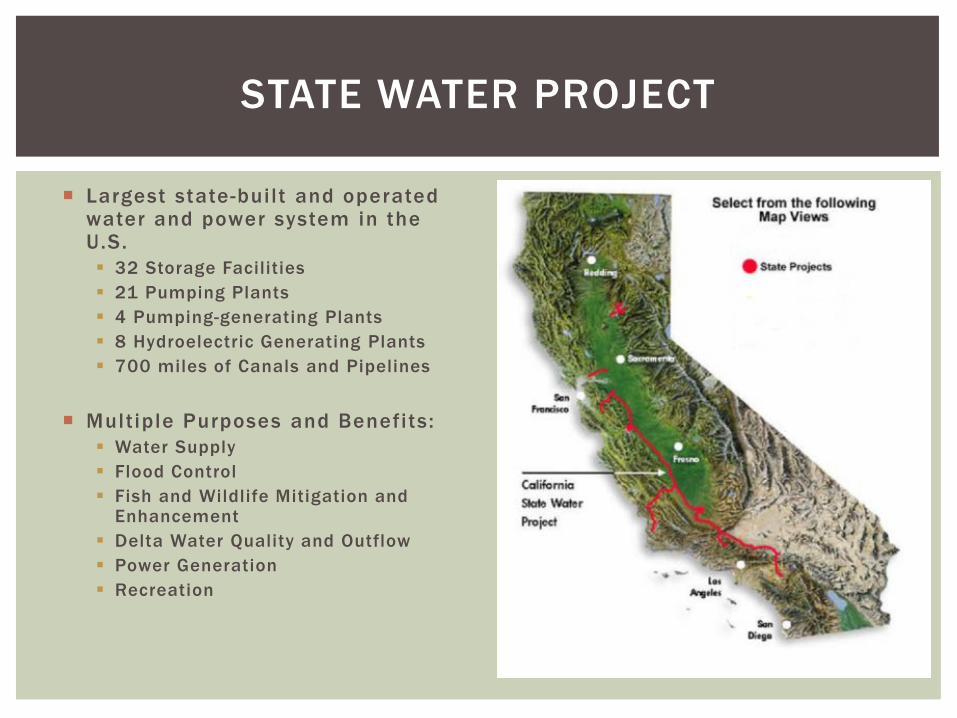
STATE WATER PROJECT
Largest state-bui lt and operated water and power system in the U.S. 32 Storage Facilities 21 Pumping Plants 4 Pumping-generating Plants 8 Hydroelectric Generating Plants 700 miles of Canals and Pipelines
Multiple Purposes and Benefits: Water Supply Flood Control Fish and Wildlife Mitigation and
Enhancement Delta Water Quality and Outflow Power Generation Recreation
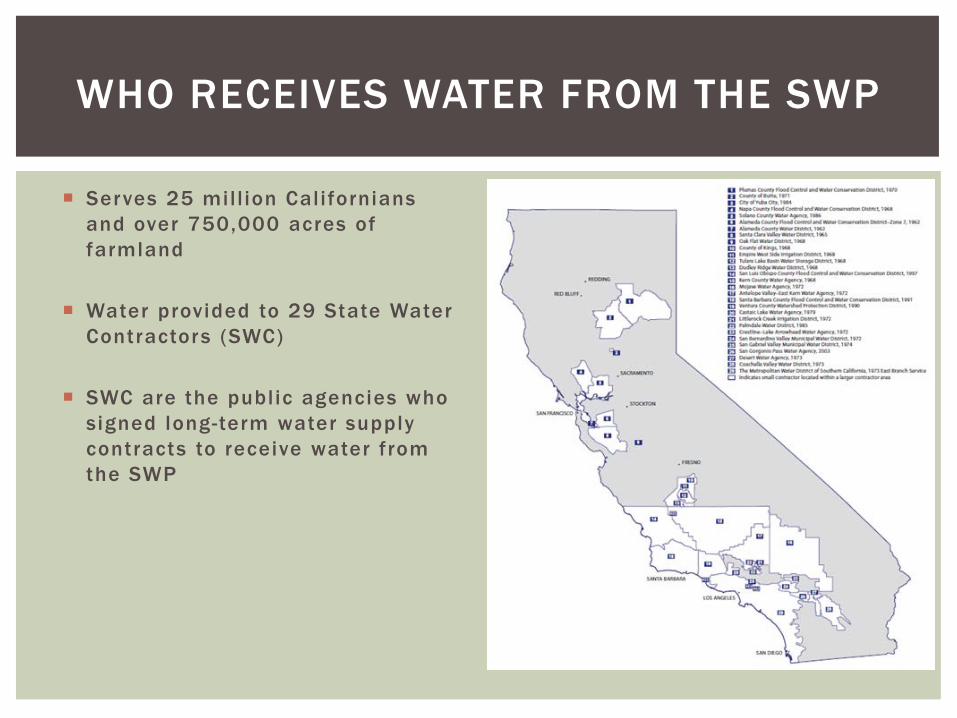
WHO RECEIVES WATER FROM THE SWP
Serves 25 mil l ion Cal ifornians and over 750,000 acres of farmland
Water provided to 29 State Water Contractors (SWC)
SWC are the public agencies who signed long-term water supply contracts to receive water from the SWP

SWP PUMPING AND GENERATING
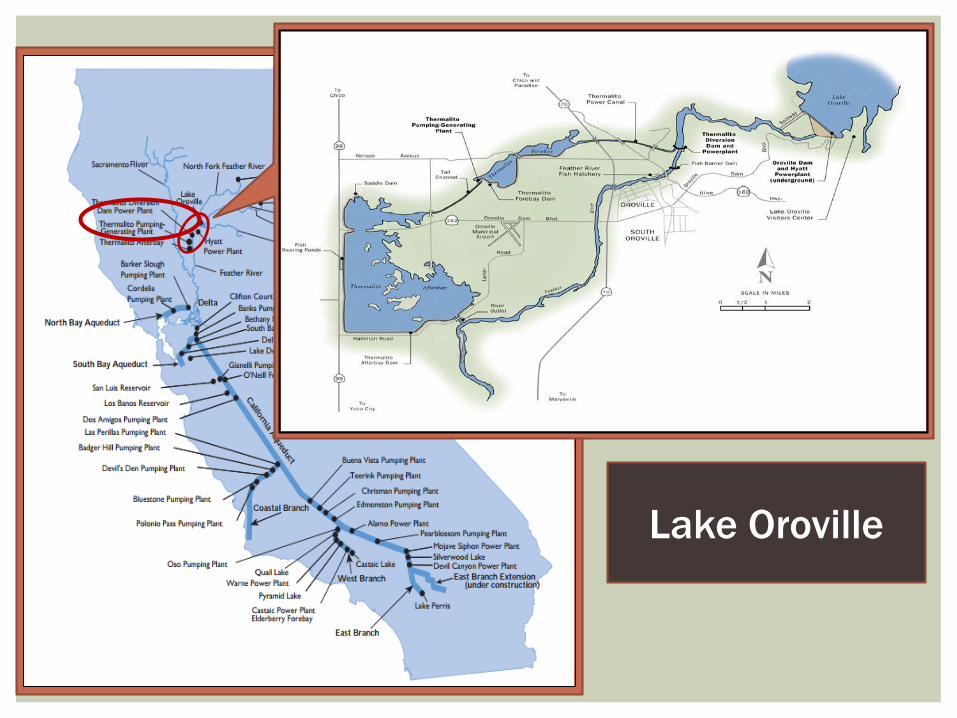
Lake Oroville
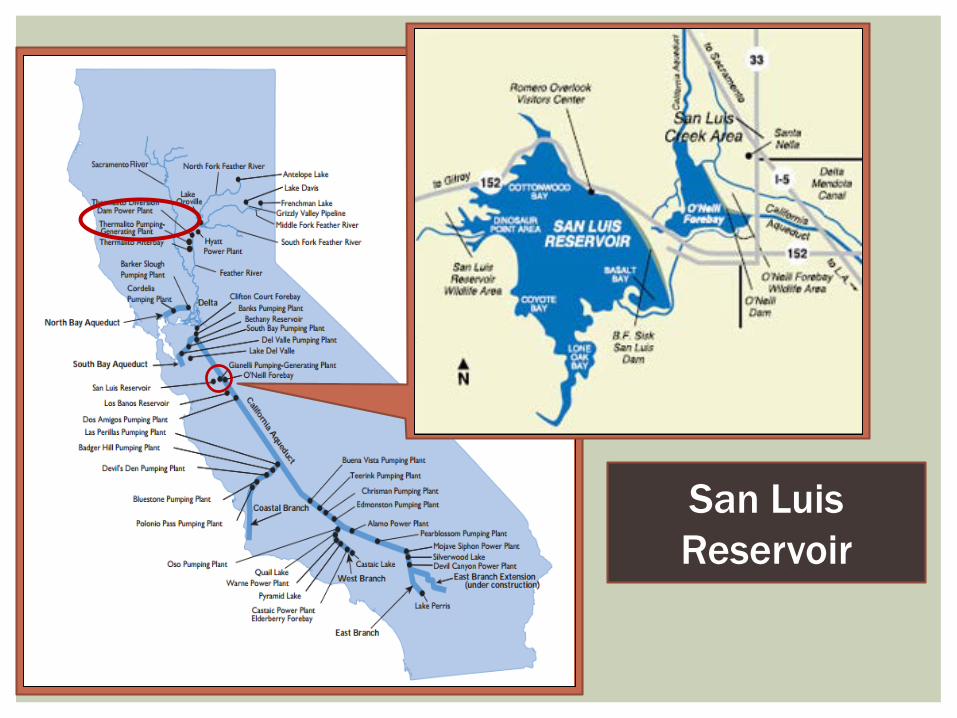
San Luis Reservoir
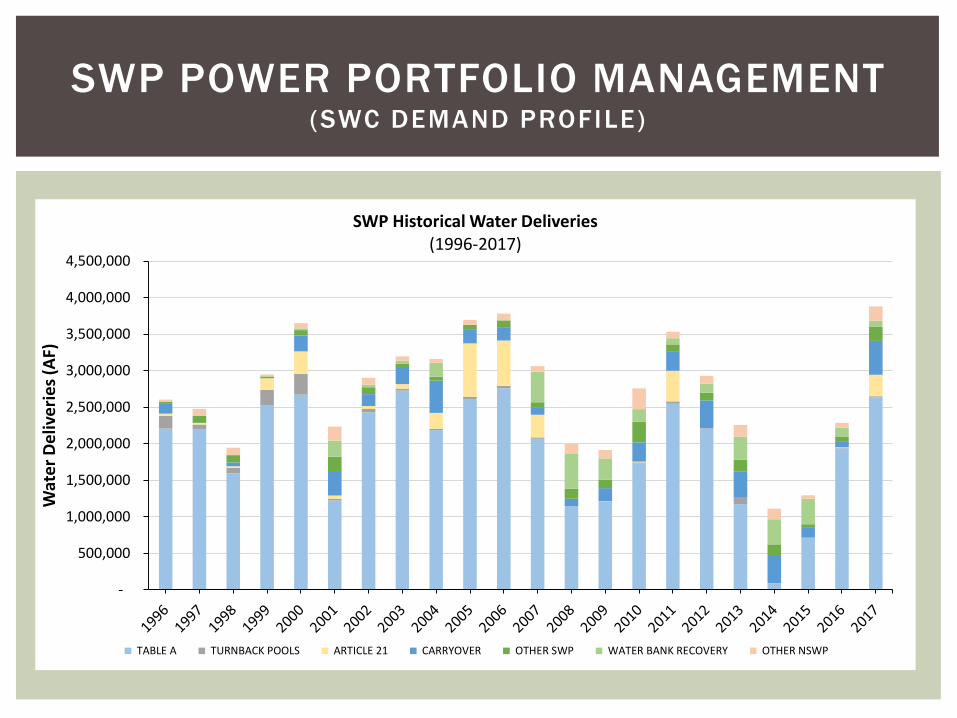
SWP POWER PORTFOLIO MANAGEMENT(SWC DEMAND PROFILE)
SWP Historical Water Deliveries(1996-2017)
Wat
er D
eliv
erie
s (AF
)
-
4,500,000
4,000,000
3,500,000
3,000,000
2,500,000
2,000,000
1,500,000
1,000,000
500,000
TABLE A TURNBACK POOLS ARTICLE 21 CARRYOVER OTHER SWP WATER BANK RECOVERY OTHER NSWP
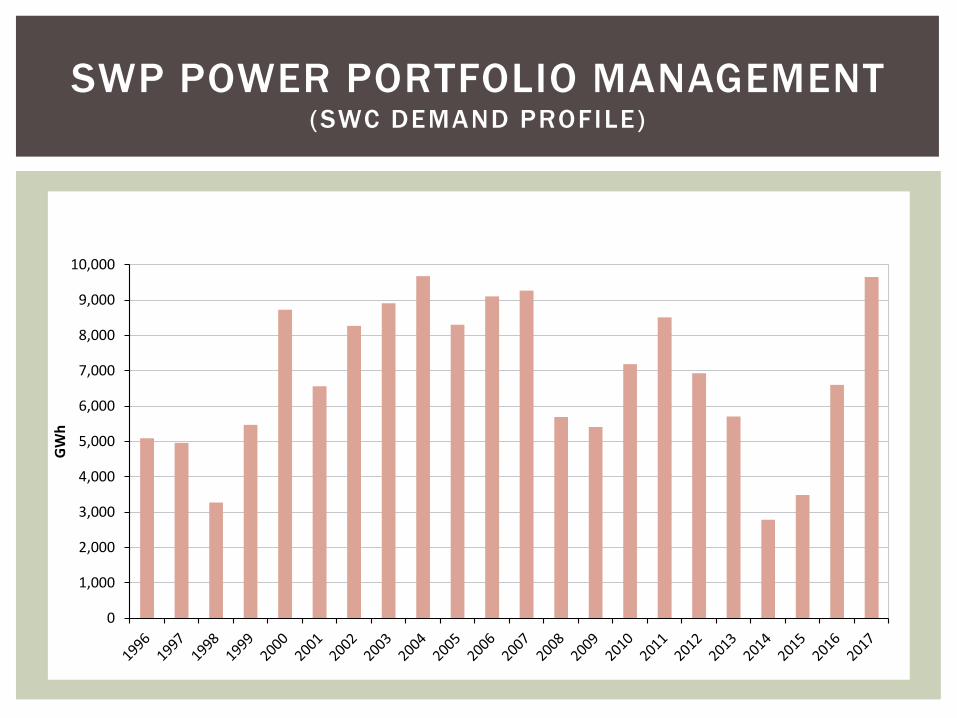
SWP POWER PORTFOLIO MANAGEMENT(SWC DEMAND PROFILE)
SWP Systemwide Load(1996-2017)
10,000
9,000
8,000
7,000
6,000
5,000
4,000
3,000
2,000
1,000
0
GW
h
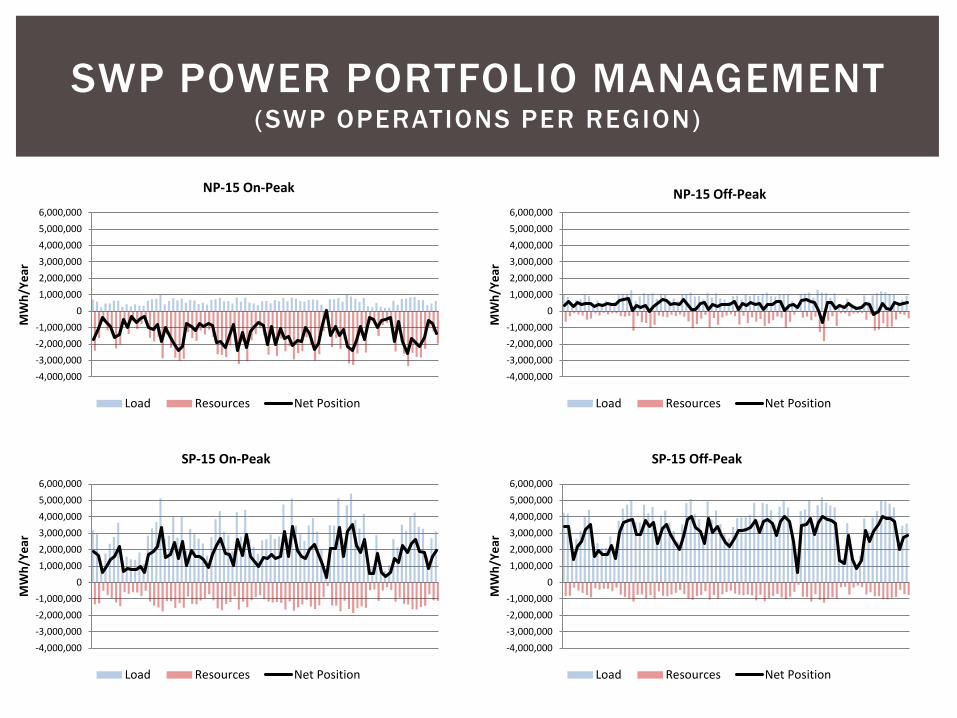
SWP POWER PORTFOLIO MANAGEMENT (SWP OPERATIONS PER REGION)
-4,000,000-3,000,000-2,000,000-1,000,000
01,000,0002,000,0003,000,0004,000,0005,000,0006,000,000
MW
h/Ye
ar
NP-15 On-Peak
Load Resources Net Position
-4,000,000-3,000,000-2,000,000-1,000,000
01,000,0002,000,0003,000,0004,000,0005,000,0006,000,000
MW
h/Ye
ar
NP-15 Off-Peak
Load Resources Net Position
-4,000,000-3,000,000-2,000,000-1,000,000
01,000,0002,000,0003,000,0004,000,0005,000,0006,000,000
MW
h/Ye
ar
SP-15 On-Peak
Load Resources Net Position
-4,000,000-3,000,000-2,000,000-1,000,000
01,000,0002,000,0003,000,0004,000,0005,000,0006,000,000
MW
h/Ye
ar
SP-15 Off-Peak
Load Resources Net Position
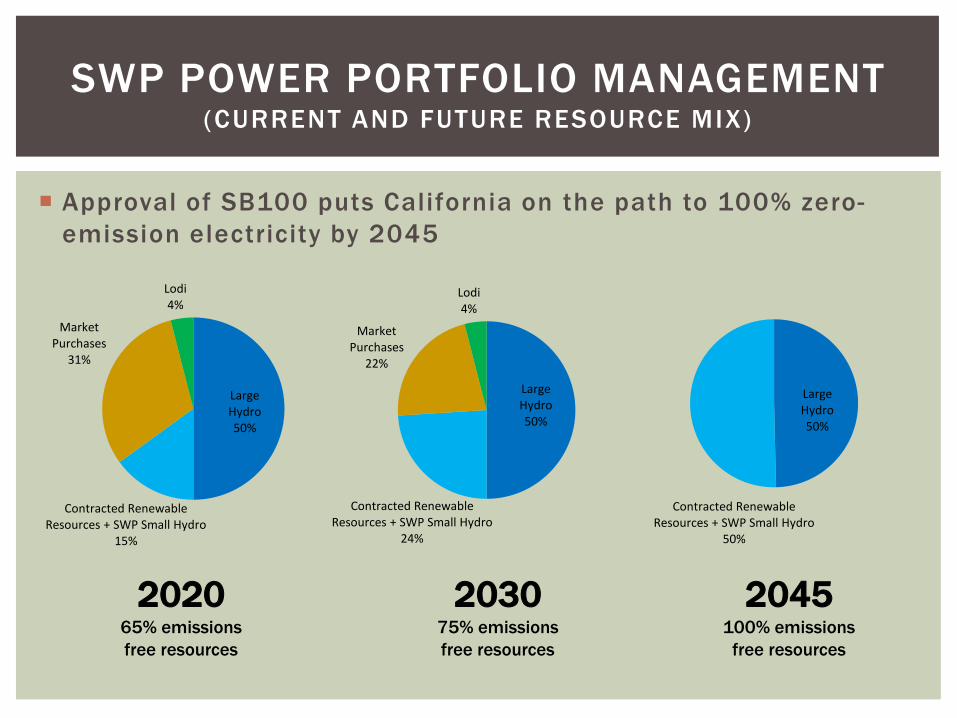
SWP POWER PORTFOLIO MANAGEMENT (CURRENT AND FUTURE RESOURCE MIX)
Approval of SB100 puts California on the path to 100% zero-emission electricity by 2045
202065% emissions free resources
203075% emissions free resources
2045100% emissions
free resources
Large Hydro50%
Contracted Renewable Resources + SWP Small Hydro
15%
Market Purchases
31%
Lodi4%
Large Hydro50%
Contracted Renewable Resources + SWP Small Hydro
24%
Market Purchases
22%
Lodi4%
Large Hydro50%
Contracted Renewable Resources + SWP Small Hydro
50%
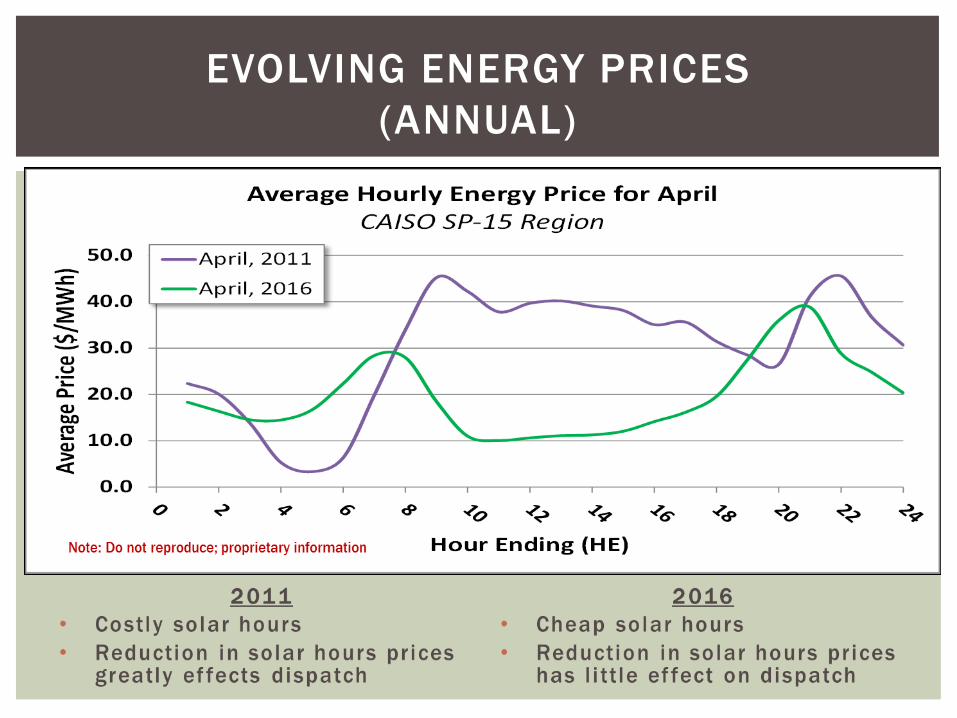
EVOLVING ENERGY PRICES(ANNUAL)
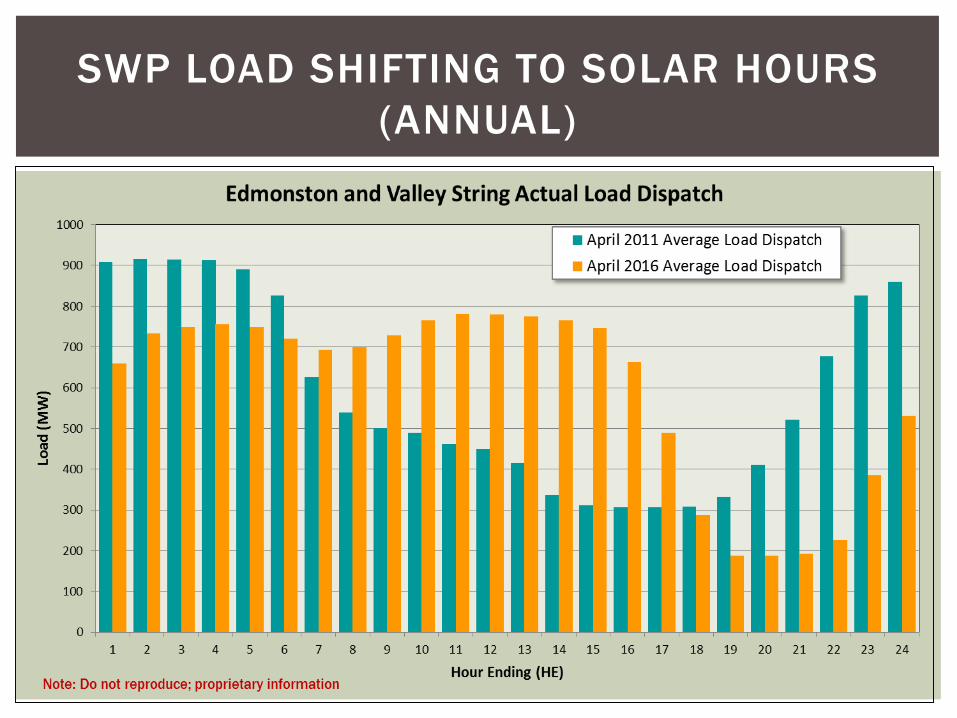
SWP LOAD SHIFTING TO SOLAR HOURS (ANNUAL)
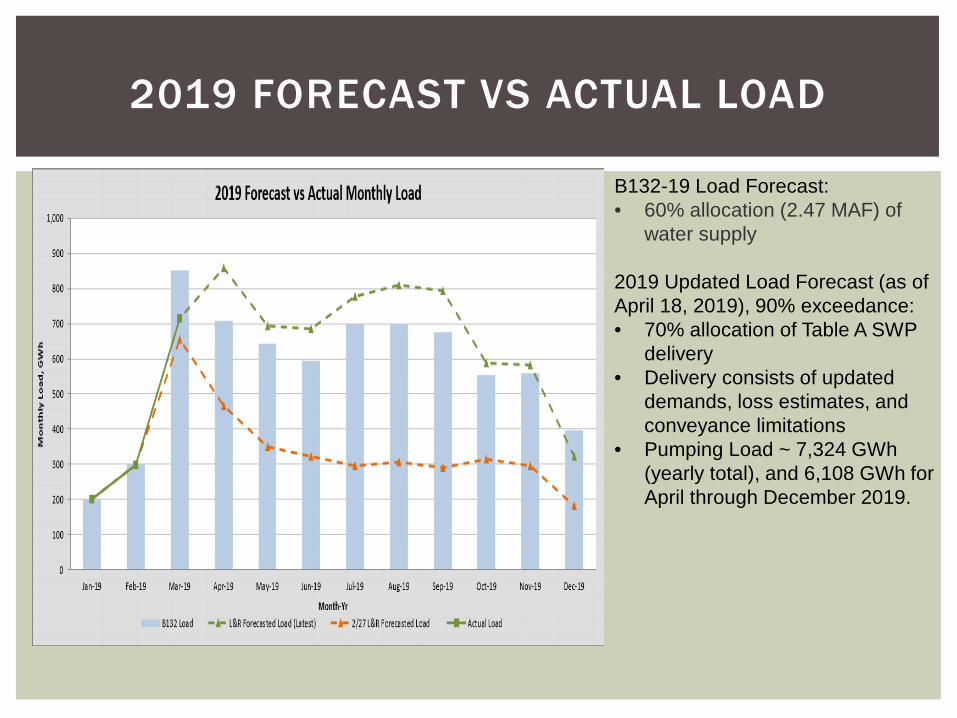
2019 FORECAST VS ACTUAL LOAD
B132-19 Load Forecast:• 60% allocation (2.47 MAF) of
water supply
2019 Updated Load Forecast (as of April 18, 2019), 90% exceedance:• 70% allocation of Table A SWP
delivery• Delivery consists of updated
demands, loss estimates, and conveyance limitations
• Pumping Load ~ 7,324 GWh (yearly total), and 6,108 GWh for April through December 2019.
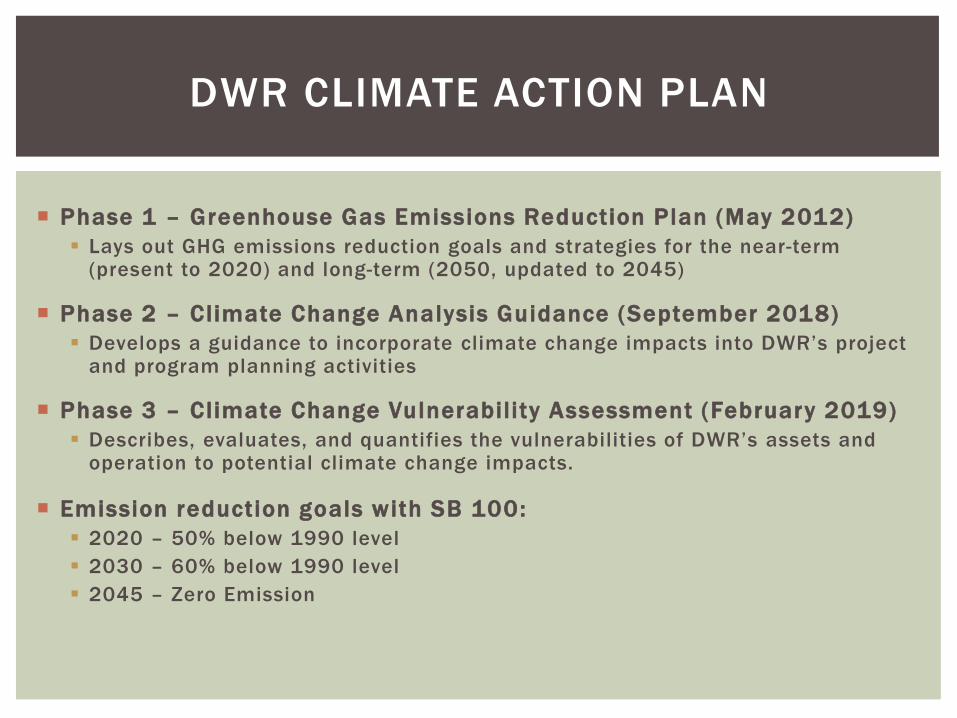
DWR CLIMATE ACTION PLAN
Phase 1 – Greenhouse Gas Emissions Reduction Plan (May 2012) Lays out GHG emissions reduction goals and strategies for the near-term
(present to 2020) and long-term (2050, updated to 2045)
Phase 2 – Climate Change Analysis Guidance (September 2018) Develops a guidance to incorporate climate change impacts into DWR’s project
and program planning activities
Phase 3 – Climate Change Vulnerability Assessment (February 2019) Describes, evaluates, and quantifies the vulnerabilities of DWR’s assets and
operation to potential climate change impacts.
Emission reduction goals with SB 100: 2020 – 50% below 1990 level 2030 – 60% below 1990 level 2045 – Zero Emission

DWR EMISSION SOURCES
Pumping Load Propane Natural Gas Power Plant Compressed Natural Gas Construction and Repair Gasoline SF6 Diesel Emergency Generators Acetylene Stationary Equipment Fire Extinguishers Mobile Equipment Refrigerants Electricity for Facil ities Natural Gas (Retail Use)
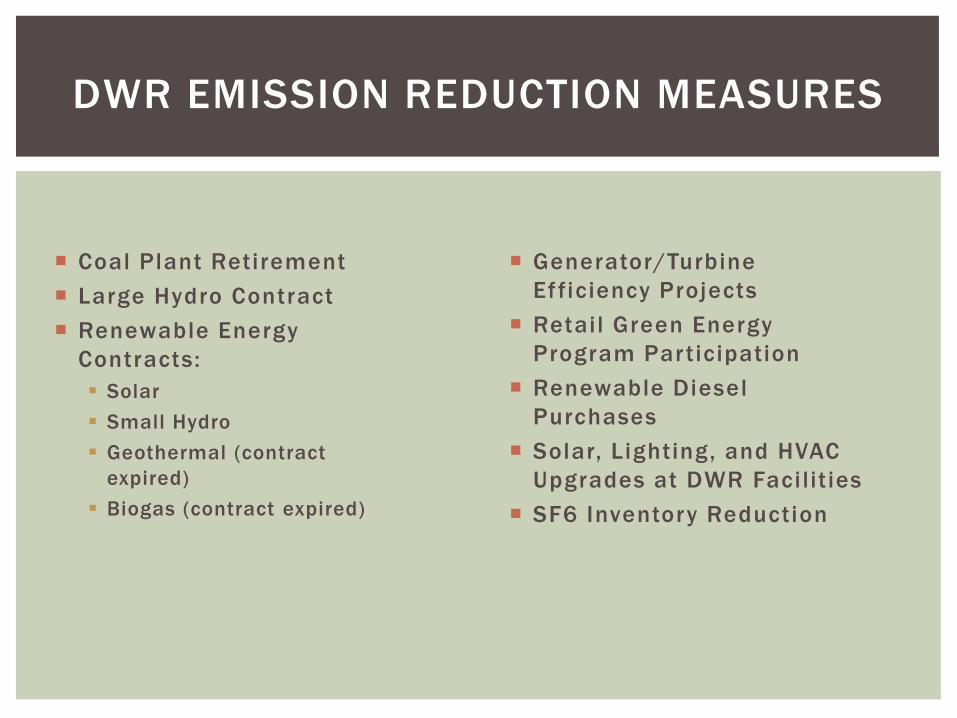
DWR EMISSION REDUCTION MEASURES
Coal Plant Retirement Generator/Turbine Large Hydro Contract Efficiency Projects
Renewable Energy Retail Green Energy Contracts: Program Participation Solar Renewable Diesel Small Hydro Purchases Geothermal (contract Solar, Lighting, and HVAC
expired) Upgrades at DWR Facilit ies Biogas (contract expired) SF6 Inventory Reduction
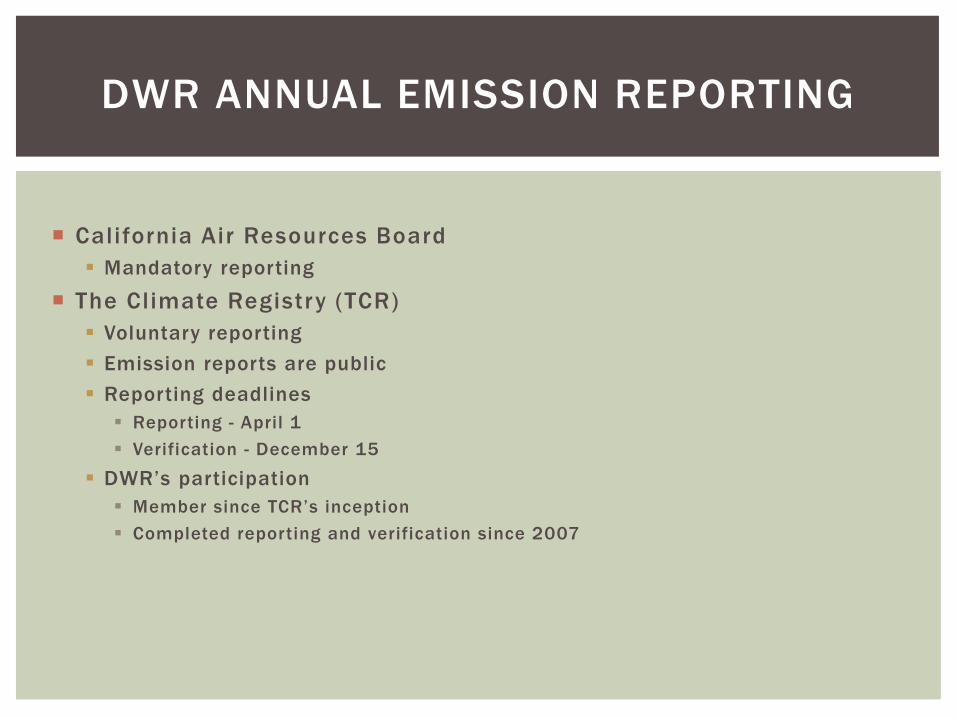
DWR ANNUAL EMISSION REPORTING
California Air Resources Board Mandatory reporting
The Climate Registry (TCR) Voluntary reporting Emission reports are public Reporting deadlines Reporting - April 1 Verification - December 15
DWR’s participation Member since TCR’s inception Completed reporting and verification since 2007
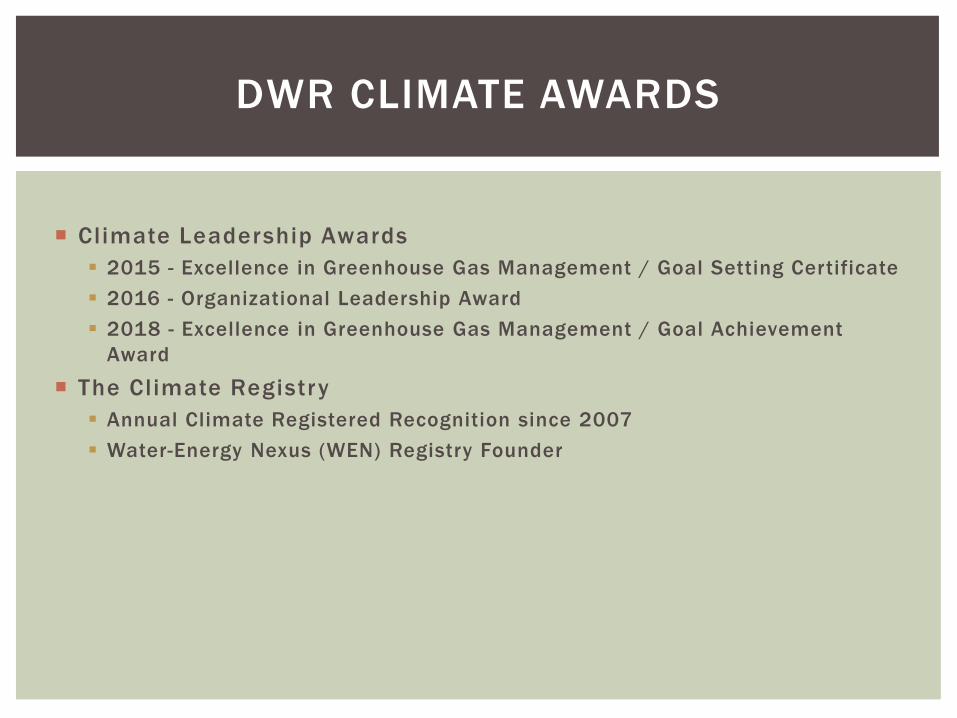
DWR CLIMATE AWARDS
Climate Leadership Awards 2015 - Excellence in Greenhouse Gas Management / Goal Setting Certificate 2016 - Organizational Leadership Award 2018 - Excellence in Greenhouse Gas Management / Goal Achievement
Award
The Climate Registry Annual Climate Registered Recognition since 2007 Water-Energy Nexus (WEN) Registry Founder

DWR’S PARTICIPATION IN WEN
Annual Emissions and Water Delivery Reports to TCR WEN Registry repor ting wil l fol low the same deadlines
DWR’s Participation 2017 – Development of Water-Energy GHG metrics 2018-19 – WEN Working Group and Advisory Committee workshops May 13, 2019 – WEN Registry Launch May 22, 2019 – CDWR signed WEN Registry Par ticipation Agreement June 5, 2019 – Welcome & Orientation from TCR
Future Plans Report and verify 2018 intensity metrics (Tons of CO2e / AF) to the WEN
Registry DWR emission intensit ies avai lable for water agencies to use for their
upstream GHG emission for the water del ivered by SWP
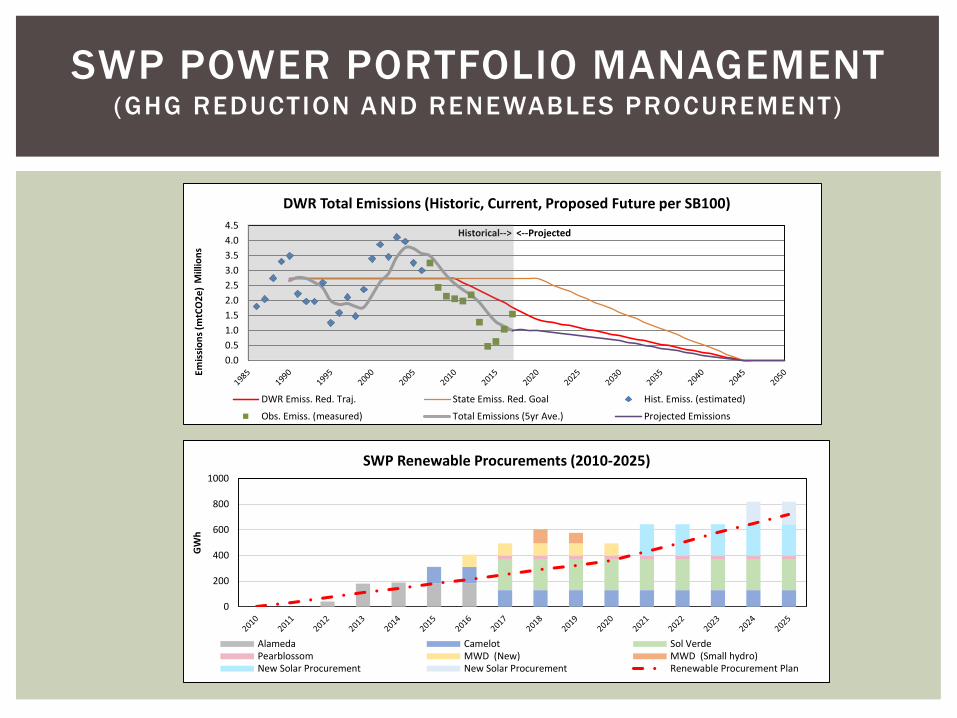
SWP POWER PORTFOLIO MANAGEMENT (GHG REDUCTION AND RENEWABLES PROCUREMENT)
0.00.51.01.52.02.53.03.54.04.5
Emis
sion
s (m
tCO
2e)
Mill
ions
Historical--> <--Projected
DWR Total Emissions (Historic, Current, Proposed Future per SB100)
DWR Emiss. Red. Traj. State Emiss. Red. Goal Hist. Emiss. (estimated)
Obs. Emiss. (measured) Total Emissions (5yr Ave.) Projected Emissions
0
200
400
600
800
1000
GW
h
SWP Renewable Procurements (2010-2025)
Alameda Camelot Sol VerdePearblossom MWD (New) MWD (Small hydro)New Solar Procurement New Solar Procurement Renewable Procurement Plan
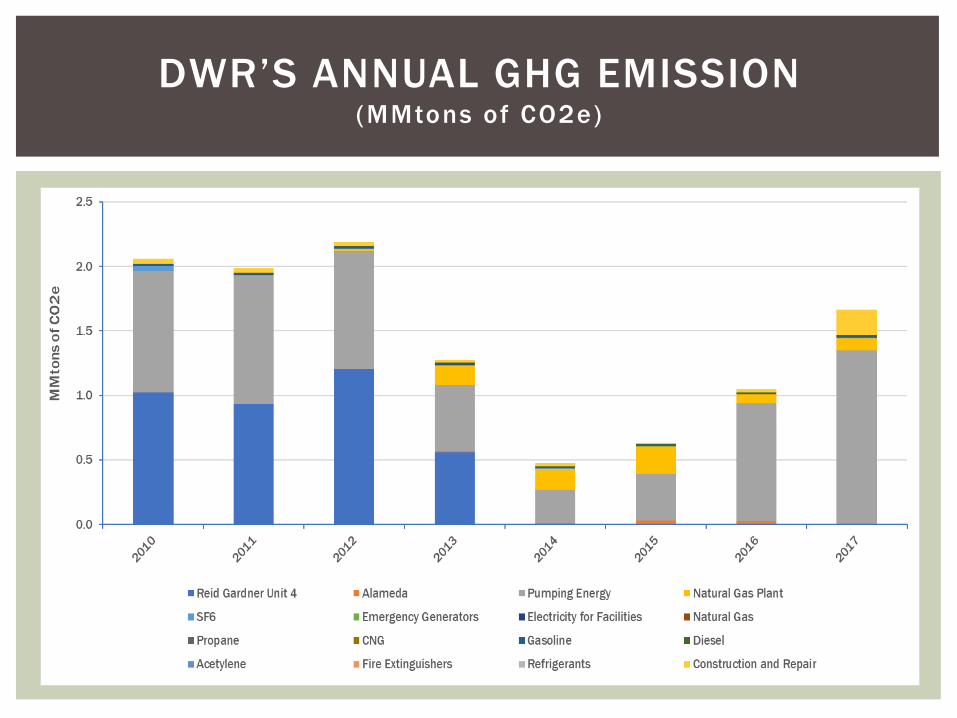
DWR’S ANNUAL GHG EMISSION(MMtons of CO2e)
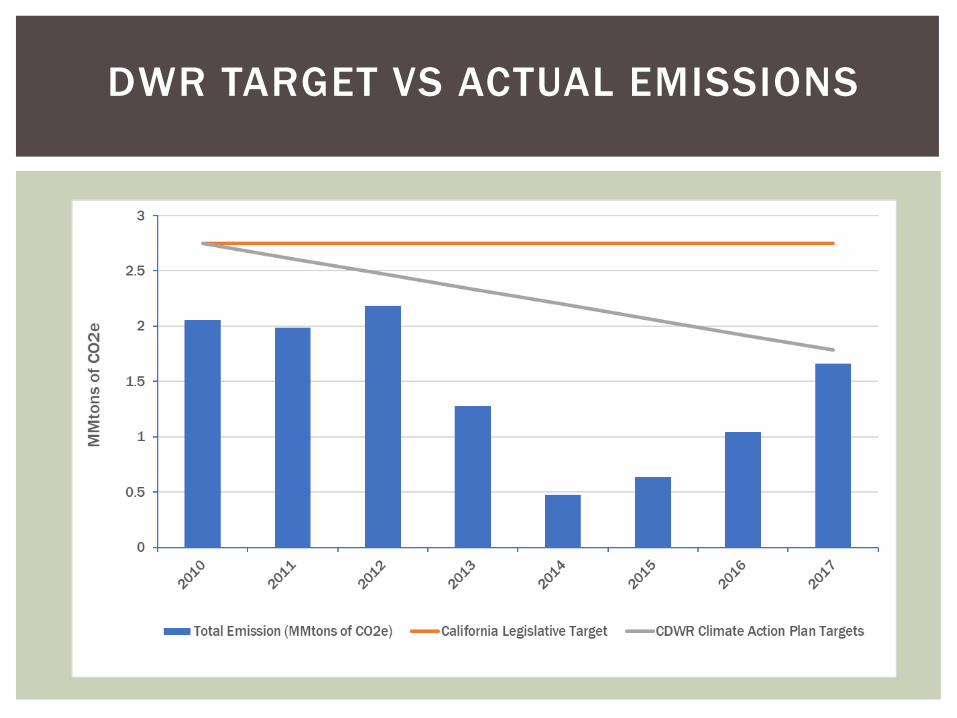
DWR TARGET VS ACTUAL EMISSIONS
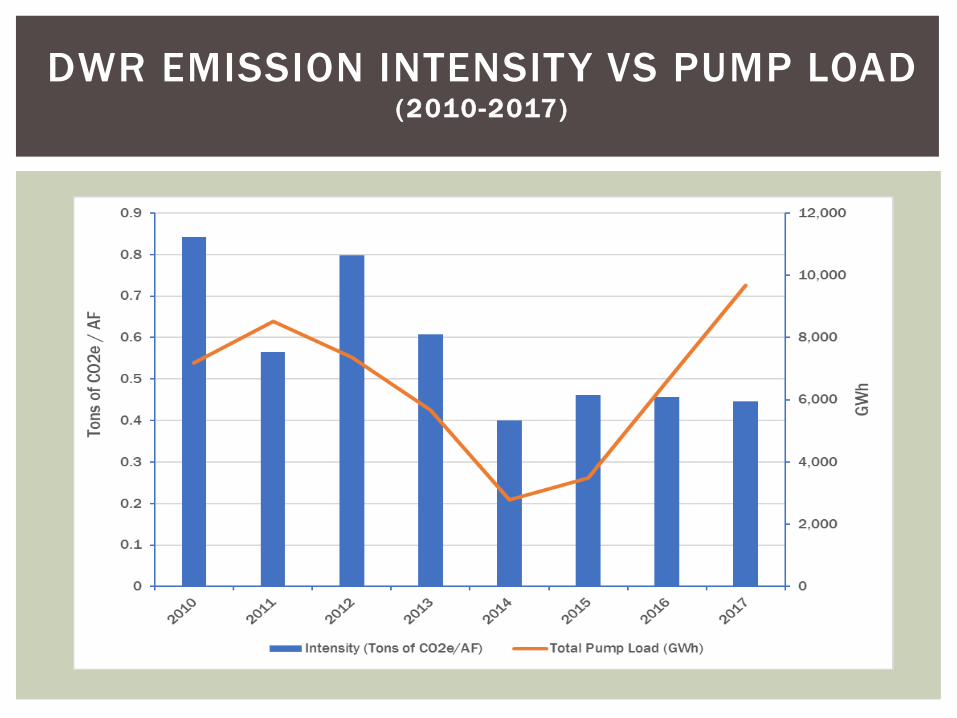
DWR EMISSION INTENSITY VS PUMP LOAD(2010-2017)

QUESTIONS? Thank You.