state park & ride lot program - florida … · state park & ride lot program planning...
TRANSCRIPT
STATE PARK & RIDE LOTPROGRAM
FLORIDA DEPARTMENT OF TRANSPORTATION


STATE PARK & RIDE LOT PROGRAMPlanning Manual
Prepared for theOffice of Public Transportation
Florida Department of TransportationTallahassee, Florida
ByFrederick R. Harris, Inc.6300 NE First Avenue
Fort Lauderdale, FL 33334December 1989
Revised byThe Marketing Institute
Florida State University College Of Business324 Rovetta Business BuildingTallahassee, FL 32306-1111
September 1996
Table of Contents
Notes on 1996 Revisions ............................................................................................................... i
CHAPTER 1: INTRODUCTION ................................................................................................ 1-1BACKGROUND ............................................................................................................. 1-1STUDY DOCUMENTATION ........................................................................................ 1-2REPORT ORGANIZATION........................................................................................... 1-3
CHAPTER 2: PARK-AND-RIDE PLANNING PROCESS ....................................................... 2-1LONG-RANGE IMPLEMENTATION OF PARK-AND-RIDE PLANNING ............... 2-1SHORT-RANGE IMPLEMENTATION OF PARK-AND-RIDE PLANNING ............. 2-1FACILITY DEVELOPMENT PROCESS....................................................................... 2-2
CHAPTER 3: FACILITY SITE SELECTION ............................................................................ 3-1SYSTEMS-LEVEL SITE SELECTION.......................................................................... 3-2
Urban Corridor Lots............................................................................................. 3-3HOV Corridor Lots .............................................................................................. 3-4Peripheral Lots ..................................................................................................... 3-4Urban Fringe Lot.................................................................................................. 3-5Remote Lots ......................................................................................................... 3-5
PROJECT-LEVEL SITE SELECTION........................................................................... 3-6
CHAPTER 4: DEMAND ESTIMATION AND FACILITY SIZE ESTIMATION.................................................................................................................... 4-1
ANALYSIS PHILOSOPHY ............................................................................................ 4-1REMOTE FACILITIES ................................................................................................... 4-2PERIPHERAL FACILITIES ........................................................................................... 4-4SKETCH PLANNING FOR URBAN FRINGE FACILITIES........................................ 4-7DETAILED METHODOLOGY FOR TRANSIT FACILITIES ................................... 4-10
CHAPTER 5: IMPACT ASSESSMENTS .................................................................................. 5-1DATA REQUIREMENTS............................................................................................... 5-2REMOTE LOT IMPACTS .............................................................................................. 5-2URBAN FRINGE AND URBAN CORRIDOR LOT IMPACTS ................................... 5-4PERIPHERAL LOT IMPACTS .................................................................................... 5-12
CHAPTER 6: ECONOMIC ANALYSIS AND PROJECT JUSTIFICATION........................... 6-1THE JUSTIFICATION REPORT.................................................................................... 6-2BENEFIT, COST AND EFFECTIVENESS MEASURES ............................................. 6-2
Benefit Measures.................................................................................................. 6-5Project Costs ........................................................................................................ 6-5Effectiveness Measures........................................................................................ 6-7

ECONOMIC ANALYSIS OF PARK-AND-RIDE IMPROVEMENTS ........................ 6-9Cost Updates ........................................................................................................ 6-9Study Features...................................................................................................... 6-9Project Description and Costs............................................................................ 6-10Transit Costs ...................................................................................................... 6-11User Costs .......................................................................................................... 6-11User Benefits...................................................................................................... 6-12Residual Value ................................................................................................... 6-12Present Values and Economic Evaluation ......................................................... 6-12
CHAPTER 7: CONCEPTUAL DESIGN CONSIDERATIONS................................................ 7-1EXTERNAL FEATURES ............................................................................................... 7-1
Access/Egress Considerations.............................................................................. 7-1Off-Site Bus Access ............................................................................................. 7-2Traffic Control Devices ....................................................................................... 7-4Guide Signs.......................................................................................................... 7-5
INTERNAL LOT DESIGN ............................................................................................. 7-6Site Layout/Internal Circulation........................................................................... 7-6Parking Layout ..................................................................................................... 7-7Transit Terminal Facilities ................................................................................. 7-12Pavement and Drainage ..................................................................................... 7-14Signing/Marking ................................................................................................ 7-14Landscaping ....................................................................................................... 7-15Security .............................................................................................................. 7-16Boundary Identification ..................................................................................... 7-16User Amenities................................................................................................... 7-17
CHAPTER 8: PROMOTION ...................................................................................................... 8-1ROADSIDE SHARERIDE SIGNS.................................................................................. 8-3NEWS RELEASES ......................................................................................................... 8-3MULTI-TRIP TRANSIT PASS PROGRAMS................................................................ 8-4DOOR-TO-DOOR CAMPAIGNS .................................................................................. 8-4PUBLIC SERVICE ANNOUNCEMENTS..................................................................... 8-4NEWSPAPER ADS......................................................................................................... 8-4PROMOTIONAL MATERIALS..................................................................................... 8-5TRANSIT ROUTE GUIDES/SCHEDULES................................................................... 8-5POSTERS/BILLBOARDS .............................................................................................. 8-5EMPLOYER PROGRAMS ............................................................................................. 8-5TELEPHONE INFORMATION SERVICE .................................................................... 8-5INTERNET/WWW POSTINGS...................................................................................... 8-5
DIRECT MAIL TO EMPLOYEES ............................................................................................ 8-6
CHAPTER 9: PLANNING ANCILLARY SERVICES .............................................................. 9-1

TRANSIT SERVICE ....................................................................................................... 9-1BUS LOADING AREAS................................................................................................. 9-3VANPOOL/CARPOOL STAGING AREAS .................................................................. 9-3SECURITY ...................................................................................................................... 9-3
CHAPTER 10: EVALUATING PERFORMANCE OF EXISTING FACILITIES................... 10-1PRIMARY DATA COLLECTION ............................................................................... 10-1PERFORMANCE EVALUATIONS............................................................................. 10-4SITE-SPECIFIC DATA COLLECTION....................................................................... 10-6ANALYZE SOLUTIONS.............................................................................................. 10-8
Unsatisfactory Operation ................................................................................... 10-9Marginal Operation ............................................................................................ 10-9Critical Operating Deficiency .......................................................................... 10-11Over-Utilization ............................................................................................... 10-11
CHAPTER 11: PROGRAM PERFORMANCE EVALUATIONS........................................... 11-1APPLICATION AREA DESCRIPTIONS..................................................................... 11-1
Impact Assessments ........................................................................................... 11-2Program Assessment .......................................................................................... 11-2Management....................................................................................................... 11-2Budgeting........................................................................................................... 11-2
PERFORMANCE MEASURES.................................................................................... 11-3VMT Reduction ................................................................................................. 11-8User Cost Savings .............................................................................................. 11-9Change In Vehicle Occupancy........................................................................... 11-9Annual Fuel Savings ........................................................................................ 11-10Annual Emission Reductions........................................................................... 11-10Value of Accident Reduction........................................................................... 11-10
CHAPTER 12: PRIVATE PARTICIPATION .......................................................................... 12-1
TECHNICAL APPENDICES.................................................................................................. 12-18

LIST OF TABLES
Table 3-1. Systems-Level Facility Siting Criteria ................................................................. 3-3Table 4-1. Peripheral Park-and-Ride Facility Home-Base Work Mode Share Data............. 4-5Table 4-2. Home-Base Work Trip Auto Occupancies (persons per vehicle) ........................ 4-6Table 4-3. Distribution of CBD Parking By Trip Purpose .................................................... 4-6Table 4-4. Suggested Design Periods.................................................................................... 4-9Table 4-5. Generalized K and D Factors ............................................................................... 4-9Table 4-6. ITE Model Test Results Using Florida Data...................................................... 4-10Table 4-7. Florida Urban Area Home-Base Trip Data ...................................................... 4-17Table 4-8. Mode Split Input Variables ................................................................................ 4-18Table 4-9. Bias Coefficients for Primary-Level Mode Split Model ................................... 4-20Table 4-10. Bias Coefficients for Secondary-Level Mode Split Model................................ 4-20Table 5-1. Data Requirements............................................................................................... 5-2Table 5-2. Average Fuel Consumption and Emission Rates For Remote Lots..................... 5-4Table 5-3. Average Roadway Operating Speeds Based Per Lane Volumes.......................... 5-7Table 5-4. Operating Speeds for Total Volume Reduction (miles per hour) ........................ 5-7Table 5-5. Auto Fuel Consumption Rate for Freeways (grams/mile) ................................... 5-8Table 5-6. Auto Fuel Consumption Rate for Arterials (grams/mile) .................................... 5-9Table 5-7. Average Fuel Consumption and Emission Rates For Transit Vehicles ............... 5-9Table 5-8. 1990 Auto Emission Rates (grams/mile) ........................................................... 5-10Table 5-9 1995-2010 Auto Emission Rates (grams/mile).................................................. 5-11Table 5-10. Fuel Consumption Parameters ........................................................................... 5-14Table 5-11. Carbon Monoxide Emission Rates Year 1990 (Grams/mile) ............................ 5-14Table 5-12. Carbon Monoxide Emission Rates Year 1995 (Grams/mile) ............................ 5-15Table 5-13. Carbon Monoxide Emission Rates Year 2000-2010 (Grams/mile) ................... 5-15Table 5-14. Hydrocarbons Emission Rates Year 1990 (Grams/mile) ................................... 5-15Table 5-15. Hydrocarbons Emission Rates Year 1995 (Grams/mile) ................................... 5-16Table 5-16. Hydrocarbons Emission Rates Year 2000-2010 (Grams/mile).......................... 5-16Table 5-17 Nitrogen Oxide Emission Rates Year 1990 (Grams/mile)................................. 5-16Table 5-18. Nitrogen Oxide Emission Rates Year 1995 (Grams/mile)................................. 5-17Table 5-19. Nitrogen Oxide Emission Rates Year 2000-2010 (Grams/mile) ....................... 5-17Table 6-1. Benefit, Cost and Effectiveness Measures Relevant to Park-And-Ride
Improvements....................................................................................................... 6-4Table 6-2. Economic Life Cycles for Park-and-Ride Improvements .................................. 6-11Table 6-3. User Cost Default Values (1989 dollars) ........................................................... 6-13Table 7-1. Facility Access/Egress Design Factors ................................................................ 7-3Table 7-2. Off-Site, On-Street Bus Stop Design Factors ...................................................... 7-4Table 7-3. Facility Traffic Control Device Design Factors................................................... 7-5Table 7-4. Guide Sign Design Factors ................................................................................. 7-6Table 7-5. Internal Circulation Design Concepts .................................................................. 7-7Table 7-6. AASHTO Handicapped Parking Recommendations ........................................... 7-9Table 8-1. Application of Park-and-Ride Promotional Techniques...................................... 8-2Table 10-1. Performance Evaluation Input Data Specification............................................. 10-3

Table 10-2. Performance Evaluation Criteria........................................................................ 10-5Table 10-3. Input Data Specification for Site Evaluations.................................................... 10-7Table 10-4. Conditions for Lot Closure and Disposal........................................................... 10-9Table 10-5. Conditions for Corrective Actions at Marginally Operating Facilities ............ 10-10Table 10-6. Over-Utilization Solution Evaluation Matrix .................................................. 10-12Table 11-1. Program Performance Measures ........................................................................ 11-4Table 11-2. System-Average Trip Lengths, Occupancies and Operating Costs for Park-
And-Ride Facilities ............................................................................................ 11-7Table 11-3. System-Average Fuel Consumption and Vehicle Emission Rates .................... 11-8Table 12-1. Private Participation Techniques Summary....................................................... 12-2

LIST OF FIGURES
Figure 2-2: Short-Range Park and Ride Implementation ....................................................... 2-1Figure 2-1: Long Range Park and Ride Implementation ........................................................ 2-2Figure 2-3: Facility Development Process.............................................................................. 2-2Figure 4: Nested Logit Model ........................................................................................... 4-13Figure 10-1: Evaluation Process ............................................................................................. 10-1

i
Notes on 1996 Revisions
This document is a revision of the 1989 State Park and Ride Lot Program Planning Manual,prepared by Frederick R. Harris, Inc., for the Florida Department of Transportation. The majorpurpose of this revision was to provide the Department of Transportation with an editable digitalcopy of the Park and Ride Lot Planning Manual and an updated survey of the State Park and RideLot System. Where appropriate, certain other minor revisions have been made, as noted below,but this revision does not include a wholesale update and verification of the planning models,equations, and worksheets provided in 1989 Park and Ride Lot Planning Manual.
Revisions to the manual are as follows:1. Literature revisions: References to manuals, Federal Laws, and FDOT Procedures have been
verified and updated where necessary. In particular, references to the Intermodal SurfaceTransportation Efficiency Act of 1991 (ISTEA) and the Americans with Disabilities Act(ADA) have been added. Where appropriate, the manual has also been updated to includereferences to the Internet and the World Wide Web.
2. Typographical errors: Typographical errors noted in the 1989 edition have been corrected.
3. Data elimination: The 1989 version included in Chapter 3 a set of data tables describing thecharacteristics of Park and Ride lot usage in Florida. Due to the age of these data tables, theywere no longer considered valid and, with the approval of the Department of Transportation,have been omitted from this revision.
4. Elimination of Roadway Level of Service Definitions: The 1989 version included inAppendix E the Roadway Level of Service Definitions from the Transportation ResearchBoard's Highway Capacity Manual.With the approval of the Department of Transportation,this information has not been reproduced in this version. The user is referred to the HighwayCapacity Manual directly for the most current level of service definitions.
This manual is being provided to the Department of Transportation in WordPerfect 5.2 format onCD-ROM, diskette, and paper.

ii

Florida Department of Transportation Park and Ride Manual1-1
CHAPTER 1: INTRODUCTION
The purpose of this manual is to provide the information necessary for agencies in Florida to plan,implement, and manage park-and-ride facilities. The information contained in the document reflectscurrent practice and is consistent with existing and proposed policies of the Florida Department ofTransportation. The use of this manual will establish a standard procedure to be used in evaluationsof park-and-ride facilities including:
• Site location studies• Site size estimation• Impact assessments• Project Justification• Conceptual design• Development of promotional programs• Planning of ancillary services• Performance monitoring and development of improvement plans for existing facilities.
BACKGROUNDThe necessity for developing this planning manual resulted from a number of individual eventswhich together have critically impacted the provision of improvements to serve the transportationneeds of the State of Florida. The most recent event and one with the most significant impact onpark-and-ride development is the current shortfall in funding for transportation improvements. Inaddition, ISTEA•s emphasis on multimodal transportation makes park and ride programs animportant part of the transportation system.
Aside from ISTEA, the limited availability of road construction funding makes it imperative thatexisting roadways be used as efficiently as possible. Park-and-ride is one of a number oftransportation systems which can be managed to make the highest and best use of availabletransportation funding. Park-and-ride is an attractive improvement when considering the relativelylow costs with which it can be implemented. However, to take advantage of this characteristic,procedures are required to guide planners and administrators in park-and-ride facility planning,development, and management.
The second event which threatens to further tax the already tenuous transportation funding situation has been the enactment of the latest Florida growth management regulations. These regulations require the provision of infrastructure concurrent with land use development. This hasthe potential significant impact of increasing development contribution to the transportation system.Park-and-ride is one of a number of congestion mitigation measures which can help to make thislegislation work while not straining the economic viability of Florida•s urban areas. The reason forthis is that park-and-ride has the potential of preserving roadway capacities through decreases indemand brought about by carpooling and increased transit usage. These decreases can becomesignificant enough to attract private participation in heavily traveled corridors where majorfacilities on the order of a Golden Glades or Dadeland Metrorail Station facility can be established.Such facilities can be far less expensive then the cost of added roadway capacity or the loss ofdevelopment opportunities. This situation also highlights the need for acceptable and practical

Florida Department of Transportation Park and Ride Manual1-2
planning procedures for park-and-ride facilities.
The third event which recently occurred had a direct impact on developing future park-and-ridefacilities in relation to high-occupancy vehicle systems. A 1988 study of certain elements of theI-95 Reconstruction Project in Southeast Florida resulted in threatened cancellation of previouslyjustified construction, and reevaluation and redesign of already programmed facilities.Examination of this experience has led to two conclusions: first, this event resulted from differentstudy methodologies being used in the initial project justification work and the later reevaluationstudy; and second, the seriousness of the situation could have been effectively reduced if theDepartment had a clear and consistently applied process for justifying construction ofpark-and-ride facilities. The preparation of this document conforms to recommendations made bythe State•s Inspector General regarding the I-95 project.The Statewide park-and-ride system consists of approximately 20,000 parking spaces constructed atan estimated cost of $30 to $40 million. This significant investment indicates that more effort isrequired for monitoring and managing the system. For this to happen, clear and effectivemanagement procedures are required in conjunction with increased operations budgets.
STUDY DOCUMENTATIONThe material presented in this planning manual was originally produced through the State Park &Ride Lot Program Study, a six-month consultant effort conducted with the Governor•s EnergyOffice and the Florida Department of Transportation. The results of this study produced thisdocument as well as four working papers. The purpose of the working papers was to provide thetechnical support for the procedures, information and data provided in this planning manual. Theworking papers should be consulted if further background information is required. The topicscovered in the working papers are as follows:
Working Paper 1: Data Development•Presents procedures and results associated with surveys ofpark-and-ride lot users conducted at 17 locations around the State, results of a survey of State andlocal administrators of park-and-ride programs, and an inventory of existing park-and-ride facilities.This paper as referenced in Appendix A as Reference 1.
Working Paper 2: Program Analysis•Presents procedures for evaluating the effectiveness ofpark-and-ride programs. Provides methods for evaluating program impacts, effectiveness,management strategies, and budgeting. Presents results of Florida and national administratorsurveys addressing program evaluations. This paper as referenced in Appendix A as Reference 54.
Working Paper 3: Private Participation•Presents approaches for increasing the participation ofthe private sector in future development of park-and-ride in Florida. Presents results of Florida andnational administrator surveys addressing private participation in park-and-ride. This paper asreferenced in Appendix A as Reference 55.
Working Paper 4: Facility Analysis•Presents procedures and information useful to the siting,sizing, designing, justifying, and monitoring of park-and-ride facilities. Presents a recommended

Florida Department of Transportation Park and Ride Manual1-3
format for justification reports and economic analyses of park-and-ride projects. This paper isreferenced in Appendix A as Reference 2.
In addition to the working papers, this Manual was updated in 1996 using information from theDistrict Three FDOT Park and Ride Plan, referenced Appendix A as Reference 56.
REPORT ORGANIZATIONThe chapters of this planning manual are organized to follow a logical sequence of planning,development and management of the park-and-ride system. Chapter 2 presents a framework forplanning park-and-ride facilities within the present system of transportation planning and projectdevelopment practiced in Florida. Chapter 3 presents procedures for effectively locating newfacilities. Chapter 4 follows with methods for estimating facility demand and computing site sizerequirements. These methods are the bases for performing impact evaluations and economicassessments which are discussed in Chapters 5 and 6, respectively. Chapter 7 presents designelements which should be considered in designing new facilities and reconditioning existing ones.Chapter 8 presents techniques for promoting facilities to inform the public of their existence and toenhance their usage. Chapter 9 contains considerations for planning ancillary services to establishedpark-and-ride facilities to augment usage. Chapter 10 provides an approach for monitoring existingfacilities and a framework for evaluating corrective actions to facilities which are not utilized,underutilized, or over-utilized.The last two chapters of this document address issues of a higher managerial level than thepreceding chapters. Chapter 11 presents procedures for evaluating the effectiveness of State-,District-, and local-level park-and-ride programs. Chapter 12 concludes the main body of themanual with considerations for involving the private sector in park-and-ride development andoperation.
The final section of this manual contains the technical appendices. These include a list of referencescited in this document (Appendix A), a bibliographic listing of literature referenced during thestudy (Appendix B), a glossary of terms relevant to park-and-ride (Appendix C), a Statewidefacilities inventory (Appendix D) , and materials of use in park-and-ride planning exercises(Appendix E).
Documents in Appendix A will be cited by their citation number in brackets, as in [1].

Florida Department of Transportation Park and Ride Manual1-4

Florida Department of Transportation Park and Ride Manual2-1
CHAPTER 2: PARK-AND-RIDEPLANNING PROCESSThis chapter presents three processes forplanning and implementation park-and-ridefacilities within the context of the FloridaDepartment of Transportation. Theseprocesses are related to the long-range idealfor park-and-ride planning implementation,short-term integration of park-and-rideplanning with the existing operatingprocedures, and facility level planning.
LONG-RANGE IMPLEMENTATION OFPARK-AND-RIDE PLANNINGFigure 2-1 is a schematic that shows howpark-and-ride planning and implementationfits into the Department•s planning andproject development process.
Developing Long-range Plan P&R Elementsfacilitates implementation in two ways. First,park-and-ride projects become eligible tocompete with other projects for funds. Second,development review and impact fee
ordinances can be amended to target park-and-ride improvements specifically for developercontribution. This feature of developing Long-range Plan P&R Elements is an attractive alternativeto roadway expansion and lost or delayed development opportunities.Prioritization of projects considers a number of factors to establish 5-year work programs andcapital improvement programs. Typically, these include need, funding availability and jointparticipation arrangements. The growth management legislation will influence project prioritizationthrough the need to provide transportation services in unison with development. It will be at thisstep in the project development process that park-and-ride can benefit the provision oftransportation services. In specific situations, park-and-ride improvements can preserve existingroadway capacity which allows for additional development opportunities.
SHORT-RANGE IMPLEMENTATION OF PARK-AND-RIDE PLANNINGFigure 2-2 is a schematic showing how park and ride planning is implemented within the context ofthe Department•s project development process. The Figure 2-2 process requires the coordination ofthe preliminary engineering and design (PD&E), planning, and public transportation (PTO)functions within the Department. This coordination should occur at the PL &E review stage ofproject development.
Figure 2-2: Short-Range Park and RideImplementation

Florida Department of Transportation Park and Ride Manual2-2
FACILITY DEVELOPMENT PROCESSThe process presented in Figure 2-3 reflects thestages of facility development andmanagement presented in Chapters 3 through11 of this planning manual. The first stage ofthe process is systems-level planning which isconcerned with identifying subareas andcorridors that can support park-and-ridefacilities. The primary emphasis of this effort isto reduce adverse travel conditions through themaximum use of park-and-ride.
The second step of the process presented inFigure 2-3 is concerned with identifying siteswithin those subareas or corridors previouslyidentified to be supportive of park-and-ride.The primary emphasis of project-levelevaluation is to identify specific parcels withcharacteristics which maximize usage andminimize development costs.
Demand estimation and site sizing shouldoccur concurrently with the project-level siteevaluations. Parcel locations can effect
potential usage while the forecasted demand willdictate parcel size requirements.Impact assessments are required to gain publicand official acceptance of individual projects.These assessments also provide input toeconomic evaluations,environmental assessments,and justification required to capture funding forthe project under investigation.
In the design stage, specific elements of thefacility are developed to safely, conveniently,comfortably, and securely accommodate theeventual users.The planner/operator should establish amechanism to promote the facility once it isconstructed. The public will need to be madeadequately aware of the presence of the facility inorder for it to be used. This is particularly
Figure 2-1: Long Range Park and RideImplementation
Figure 2-3: Facility Development Process

Florida Department of Transportation Park and Ride Manual2-3
important for facilities which are located in areas which are not visible to commuters.Finally, ancillary services should be planned and instituted as required to maximize facility usage.This effort may require coordination with other agencies including public transportation operators.

Florida Department of Transportation Park and Ride Manual2-4

Florida Department of Transportation Park and Ride Manual3-1
CHAPTER 3: FACILITY SITE SELECTION
The process of selecting sites for developing a park-and-ride facility is hierarchical in nature. Thefirst level consists of a systems-level planning effort focused on identifying areas which canfeasibly support one or more park-and-ride facilities. Project-level planning is performed in thesecond level of the hierarchy. The focus of the project-level effort is to develop an inventory ofcandidate lot locations, assess their respective merits, and rank order the sites to develop a priorityfor implementation.
This chapter presents descriptions of criteria relevant to siting park-and-ride facilities. Included inthis is a set of siting criteria relevant to systems- and project-level site selection evaluations. Thesesiting criteria are dependent on the type of facility being planned and developed. The followingdefinitions have been used to categorize Florida park-and-ride lots and the related planningprocedures presented below:
Urban Corridor•Lots located along a major commute corridor within an urban area which aretypically served by line-haul transit which consists of express bus, urban rail, or commuter railservices. Trip origin patterns tend to be dispersed along the corridor. Trip destination patternsmay be dispersed along or concentrated at one end of the corridor.
HOV Corridor•Lots in this category are a subset of the urban corridor. HOV corridor lots arelocated adjacent to a major commuting highway constructed with high-occupancy vehicle lanes.HOV corridor lots are located and sized to maximize usage of the HOV lanes. They supportcarpool formation and access to line-haul transit (express buses) using the HOV lanes. Triporigins tend to be dispersed along the corridor. Trip destinations are usually concentrated in acentral business district or other major employment center.
Peripheral•Facilities typically located at the periphery or fringe of an intensely developed,highly congested activity center. The definition includes facilities which service activity centerswith limited parking and auto access such as auto-free zones, colleges, and universities. Theaccess distances to the lot are typically longer than other type facilities while egress distancesfrom the lot to the activity center are usually shorter.
Urban fringe•Lots located at the fringe of urban development. Trips tend to originate outsideor at the outer limits of the urban area while destinations may be concentrated or dispersedwithin the urban area. Fringe area lots are generally not served by transit, although this is notuniversally true for all fringe lots.
Remote or Rural•Lots generally located outside the urban area in a rural or small town setting.Trip lengths for both home-to-lot and lot-to-work legs of the commute trip are much longer thanfor lots of other types.

Florida Department of Transportation Park and Ride Manual3-2
SYSTEMS-LEVEL SITE SELECTION The primary concern of systems-level site selection is the identification of areas wherepark-and-ride is feasible. Systems-level planning for park-and-ride can assist in implementationthrough the development of long-range park-and-ride elements of urban area transportation plans.This provides opportunities for:
• automatically considering park-and-ride lots during preliminary engineering and designphases of road improvement projects. This is analogous to the current status of bikefacilities within the Department.
• developing project priority lists in which park-and-ride lots compete for funding with othertypes of improvement projects.
• assessing impact fees for lot development.• capturing federal-aid funds for facility construction.• developing outlying parking facilities in lieu of downtown parking.• reserving land for future facilities.
Criteria associated with this level of planning are based on the primary factors affecting lot usage.These primary factors include:
• Planning year residential development within the appropriate service area of the lot. • Intensity and concentration of planning year employment.• Distance between major residential areas and employment centers.• Level of service provided by the planned transportation system.
Table 3-1 presents a listing of criteria and standards appropriate for identifying sites at a systemslevel of detail. Descriptions of the criteria and standards contained in Table 3-1 are presented in thefollowing.

Florida Department of Transportation Park and Ride Manual3-3
Table 3-1. Systems-Level Facility Siting CriteriaLot Type Criteria Standards
UrbanCorridor
Future corridor level-of-serviceFuture corridor trafficService area dwelling unitsDistance from employment center(s)
Level-of-service E or worse50,000 ADT1
>2,000 dwelling units within 2 miles of lot>10 miles
HOV Corridor Traffic on feeder route to HOV facilityFeeder road system configurationLot spacing
High volumes, >35,000 ADTConfluence of feeder roads near facility5-10 mile spacing minimum
Peripheral Parking demand/supplyActivity center circulationActivity center access routeExisting parking facilities
>1.0Congested or restricted accessMajor access routeInsufficient in area
Urban Fringe Access corridor to urban areaEmployment concentrationsLocation within urban areaVicinity of shopping centers
Arterial with 4 lanes or greater>10,000 employees per employment center Vicinity of urban area boundary< • mile from commute route
Remote Orientation to urban areaUrban employmentOrientation to service areapopulationAvailable right-of-wayCommute route
Between 20 and 60 miles from employmentcenters>20,000Centrally locatedPublicly-owned right-of-way available< 1 mile from commute route
1Based on 100 space facility.
Urban Corridor Lots The four criteria illustrated in table 3-1 reflect the primary factors influencing lotdemand•congestion, demand, and travel distance. The first areas to be identified for park-and-ridefacilities are located in highly congested corridors. Identifying appropriate corridors can beperformed through reference to an urban area•s Long-Range Plan documentation or urban modeloutput. This information is maintained by the local Metropolitan Planning Organization and/orFlorida Department of Transportation District Planning Office. Corridors operating at Levels ofService E or worse in the planning year are suggested as prime corridors for park-and-ridedevelopment (see the appendix for level of service definitions).
Future year corridor traffic is an important siting criterion since it can be used to identify thosecorridors with the highest potential for park-and-ride usage. Of two corridors operating at Level ofService E, the one with the highest design year ADT will be the most attractive for park-and-ridedevelopment. The corridor traffic level of 50,000 ADT is suggested as a minimum standard basedon the following rationale:
• Corridor traffic is based on support of one 100-space park-and-ride lot operating at 75

Florida Department of Transportation Park and Ride Manual3-4
percent capacity. • 15 percent of the corridor•s 24-hour traffic occurs during the AM peak period-the period
which 100 percent of the parkers will access the lot.• One percent of the peak period, work-bound traffic will use the lot.
These first two criteria provide a means of identifying corridors likely to support park-and-ride. Thelast two criteria for siting an urban corridor lot are provided to identify locations within the corridorwhich are best for park-and-ride development. These are based on the premises that it is better tolocate a lot closer to trip origins (residential areas) and further from trip destinations (employmentcenters). The 2,000 dwelling units within five miles of a lot location standard is based on standardsdeveloped in the Tampa area and findings from the Lot Users Survey [2]. The distance fromemployment center standard is also based on results from the Lot Users Survey.
HOV Corridor Lots HOV corridor lots are a subset of the urban corridor category of lots and require specialconsideration during systems-level siting. The reason for this is that HOV facility design mayinclude a number of park-and-ride lots in the corridor in order to maximize usage of the facility.The planner must, therefore, take lot spacing and its effect on usage of individual lots into account.Parkers tend to use the first lot encountered along their travel path which can result inunder-utilization of lots which are too closely spaced.
Sites should be located adjacent to the HOV facility on an access route which carries a significantnumber of vehicles accessing the highway containing the HOV lanes. 35,000 ADT is suggested as aworking minimum amount of traffic. This minimum ADT value should increase as lot spacingdecreases.
Locating a park-and-ride facility at the confluence of a number of access routes, if at all possible, isimportant for a number of reasons. Such a location can experience a significant amount of trafficwhich can potentially utilize the facility. Further, the confluence area represents a traffic bottleneckwhich will increase the propensity to use the facility. The most highly used park-and-ride lot inFlorida, Golden Glades in Dade County, is located at the junction of five major commutinghighways which carry in excess of 370,000 vehicles per day.
Peripheral Lots Four criteria are critical to the location of activity center peripheral lots. These include futureparking supply levels, circulation within the activity center, access routes to the activity center, andlocation of existing parking facilities. The first criterion determines if, in fact, additional parking isneeded in the activity center area. If parking is adequate, further evaluation is probably notwarranted unless other objectives are driving the study such as reducing noise and emissions andvehicular travel within the activity center.
The second criterion touches on these same concerns. Auto accessibility to an activity center may

Florida Department of Transportation Park and Ride Manual3-5
be restricted, either by design or through inadequate street capacity and congestion. Such conditionscan be used to identify activity centers where peripheral parking could be effectively used.
The third and fourth criteria are used to determine feasible locations provided that additionalparking is needed to service an activity center. Access to the facility is easiest if it is adjacent tomajor access routes to the activity center. In addition, while the supply of parking for an activitycenter may be inadequate in general, some areas may already be adequately served. The fourthcriterion addresses the distribution of existing parking and suggests that new parking supply is bestlocated in areas of the activity center which are under-supplied.
Urban Fringe Lot Service area demand and concentrations of employment are factors that determine the usage of anurban fringe lot. Service area demand is reflected in the standard for the first criterion in that thenumber of lanes for an adjacent roadway can be useful in determining the demand for a parkingfacility. The criterion concerned with employment concentrations also is an important considerationfor judging the demand for a park-and-ride facility. Research has shown that an urban area needs tohave sufficient concentrations of employment to support the formation of carpools. 10,000employees per square mile is considered to be the minimum concentration to support carpoolingand is suggested as a working standard [3]. The third and fourth criteria relate to location withinthe urban area which essentially is the urban fringe. The findings from the survey work indicate thatshopping center lots are most applicable in fringe areas [1]. The urban fringe will be different basedon the planning year of the study. Near-term planning years would place fringe lots at the currenturban fringe. However, long-term studies would place fringe lots in rural areas outside the currenturban boundary.
Remote Lots The success of a remote lot is dictated by the amount of employment located at the destination endand the distance traveled [1]. A facility located 60 miles from the employment center is probablythe upper limit that can be expected to produce usage. Twenty miles is suggested as a lower limitonly for purposes of facility definition. In some urban areas, 20 miles may still be in the urban areaand a lot so located would be considered as an urban fringe or corridor lot instead of a remotefacility.
The second criteria in the table relates to demand and indicates that more people will travel fromfurther away as the urban area employment increases. Studies have shown that carpooling increaseswith employer size and employment concentration [3,4,5]. The 20,000 employment standard isbased on relating the Hosford and Bristol User Survey response with the amount of governmentalemployment located in Tallahassee [56]. This is a working minimum employment level. It isprovided as a lower limit of employment for consideration of remote lots to service an urban area.The planner should also give consideration to employment concentrations and numbers of largeemployers when siting remote lots.Approximately 50 percent of remote lot users in Florida live within three miles of the lot and about90 percent come from within 19 miles [1]. This suggests that the remote lot should be centrally

Florida Department of Transportation Park and Ride Manual3-6
located to the service area population. Most remote lots developed in Florida are located in towns.
Availability of right-of-way is another important factor in lot location. Program administrators inFlorida have made effective use of scarce construction dollars by entering into agreements withlocal governments and by developing lots on existing Department right-of-way. Public parks, cityhalls, and courthouses are potential locations for publicly provided right-of-way for park-and-ride.
The last criterion relevant to locating remote park-and-ride lots reflects the fact that lot use will begreater if located near a major commute route such as a multilane, divided highway orientedtowards an urban area. This provides the opportunity to intercept commuters along their normaltravel path. Also, such a location provides for better visibility and awareness of the facility.
PROJECT-LEVEL SITE SELECTION Site selection at the project level is concerned with identifying sites with attributes that contribute tolot usage. The research has shown that a poorly located lot will not be used. The criteria consideredduring project-level evaluations strive to maximize the capture of the latent demand forpark-and-ride in a particular area. The recommended approach for conducting project-level sitingevaluations consists of two steps. The first step is to develop an inventory of candidate sites. This iscritical since experience has shown that the first site of choice is often not capable of beingdeveloped at implementation time. The inventory can be produced through contacts with localofficials and groups, review of aerial photography, and field reconnaissance. All three of thesemethods should be used in developing the inventory of candidate sites, but at a minimum fieldinvestigations should be performed.
The second step consists of rating and ranking the candidate sites. A set of criteria is firstestablished against which each site is to be evaluated. For each site, a point score is assessed foreach evaluation criterion based on the comparison of the site•s features against the ideal conditionassociated with that criterion. All point scores are totaled with the highest scoring site being themost attractive to develop. Project-level siting evaluations are necessarily more detailed thansystems-level evaluations; however, the siting criteria are basically the same across all lot types.The most important factors which should be considered include the following:
Right-of-Way•The level of funding for park-and-ride development has forced many agenciesto enter into arrangements which result in free contribution of land. Right-of-way costs can verywell be more than the construction cost if right-of-way is to be purchased. This factor can be themost important as far as determining implementation feasibility.
Security• This factor is possibly the most critical to determining the success of a lot.Experience in Florida as well as in other areas of the U.S. have shown lots in an area consideredsafe for both the parker and his vehicle are more frequently used. Lots visible from majorarterials are considered more secure than those that are not visible.
Site Size•Size of candidate sites is an important consideration. If large enough sites are notavailable, a number of smaller lots may need to be developed in an area. Sites which are too
Florida Department of Transportation Park and Ride Manual3-7
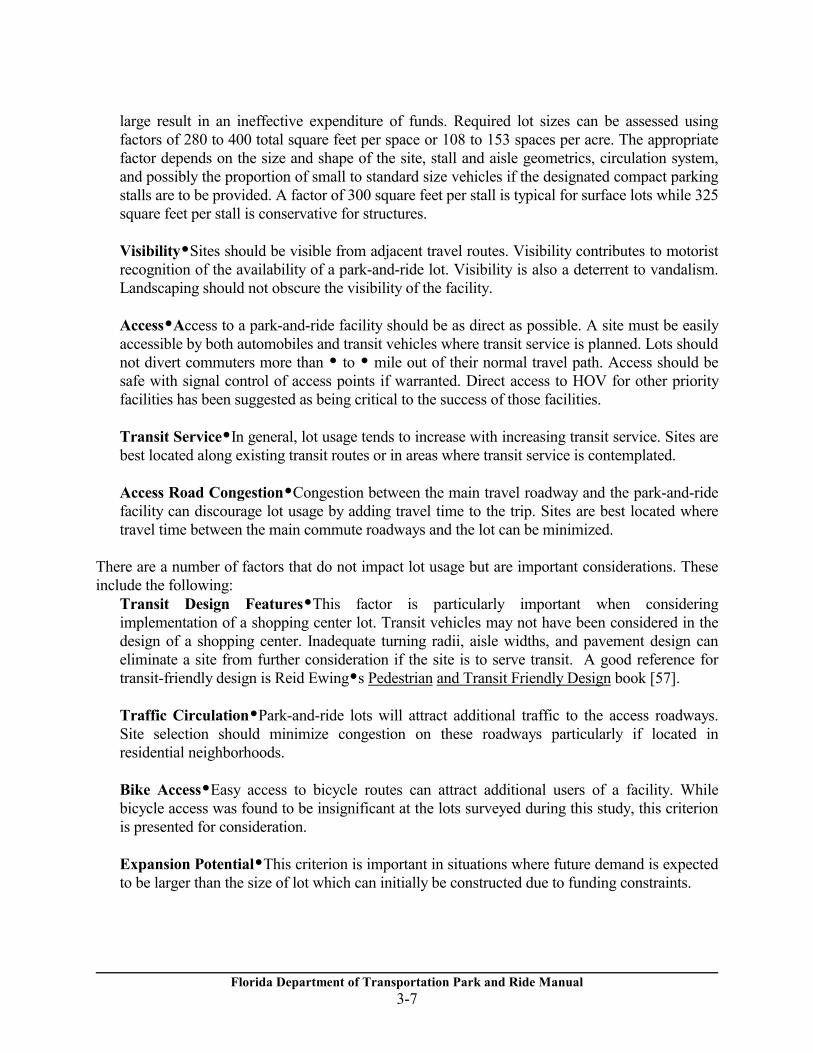
large result in an ineffective expenditure of funds. Required lot sizes can be assessed usingfactors of 280 to 400 total square feet per space or 108 to 153 spaces per acre. The appropriatefactor depends on the size and shape of the site, stall and aisle geometrics, circulation system,and possibly the proportion of small to standard size vehicles if the designated compact parkingstalls are to be provided. A factor of 300 square feet per stall is typical for surface lots while 325square feet per stall is conservative for structures.
Visibility•Sites should be visible from adjacent travel routes. Visibility contributes to motoristrecognition of the availability of a park-and-ride lot. Visibility is also a deterrent to vandalism.Landscaping should not obscure the visibility of the facility.
Access•Access to a park-and-ride facility should be as direct as possible. A site must be easilyaccessible by both automobiles and transit vehicles where transit service is planned. Lots shouldnot divert commuters more than • to • mile out of their normal travel path. Access should besafe with signal control of access points if warranted. Direct access to HOV for other priorityfacilities has been suggested as being critical to the success of those facilities.
Transit Service•In general, lot usage tends to increase with increasing transit service. Sites arebest located along existing transit routes or in areas where transit service is contemplated.
Access Road Congestion•Congestion between the main travel roadway and the park-and-ridefacility can discourage lot usage by adding travel time to the trip. Sites are best located wheretravel time between the main commute roadways and the lot can be minimized.
There are a number of factors that do not impact lot usage but are important considerations. Theseinclude the following:
Transit Design Features•This factor is particularly important when consideringimplementation of a shopping center lot. Transit vehicles may not have been considered in thedesign of a shopping center. Inadequate turning radii, aisle widths, and pavement design caneliminate a site from further consideration if the site is to serve transit. A good reference fortransit-friendly design is Reid Ewing•s Pedestrian and Transit Friendly Design book [57].
Traffic Circulation•Park-and-ride lots will attract additional traffic to the access roadways.Site selection should minimize congestion on these roadways particularly if located inresidential neighborhoods.
Bike Access•Easy access to bicycle routes can attract additional users of a facility. Whilebicycle access was found to be insignificant at the lots surveyed during this study, this criterionis presented for consideration.
Expansion Potential•This criterion is important in situations where future demand is expectedto be larger than the size of lot which can initially be constructed due to funding constraints.

Florida Department of Transportation Park and Ride Manual3-8
A procedure developed by Burns [6] and endorsed for use by AASHTO [7] is useful for rankordering a number of sites which may be in contention for development. This procedure hasapplication to project programming as well. The procedure is presented in Appendix E andconsiders both systems- and project-level factors. These factors are organized into the threefollowing categories:
1. Location criteria 2. Site considerations3. Economic consideration
The factors are evaluated for each lot under consideration and given a score based on how well theindividual sites meet the criteria. The point scores are added with the lot with the highest total scorebeing the most attractive.
Experience has shown that point scores for the various sites under consideration may be quite close[8]. Two adaptations are recommended to remedy this. First, criteria receiving the same scoreshould be eliminated. These will tend to be systems-level criteria. For example, it is likely that mostsites under consideration will receive the same rating for transit service potential, proximity tomajor trip generators, user benefits, and orientation to major bottlenecks.
The second adaptation is to assign weighting factors to each criterion. These factors shouldrepresent the relative importance of each of the criterion to the site selection. As an example, landacquisition and land cost may be more critical than site visibility in an evaluation. These criteria canbe logically assigned higher weights to reflect this importance in the final point scores. It isrecommended that a panel of local technical experts be formed to assign weighting factors anddetermine the value of including each of the various criteria into the evaluation.

Florida Department of Transportation Park and Ride Manual4-1
CHAPTER 4: DEMAND ESTIMATION AND FACILITY SIZE ESTIMATION
This chapter presents methods for estimating lot demand, and ultimately lot space requirements forurban corridor, peripheral, urban fringe, and remote park-and-ride facilities. In general, methods areprovided for two types of application for each lot type: systems-planning applications where quickestimates of demand are required and project planning applications such as required in lot design.
The appendix contains worksheets which should prove useful to the execution of the formulas andprocedures presented in this chapter. The material contained in this chapter was originally presentedin Working Paper 4: Facility Analysis [2].
ANALYSIS PHILOSOPHY Scale, complexity and project cost should govern the type of approach used for estimating sizerequirements for park-and-ride facilities. In most cases, sketch planning techniques based on localtravel and socio-economic data are preferred to sophisticated and data intensive modelingtechniques. In cases where the capital investment is relatively large, such as large facilitiesassociated with HOV lanes and rail systems, the accuracy of sketch planning techniques can besatisfactorily improved upon with more detailed and current data. As a point of reference, the costof constructing a moderate size urban park-and-ride lot can be comparable to the cost of improvingan urban intersection. The effort expended on determining the size of such a lot should likewise becomparable to the effort expended on the analysis of such an intersection.
Determining the size requirements for a park-and-ride facility consists of the sequential executionof eight steps including:
1. Computing the number of motorists that will utilize the facility. 2. Converting the number of motorists to the number of parked vehicles.3. Adjusting the number of parked vehicles to account for fluctuations in demand created by
daily, seasonal, and economic factors.4. Computing the maximum accumulation of kiss-and-ride parkers.5. Computing the number of handicapped spaces required. 6. Converting the number of spaces to an area measure. 7. Calculating additional space requirements for bus facilities.8. Developing space allowances for landscaping, setbacks, drainage,etc.
The techniques presented below are based on the assumption that the facility will be optimallylocated and implemented in the area for which size analyses are being performed. Usage will notreach expected levels if a facility is not visible, not promoted, is located in an unsafe area, or haspoor access. It is recommended that the aforementioned siting requirements be reviewed tofamiliarize oneself with the procedures used to locate a park-&-ride facility.
The following descriptions include discussions of the context in which the method can be applied,data requirements and sources, methods of synthesizing data which may not be available or too

Florida Department of Transportation Park and Ride Manual4-2
costly to compile, and appropriate adjustments which may need to be considered based on theconditions under which the lot is to be implemented.
REMOTE FACILITIES The estimation of site sizes for remote lots, as practiced in Florida, is based on observations ofparking and right-of-way availability [1]. This is an appropriate method for determining lot spacerequirements since remote lots in Florida tend to be located in areas with low population growth,experience stable utilization, and are typically less than 50 spaces in size equating to a moderatelylow cost. The recommended approach presented here is based the demand observation techniquediscussed above and is consistent with approaches currently used in the State.
Application The demand observation technique is most applicable in areas where population within the lotservice area and employment in the destination area are not expected to grow excessively. It issuggested that the further the site is from an urban area, the greater applicability can be placed onthis technique.
A concern associated with this technique is that providing a park-and-ride facility in a rural areadoes not insure its use by those observed to be parking at informal locations. Experience has shownthat informal parking continues in spite of the construction of a conveniently located park-and-ridelot [9,10]. This is supported by utilization counts which show that additional promotion andenforcement of illegal parking may be needed to fully develop the latent demand for park-and-ridelots in remote areas.
Data Requirements The data required for this method are minimal and easily obtained. These data include:
• Observations of actual informal parking. • Population data at the home end.• Employment data at the destination end of the work trip.
Methodology The methodology consists of counting existing informal parking and adjusting this value for growthand expected error. The steps of the process are presented in the following section.
STEP 1: Identify the parking activity surrounding the candidate site•This determines theexisting parking requirement and should be performed by an individual or study team familiar withthe area, commuting patterns, and the employment or activity centers to which commuters aredriving to. Definition of the area in which to perform the parking counts will be highly variablebecause of roadway configurations, orientation and location of commute routes, and populationlocation.

Florida Department of Transportation Park and Ride Manual4-3
STEP 2: Select a design year and compute an appropriate growth factor•The easiest factor to compute is based on projections of population within the service area of the lot, employment in theurban area(s) which the lot serves, or a combination of the population and employment projections.
Population forecast data is by far the easiest to obtain since the University of Florida publishesthese annually in its Florida Statistical Abstract [1]. Projections are provided in five-yearincrements for each county in Florida. Unless other conditions prevail, the population growth forthe county in which the lot is to be located can be used to base the adjustment of base-year parking.
Future year employment data can be obtained from the FSUTMS urban area data sets for the urbanarea(s) which the lot will serve, or from the State Department of Labor and Employment Security. Ifa growth factor based on employment is to be used, the forecaster should not confuse labor forcewith employment. Labor force statistics pertain to place of residence while employment pertains toplace of employment. For this method, data for employment by place of employment is appropriate.The following formula is typically used to combine population and employment growth:
Growth Factor = SQRT[Fpop * Femp] where:
Fpop = Population growth factorFemp = Employment growth factor
STEP 3: Compute the design year parking demand•This computation consists of multiplyingthe existing number of parkers observed in Step 1 by the growth factor computed in Step 2. Thisestimate of the future design year parking demand may need to be adjusted based on the experiencethat estimates at remote lots tend to be overstated. This has been hypothesized to be the result ofpeople not wishing to change their normal habits. As mentioned above, construction of a remote lotwill not insure its use by those observed to be parking at unauthorized locations in the vicinity ofthe new facility. Consideration should be given to adjusting the computed estimate of demand toaccount for this.
The downward adjustment should be based on local knowledge of public travel behavior andperceptions, potential effectiveness of increased parking enforcement, and amount of citizenrequests and complaints associated with facility provision. As a guideline for deriving anappropriate factor, the utilization of remote lots in Florida usually is no more than 30 to 40 parkedvehicles.
STEP 4: Convert total parking space requirements to an area measure•This is performedusing a factor of 300 square feet per space. This factor includes areas required for parking,circulation, and access. Right-of-way availability often constrains or dictates the size of remotefacilities so this step may be inappropriate. However, in situations where right-of-way is beingprovided at an existing facility such as a city hall or court house, the estimate should also take intoconsideration parking requirements generated by that facility.

Florida Department of Transportation Park and Ride Manual4-4
PERIPHERAL FACILITIES Peripheral park-and-ride facilities are typically designed to supplement parking deficiencies inhighly congested or access-restrained activity centers. As such, the size requirements can bedetermined from estimates of the parking deficiencies of the activity center with considerations fortransit usage and the distribution of existing parking supply.
Application The most important criterion for assessing the size requirements for a peripheral park-and-ridefacility, aside from parking deficiency, is the spatial distribution of existing parking supply. Parkingfacilities which are located too close to each other can result in underutilization even if the activitycenter as a whole is under-supplied with parking. This concern grows in importance as the size andcongestion of the activity center increases. Another consideration is the availability of shuttle transit service. Such service is highlyrecommended since it increases the area in which a new parking facility can be constructed and, inturn, increases the opportunity for finding a suitable site. If shuttle transit service is not provided,the parking facility will need to be located within comfortable walking distance of the higher areasof activity within the activity center.
Data RequirementsThe data required for computing the size of peripheral facilities include:
1. Traffic analysis zone (TAZ) map of the activity center area 2. Street map of the activity center area3. Design year employment for the activity center4. Mode share distribution for home-based work trips to the activity center if available 5. Traffic counts for major arterials accessing the activity center6. Parking inventory
The TAZ map, design year employment and population can be obtained from the urban area datasets maintained by the area•s Metropolitan Planning Organization (MPO) and/or FDOT DistrictPlanning Office. Interpolation may be necessary if the base or planning years of these data are notconsistent with those of the sizing analysis.
Traffic counts for the State facilities are available from the FDOT District Office. Counts for countyand city facilities are typically available from the county and city governments. In somecommunities, the MPO or other local agency complies and publishes traffic counts from alljurisdictions with scheduled traffic count programs.
An inventory of parking spaces may need to be performed. Such inventories may already exist andcan be obtained by contacting the local parking authority, city and county offices, and MPO. Theinventory should concentrate on spaces in public and private surface lots and structures but shouldalso include curb spaces if these are used for work trip parking.
Methodology

Florida Department of Transportation Park and Ride Manual4-5
The method presented below consists of first calculating the parking requirements for home-to-work trip parking at the activity center based on the activity center employment. The total parkingdeficiency within the activity center is then computed by comparing the parking demand with theavailable parking. Estimates of parking demand which can be captured by the new facility aremade based on assessments of the site location and distribution of existing parking supply. Finally,site size requirements are computed considering costs of construction and anticipated revenue. Thesteps for the process of computing size requirements for peripheral facilities are presented below.
STEP 1: Estimate total parking demand for the activity center • This is performed by firstidentifying the traffic analysis zones contained in the activity center. The •Total Employment•variable contained in the FSUTMS ZDATA files is then accumulated for these zones. Theresulting value represents the total base of work trips for the activity center. Total parking demandfor work trips on a person-trip basis is computed by subtracting transit usage from the total activitycenter employment. The local mode split distributions from the urban area models can be used tofactor out transit usage. If local data are not available, the mode split data shown in Table 4-1 canbe used. These data were developed from the Florida Standard Model documentation [12] andfindings from other areas [13,14,15]. Miami•s modal shares should be used for the largermetropolitan area and the Volusia shares for smaller metropolitan area. These two sets of data werecalibrated and have been used as the bases for most other urban area mode split models used inFlorida.
Table 4-1. Peripheral Park-and-Ride FacilityHome-Base Work Mode Share Data
Area Type Drive Alone Carpools Transit
Large Urban Area w/ Rail Transit1,2
0.52 0.24 0.24
Large Urban Area w/o RailTransit
1,30.66 0.17 0.17
Moderate Size Urban Area4
0.81 0.12 0.06
Small Urban Area2
0.87 0.11 0.02
1Reference 13 2Reference 14 3Reference 15 4Reference 12
The vehicle parking demand is then computed by dividing the number of work-purpose persontrips by the vehicle occupancy. Local occupancy values should be used and can be found in theurban area model documentation and mode split model setups. Table 4-2 contains vehicleoccupancy rates which can be considered for use in lieu of local data.

Florida Department of Transportation Park and Ride Manual4-6
Table 4-2. Home-Base Work Trip Auto Occupancies (persons per vehicle)
Source Rate
1986 Dade Survey1
1.201986 Broward Survey
11.16
1986 Palm Beach Survey1
1.181985 Hillsboro Survey
21.1
1985 Pinellas Survey2
1.11985 Pasco Survey
21.2
1983-84 National Survey3
1.3
1Reference 16 2Reference 17 3Reference 14
Total parking demand is finally computed by dividing the work trip parking demand by the ratio ofwork trip and total parking in the activity center. Equation 1 presented in the Step 2 descriptionbelow is used to compute the total parking demand.
Table 4-3 presents distributions of CBD parking by trip purpose. The proper work trip factor fromthis table is selected based on the population of the entire urban area in which the study is beingconducted.
Table 4-3. Distribution of CBD Parking By Trip PurposeUrban AreaPopulation
Work(%)
Shopping(%)
PersonalBusiness (%)
Other(%)
< 25,000 21 38 23 1825,000 - 50,000 21 27 35 1750,000- 100,000 20 24 31 25100,000 - 250,000 26 21 34 19250,000 - 500,000 30 19 33 18500,000- 1,000,000 47 13 25 15> 1,000,000 41 10 30 19
(Reference 18)
STEP 2: Determine parking supply deficiency•This value is computed through use of thefollowing formulas:Total Parking Demand = [(Emp * (1 - Tshare))/(Occ * Rw)] (1)Parking Deficiency = Total Demand - Supply (2)
where:Emp = Total activity center employmentTshare = Proportion of work trips using transitOcc = Auto occupancy for activity center work tripsRw = Proportion of parking used for work trip parking

Florida Department of Transportation Park and Ride Manual4-7
Supply = Existing parking supply from parking inventory
Equation 2 defines a parking deficiency if a positive value is produced. However, a negative valuedoes not necessarily indicate that there is sufficient parking throughout the entire activity center.Subareas within the activity center may be under-supplied and may require additional parking eventhough Equation 2 produces a negative result.
STEP 3: Compute the maximum number of parking vehicles the facility can capture•This computation is based on the orientation of the parking facility to important access routes to theactivity center. The roadway(s) which provide access to the area in which the parking facility is tobe located must be identified. Once this is done, the following formula can be used to perform thecalculation of the maximum number of parkers which may use the peripheral parking facility: Maximum Parking Capture = Parking Demand * (Vadj / Vall)
where:Vadj = Traffic volume on the adjacent roadways from which parkers
are expected to access the parking facility.Vall = Total traffic volume on commuting arterials and highway
accessing the activity center.
STEP 4: Determine parking demand•This is determined by comparing the supply of existingparking in the vicinity of the new facility with the maximum number of potential parkers computedin Step 3. This will require consideration of the final destinations and circulation patterns of parkerswithin the activity center, as well as the location and amount of existing parking in relation to thesedestinations and circulation patterns. Admittedly, this will be a subjective assessment so a teamapproach is recommended.
STEP 5: Determine the facility size requirement•The size requirements for the peripheralfacility being planned should consider parking spaces, circulation, access and possibly transitparking areas. The following size formulas can be used to compute site size requirements forsurface and structural facilities:
Surface Lot: Size (acres) = (300 * Spaces + 240 * Bus Bays)/43,560 Garage: Size (acres) = (325 * Spaces)/Floors + 240 * Bus Bays)/43,560
SKETCH PLANNING FOR URBAN FRINGE FACILITIES The methodology presented here is suggested for use in assessing areas for potential urban fringelot development. This approach may also be used for urban corridor facilities, however, the level ofaccuracy will decrease with increasing commuting roads in the vicinity of the lot. A much moredetailed approach applicable to site size evaluations undertaken during facility design is presentedin the following section of this chapter.
The methodology suggested for estimating facility sizes for urban fringe lots is an adaptation of theITE model [19,20]. This model assumes that parking demand is a function of the amount of traffic

Florida Department of Transportation Park and Ride Manual4-8
on roadways which are adjacent to the park-and-ride facility. It is a simple technique, requiring onlypeak period traffic volumes on those roadways considered to provide access to the park-and-ridelot. The model was run using data for a number of Florida urban fringe lots and was found toproduce reasonable results.
Application This approach is best applied in areas where there are a limited number of commuting roadways.The ITE model assumes that commuters will not divert from their normal travel routes and thatusers come only from commute routes adjacent to the park-and-ride facility. These assumptions arerealistic in areas with a very few number commute routes such as in urban fringe areas.
Data Requirements The data required for the model includes the following data elements:
1. AM peak hour traffic counts in 15-minute increments for those roadways which thelot is expected to attract parkers if available. Total peak-hour counts as well as24-hour traffic counts with appropriate K (peak hour percentage) and D (peak hourdirectional distribution) factors can be used if 15-minute counts are not available.
2. Facility type of the commute roadways adjacent to the lot.3. Area type of the adjacent roadways.
Methodology The application of the ITE technique for estimating fringe lot demand consists of developing datarequired by the following formula:
DEMAND = a * Vp + b * Vs where:
Vp = Total •design period• traffic on adjacent primary facilities;Vs = •Design period• traffic on adjacent secondary facility; anda,b = Diversion factors for traffic on the primary and secondary facilities.
The ITE technique as described in the literature is based on factoring peak period traffic. In theprocedure presented below the concept of •design period• traffic was developed and tested at anumber of Florida urban fringe lots. The •design period• is that period of time during the peakperiod which a facility experiences the highest traffic flows. In this application, the design period isequivalent to the peak hour only for facilities carrying over 50,000 ADT. The •design period•concept is believed to be appropriate based on the research which supports the theory thatpark-and-ride usage is related to congestion levels. This theory is also supported by observations ofthe time distribution of arrivals which show that most parkers arrive at a facility during a welldefined time period [11]. The •design period• concept presumes that motorists traveling duringthose times of greatest congestion will have a greater propensity to utilize park-and-ride then thosetraveling at other times.
The steps for the process of computing size requirements for fringe facilities at a sketch planninglevel of detail are presented in the following.

Florida Department of Transportation Park and Ride Manual4-9
STEP 1: Collect traffic data for affected roadways•The first step consists of identifying theprimary and secondary roadways which are expected to produce parkers. The primary roadway isconsidered to be the main commuting roadway in the vicinity of the park-and-ride lot. Secondaryroadways are commuting routes of lesser importance which are presumed to produce fewernumbers of parkers.
The ideal data consists of 15-minute peak-period traffic counts by direction for the primary andsecondary roadways. As an alternative, hourly counts and even 24-hour counts can be used if15-minute counts are not available. Assumptions concerning peak hour percentages (K factor) anddirectional distribution of traffic (D factor) will be necessary if peak hour or directional counts arenot available.
STEP 2: Determine the design period•The accuracy of the demand estimate is sensitive to the•design-period• traffic. The design period should represent that time in which there is apronounced peaking of traffic on the facility. It is not necessary that the •design period• equal theconventional peak period or peak hour. A plot of 15-minute traffic or observations of actual trafficflows in the field are useful methods for determining this time period. Table 4-4 presents designperiod values which were developed in this study for roadways carrying the indicated 24-hourtraffic volumes. These can be used in lieu of actual 15-minute counts or traffic observations.
Table 4-4. Suggested Design Periods
ADT Design Period
Above 50,000 60 minutes35,000-49,999 45 minutesbelow 35,000 30 minutes
STEP 3: Calculate the design period traffic•If 15-minute counts are available, accumulate thesecounts as required to derive the traffic flow during the design period. With hourly count data, anassumption of an even distribution of traffic during the hour can be made. If 24-hour counts areused, K and D factors will need to be assumed. Table 4-5 presents typical values for these factorsand are provided for use in situations where local data is not available. The DistractPD&E/Programming office should be consulted for the local K and D factors applicable toroadways being considered.
Table 4-5. Generalized K and D FactorsRoadway Class K D
Collectors and Local Streets 0.09 0.6Major and Minor Arterials 0.09 0.6Suburban Multi-LaneHighways
0.11 0.6
Suburban Freeways 0.09 0.6
Roadway Class K D

Florida Department of Transportation Park and Ride Manual4-10
Urban Freeways 0.09 0.6Rural Two-Lane Highways 0.11 0.6Rural Multi-Lane Highways 0.11 0.6Rural Freeways 0.11 0.6
(Reference 20)

Florida Department of Transportation Park and Ride Manual4-11
STEP 4: Estimate the Lot Size•Compute the parking demand for the facility under study usingthe following formula:
DEMAND = a * Vp + b * Vs
where:Vp = Total •design period• traffic on adjacent primary facilitiesVs = •Design period• traffic on adjacent secondary facility a = 0.03
representing a capture of three percent of the traffic on the primary facilityb = 0.01 representing a capture of one percent of the traffic on thesecondary facilities.
The lot size requirements can then be determined by multiplying the demand by an appropriateadjustment factor and dividing the result by 300 square feet per parking space for surface facilitiesand 325 square feet times the number of floors for structures. It is recommended that the adjustmentshould provide for at least a 25 percent increase over the demand using the ITE model. This wouldprovide for a planned 80 percent occupancy. The factor may also include adjustments for seasonalvariations in traffic counts. These factors can be obtained from the local District Statistics office.
Table 4-6 presents the results of executing the above procedure using actual data. The inputconsisted of the latest 24-hour counts on the primary and secondary facilities, the default values forthe design period, and K and D factors derived from Table 4-5. As can be seen, the procedureprovided reasonable estimates of demand as compared to the actual utilization counts provided bythe Department.
Table 4-6. ITE Model Test Results Using Florida Data
Location ADT K D Design PeriodDemandEstimate
ObservedUsage
Ft Myers SR 82 &Ortiz
Vp = 16,600Vs = 14,100
0.110.11
0.60.6
3030
21 24
Jacksonville SR 13&I-295
Vp = 54,100Vs = 25,100
0.090.11
0.60.6
6030
96 99
MiltonUS90 & SR 281
Vp = 22,700Vs = 7,200
0.110.11
0.60.6
3030
25 20
Broward County I-75& Pines Blvd.
Vp = 35,000 Vs =18,500
0.090.11
0.60.6
3030
34 28
Tampa SR 597 &Lakeview
Vp= 19,700 0.11 0.6 30 20 18
DETAILED METHODOLOGY FOR TRANSIT FACILITIESThe methodology presented below is an adaptation of a similar procedure used to estimate thepark-and-ride lot size requirements for the I-95 reconstruction project now underway in SoutheastFlorida [22]. In that work, considerations for HOV facilities, the Tri-County Commuter Railsystem, as well as carpooling were required. The procedure incorporates the traditional

Florida Department of Transportation Park and Ride Manual4-12
transportation planning process and is most •... applicable in any urban area where new oradditional change-of-mode fringe parking facilities are under consideration• [23].
Of all the methodologies presented in this chapter for sizing facilities, this is the most complex andrigorous. It will require upward of one-person day to execute. The technical description whichfollows includes simplifying assumptions so that it can be used in a quicker manner if required.
The procedure can use the urban area transportation data as input and as described in the FSUTMSdocumentation. It includes the following four steps:
1. Delineate origin and destination market influence areas for the park-and-ride facilityand identify the transportation analysis zones contained in each influence area.
2. Estimate total daily person trip interchanges between the origin and destinationmarket influence area.
3. Estimate the proportion of trips that will use line-haul or carpool modes.4. Estimate the proportion of daily line-haul riders that will use the change-of-mode
parking facility.
Application The site sizing procedure described below is best used in situations where transit influences need tobe addressed by the demand estimation procedure. This suggests that the approach is best applied inthe planning of significant facilities which will contain hundreds of spaces such as major urbancorridor lots, HOV parking facilities, and transit transfer terminals. Any facility study to bereviewed by a Federal reviewing agency should consider using this approach.
Data Requirements The following list of data includes all data elements which may be required to execute themethodology presented below. Some of the data used in the methodology may not be available ormay be too time-consuming to acquire. Consequently, some the data listed serve as alternatives tothe preferred data elements. The reader should consult the individual step descriptions to determineexactly which data will be required for her particular application and circumstances. The total list ofdata includes the following:
• Street map encompassing the service and final destination areas. • Urban area traffic analysis zone map.• Dwelling unit and employment data by traffic analysis zone. These data are included
in the FSUTMS data sets for the urban area. These data are needed if a trip table isnot available.
• Urban area trip generation rates. Required if trip table data area not available.• Origin-destination person-trip tables generated by the urban area FSUTMS-based
model for the design year of the facility.• Urban area model mode split model coefficients for the modes under consideration.

Florida Department of Transportation Park and Ride Manual4-13
Methodology The methodology includes seven steps which relate to defining the lot service and trip destinationareas, developing the total interchange of trips between these two areas, computing the share oftravel which will be attracted to the park-and-ride facility, and converting this travel share to lot sizerequirements. These steps are described in the following paragraphs. Alternative data developmentprocedures are also included to provide the user with methods for formulating data which may notbe available. Appendix H provides worksheets to simplify and organize the computations.
The most complex set of calculations in the procedure presented below are related to thecomputation of mode shares performed in Steps 3 through 6. These computations are included inthe procedure in order to estimate the impacts on park-and-ride facility size produced by provisionof various types of transit services, parking costs, and congestion levels. The procedure is asimplified approach which was developed in lieu of one using the Micro-FSUTMS procedures. It isrecommended that the development of such procedures be pursued in a future work effort.
Figure 4-1 presents a schematic of the process for deriving parking requirements at a park-and-ridefacility located in an urban transit corridor. The methodology follows the nested logic mode splitmodel formulation. The first step of the process is to determine the primary modal splits for persontrips between the origin and destination market influence areas. The primary modes differ by size ofurban area. Typically, larger urban areas will have line-haul transit services available while smallerareas will not. Consequently, modeling in larger urban areas requires consideration of a largernumber of primary modes than that done in smaller areas.
The second level in the mode split calculations consists of splitting the primary modal shares intosubmodes. As an example, the primary mode split model determines the proportion of trips whichtravel by the drive alone auto mode. The secondary mode split model then determines theproportion of drive alone person trips which will utilize a park and ride lot and those which willdrive directly to the final destination.
The logit formulation of the mode split model incorporated into the procedure is as follows:DUm = a*IVTTm + b*OVTTm + c*PKm + d*OCm + Biasm Pm = EXP(-DUm) / [Σmode EXP(-DUm)where:
DUm = Disutility of mode mIVTTm = In-vehicle travel time for mode m0VTTm= 0ut-of-vehicle travel time for mode mPKm = Parking cost for modeOCm = 0ther out-of-pocket costs such as fares or auto operating costa,b,c,d = Variable coefficientsBiasm = Constant for mode mPm = Probability of using mode mEXP = Exponential functionmodes = All modes considered at the level of mode split analysis being

Florida Department of Transportation Park and Ride Manual4-14
performed. Up to seven modes will be useful in larger urban areas whileas few as four will be considered in smaller areas.
The followingstep descriptionsinclude alternate
datadevelopment
procedures toprovide the userwith methods forformulating datawhich may notbe available.
STEP 1A:Delineate theorigin market
influencearea•Theliterature
contains anextensive amountof research
reportsconcerning thedelineation ofpark-and-ride lotmarket influenceareas [19]. The
mathematicalformulations which have been developed to describe the shape of the area boundary includeparabolas, hyperbolas, circles, semi-circles and ellipses. Most of these formulations are based onhome-to-lot travel distance which ignores the influence of traffic congestion on service area andmarket size. The following concepts should influence the analysis conducted to delineate the originmarket influence area for the site under consideration:
A.Common sense should prevail. Both the results of this study and the research findingsindicate that parkers travel a limited distance (or time) to access a park-and-ride facility.The tendency will be to define market areas which are too large.
B.Land development patterns, configuration of the access street network, and the level ofmobility on that network are the most significant influences on the service area size andshape.
C.Motorists will not travel significant distances out of their normal commuting paths to take
Figure 4: Nested Logit Model

Florida Department of Transportation Park and Ride Manual4-15
advantage of a park-and-ride facility. D.Research has shown that upward of 90 percent of park-and-ride lot users in an urban
environment live within five miles of the facility. E. Park-and-ride facilities in close proximity to each other will tend to redistribute parkers and
produce only a marginal increase in facility usage.
The recommended procedure for delineating the market influence area begins with computing themaximum distance from the lot to the outside limits of the service area using the following formula:
Maximum Access Distance = (1/60) * Time * Speedavg * (1/CFAC)where:
Time = Maximum driving time to lotSpeed = Average home-to-lot operating speedCFAC = Circuitry factor
Approximately 90 percent of the parkers at urban fringe and corridor lots come from within fivemiles which equates to about 12 minutes [11]. This is consistent with findings from other areas[19].
The assumption of the average travel speed for accessing the urban fringe and corridorpark-and-ride lots should consider the development type and roadway level of service. A value of25 mph is typically used for trips traveling primarily on arterials. A higher value of 35 mph or moremay be appropriate if the lot access trip is made predominantly on limited-access highways. Alesser value would be assumed if access trips are primarily made on local streets.
The circuitry factor is used to convert the length of trip over the road to equivalent airline distance.Typical factors range from 1.1 to 1.3; however, the choice of this factor should be based on reviewof the access road network and the population distribution in the potential service area.
The perimeter of the estimated core market area should be plotted on a base map using themaximum access distance computed above. The shape and size of this area should be influenced bypractical knowledge of local travel patterns, orientation of the access street network, geography, andexisting or proposed park-and-ride facilities which can be considered to affect demand for the lotbeing planned.
Caution should be exercised if two or more park-and-ride lots are in close proximity andshare a common market influence area. In such a case, adjustments to the area boundary arerequired. A characteristic of lot users which should be considered is that the first lot encounteredwill be used. Further, backtracking will not occur if another facility can be accessed in the directionof travel to the destination.
STEP 1B: Delineate the destination market influence area•Typically, the destination marketinfluence area will comprise areas of significant employment concentrations such as central and

Florida Department of Transportation Park and Ride Manual4-16
outlying business districts (OBD), large employers, and major office parks. As a rule-of-thumb,concentrations of 10,000 employees per square mile or within a traffic analysis zone can beconsidered as a lower limit for considering a zone to be in the destination influence area. Theemployment and zone area data contained in the FSUTMS ZDATA files, in conjunction with theassociated traffic analysis zone map can be used to identify the zones to which park-and-riders aredestined. The special generator data should also be reviewed to identify other zones which havelarge employment concentrations.
A quick way of identifying TAZ•s which should be included in the destination market influencearea is to sort the FSUTMS ZDATA file containing the employment data on the •TOTALEMPLOYMENT• and •ZONE• fields. This can be performed using dBASE, DOS SORT, Lotus,or similar microcomputer-based programs containing a sort function; or TSOSORT on themainframe. Records for the zones considered to be likely destination zones can be extracted,resorted on the •ZONE• field, and printed to generate a simple list of the zones to be considered.
Without these data, local knowledge of employment location patterns, travel patterns from theorigin market influence area, and the commuting road network must be relied on to identify thedestination areas.
The destination market influence areas identified should be delineated on the TAZ map as well as astreet map of the urban area for reference purposes.
STEP 2: Develop the total daily trip interchange volumes between the origin and destinationinfluence areas•Three methods are presented here for developing these interchange volumes. Theeasiest method requires staff to be knowledgeable in the •nonstandard• application of theFSUTMS micro software or UTPS. The first step is to develop the trip interchange volumesbetween the origin and destination market areas from the PTRIPS production/attraction filegenerated by either the micro- or mainframe-based urban area models. Using the micro-based,menu-driven standard approach to executing the FSUTMS program, it is recommended that anadditional step be added to the standard DISTRIB.ALL procedure file. This step should execute theREPORT MATRIX program to generate a trip table listing of the home-base work table (Table 1)in the PTRIPS file for those origin zones contained in the origin market influence area. UsingUTPS on the FDOT mainframe, a UMATRIX procedure would be used to generate a similarlisting. The results should be divided by two since the listings representproduction/attraction-formatted trip interchanges.
It will usually suffice to perform the above procedures only on the home-base work trip; however,there may be cases where other trip purposes, such as home-base shopping trips, will significantlycontribute to lot demand. In these situations, trip interchange listings should also be extracted fromthe trip tables associated with these trip purposes.This procedure should be executed on the PTRIPS table representative of the design year. However,the base year PTRIPS table could be used with an expansion factor applied which represents thegrowth in the origin and destination areas. The expansion factor can be developed to project the

Florida Department of Transportation Park and Ride Manual4-17
design year trip interchanges based on the following formula:
Florida Department of Transportation Park and Ride Manual4-18
fod = 1 + SQRT(fo * fd)where:
fod = Composite growth factor for trip interchanges between the origin and destinationmarket areas
fo = Growth factor for the origin market influence areafd = Growth factor for the destination market influence area
It is appropriate to base the origin and destination growth factors in the above equation onpopulation and employment growth between the base and design years.
An alternative method to develop the number of trip interchanges between the delineated origin anddestination influence areas can be used in lieu of available trip tables is based on the followingformula:
TRIPod = DUo * HBW * (Empd/Emptot)/2 *(Lavg/Dp)
where: TRIPod = Trip interchanges between the origin and destination market influence areasDuo = Dwelling units in the origin market influence area with one or more autosHBW = Home-base work trip rate
Empd = Destination area employment Emptot = Total urban area employment Lavg = Average home-base work trip length Dp = Average distance between the origin and destination influence areas
The formula defines the number of trips between the origin and destination market influence areasas a function of:
• the total number of home-base work trips generated in the origin influence area, • the destination area•s share of the total urban area employment,• the difference between the average trip length from the origin area to the destination
area and the average home-base trip length for the entire urban area.
The number of one and two-plus dwelling units contained in the origin market influence area iscontained in the ZDATA for the urban area models. Local home-base work trip rates can be used todevelop an average HBW trip factor for one and two-plus auto owning households. Average triplengths for the urban area can be found in the urban area model distribution output. Table 4-7presents factors which may be applied if trip rate and length data are not available.

Florida Department of Transportation Park and Ride Manual4-19
Table 4-7. Florida Urban Area Home-Base Trip Data
Urban Area Person Trips PerHousehold
Average Trip Length(miles)
Gainesville 1.301
Jacksonville 1.721 9.63
Lee County 1.141
Palm Beach 1.461
Tampa Bay 1.211 9.02
Tallahassee 1.801 6.83
Volusia 1.141
Pasco 1.082 13.02
Pinellas 1.512 6.12
Dade 1.552 8.03
Broward 1.591 6.03
Palm Beach 1.571 7.13
1Reference 242Reference 173Reference 25
STEP 3: Estimate the input variables to the mode split model•The input data for the variousmode under consideration must be developed. These data relate to in-vehicle travel time,out-of-vehicle travel time, parking cost, and other out of pocket costs. If line-haul transit is beingconsidered, data for up to ten modes will need to be developed. This is consistent with themulti-path transit assignment method described in the FSUTMS documentation [12]. These modesinclude:
• Drive alone auto • 2-person carpools• 3+ person carpools• Local bus Line-haul transit with walk or local bus access• Line-haul transit with drive alone auto access• Line-haul transit with shared ride auto access• Carpool formed at the park-and-ride facility with drive alone access• Carpool formed at the park-and-ride facility with 2-person shared ride auto access
Carpool formed at the park-and-ride facility with 3+ person shared ride autoaccess
If line-haul transit is not to be considered, data for up to seven modes will need to be generated.This is consistent with the single-path transit assignment method also included in the FSUTMSdocumentation [12]. These modes include the following:
• Drive alone auto • 2-person carpools• 3+ person carpools• Local bus• Carpool formed at the park-and-ride facility with drive alone access• Carpool formed at the park-and-ride facility with 2-person shared ride auto access

Florida Department of Transportation Park and Ride Manual4-20
• Carpool formed at the park-and-ride facility with 3+ person shared ride auto access Table 4-8 describes the data requirements for the mode split model and includes data definitions,sources of the data, and typical default values which may apply. Appendix H contains worksheetsuseful for tabulating the input data to the analysis process presented here.
Table 4-8. Mode Split Input Variables Variable Definition Source Default
Origin Terminal Time Time required to leave trip originzone in minutes
Zonal terminal time in urban modeldata
1 minute
Walking Time Average walking time from origin totransit stop in minutes
Estimate based on local landdevelopment and bus stop spacing
5 minutes
Waiting Time Average wait time for bus arrival inminutes
1/2 of published headway, 10minute maximum
10 minutes
Transfer Time Average time required to transferbetween routes in minutes
1/2 of published headway 5 minutes
Lot Access Time Time between main line route andpark-and-ride facility includingparking time in minutes
Based on the distance betweenmainline route and park-and-ride lotand congestion
Not Applicable
DestinationEgress Time
Walking time from last transitvehicle to final destination inminutes
Estimate based on transit stopspacing
5 minutes
DestinationTerminal Time
Time travel between last vehicleused and final destination inminutes
Zonal terminal time in urban modeldata
5 minutes
Drive Time Time spent in auto from origin tothe final destination for automodes, or from origin to the park-and-ride lots excluding lot accesstime in minutes
Urban area model skims or speedand delay survey data
Estimate based on tripdistance and average travelspeed assumptions rangingfrom 25 to 45 mph based onnature of travel path
Line-haul Run Time In-vehicle time in line-haul transitvehicle in minutes
Published or proposed schedule Not Applicable
Local Bus Run Time In-vehicle time on local bus inminutes
Published or proposed busschedule
Not Applicable
Tolls Road and bridge tolls divided bynumber of occupants in vehicle indollars
Published toll schedules divided bynumber of vehicle occupants
Not Applicable
Auto Operating Cost Perceived costs associated withoperating an auto in dollars
Per mile cost of fuel, oil,maintenance, and insurance timetrip length
19 cents/mile
Parking Costs Parking charges at park-and-ridefacility and at the destinationdivided by number of occupants inthe vehicle in dollars
Existing or proposed daily parkingcharge divided by number ofvehicle occupants
Not Applicable
Bus/Line-haul Fare One-way transit boarding chargefor local bus and line-haul modes indollars
Published or proposed fares Not Applicable
Transfer Fare Fare to transfer between transitroutes or services in dollars
Published transfer charge Not Applicable
In developing the variable values for the non-park-and-ride auto modes( 1, 2, and 3), assume thatthe travel path is from home directly to the work destination. Data for the local bus mode shouldalso be from home directly to the work destination. The data may not need to be generated for thismode if its share of trips is expected to be insignificant.

Florida Department of Transportation Park and Ride Manual4-21
Line-haul transit data should include the park-and-ride facility if line-haul service is provided. Themodel assumes that competing line-haul routes do not exist. If this is not the case, data should begenerated for the travel path with the shortest time. A secondary mode split will then need to beexecuted for the various line-haul modes to split them between the various lines.
If HOV facilities are a consideration in the analysis, the in-vehicle travel time (IVTT) values for thecarpool and line-haul modes should include these facilities in the travel path from the origin todestination ends of the morning commute trip. Study of direct access ramps to the HOV facility isperformed through use of the out-of-vehicle travel time (OVTT) value. Time to travel back andforth between the mainline commute roadway and the parking facility is added to the OVTT value.Research conducted at various HOV facilities around the country shows that HOV lane usageincreases by 50 to 100 percent as a result of direct access ramps [26]. Execution of the model withtest data produced results consistent with the following findings.
STEP 4: Compute disutilities for modes under consideration•The following formula is used tocompute the disutilities associated with the various modes being considered in the analysis:
DUm = 0.015*IVTTm + 0.14*0VTTm + 0.021*PKm + 0.005*OCm + Bias.
where: DUm = Disutility of mode m IVTTm = In-vehicle travel time for mode m 0VTTm = 0ut-of-vehicle travel time for mode m PKm = Parking cost for mode m 0Cm = 0ther out-of-pocket costs such as fares or auto operating cost Biasm = Constant for mode m
The input for the calculations come from the data generated and entered on the worksheetscontained in Appendix H. The bias coefficients to be used in the above equation are found in Tables4-9 and 4-10.

Florida Department of Transportation Park and Ride Manual4-22
4-9. Bias Coefficients for Primary-Level Mode Split Model
Mode Bias
Studies in large Urban Areas1. Drive Alone Auto 0.002. Two-Occupant Auto 1.903. Three-Occupant Auto 2.604. Local Bus w/ Walk Access 0.455. Line-haul w/ Walk or Local Bus Access 1.706. Line-haul w/ Drive Alone Access 3.407. Line-haul w/ Share-Ride Access 4.25
Studies in Small Urban Areas1. Drive Alone Auto 0.002. Two-Occupant Auto 2.183. Three-Occupant Auto 3.344. Transit 1.31
Table 4-10. Bias Coefficients for Secondary-Level Mode Split Model
Mode Bias
Studies in Large Urban Areas1A. Drive Alone Auto Accessing Park-and-Ride Facility 3.402A. 2-Occupant Auto Accessing Park-and-Ride Facility 4.253A. 3+ Occupant Auto Accessing Park-and-Ride Facility 4.25
Studies in Small Urban Areas1A. Carpools from Drive Alone Auto 3.342A. Carpools from Two-Occupant Auto 5.523A. Carpools from Three-Occupant Auto 6.68
STEP 5: Compute primary-level modal shares•The disutilities computed in Step 4 are input tothe following formula to calculate the primary-level modal shares of person trips between the originand destination market influence areas of the park-and-ride facility under analysis:
Pm = EXP(-DUm)/[I=1, modes EXP(-DUi)] where:
Pm = Probability of using mode mDum = Disutility of mode mEXP = Exponential function modes = All modes considered as primary modes. Up to
seven primary-level modes will be used in larger urban areas while as few asfour primary-level modes will be considered in smaller areas.
The disutilities used in the above formula will differ based on the existence of line-haul modes. In

Florida Department of Transportation Park and Ride Manual4-23
large urban areas in Florida, line-haul modes will typically be included in the analysis. In this case,the disutilities for modes 1, 2, 3, 4, 5, 6, and 7 presented in Table 4-9 will be used in this step. Insituations where line-haul modes may not be considered, such as in small urban areas, thedisutilities for modes 1, 2, 3, and 4 will be input to the above formula.
STEP 6: Compute secondary-level modal shares•In this step, the modal shares for the primaryauto modes calculated in Step 5 are split to determine the number of persons who will use thepark-and-ride facility. The input to this step includes the Pm values calculated for modes 1, 2, and3 in Step 5 and the DUm values calculated for modes 1A, 2A, and 3A in Step 4. These values areinput to the following formula:
PmA = Pm * EXP(-DUmA)/(EXP(-DUm) + EXP(-DUmA)
where: PmA = Probability of using park-and-ride facility for mode m where m is either drive
alone auto, 2-person auto, or 3+ person auto modes.Pm = Probability of using mode m computed from the Step 5 primary level analysis.
Mode m is either drive alone auto, 2-person auto, or 3+ person auto modesDUmA = Disutility of using park-and-ride facility given mode m is used where mode m is
either drive alone auto, 2-person auto, or 3+ person auto modes. Computed inStep 4.
DUm = Disutility of using auto mode m where mode m is either drive alone auto, 2-person auto, or 3+ person auto modes. Computed in Step 4.
STEP 7: Determine parking space requirements•The input to this step includes the:The number of trips between the origin and destination market influenceareas(TRIPSod)from Step 2.
Mode shares for the auto-accessed line-haul modes (P6 and P7) from Step 5. Mode shares for the three auto modes accessing the park-and-ride facility (P1A,P2A,and P3A)
from Step 6.
These values are input to the following formula to compute the number of spaces required forall-day parking:
Spaces = TRIPSod * (P1A + P2A/2 + P3A/3.5 + P6 + P7/2.5)
where:Spaces0 = Unadjusted estimate of long-term parking space requirements.
TRIPSod = Number of person trips between the origin and destination marketinfluence areas calculated in Step 2.
P1A = Probability of driving alone to access the park-and-ride facility toform a carpool

Florida Department of Transportation Park and Ride Manual4-24
P2A = Probability of accessing the park-and-ride facility in a 2-personcarpool to form a carpool
P3A = Probability of accessing the park-and-ride facility in a 3+ personcarpool to form a carpool
P6 = Probability of driving alone to access line-haul transit service at thepark-and-ride facility
P7 = Probability of driving in a carpool to access line-haul transit service atthe park-and-ride facility
The values of 2, 3.5 and 2.5 used as denominators in the above equation represent default autooccupancy factors for 2-person, 3+ person, and 2+ person carpools, respectively. Local data can besubstituted for these values.
Two additional adjustments need to be made to the above value to account for kiss-and-ride accessand for planned utilization in the design year. Approximately 10 to 15 percent of park-and-ridefacility patrons access the facility via kiss-and-ride [1]. Use of the 10 percent factor isrecommended for two reasons. First, all kiss-and-ride vehicles will not be accessing the facility atthe same time. Second, overflow parking can use the long-term parking spaces if the spacerequirement value is under estimated.
In addition, the Spaces0 value represents the total projected number of automobiles accessing thepark-and-ride facility. This value should be upwardly adjusted to produce an estimate which resultsin less than 100 percent utilization in the design year. The design policies of the jurisdictioninvolved as well as other considerations such as land availability will dictate the proper adjustmentto be made. A 25 percent upward adjustment will produce a space requirement estimaterepresenting a planned utilization of 80 percent in the design year.
The estimate of long-term parking requirements can be further adjusted to account for fuel shortagecontingencies. As a point of reference, planners in the Tampa area use up to a 100 percent upwardadjustment. It must be stressed that this 100 percent factor accounts for planned under-utilizationand energy contingencies, and growth in usage over the base year conditions which are used tocompute the space requirements,
The following formula can be used to compute the total parking space requirements at the facilitybeing analyzed:
Spaces = Long-term spaces + Kiss-and-ride spaces = Spaces0 * 0.90 * FAC + Spaces0 * 0.10
where: Spaces0 = Unadjusted estimate of long-term parking space requirements.
FAC = Adjustment factor to provide for less than 100 percent utilization The final computation relates to converting the number of parking spaces required as computedabove to the site size requirement. A conversion factor of 300 square feet per space is

Florida Department of Transportation Park and Ride Manual4-25
recommended for surface lots and 325 square feet per space for parking structures.
These factors account for parking space, circulation, and access area requirements.

Florida Department of Transportation Park and Ride Manual5-1
CHAPTER 5: IMPACT ASSESSMENTS
This chapter presents procedures for evaluating the impacts associated with individualpark-and-ride facilities. These procedures relate to assessing the effects of park-and-ride lot usageon vehicle miles of travel, vehicle emissions, fuel consumption, and travel time. The procedurespresented below are based on accepted theoretical concepts. They were developed to be easily andquickly executed by using readily available data. Default values and rules-of-thumb are providedfor use when normally used data inputs or local coefficients are not available. The family ofprocedures are organized by functional lot type and have been reduced to worksheet form.Worksheets for the procedures can be found in the Appendix.
A number of basic travel characteristics drive the estimation of impacts produced by construction ofpark-and-ride facilities. These include the before and after average trip lengths, operating speeds,and vehicle occupancies. How these attributes change depend on the distributions of lot users whopark, get dropped off, and use transit.
A park-and-ride facility contributes to fuel conservation, reduction in vehicle emissions, andreduced travel times through two mechanisms. First, the direct reduction of removing vehicles fromthe roadway network. This produces reductions in both vehicle trips and vehicle miles of travel(VMT). Second, there are indirect impacts of reduced congestion levels produced by removingvehicles from the roadways connecting park-and-ride facilities with destination areas. The effects ofthese secondary impacts may not be appreciable in all cases and are likely not long lasting. Forexample, assuming a fully-occupied fringe lot with 60 spaces (typical size for Florida) and notransit service, only 60 vehicles will be removed from commuting roadways. This reduction invehicles will have at most an insignificant impact on other users of the commuting roadways.Consequently, it is reasonable to disregard these secondary impacts for fringe and remote lots sincethese tend to be small and are generally located in areas where traffic flows are not at saturationlevels. The basic approach to estimating the impacts of implementing park-and-ride consists of anumber of primary steps including:
A. Generation of the basic input data required by the impact estimation approaches includingnumbers of person trips by mode, average trip distances traveled on arterials and on limitedaccess facilities, average operating speeds on the arterials and freeways assumed to beaffected before and after facility construction, and before and after vehicle occupancies.
C. Computation of reduced vehicle miles of travel (VMT).C. Computation of fuel consumption changes.C. Computation of vehicle emissions impacts.C. Computation of changes in travel time.
A number of approaches are provided for deriving the input data including simplifying assumptionsbased on observed data which can be used to develop systems-level impact estimates. Theseassumptions are dependent on facility, the urban area size, and the conditions which typically exist.
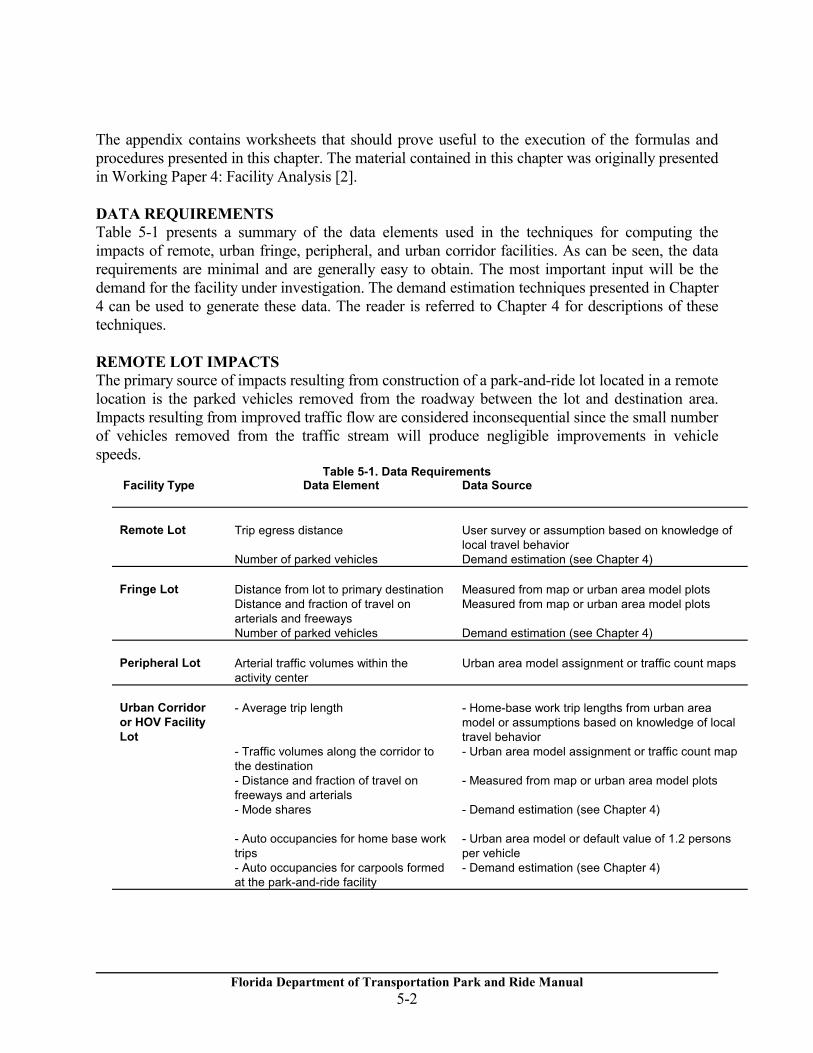
Florida Department of Transportation Park and Ride Manual5-2
The appendix contains worksheets that should prove useful to the execution of the formulas andprocedures presented in this chapter. The material contained in this chapter was originally presentedin Working Paper 4: Facility Analysis [2].
DATA REQUIREMENTSTable 5-1 presents a summary of the data elements used in the techniques for computing theimpacts of remote, urban fringe, peripheral, and urban corridor facilities. As can be seen, the datarequirements are minimal and are generally easy to obtain. The most important input will be thedemand for the facility under investigation. The demand estimation techniques presented in Chapter4 can be used to generate these data. The reader is referred to Chapter 4 for descriptions of thesetechniques.
REMOTE LOT IMPACTSThe primary source of impacts resulting from construction of a park-and-ride lot located in a remotelocation is the parked vehicles removed from the roadway between the lot and destination area.Impacts resulting from improved traffic flow are considered inconsequential since the small numberof vehicles removed from the traffic stream will produce negligible improvements in vehiclespeeds.
Table 5-1. Data Requirements Facility Type Data Element Data Source
Remote Lot Trip egress distance User survey or assumption based on knowledge oflocal travel behavior
Number of parked vehicles Demand estimation (see Chapter 4)
Fringe Lot Distance from lot to primary destination Measured from map or urban area model plotsDistance and fraction of travel onarterials and freeways
Measured from map or urban area model plots
Number of parked vehicles Demand estimation (see Chapter 4)
Peripheral Lot Arterial traffic volumes within theactivity center
Urban area model assignment or traffic count maps
Urban Corridoror HOV FacilityLot
- Average trip length - Home-base work trip lengths from urban areamodel or assumptions based on knowledge of localtravel behavior
- Traffic volumes along the corridor tothe destination
- Urban area model assignment or traffic count map
- Distance and fraction of travel onfreeways and arterials
- Measured from map or urban area model plots
- Mode shares - Demand estimation (see Chapter 4)
- Auto occupancies for home base worktrips
- Urban area model or default value of 1.2 personsper vehicle
- Auto occupancies for carpools formedat the park-and-ride facility
- Demand estimation (see Chapter 4)

Florida Department of Transportation Park and Ride Manual5-3
The technique presented below consists of three steps to compute reductions in vehicle miles oftravel (VMT), fuel consumption, and vehicle emissions. Impacts in travel time are consideredinsignificant, so the procedure does not include computations for this variable.
STEP 1: Calculate annual reduction in vehicle miles of travel (VMT) -- The impacts on fuelconsumption and vehicle emissions are related directly to the reduction in VMT produced fromshifting to higher occupancy vehicles. VMT reduction is developed by simply multiplying theestimated reduction in vehicle trips by the average distance from the lot to the destination area. Thisis then converted to an annual basis. The following formula produces a positive value for VMTreduction resulting from parked vehicles at a remote facility;
VMT (annual) = Lavg * Parked * 233 * 2where:
VMT = Annual VMT reduction.Lavg = Average trip length from lot to destination.Parked = Vehicles parked at the remote lot.233 * 2 = Daily to annual conversion factor for remote lots times 2 trips per
vehicle removed.
STEP 2: Calculate Annual Fuel Savings•The computation of fuel savings consists of multiplyingthe VMT savings computed in Step 1 by an average per mile fuel consumption rate for the analysisyear under study. Table 5-2 should be referenced for these consumption rates. The followingformula computes a positive value for annual gallons of fuel saved:
Fuel Savings (annual gallons) = VMT * Crate where:
VMT = Annual VMT reduction computed in Step 1Crate = Average fuel consumption rate in gallons per mile for the study year under
investigation. Refer to Table 5-2.
STEP 3: Calculate Annual Emission Reduction•The computation of the reduction in vehicleemissions consists of multiplying the VMT savings computed in Step 1 by fleet average emissionrates for carbon monoxide, hydrocarbons, and nitrogen oxides appropriate for the analysis yearunder study. The pollutant emission rates are found in Table 5-2.

Florida Department of Transportation Park and Ride Manual5-4
Table 5-2. Average Fuel Consumption and Emission RatesFor Remote Lots
Fuel ConsumptionVehicle
Emissions
(grams/mile)
PlanningYear
Gallons Per Mile Miles Per Gallon CO HC NOX
1985 0.0476 21.0 35.5 4.5 3.41990 0.0380 26.3 22.6 2.9 2.61995 0.0364 27.5 16.4 2.1 2.32000 0.0362 27.6 13.9 1.4 2.12005 0.0362 27.6 13.9 1.4 2.12010 0.0362 27.6 13.9 1.4 2.1
(Reference 27,28,29)
The following formulas produce positive values for reductions in annual tons of pollutants:Reduction in CO (tons/year) = (VMT * Eco) / 907,184Reduction in HC (tons/year) = (VMT * Enox) / 907,184Reduction in NOX (tons/year) = (VMT * Ehc) / 907,184
where:VMT = Annual VMT reduction from Step 1.Eco = Fleet average carbon monoxide emission rate in grams per vehicle mile.
Refer to Table 5-2.Enox = Fleet average nitrous oxides emission rate in grams per vehicle mile.
Refer to Table 5-2.Ehc = Fleet average hydrocarbons emission rate in grams per vehicle mile.
Refer to Table 5-2.907,184 = Converts grams to U.S. tons.
URBAN FRINGE AND URBAN CORRIDOR LOT IMPACTSThe following procedure can be used to estimate impacts for both urban fringe and urban corridorlots. The differences between these two lot types relate to location in the urban area and provisionof transit service. Urban corridor lots tend to serve a major destination area while urban fringe lotsmay service more than one destination area. Urban corridor lots are typically served by transit andoften express bus service. Fringe may or may not be served by transit and most likely are not servedby express buses.
The following technique accounts for savings resulting from improvement in traffic flows betweenthe park-and-ride facility and the destination market influence areas. This may not be appropriatefor moderate size facilities with low estimated usage. Computation of these secondary impactsshould be performed only for conditions in which park-and-ride is expected to have a significant

Florida Department of Transportation Park and Ride Manual5-5
impact on traffic flows. In addition, fuel and emissions impacts related to transit are considered.Calculations related to transit service should not be performed if such service is not provided at theparking facility.
STEP 1: Identify Major travel path(s) from the park-and-ride facility to major destinationarea(s) -- Significant paths of highway travel from the park-and-ride facility to major destination ordestinations must be identified. The following recommendations should be considered forsimplifying this process:C. More than one path should be selected only in cases where there is more than one major
destination area served by the parking facility.C. Only one path should be identified for each major destination area.C. Only major trunk facilities should be included in the travel paths.
Along with the selection of travel paths, the proportion of carpool vehicle trips using each pathshould be determined. This information can be developed through the demand estimationprocedures presented in Chapter 5, assumptions based on knowledge of local travel behavior, usersurveys, or proration based on employment at the destinations.
STEP 2: Segmentation of travel paths and computation of segment data•Since traffic floweffects are considered in this procedure, the travel paths from the park-and-ride facility to eachdestination area being considered should be divided into segments of similar flow characteristics.The determining factors are level of service and facility type. The segments should be categorizedinto one of four categories: C. Congested freeway
C. Uncongested freewayC. Congested arterialC. Uncongested arterial.
The threshold between congested and uncongested conditions is considered to be the boundarybetween Levels of Service D and E. Segments operating at levels worse than Level of Service Dshould be defined as congested while segments operating better than Level of Service E should bedefined as uncongested. Level of service definitions can be found in the Appendix. The followingguidelines are provided to assist in identifying congested and uncongested roadways segments:
C. A congested freeway segment operates under interrupted flow (stop and go traffic) or ataverage operating speeds under 40 mph.
C. An uncongested freeway segment operates under uninterrupted flow at average operatingspeeds over 40 mph.
C. A congested arterial segment operates at average speeds under 40 percent of the postedspeed and is characterized by long queues at signalized intersections with numerousintersections in the segment experiencing cycle failures (failure to clear queues in onecycle).
C. An uncongested arterial segment operates at average speeds over 40 percent of the posted

Florida Department of Transportation Park and Ride Manual5-6
speed and is characterized by intersection queues which generally clear within one signalcycle.
C. An arterial under progressive signal control and experiencing a limited number of cyclefailures can be considered uncongested.
STEP 3: Develop before and after average operating speeds for congested roadwaysegments•The computations of fuel consumption, vehicle emissions, and travel time are dependenton the before and after operating speeds of effected roadways. A simplifying assumption is that thechanges in traffic volumes produced by a park-and-ride facility only effect congested roadways.This is a reasonable assumption for two reasons. First, the practical change in roadway volumeswhich can be expected is not large when considered on a per lane basis. To illustrate, 200 vehiclesremoved in one direction from a four-lane roadway is 100 vehicles per lane. This change in trafficwould increase operating speeds by only 3 mph on arterials or freeways operating underuncongested conditions. The second reason is that the small decreases in volumes on congestedroadways can produce significant changes in operating speeds. Removing 100 vehicles per lane ona congested roadway can produce an increase in speeds of almost 8 mph.Two approaches are presented for deriving before and after operating speeds for congested roadwaysegments identified in Step 2. The first is the more detailed procedure. Speeds are determined by:
1. Subdividing congested segments by number of lanes2. Calculating the average per lane volume for each congested roadway subsegment in the
before and after condition.3. Deriving the resultant operating speeds from Table 5-3.
A more simplistic approach is to use generic operating speeds for congested segments and genericoperating speed changes for decreases in volumes. These generic values are presented in Table 5-4.
STEP 4: Estimate annual VMT reduction by major travel path•The annual reduction in VMTcan be derived in a manner similar to the approach presented for remote facilities. It is applied toeach highway travel path identified in Step 1. The proportion of travel by path derived in Step 1, theaverage distance of each path, and the estimate of parking demand projected for the study’splanning year are input to the following equation which produces positive values for reduced VMT:
VMTi (annual) = Li * D * Pi * 2 * Afacwhere:
VMTi = Annual reduction in VMT for highway travel path i.Li = Average distance for highway travel path i.D = Number of parked vehicles projected for the planning year under analysis
(see Chapter 5).Pi = Proportion of total parked vehicles traveling via highway travel path i.2 = Two trips/day per parked vehicle.Afac = Factor to convert daily VMT reduction to an annual basis. Equals 213 for
fringe lots and 233 for urban corridor lots.

Florida Department of Transportation Park and Ride Manual5-7
Table 5-3. Average Roadway Operating Speeds BasedPer Lane Volumes
Arterial SegmentsVolume Per Lane Freeway Segments(mph) (% of Posted speed)
Major Arterial Minor Arterial700 68%800 58%900 63% 49%
1000 55 55% 17%1100 54 46%1200 52 17%1300 511400 501500 491600 481700 461800 431900 352000 30
Note: Assumed design speed of 65 mph and per lane capacity of 2,000 vehicles per hour for freeways, per lanecapacity of 1200 vehicles per hour for major arterials, and per lane capacity of 1000 vehicles per hour for minor
arterials. (References 21,30)
Table 5-4. Operating Speeds for Total Volume Reduction(miles per hour)
TotalReduced Freeway Lanes Major Arterial Lanes Minor Arteria
lLanes
Volume 2 3 4 5 2 3 4 1 2 3< 50 30 30 30 30 8 8 8 6 6 650 36 36 36 35 17 17 17 13 13 13
100 37 37 36 36 17 17 17 17 13 13150 40 37 37 36 21 17 17 19 17 13200 40 40 37 37 21 21 17 20 17 17250 43 40 40 37 22 21 21 22 19 17300 43 40 40 40 22 21 21 24 19 17350 45 43 40 25 22 21 21 20 19400 45 43 40 40 25 22 21 20 19450 46 43 43 40 27 22 22 22 19500 46 45 43 40 27 25 22 22 20600 47 45 43 43 28 25 22 24 20700 48 46 45 43 27 25 22800 48 47 45 45 28 25 24900 49 47 46 45 28 27 24
1000 49 48 46 45 271200 50 48 47 46 281400 51 49 48 471600 52 50 48 481800 53 50 49 48

Florida Department of Transportation Park and Ride Manual5-8
2000 54 51 49 48
(References 21,30)

Florida Department of Transportation Park and Ride Manual5-9
STEP 5: Estimate change in fuel consumption•Three components must be accounted for tocompute the fuel consumption impacts of a park-and-ride facility•fuel savings realized by theautomobiles removed from the road, fuel changes realized by automobiles on the roadway whichoperate at a higher speeds due to removed vehicles, and transit fuel consumption if service isprovided to the park-and-ride facility. The first component will be a decrease in consumption sincevehicles parked means fuel saved. The second component will most likely be an increase inconsumption since fuel efficiency decreases with increasing speed over 30 mph. The secondcomponent of fuel consumption change can be ignored if the reduction in traffic produced by thepark-and-ride facility can be assumed to have negligible impact on operating speeds. The thirdcomponent will be an increase in fuel consumption provided the analysis is considering new orincreased transit service to the facility.
The following formula computes the change in fuel consumption produced by all sources. Apositive value represents a savings in fuel consumption between the future and existing conditionswhile a negative value represents a net increase in consumption:
Change in Fuel Consumption(gallons/year) = 2 * Afac * ΣI=1,segments [Li * {(Crateib TVOLi)(Crateia * (TVOLi - RVOLi))-
(BUSrateia * BVOLi)}] where:
Li = Length of segment i in milesCrateib = Auto fuel consumption rate for segmenting the before condition. From Table
5-5 for freeway segments and 5-6 for arterial segments.Crateia = Auto fuel consumption rate for segment i in the after condition. From Table
5-5 for freeway segments and 5-6 for arterial segments.BUSrateia = Bus fuel consumption rate for segment i in the after condition. From Table
5-7.RVOLi = Vehicles removed from segment 1 as a result of the park-and-ride facilityTVOLi = Total traffic for segment i in before conditionBVOLi = Transit volume for segment i.2 = Two trips per day per vehicleAfac = Factor to convert daily consumption to an annual basis. Equals 213 for
fringe lots and 233 for urban corridor lots.
Table 5-5. Auto Fuel Consumption Rate for Freeways(grams/mile)
Speed (MPH) 1990 1995-2010
30 0.029 0 02735 0.029 0 02740 0.029 0.02845 0.030 0 02950 0.032 0 03155 0.033 0.03260 0.036 0.034

Florida Department of Transportation Park and Ride Manual5-10
(References 26,28)

Florida Department of Transportation Park and Ride Manual5-11
Table 5-6. Auto Fuel Consumption Rate for Arterials(grams/mile)
Speed (MPH) 1990 1995-2010
10 0.059 0.05715 0.046 0.04420 0.045 0.04325 0.046 0.04430 0.046 0.04435 0.046 0.04440 0.047 0.045
(References 26,28)
Table 5-7. Average Fuel Consumption and Emission RatesFor Transit Vehicles
Fuel Consumption Vehicle Emissions (grams/mile)Speed(mph) Gallons Per
MileMiles Per
GallonCO HC NOX
5 0.446 2.2 25.5 7.0 31.010 0.251 4.0 22.5 5.6 24.215 0.193 5.2 21.3 4.5 22.420 0.167 6.0 18.8 3.6 22.625 0.156 6.4 14.7 3.1 24.030 0.154 6.5 11.4 2.7 25.435 0.095 10.5 9.1 2.5 26.640 0.108 9.3 7.5 2.2 27.545 0.123 8.1 6.3 2.1 28.2
(References 31,32)
STEP 6. Estimate emission reductions•Table 5-8 and Table 5-9 list emission rates for carbonmonoxide, nitrogen oxide and hydrocarbons at various speeds for automobiles and transit vehicles.These rates are used in the following formula to compute the annual reduction in emissionsexpressed in tons. Positive values represent net decreases in emissions between the future and baseconditions while negative values represent increases in emissions:
CO (annual tons)=2 * Afac * (1/907,184) * Σi=1,segments [Li * {(COrateib * TVOLi) - (COrateia * (TVOLi- RVOLi)) -(BCOrateia * BVOLi)}]
HC (annual tons)=2 * Afac * (1/907,184) * Σi=1,segments [Li * {(Hcrateib * TVOLi) - (HCrateia * (TVOLi - RVOLi))-(BHCrateia * BVOLi)}]
NOX (annual tons) =2 * Afac * (1/907,184) * Σi=1,segments [Li * {(NOXrateib * TVOLi ) - (NOXrateia * (TVOLi -RVOLi)) - (BNOXrateia * BVOLi)}]
where:CO = Annual reduction in carbon monoxide in tons.HC = Annual reduction in hydrocarbons in tons.

Florida Department of Transportation Park and Ride Manual5-12
NOX = Annual reduction in nitrogen oxides in tons.Li = Lot-to-destination distance for path I.COrateib = Automobile CO emission rate for segment i in before condition. From
Table 5-8 or 5-9.COrateia = Automobile CO emission rate for segment i in after condition. From
Table 5-8 or 5-9.BCOrateia = Automobile CO emission rate for segment i in after condition. From Table
5-7.Hcrateib = Automobile HC emission rate for segment i in before condition. From
Table 5-8 or 5-9.HCrateia = Automobile HC emission rate for segment i in after condition. From
Table 5-8 or 5-9.BHCrateia = Transit HC emission rate for segment i in after condition. From Table
5-7.NOXrateib = Automobile NOX emission rate for segment i in before condition. From
Table 5-8 or 5-9.NOXrateia = Automobile NOX emission rate for segment i in before condition. From
Table 5-8 or 5-9.BNOXrateia = Transit NOX emission rate for segment i in before condition. From
Table 5-7.RVOLi = Vehicles removed from segment i as a result of the park-and-ride
facility.TVOLi = Total traffic for segment i in before condition.BVOLi = Transit volume for segment i. 2 = Two trips per day per vehicle.Afac = Factor to convert daily consumption to an annual basis. Equals 213 for
fringe lots and 233 for urban corridor lots.907,184 = Converts grams to U.S. tons.
Table 5-8. 1990 Auto Emission Rates (grams/mile)
Speed(MPH)
CarbonMonoxide
Hydro-Carbons
Oxides ofNitrogen
10 20.81 1.46 1.1915 14.47 1.04 1.2320 11.86 0.83 1.3825 9.82 0.68 1.5430 8.02 0.55 1.6735 6.67 0.46 1.7740 5.88 0.40 1.8445 5.62 0.37 1.8950 5.60 0.36 1.9755 5.10 0.32 2.1460 3.27 0.23 2.43
(Source: Reference 26,29)

Florida Department of Transportation Park and Ride Manual5-13
Table 5-9 1995-2010 Auto Emission Rates (grams/mile)
Speed(MPH)
CarbonMonoxide
Hydro-Carbons
Oxides ofNitrogen
10 12.98 1.10 1.0515 9.02 0.77 1.2020 7.52 0.61 1.3525 6.26 0.50 1.5030 5.11 0.41 1.6335 4.24 0.34 1.7340 3.75 0.29 1.8045 3.62 0.27 1.8550 3.64 0.26 1.9355 3.30 0.23 2.0960 2.01 0.16 2.38
(Source: Reference 26,29)
STEP 7: Calculate travel time savings•Travel time impacts relate to changes in vehicle-hours oftravel (VHT) and person-hours of travel (PHT). The initial computation in this procedure consistsof calculating the travel times for all travel paths from the park-and-ride facility for car-poolersformed at that facility, highway users not utilizing the park-and-ride facility, and transit vehicles.The following formulas derive these data:
Hbtti = Σi=1,segments [Li/Sbi]Hatti = Σi=1,segments [Li/Sai]Cbtti = Σi=1,segments [Li/Sbi]Catti = Σi=1,segments [Li/Sai] + Etime/60Tatti = Σi=1,segments [Li/Sai] + Etime/60
where:Hbtt1 = Highway travel time for path i in before condition.Hatti = Highway travel time for path i in after condition.Cbtti = Car-pooler travel time for path i in before condition.Catti = Car-pooler travel time for path i in after condition. Tatti = Transit travel time for path i in after condition.Li = Lot-to-destination distance for path i.Sbi = Average operating speed for path i in before condition.Sai = Average operating speed for path i in after conditionEtime = Excess travel time (waiting, transfer) associated with transit usage in minutes.

Florida Department of Transportation Park and Ride Manual5-14
The following formulas compute changes in VHT and PHT. Positive values represent reductions inVHT and PHT between the future and base conditions while negative values represent netincreases:
Reduction in VHT (annual) = 2 * Afac * Σi=1,paths[TVOLi * Hbtti - (TVOLi - RVOLi) *Hatti -(Occhbw/(Occa -Occhbw)+l) * CVOL * Catti)]
Reduction in PHT (annual) = 2 * Afac * Σi=1,paths[TVOLi * Hbtti * Occhbw - (TVOLi -RVOLi) * Hatti *Occhbw -(Occhbw/(Occa - Occhbw)+l) *CVOL * Catti) * Occa - Passi * Tbtti]
where:TVOLi = Total volume for path i in before condition.RVOLi = Volume reduced from path i.CVOLi = Vehicles associated with carpools formed at the park-and-ride facility for
path i.CVOLi= RVOL for cases where transit service is not provided.Passi = Transit users for path i.OCChbw = Auto occupancy in before condition. Occupancy for home-base work trip is
typically used. Default value 1.2 persons per auto.OCCa = Auto occupancy in after condition for egressing carpool vehicles. Default
value of 3.2 persons per auto can be used [1].Hbtti = Highway travel time for path i in before condition.Hatti = Highway travel time for path i in after condition.Catti = Car-pooler travel time for path l in after condition.Tatti = Transit travel time for path i in after condition.2 = Two trips/day per parked vehicleAfac = Factor to convert daily VMT reduction to an annual basis. Equals 213 for
fringe lots and 233 for urban corridor lots.
PERIPHERAL LOT IMPACTS
The characteristics of a parking facility located peripherally to an activity center suggests that theassociated impacts are related to the reduction in vehicles traveling within the activity center. Sincethe facility is located so close to the destination of users of the facility, changes in fuelconsumption, vehicle emissions, and travel time are considered to be negligible for the origin toparking facility trip segment.
Reductions in VMT may or may not be realized with construction of a peripheral parking facility.This will depend on the proximity of destinations within the activity center, the facility’s size, andamount of additional travel required to access the facility. If a peripheral parking facility is locatedsuch that it intercepts users along their normal travel paths, then VMT will be reduced as willcongestion, fuel consumption, and emissions. However, a peripheral facility can also produce extratravel by users who route around the activity center to access the facility. This can result in higherfuel consumption and emission rates. Such an occurrence has been observed in the Fort Worth area

Florida Department of Transportation Park and Ride Manual5-15
where over one half of users of a peripheral facility drove extra miles to use it [26]. This suggeststhat the analysis for peripheral parking facilities must be performed on a case-by-case basis.
The procedure presented below is based on an approach developed by the Federal HighwayAdministration [33]. The technique is applied for each roadway assumed to experience a change involumes. Computations are performed to determine the reduction or increase in VMT, changes inoperating speeds before and after the volume change, and the resultant impacts on fuel consumptionand vehicle emissions. The procedure assumes that changes in travel time are insignificant.
STEP 1: Estimate change in VMT for each roadway to be analyzed•The following formulaproduces positive values for reductions in VMT associated with a peripheral parking facility:
VMTi (annual) = (Vb - Va) * Li * 2 * 226
where:VMTs = Annual VMT change for roadway IVb = Before peak period traffic volume on roadway IVa = After peak period traffic volume on roadway ILi = Length of roadway2*226 = Converts one-way daily VMT to two-way annual VMT
STEP 2: Estimate reduction in fuel consumption•This calculation consists of multiplying thechange in VMT computed in Step 1 by the fuel consumption rate for the roadway under evaluation.This rate is based on the assumed average operating speed for the roadway. The following formulaproduces positive values for reductions in fuel consumption between the future and existingconditions:Change in fuel consumption (gallons/year) = VMTi * (K1 + K2 / Si)
Si < 35 mphwhere:
VMTi = Change in annual VMT. Value is positive for VMT reduction and is negative forVMT increase.
K1 = Fuel consumption rate based on overcoming rolling resistance. Values found in Table5-10.
K2 = Fuel consumption based on the idle fuel flow rate. Values found in Table 5-10.Si = Average speed in miles per hour over the distance of the roadway i under
evaluation.
STEP 3: Estimate change in annual vehicle emissions•This computation is based on multiplyingthe VMT change computed in Step 1 by the appropriate emission rates based on the study year andthe average operating speed. Tables 5-11 to 5-19 contain the vehicle emission rates for variousambient air temperatures and planning years. The following formula computes the annual change invehicle emissions:
Reduction in CO (tons/year) = (VMTs * Eco) /907,184

Florida Department of Transportation Park and Ride Manual5-16
Reduction in HC (tons/year) = (VMTs * Enox) /907,184Reduction in NOX (tons/year) = (VMTs * Ehc) /907,184
where:
VMTs = Annual VMT saved from Step 1.Eco = Average fleet carbon monoxide emission rate in grams per vehicle mile.
From Table 5-11, 5-12, or 5-13.Enox = Average fleet nitrous oxide emission rate in grams per vehicle mile.
From Table 5-14, 5-15, or 5-16.Ehc = Average fleet hydrocarbon emission rate in grams per vehicle mile.
From Table 5-17, 5-18, or 5-19.907,184 = Converts grams to U.S. tons.
Table 5-10. Fuel Consumption Parameters YEAR K1 K2
1989 0.0209 0.4301990 0.0205 0.4211991 0.0201 0.4151992 0.0199 0.4101993 0.0198 0.407
1994-1997 0.0196 0.4041998-2010 0.0195 0.403
(Reference 33)
Table 5-11. Carbon Monoxide Emission Rates Year 1990 (Grams/mile)
AverageSpeed
Temperature(Fahrenheit)
(MPH) 40 60 805 91 82 76
10 49 44 4115 34 31 2820 27 24 2325 23 20 1930 19 17 1635 16 15 14
(Reference 33)
Table 5-12. Carbon Monoxide Emission RatesYear 1995 (Grams/mile)
AverageSpeed
Temperature(Fahrenheit)
(MPH) 40 60 80

Florida Department of Transportation Park and Ride Manual5-17
5 70 63 5910 38 34 3215 26 24 2220 21 19 1725 17 16 1430 15 13 1235 13 11 11
(Reference 33)
Table 5-13. Carbon Monoxide Emission Rates Year 2000-2010 (Grams/mile)
AverageSpeed
Temperature(Fahrenheit)
(MPH) 40 60 80
5 56 50 4710 30 27 2515 21 19 1820 17 15 1425 14 12 1230 12 11 1035 10 9 8
(Reference 33)
Table 5-14. Hydrocarbons Emission RatesYear 1990 (Grams/mile)
AverageSpeed
Temperature(Fahrenheit)
(MPH) 40 60 80
5 7 7 610 4 4 415 3 3 320 3 2 225 2 2 230 2 2 235 2 2 2
(Reference 33)
Table 5-15. Hydrocarbons Emission RatesYear 1995 (Grams/mile)
AverageSpeed
Temperature(Fahrenheit)
(MPH) 40 60 80
5 5 5 510 3 3 3

Florida Department of Transportation Park and Ride Manual5-18
15 2 2 220 2 2 225 2 1 130 1 1 135 1 1 1
(Reference 33)
Table 5-16. Hydrocarbons Emission RatesYear 2000-2010 (Grams/mile)
AverageSpeed
Temperature(Fahrenheit)
(MPH) 40 60 80
5 5 5 410 3 3 315 2 2 220 2 2 225 2 1 130 1 1 135 1 1 1
(Reference 33)
Table 5-17 Nitrogen Oxide Emission RatesYear 1990 (Grams/mile)
AverageSpeed
Temperature(Fahrenheit)
(MPH) 40 60 80
5 2 2 210 2 2 215 2 2 220 2 2 225 2 2 230 2 2 235 2 2 2
(Reference 33)

Florida Department of Transportation Park and Ride Manual5-19
Table 5-18. Nitrogen Oxide Emission RatesYear 1995 (Grams/mile)
AverageSpeed
Temperature(Fahrenheit)
(MPH) 40 60 80
5 2 2 210 1 1 115 1 1 120 1 1 125 2 2 230 2 2 235 2 2 2
(Reference 33)
Table 5-19. Nitrogen Oxide Emission RatesYear 2000-2010 (Grams/mile)
AverageSpeed
Temperature(Fahrenheit)
(MPH) 40 60 80
5 2 2 210 1 1 115 1 1 120 1 1 125 2 2 230 2 2 235 2 2 2
(Reference 33)

Florida Department of Transportation Park and Ride Manual5-20

Florida Department of Transportation Park and Ride Manual6-1
CHAPTER 6: ECONOMIC ANALYSIS AND PROJECT JUSTIFICATION
This chapter presents a recommended approach to performing economic analyses of park-and-rideimprovements. Included is:
C. a recommended justification report outlineC. a description of relevant measures of cost, benefit, and effectiveness applicable to the
justification of park-and-ride improvementsC. a suggested framework for performing economic analyses related to park-and-ride
The material presented in this chapter is an abridgment of similar material contained in WorkingPaper 4: Facility Analysis [2]. That document should be referenced for supporting research findingsthat are not contained here in this chapter.The types of improvements for which special justification might be required include:
C. Construction of new parking facilities integrated with high-occupancy vehicle facilities C. Retrofitting direC. Construction of new parking facilities as adjuncts to existing fixed transit systemsC. Construction of new parking facilities as adjuncts serving express bus servicesC. Construction of new individual parking facilitiesC. Expansion of existing facilities on adjacent right-of-wayC. Expansion of capacity through construction of a parking structureC. Expansion of capacity through modification of the existing designC. Expansion of capacity through joint-development optionsC. Provision of transit services
Justification of HOV-related parking facilities is a special problem. The costs of such facilities willlikely include high-priced right-of-way as well as construction and operation. Without the existenceof the HOV facility, such construction might not be performed since lower cost alternatives mightbe available. However, the HOV imposes special constraints on the parking facility which addsignificantly to the cost. These include proximity to the trunk facility, access improvements, andpossibly direct access ramps. However, the parking facility should be considered as a part of alarger system since it has been found that parking facilities are required to produce acceptable usagelevels of HOV facilities [34].
Parking facilities related to fixed-guideway transit have proven to be a critical feature to addingpatrons to the transit system. Facilities in the northeast corridor are renowned for their highutilization rates. The Dadeland parking facilities in Miami have historically been utilized at over 95percent of capacity [35]. The problem of justification relates to showing a need for additionalparking, the benefit to transit ridership, add the positive impact to highway operations.
Park-and-ride facilities are often used in developing express transit services. The justificationprocess for this type of improvement must consider costs associated with the anticipated transitservice as well as those related to the parking facility.
Construction of isolated parking facilities results in higher vehicle occupancies on the roadway and

Florida Department of Transportation Park and Ride Manual6-2
resultant decreases in VMT and associated user costs. Justification must focus on these types ofbenefits. The analysis must consider alternatives to construction on a new site including expansionon adjacent right-of-way, garage construction on the existing site, and joint development options.
Providing transit service is an improvement related to increasing lot utilization. Justification mustconsider operations and maintenance (O&M) costs associated with operating transit vehicles.
THE JUSTIFICATION REPORTThe Justification report for proposed park-and-ride construction projects and related improvementsmust contain sufficient explanation and data to show the need and purpose of the improvementunder consideration. It should consider alternatives to the proposed improvement with associatedcomparisons of benefit and cost impacts; the relation of the improvement to relevant plans,programs and projects within the impact area; the impacts of the improvements on localtransportation systems; and the needs addressed by the improvement.
Applying the findings from the above referenced documents leads to the following recommendedreport outline:I. Introduction•Summarizes the purpose, need, benefits, and costs of the project and includes
a summary of the organization of the report.II. Background•Presents the context of the project in relation to the impact area, the existing
and future transportation systems, the measures (if any) which have been implemented in the past in the attempt to solve the stated problem which the improvement is to address, and the response of users to similar facilities in the area.
III. Planned Improvements•Descriptions of related transportation improvements and conditionswhich will have a bearing on the analysis including other commuter parking facilities in thearea, highway expansion, and transit services.
IV. Locational Analysis•Pertains to construction on new right-of-way only. Presents the possiblelocational options for the facility including comparisons of costs and qualitativedescriptions of the merits of each.
V. Alternatives•Describes alternatives to the proposed improvement considered in thefollowing presentation of the analysis. Construction alternates should include alternativesites, and construction methods including surface lots and garages.
VI. Demand Analysis•Presents forecasts of utilization in the construction or implementation yearand the planning year. Procedures developed in Chapter 4 are relevant to the content of thissection of the report.
VII. Benefit/Cost Assessment•Describes the benefits and costs for each alternative underevaluation which are measurable in monetary units.
VIII. Cost Effectiveness Assessment•Describes the impacts of each alternative in terms whichcan not be quantified in monetary units. Cost-effectiveness measures are presented in termsof amount of improvement per dollar of cost.
IX. Conclusions•Summarizes the need and benefits of the proposed improvement.
BENEFIT, COST AND EFFECTIVENESS MEASURES

Florida Department of Transportation Park and Ride Manual6-3
This section presents a review of the measures relevant to the analysis of park-and-rideimprovements. Table 6-1 presents a listing of cost, benefit, and effectiveness measures whichshould be considered for inclusion in the justification analysis for park-and-ride improvements.These were developed from the aforementioned documents with consideration for the specialfeatures of park-and-ride.

Florida Department of Transportation Park and Ride Manual6-4
Table 6-1. Benefit, Cost and Effectiveness MeasuresRelevant to Park-And-Ride Improvements
Improvement Benefit Measure Cost Measure Effectiveness Measure
HOV-Related Facility Travel timeVehicle operationAccidents
EngineeringConstructionROWMaintenance
Auto occupancy Peak-hour highwayLOSVMT reductionAir qualityFuel savings
Fixed-Guideway Facility Vehicle operationAccidentsTravel timeTransit fares
EngineeringConstructionROWMaintenance
Transit readershipPeak-hour highway LOSVMT reductionAir qualityFuel savings
Express Bus Facility Vehicle operationAccidentsTravel timeTransit fares
EngineeringConstructionMaintenanceTransit O&Transit capital
Transit ridershipPeak-hour highway LOSVMT reductionAir qualityFuel savings
Carpool-only Facility Vehicle operationAccidentTravel time
EngineeringConstructionROWMaintenance
Auto occupancyVMT reductionPeak-hours LOSAir qualityFuel savings
Expansion on Adjacent ROW Vehicle operationAccidentsTravel time
EngineeringConstructionROWMaintenance
Auto occupancyVMT reductionPeak-hour LOSAir qualityFuel savings
Structure onExisting ROW
Vehicle operationAccidentsTravel time
EngineeringConstructionROWMaintenance
Auto occupancyVMT reductionPeak-hour LOSAir qualityFuel savings
Modification of ExistingDesign
Vehicle operationAccidentsTravel time
EngineeringConstructionROWMaintenance
Auto occupancyVMT reductionPeak-hour LOSAir qualityFuel savings
Joint-Development Vehicle operationAccidentsTravel time
EngineeringConstructionAnnual leaseAdministration
Auto occupancyVMT reductionPeak-hour LOSAir qualityFuel savings
Provision of TransitServices
Vehicle operationAccidentsTravel time
Transit capitalTransit O&M
Transit ridershipVMT reductionsPeak-hour LOSAir qualityFuel savings
Note: ROW = Right-of-way O&M = Operation and maintenance

Florida Department of Transportation Park and Ride Manual6-5
HOV = High-occupancy vehicle LOS = Level of serviceVT = Vehicle-miles of travel
Florida Department of Transportation Park and Ride Manual6-6
Benefit MeasuresBenefit measures are measurable items expressed in monetary units. These measures are used in thebenefit side of the benefit/cost calculation. Benefit measures are typically expressed in terms ofsavings in user costs.
Travel Time: This measure consists of the change in user travel time resulting from theimplementation of the park-and-ride improvement. Computation of travel timeimpacts are presented in Chapter 5. Travel time is converted to a dollar valuethrough the use of a value-of-time factor. The value of travel time varies by trippurpose. The value of time for the work trip purpose is appropriate for the analysisof park-and-ride improvements.
Research has shown that a reasonable assumption of the value of commuter traveltime ranges from 20 to 40 percent of a traveler’s income [361. Assuming an averageincome of $30,000 per year, the value of commute time ranges from $3 to $6 perhour. A value of $5 per hour is typically used in economic analyses oftransportation.
VehicleOperation: Vehicle operation costs are related to running speed, speed changes, roadway gradient,
and degree of curvature of tangent roadways. Parking charges are also included inthis cost category in this discussion. Estimating all of these various costs is onlyrecommended for economic studies of HOV facilities. Procedures are contained inthe AASHTO Benefit/Cost Manual [37]. Use of per-mile unit operating cost factorsare more appropriate for analyzing other park-and-ride improvements. This valuecan range from 15 to 25 cents per vehicle mile. A value of 20 cents per vehicle mileis appropriate.
Accidents: The cost of accidents relates to the loss of income associated with fatality and injuryaccidents, and the value of property damage related to property-damage-onlyaccidents. Accident rates by type can be calculated on a VMT basis and equated tocost using recognized values of economic loss for fatalities, injuries, and propertydamage. 1987 values of economic loss used by the Department included $2,000 perproperty damage-only accident, $9,300 per injury, and $220,000 per fatality.
Transit fares: Transit fares are associated with using transit and should be added to the user cost oftravel. Fare schedules for the local transit property which is anticipated to provideservice should be referenced. Preliminary user cost estimates can be based on $1 perperson trip using express bus and urban rail service, $2 per person trip usingcommuter rail service, and $0.50 to $0.75 per person trip using local bus.
Project CostsProject costs relate to the costs associated with designing, constructing, maintaining and operatingthe transportation improvements under investigation. For carpool-only park-and-ride facilities,

Florida Department of Transportation Park and Ride Manual6-7
project costs are associated with the facility. Project costs associated with economic analyses of aHOV facility include costs of constructing and operating the HOV facility as well as thepark-and-ride lot. In addition, transit operating and maintenance (O&M) costs are included whentransit services are to be considered.
Engineering: Engineering costs relate to preliminary engineering, final design and constructionplans and specifications preparation. Associated costs relate to developing designconcepts, preliminary layouts, land and aerial surveys, right-of-way appraisals, soilsinvestigations if required, environmental assessments, final design plans, andpreparation of construction drawings, specifications, and bid documents. Estimatesof this cost category should be developed as a historical percentage of the totaldesign cost. These costs will tend to be a higher percentage for HOV facilities andparking garages while they will be zero for improvements consisting solely ofadding transit service. The development of these costs is best derived as a historicalpercentage of construction costs. This percentage is based on complexity andmagnitude of the construction and typically ranges from 10 to 20 percent.
Right-of-Way: Right-of-way costs include purchase price; legal, title, and other fees related to
transfer of ownership; administrative costs for negotiation, condemnation, orsettlement; business, family, and utility relocation; and demolition. Another costwhich can be of considerable magnitude relates to environmental cleanup ofhazardous waste. This later cost may be large enough to eliminate a site or projectfrom further consideration. Property values are highly dependent on geography,location within the community, and type of land use. Costs estimates forright-of-way should be obtained from the District Right-of-Way Office.
Construction: Construction costs include supervision, staking, inspection, and testing; facilityelements including earthwork, pavement, drainage, embankments, structures, andramps; landscaping and erosion control; maintenance of traffic; and traffic controldevices. The cost basis includes labor, materials, equipment, and contractoroverhead and profit margin. The best source for these costs is the preliminary orfinal engineer’s estimate. Alternately, unit construction costs can be developed fromhistorical experience.
The following typical order-of-magnitude unit construction costs are can be used forpreliminary cost estimates:(•) Garage costs: $6,000 per parking space [35](•) Surface lot costs: $2,000 per parking space [8](•) HOV lanes: $1,000,000 per lane mile [53](•) Direct-access ramps: $10,000,000 per pair of ramps [34]

Florida Department of Transportation Park and Ride Manual6-8
Maintenance: Maintenance costs include routine and periodic upkeep including patching, striping,painting, drainage clean-out, and landscaping; replacement of pavement, trafficcontrol devices, fences, guardrails, etc. Costs related to maintaining park-and-ridefacilities are approximately $60 per space per year.
Operations: Operation costs include utility charges, safety patrols, operation of signals, garbageremoval, administration of lease agreements, and traffic surveillance. These costsmay be lumped together with maintenance in line with the traditional approach ofestimating incremental O&M costs. However, operations costs may be sufficientlylarge to justify estimating them separately.
TransitCapital: These costs relate to investments in rolling stock. They may also include costs
associated with benches and shelters at the park-and-ride facility although theseshould be treated as part of the construction costs above.
Transit Operations and Maintenance(O&M): The transit O&M costs vary with the level, type, and speed of bus operation. They
are typically related to the vehicle-mileage generated by the system. They entail:(•) The cost of driver’s wages and fringe benefits.(•) The costs of vehicle operation, including tires, gasoline, and lubricants.(•) The cost of insurance, managerial and administrative labor.(•) The costs of vehicle rental or depreciation.(•) The transit system’s contribution to roadway maintenance and operating
cost.AnnualLease: State and typical local legislation require the State or local agency to enter into a
lease agreement to operate a joint-use facility. These costs are typicallyinsignificant. A typical planning estimate is $12 per space per year but varies fromcase to case.
Effectiveness MeasuresEffectiveness measures relate to benefits for which dollar values cannot be assigned. Typicallythese relate to quality of life attributes such as level of transportation service and environmentalimpacts. These measures are presented in the justification report to provide an accurate assessmentof the full impacts of the alternative improvements.
VMT Reduction: Reduction of vehicle miles of travel (VMT) is an expected benefit of park-and-ride improvements including HOV facilities, parking lots and garages,and transit service provision. It is normally expressed on an annual basis and inunits of one million vehicle miles. Reduced VMT is often a stated objective ofthe transportation plan in a community. VMT reduction is associated withpositive benefits including reduced congestion levels, fuel consumption, and

Florida Department of Transportation Park and Ride Manual6-9
vehicle emissions. It is used as a basis to develop estimates of these benefits.Auto Occupancy: Increasing average vehicle occupancies is often a transportation system
objective for local areas and is expressed in terms of persons per automobile.Typical occupancies for commute trips range from 1.1 to 1.35 persons pervehicle. A value of 1.2 persons per vehicle is typically used in planning studiesin Florida.
Increasing occupancies results from shifting person trips from single-occupantvehicles to carpools and transit. Increased occupancies are associated with othersystem benefits including decreased vehicle miles of travel (VMT), congestionlevels, fuel consumption, and pollutant emissions. Park-and-ride facilities canbe expected to positively influence increased vehicle occupancies.
Peak-Hour LevelOf Service: This measure is expressed by letter ratings ranging from A to F with A representing
unrestrained travel conditions, E representing practical capacity, and Frepresenting system failure. Improved level of highway service is typically astated objective of local transportation plans. Florida’s growth managementlegislation includes Level of Service objectives. Provision of Level of Service Coperations, with D operations in critical circumstances are typical objectives.Many urban facilities operate, or are expected to operate, at Level of Service Eor F conditions.
Park-and-ride facilities can have a measurable impact on highway Level ofService; however, the facility must be relatively large and highly utilized.Smaller and lightly used facilities will have a negligible impact on highway levelof service.
Air Quality: Measures representing impacts on air quality include annual tons of carbonmonoxide, hydrocarbons, and nitrogen oxides, all pollutants produced byautomobiles and transit vehicles. As with the previously mentionedeffectiveness measures, improvements in air quality is a traditional objectiveincluded in most local transportation plans.
Fuel Savings: This measure is presented in millions of gallons of fuel saved. This is anotherobjective often included in local transportation plans. Park-and-ride facilitiestend to reduce fuel consumption through reductions in vehicles from the road.Larger facilities serving limited-access highways might increase fuelconsumption of those vehicles remaining on the road because fuel efficiencydecreases with speed increases at operating speeds over 35 mph.
TransitReadership: This measure is presented on an annual basis and may be expressed in millions

Florida Department of Transportation Park and Ride Manual6-10
for larger systems. Increasing transit readership is an objective of many localtransportation plans, particularly those in larger urban areas where adding roadcapacity is becoming increasingly prohibitive cost-wise. This objective is onlyrelevant to park-and-ride improvements where transit service is planned.
ECONOMIC ANALYSIS OF PARK-AND-RIDE IMPROVEMENTSThe economic analysis of park-and-ride improvements should follow a series of steps. The processcontained in the AASHTO Red Book [37] has been adopted by the Department as the prescribedprocedure for analyzing construction projects. The series of steps contained in this procedure arepresented in the following and include:
•. Update cost factors•. Select economy study features•. Describe project characteristics and estimate project costs•. Calculate annual transit operating costs•. Calculate unit user costs and transit user costs•. Calculate user benefits•. Estimate residual value•. Determine present values and economic desirability
Cost UpdatesUnit costs associated with users, construction, and operation should be updated to maintainconsistency with the Department’s latest cost values. AASHTO recommends that these unit costsshould be updated approximately every two years or when price levels fluctuate by more than 20percent [37].Recommended updating procedures include use of either average or commodity-specific consumerand wholesale price indices to factor base unit rates to the new time basis.
Study FeaturesCritical features of the economic study include the discount rate, value of travel time, analysisperiod, and study years. Discount rates are used to compute present values of economic investmentand user costs. Typically, a discount rate of 4 to 5 percent is employed for economic study oftransportation projects.
As mentioned above, the economic value of time spent commuting is computed through the use ofa value-of-time factor. The value of time for the work trip purpose is traditionally used and isparticularly appropriate for the analysis of park-and-ride improvements since the associated impactsare realized during commuting hours. The value of commuter travel time has been found to rangefrom 20 to 40 percent of the commuter’s income [36]. A value of $5 per hour is typically used ineconomic analyses of transportation improvements.
The selected analysis period for the study should be consistent with the economic life of theimprovement. Different components of the improvement will have differing life cycles. Standard

Florida Department of Transportation Park and Ride Manual6-11
economic life values used by the Department include 60 years for right-of-way; 40 years forearthwork, drainage systems, and structures; and 20 years for pavements and base course. Life cyclelengths for transit vehicles can be assumed to be 15 years unless better information is available.Table 6-2 presents appropriate economic lives for the types of park-and-ride improvementsconsidered here.
Table 6-2. Economic Life Cycles for Park-and-RideImprovements
Improvement Life Cycle
HOV-Related Facility 20+ yearsFixed- Guideway Facility 20+ yearsExpress Bus Facility 15 yearsIsolated Facility 20 yearsExpansion on Adjacent ROW 20 yearsStructure on Existing ROW 40 yearsModification of Existing Design 15 yearsJoint-Development 5 yearsProvision of Transit Services 15 years
Note:ROW = Right-of-way HOV = High-occupancy vehicle
The selection of study years allows for the simplification of estimating the annual values of userbenefits and project costs over the length of analysis period. Typically, two years are selected; thebase year and some future year. Annual costs are then interpolated between the two study years. A20 year planning horizon is a traditional future study year. The future planning year should beselected based on considerations of the economic life of the project and the available years of travelforecasts.
Project Description and CostsThe proposed improvement alternatives should be defined in sufficient detail to estimate the projectand user costs. Different analysis sections should be identified to estimate costs related to HOVfacilities only. Sections should be defined by length, gradients, curvature, and speed changecharacteristics.
The length of the travel path between the park-and-ride facility and the major destination areasshould be identified and segmented into sections representing congested freeway, uncongestedfreeway, congested arterial, and uncongested arterial roadway. Chapter 5 presents methods fordetermining these classifications of roadways in computing facility impacts related to travel time,fuel consumption, and vehicle emissions.The project cost components relevant to the particular improvement alternatives under study arepresented in Table 6-1 above. To summarize, these costs are associated with:
•. Design•. Right-of-way

Florida Department of Transportation Park and Ride Manual6-12
•. Construction•. Maintenance•. Operation•. Transit capital
Operation and maintenance costs should be expressed on an annual basis.
Transit CostsTransit costs are treated in two categories: capital costs and operations and maintenance (O&M)costs. The level of transit service and related number of additional vehicles must be defined toderive these costs. This information includes route miles, frequencies, and operating speeds.
Capital costs relate to investments in fixed facilities including rolling stock, benches, shelters, androute signs. Costs associated with HOV lane construction or physical improvements at thepark-and-ride facility are included in the project costs discussed in the preceding section. O&Mcosts relate to operating and maintaining the service to the park-and-ride facility and includes driverwages and fringes, vehicle operations costs, and labor and parts associated with bus maintenance.The following formula, recommended by AASHTO [37], can be used to compute annual operatingcosts for transit service provided to the park-and-ride facility:
Operating Cost (millions) = 2.37 * Q1.1013 * H0.785 * S-0.862 * exp(0.002 * P)
where:Q = Annual bus milesH = Drivers hourly wages and fringe benefitsS = Average running speed in mphP = Vehicle seating capacity
This equation reduces to the following formula for an assumed wage/fringe rate of $20/hour and 45seat bus:
Operating Cost (millions) = 27.24 * Q1.1013 * S-0.862
User CostsRelevant user costs related to park-and-ride facility improvements include costs associated with travel time, vehicle operation, accidents, parking charges, and transit fares. These costs are requiredon an annual basis. Data required for these computations are estimates of demand and/or transitusage, average operating speeds, and VMT. Chapters 4 and 5 present methods for computing thesedata. As mentioned earlier, current cost data should be used when available. Table 6-3 presentsdefault values which may be used in lieu of available local data.
Total annual costs are developed by multiplying the appropriate cost factors times the annual VMTor person hours of travel. These costs are computed for each alternative including the do nothingalternative.

Florida Department of Transportation Park and Ride Manual6-13

Florida Department of Transportation Park and Ride Manual6-14
Table 6-3. User Cost Default Values(1989 dollars)
Cost Element Value
Travel time1 $5/hourVehicle operation2 $0.20/vehicle mileAccidents3
•-Freeways --Arterials
$0.35/vehicle mile$3.60/vehicle mile
1Reference 362Reference 383Reference 34
User BenefitsUser benefits are defined as the annual savings in travel time, vehicle operation, accident, parking,and transit fare costs which users realize through the implementation of an improvement. Thiscalculation is represented by the following formula:
Benefit (annual) = UC0 - UC1
where:UC0 = Total user costs for Alternative 0 which is typically the do nothing
alternative.UC1 = Total user costs for Alternative 1
Residual ValueResidual value represents the economic value of an improvement at the end of the analysis period.Residual values will be of concern in relation to parking facility land and rolling stock for the typesof park-and-ride improvements considered in this chapter. Any costs associated with disposal of aproperty should be subtracted from the market value at the end of the analysis period.
The approach for computing residual value is to take the full cost of the land, subtract the disposalcosts, and add the proportion of the remaining useful life of structures and earthwork times theircost.
Present Values and Economic EvaluationThe Department procedure for this final step is to bring all costs to an annual basis and compute anannual incremental benefit/cost ratio for each improvement alternative versus the base casealternative. User benefits are expressed on an annual basis. A capital recovery factor (CR) based onthe discount rate is used to convert the present worth of construction and equipment to annual basis.An appropriate sinking fund factor (SF) based on the discount rate is applied to convert futureresidual values to an annual basis. Equations for these factors are as follows:
CR = i(1 + i)n/[(1 + i)n -1]SF = i / [(1 + i)n -1]

Florida Department of Transportation Park and Ride Manual6-15
where:CR = Capital recovery factorSF = Sinking fund factori = Discount raten = Analysis period in years
The annual cost of each alternative is computed as follows:PCi = 0&Mi + CR * CCi + SF * RCi
where:PCi= Annualized total project cost for alternative 10&Mi = Total annual operation and maintenance costs including transit, highway, and
park-and-ride facility costs for alternative ICCi = Total annualized capital costs including fixed facilities and rolling stock for
alternative IRCi = Total annualized residual values for all salvageable property and rolling stock at
the end of the analysis period for alternative ICR = Capital recovery factorSF = Sinking fund factor
The following formula is used to compute the benefit/cost ratio for an improvement:B/Cx = UCx / PCx
where:B/Cx = Benefit/cost ratio for alternative xUcx = Annual user cost for alternative xPCx = Annualized project cost for alternative x
An incremental benefit/cost ratio is used to analyze the expenditure of additional increments ofcapital cost with resultant gain in benefits. This can be performed in situations where severalimprovement alternates are under consideration. The following formula is used to compute theincremental benefit/cost ratio for two alternatives:
B/Cx-y = (UCy - UCx)/(PCy - PCx)
where:B/Cx-y = Incremental benefit/cost ratio for alternative y as compared to alternative xUCx = Annual user cost for alternative xUCy = Annual user cost for alternative yPCx = Annualized project cost for alternative xPCy = Annualized project cost for alternative y

Florida Department of Transportation Park and Ride Manual7-1
CHAPTER 7: CONCEPTUAL DESIGN CONSIDERATIONS
The vast majority of Florida park-and-ride facilities are small. Of non-Metrorail (Dade County)parking facilities, less than six percent have capacities larger than 300 spaces while almost 75percent have capacities at or under 100 spaces. In addition to this, most park-and-ride facilities areplanned for free operation, resulting in facilities that do not cover their own capital, operation andmaintenance cost. These situations should not influence the designer to avoid basic designrequirements for the purposes of minimizing design and construction costs. The size of economicsof a park-and-ride facility do not justify inadequately addressing design-related problems in thefacility design.
The facility design should strive for the following objectives:
•. Safe and efficient movement of all modes using the facility.•. Accommodation of transit, carpool, vanpool, pedestrians, motorized cycles, and
bicycles both on and adjacent to the site as warranted.•. Provision of an adequate number of parking spaces.•. Provision of user comfort and attractiveness.•. Accommodation of elderly and handicapped.
In order to assist in meeting these objectives, the following sections provide a checklist of designfeatures which should be considered the preliminary engineering and design effort for a facility. This material was originally presented in Working Paper 4: Facility Analysis [2].
No attempt is made to provide specific design criteria for park-and-ride lot features such as turningradii, pavement thickness, driveways, median opening, parking space dimensions, etc. Referenceswhich can be found in the bibliography address design standards and criteria[39,40,41,42,43,44,45,46,47,48,49, 57].
EXTERNAL FEATURESThe design of park-and-ride facilities should consider a number of factors related to the interfacebetween the internal facility operation and the external street network. The external featuresinclude:
•. Access/egress•. On-street bus stops and pullouts•. Traffic control devices•. Guide signage
Access/Egress ConsiderationsTable 7-1 presents a number of factors related to the proper design of facility access. These factorshave been grouped into categories related to the objectives of a park-and-ride facility design:

Florida Department of Transportation Park and Ride Manual7-2
•. Efficient and convenient access•. Minimal impact on adjacent road operations•. Safety•. Proper design practice
While adequate access was suggested earlier to be an important site selection criterion, the finalselection of a site may be influenced by other factors such as available right-of-way. In suchsituations, the designer will not be working with the ideal conditions so will need to strive tooptimize the access design. To effectively do this, a traffic engineering study should be performedto evaluate capacity conditions at potential lot access driveways and at critical locations on adjacentaccess roadways. During the planning process for the site, estimates of demand by direction ofaccess would be developed. These will provide the traffic engineer with estimates of trafficvolumes anticipated to use each segment of the road system under evaluation.
Off-Site Bus AccessThe selection of where to locate bus stops, either off-site or on-site should be made only afterevaluation of a number of factors which effect the decision. These factors include:
•. Lot configuration and loss of parking space.•. Ease of transfer including consideration of the distance from parked vehicles to the bus
stop.•. Ease of adding additional time to the operating schedules of those bus routes serving
the park-and-ride facility. This aspect of the site design should be closely coordinatedwith the local transit agency.
•. The amount of on-site space which can be used for bus bays, storage areas, drives,shelters, and benches as well as passenger walking and waiting areas.
•. The type of stop which could be developed on-street; on-street loading/unloading versus bus pullout. This will be based on the design policies of the constructing authority, operating policy of the bus operator, volume of automobile traffic, locationof the stop in relation to nearby intersections, and the frequency of service.
•. The amount and cost of right-of-way required and available for development of an on-street pullout.

Table 7-1. Facility Access/Egress Design Factors
Design FactorsEFFICIENT ACCESS IMPACTS TO
ADJACENT ROADSSAFETY DESIGN
STANDARDS/PRACTICEThe design should strive tominimize the time to changemodes which includes facilityaccess time.
Capacity analyses should beperformed to minimize thetraffic impacts on theadjacent highway network.
The design shouldmaximize safety for thepurposes of protecting thepublic and reducing liabilityrisks.
Field observation of trafficoperations in vicinity of the siteshould be performed beforedeciding on access locationsand design.
The design should attempt toprovide for direct approach andeasy entrance and exit to thefacility.
The location and design ofaccess driveways shouldstrive to minimize theincrease in congestion ofadjacent roads served bythe lot.
Entrances/exits should belocated as to avoidlocations near structures,decision points, andtermination of lighting].
The number and design offacility exits should be based ona maximum of 300 vehicles perlane per hour.
Whenever possible the facilityentrance should be located onthe right side of inbound traffic.If this not be possible, specialleft-turn signals and adequatestorage bays should beconsidered.
Where possible, locateaccess points with relation toshopping centers, theatersand other land uses withpeak trip generation notoccurring during peakcommute times.
The design should providefor adequate sightdistances for entrance, exitand crossing maneuvers1.
The design should conform withlocal, FDOT and AASHTOdesign criteria.
The most efficient access to afacility is via a collectorintersecting the adjacent arterialat a signalized intersection. Thiseliminates the need fordriveways and reduces conflictson the arterial.
The design ofentrances/exits should notresult in a major conflictpoint on access roads.
Entrance/exit locationsshould provide foradequate weaving,merging, and lane changedistances.
The AM peak hour is critical forentrance design while the PMpeak hour is the criticaloperating period for exit design.
Access points should be locatedas to avoid queues from nearbyintersections or freewayinterchanges.
Do not place entrances/exitsnear signalized intersectionsor other points that wouldcause a conflict.
The location of facility exitsrelated to adjacentintersections should besuch that signal control exitcan be reasonablyinstalled at later timeshould such control not bepresently warranted.
The design shouldaccommodate all modesanticipated to access the facilityincluding passengerautomobiles, buses, bicycles,and pedestrians. This relates toroadway widths, turning radiiand separation of non-vehicularand vehicular traffic.
The design should providefor adequate storage for allentering and exitingmovements.
Plane entrances/exits soas to discourage •cuttingthrough• movements.
For lots over 300 spaces, aminimum of two exits and twoentrances is recommended. Forlots over 1000 spaces, provisionof entrances and exits on twoadjacent streets isrecommended to reduce trafficcongestion and to provide formore efficient dispersment oftraffic.
New signal on arterialconsidered only if shownthat there will not besignificant delay added totraffic.
The resign should strive forseparate access points forthe different arrival modesanticipated to use thefacility.
Entrances should bedownstream of signalizedintersection.
Separate one-wayentrance and exit drivesshould be considered toreduce conflicts.
1(Reference 39).

Florida Department of Transportation Park and Ride Manual7-4
Table 7-2 presents factors which need to be considered when designing an off-site, on street busstop. Factors related to on-site development are presented later. The factors presented in Table 7-2are related to vehicle maneuverability, safety, and design guidelines which should be considered inthe conceptual design of the facility.
Table 7-2. Off-Site, On-Street Bus Stop Design Factors1. Careful consideration of traffic volumes and the effects of stopping buses on traffic flows and
roadway capacity must be given when considering having buses stop in the traveled way of a street.2. Transit operators generally prefer to have the stop located as close as possible to the riders’ ultimate
destination so the rider does not have to walk long distances or cross the street.3. Far-side bus stops are preferred from traffic operations and safety standpoints since they provide for
greater pedestrian safety, reduce conflicts with right-turning vehicles, and provide for better sightdistance conditions particularly at unsignalized intersections.
4. Near-side bus stops are preferred from a transit operations standpoint because loading/unloadingoperations can coincide with the red phase and it allows for buses to make right turns at theintersection.
5. Mid-block stops may require pedestrian crosswalks and special signals.6. At least one block should be provided between the stop and the next left turn location.7. Bus pullouts should be considered for roads with high traffic volumes.8. Bus pullouts have the advantage of separating the bus from other traffic.9. Bus pullouts require a minimum and optimum right-of-way of 10 and 12 feet, respectively. Pullouts
can be designed in 2,400 to 3,000 square feet of right-of-way.10. User amenities including benches and shelters should be installed.11. Route signing should be incorporated into the signing plan. Schedule information signs should be
considered. The placing of these signs will need coordination with the local transit agency.12. On-street bus pullouts require special signing and marking.13. On-street bus pullouts should not be located in right-turn lanes. Also they should be avoided in curb
lanes which carry a heavy volume of right-turning traffic.14. Drainage should be designed to avoid passengers walking through water to access the transit
vehicle.
Traffic Control DevicesTraffic control devices relevant to park-and-ride facilities include signals, regulatory signs, pavement markings, and channelization. The proper control should be developed from traffic engineering analyses of access drives to the facility as well as nearby intersections which will besignificantly affected by facility traffic. The design and application of traffic control devicesshould conform with the Manual on Uniform Traffic Control Devices (MUTCD)[44]. Table 7-3 presents a series of consideration relevant to the design of traffic control devices externalto the park-and-ride facility. It is noted that stop signs are the only control devices installed at mostof the existing facilities in Florida. This is a function of the size of the lots and their location. However, more elaborate traffic control devices should be considered when designing facilitieswith large numbers of spaces, higher expected usage, and placed on congested arterials.

Florida Department of Transportation Park and Ride Manual7-5
Table 7-3. Facility Traffic Control Device Design Factors1. Traffic signals, traffic signs, pavement markings, and traffic divisional and channelizing islands
should be designed in conformance with the latest edition of the Manual on Uniform Traffic ControlDevices [44]
2. The planning and design of traffic control devices should be carried out in conjunction with the overalldesign of the street or highway. The devices and procedures utilized for traffic control should bepredicated upon developing uniformity throughout the system and compatibility with adjacentjurisdictions3.
3. Signals should be considered only after a thorough study of traffic in the area and should bewarranted or justified in a manner prescribed in the Manual on Uniform Traffic Control Devices.
4. Timing/phasing adjustments to existing signals may be required to accommodate park and ridetraffic.
5. Traffic signals at park and ride facilities are the exception, not the rule.6. A minimum requirement for park and ride facility is stop signs and stop lines, double yellow
centerline, and turn-lane markings for exits onto public roadways.
3Reference 39 One consideration particularly relevant to park-and-ride lots is the special traffic controlrequirements for transit operations. The designer can expect that an operator will not permit a bus tomake a left turn across a high-volume arterial into/out of a facility without a traffic signal. Closecoordination with the local transit agency is recommended should bus service be desired for afacility.
Guide SignsGuide signs or park-and-ride facilities act not only to guide users but also to promote the lot. Theplacement of signs should intercept users on their normal paths and guide them directly to thefacility. The signs should be in conformance with the Manual on Uniform Traffic Control Devices[44].
Table 7-4 presents factors which should be considered in developing guide signage plans forpark-and-ride facilities.

Florida Department of Transportation Park and Ride Manual7-6
Table 7-4. Guide Sign Design Factors1. All guide signs should conform with the latest edition of the Manual on Uniform Traffic Control
Devices [44] which incorporates flexibility for signing special situations, services, and inclusion ofspecial logos. However, standard signs should always be used for driver expectancy and forreducing maintenance costs.
2. Location should relate to the influence zone(s) from which potential users are expected to begenerated. Location should intercept potential users on their normal travel path and guide themdirectly to the facility.
3. Signing placement should assume the motorist does not know where he is going. Guide signsshould be placed at all decision points, far enough in advance to allow for adequate distance tomaneuver to that point.
4. Continuity of guide signing is critical. Guide signs should lead the motorist through decision points tothe destination.
5. Guide signs should be placed on all approaches to the facility, even on approaches usuallyconsidered to service travel opposite to the predominate direction.
6. Consideration of signing should include concern for the function of the lot. For example, rail stationswith park and ride should have park and ride messages on the station guide signs.
INTERNAL LOT DESIGNThe design of the internal components of a park-and-ride facility will depend on the modesexpected to use the facility and the size and configuration of the site. Certain components will havemore or less importance depending on the function and use of the facility. As an example, bus stopsare generally not needed at remote facilities since bus service is seldom provided in rural areas.Some components may need to be drastically modified from or eliminated all together if the site cannot accommodate the ideal design. For instance, landscaping may need to be sacrificed at a sitewhich is barely large enough to accommodate the required number of parking spaces.The internal components of the park-and-ride facility which should be considered by the designerinclude the following:
•. Site layout and internal circulationC. Parking layoutC. Transit terminal facilitiesC. Pavement and drainageC. Signing/MarkingC. LandscapingC. SecurityC. Boundary IdentificationC. User amenities
Each of these components are addressed in the following subsections.
Site Layout/Internal CirculationInternal circulation is one of the most critical elements determining the successful design of apark-and-ride facility. The site layout should provide for safe, rapid parking and related movements,minimization of conflicts between motor vehicles and pedestrians, and optimization of space. Table7-5 presents the concepts which should be considered by the designer/site planner.

Florida Department of Transportation Park and Ride Manual7-7
Table 7-5. Internal Circulation Design Concepts1) Transfer terminals should be located either in a central location with the parking areas for the various
user modes surrounding it or at one end with the user mode parking areas extending radially from theterminal.
2) The facilities layout should strive to minimize access/egress times for transit, paratransit, andkiss-and-ride vehicles.
3) The system of circulation produced by the arrangement of parking aisles and stalls should be designedto minimize travel distances, conflicting movements, and number of turns.
4) Major circulation routes which are located at the periphery of the facility minimizes vehicle/pedestrianconflicts.
5) Mixing of automobile and bus traffic should be avoided if possible.6) One-way, two-lane circulation roads permit passing of stopped transit vehicles and are desirable where
buses and autos cannot be separated.7) The layout of parking areas in regard to closeness to a transfer terminal should be given in order of 1)
handicapped, 2) kiss-and-ride and taxis, 3) short-term parking, and 4) long-term parking.8) The maximum reasonable walking distance is 1000 feet. Longer walking distances may require
consideration of additional loading zones.9) Parking aisles should be oriented to the transfer terminal to provide for convenient pedestrian movement
through the facility.10) Separate facility entrances and exits are preferred. Otherwise, a traffic island or pavement markings
separating exiting and entering vehicles should be provided.11) Generally, no more than 30 spaces should be provided without a cross aisle to move to exits or other
parking spaces or to bypass disabled vehicles.12) Reservoir areas which do not conflict with circulation patterns and parking maneuvers should be
provided at exits for storage of exiting vehicles.13) Circulating roadways should not be located close to exits/entrances to prevent congestion both on- and
off-site.14) Drivers should not be confronted with multiple decisions at the same point in the circulation system.15) The single-unit bus should be used as the design vehicle for turning radii and circulating roadways unless
specifications for an articulated bus are required.
Parking LayoutThe parking layout is another critical feature of a successful facility design. The designer will needto address up to four of the following types of parking areas in the site layout:
1) Handicapped parkingC) Kiss-and-ride parkingC) Short-term parkingC) Standard park-and-ride parking
This list provides a hierarchy whereby locational preference on the site is given in the above order.The above four types of parking were found during the survey of Florida park and-ride facilitiesconducted during this study.
The purpose of providing handicapped parking is for reasons of safety, convenience in accessingthe vehicle, and in providing easier access to transfer stations. The handicapped generally requiremore space around the vehicle to get in and out of it. Also, some handicapped people may suffergreat difficulty in traversing distances which the non-handicapped would not give a second thought

Florida Department of Transportation Park and Ride Manual7-8
to.Handicapped parking is also required under the Americans with Disabilities Act (ADA.)
The layout of handicapped parking must consider the location, number of spaces, space size. Thelocation of handicapped parking spaces should be near transit transfer areas for facilities served bytransit. Otherwise, the designer needs to balance convenience to facility access points, conveniencein maneuvering the vehicle into and out of the parking space, and the amount of traffic in aislesadjacent to the handicapped spaces. ADA [50] requires that handicapped spaces be locatedadjacent to facility exits. This is reasonable provided a transfer terminal is not located on the site.
Other factors which must be incorporated into the layout of handicapped parking include: C) No access roads should be crossed by handicapped people in moving from their vehicle to a
transfer terminal.C) The handicapped must never be forced to circulate behind parked vehicles.C) Wheelchair ramps and curb ramps must be provided if platforms or curbs must be negotiated
by the handicapped.
AASHTO [7] has developed guidelines for selecting the number of handicapped parking stallsdemarcated at public transfer facilities. These are presented in Table 7-6. ITE [50] suggests thatfour percent of the total number of spaces within a facility, with a maximum of nine or 10 shoulddesignated for the handicapped. This is comparable to the AASHTO recommendation. Thedesigner should also attempt to conform to local site development codes; however, such codes willseldom address handicapped requirements specifically for park-and-ride facilities.
In sizing handicapped parking stalls, the designer should use a lift-equipped van as the designvehicle. Stall dimensions are contained in local code requirements which should be conformed to.Recommended stall sizes vary and typically range from 9x18 to 10x20. Smaller size stalls shouldhave marked areas between stalls to facilitate access of the vehicle. AASHTO [7] recommends awidth of eight feet plus five feet clear zone between vehicles to allow for vehicle access. ITE [50]recommends an 9x18 stall size with four foot strips marked between stalls.

Florida Department of Transportation Park and Ride Manual7-9
Table 7-6. AASHTO Handicapped Parking Recommendations Total Parking
SpacesMinimum
HandicappedSpaces
1 to 25 126 to 50 251 to 75 3
76 to 100 4101 to 150 5151 to 200 6201 to 300 7301 to 400 8401 to 500 9
501 to 1000 2%over 1000 20 plus 1 for each
100 over 1000
(Reference 7)
Handicapped spaces should be marked with a sign at least four feet high at the head of each stall.Also, the handicapped symbol pavement marking may be provided. The color of handicappedpavement markings is usually white; however, light blue is being used more and more to delineatehandicapped spaces. Light blue provides for greater delineation of handicapped parking areas thandoes the color white.
Kiss-and-ride parking should be located to provide for easy and safe access to the transit terminal orbus loading zone if these exist at the facility. Kiss-and-ride traffic should be separated from transitand normal park-and-ride traffic to the greatest degree possible in order to reduce conflicts andincrease safety. Consideration should be given to one-way operation in the kiss-and-ride area aswell as for pull-through parking, angled at 45 degrees, and facing in the direction of the transitstation.
Short-term parking was found to be given special definition at facilities located in HillsboroughCounty. Short-term parking areas were located next to kiss-and-ride areas but further away from thetransit terminal. The purposes for providing short-term parking at a park-and-ride facility is topromote the use of transit as well as to provide joint use of the facility. Short-term parkers arepermitted to use the lot to access nearby establishments; however, their use is controlled by placinga restriction on the amount of time they can park.Since park-and-ride facilities are typically established to promote commuter usage, theestablishment of short-term parking on it’s own is questionable. However, provision of suchparking may prove beneficial to having the facility accepted by area businesses. In fact, thepark-and-ride lot located in Century, Florida (Pensacola area) is looked upon with great pride by thetown officials and business community.
The layout of long-term parking areas can be designed in much the same manner as other parkingfacilities. The designer should consider maximization of parking spaces, circulation in the parking
Florida Department of Transportation Park and Ride Manual7-10
area, and parking dimensions. The alignment of parking rows should be in the direction of thelongest dimension of the site. This results in less space being used for aisles and more for parkingspaces. This becomes less critical as the lot width dimension approaches the lot length dimensionfor the rectangularly-shaped site.
Generally, 10-degree parking is preferred over angle parking for safety and user conveniencereasons [7]. 90-degree parking is generally the most efficient as measured by square feet per space.Aisles should be one-way with angle parking and two-way for 90 degree parking. Parking anglesbetween 75 and 90 degrees should be avoided since it will become difficult to maintain one-wayaisle operation. Aisles should be aligned to facilitate convenient pedestrian movement toward thebus loading zone. Aisle lengths should not exceed 400 feet if possible. One-way aisles should favorcounter-clockwise circulation. Head-in parking only should be promoted.
Stall sizes should conform to the 9 x 18.5, 90-degree standard or 8 x 16, 90-degree compactdimensions. Figure 7-1 presents dimensions for stall elements for these two standard sizes atvarious angles of parking. The smaller 8.5 x 16 size can be considered; however, experience hasshown that substandard stall and aisle sizes provide a false economy of space since cars willencroach on adjacent spaces making one or more unavailable for use in a given parking row.
Mixing standard vehicle and compact vehicle stall sizes can provide for a greater number of spaceson a site. In order to realize this efficiency, however, compact parking must be given a preferenceand located in locations convenient to the user. Otherwise, compact cars will be parked in standardsize stalls which effectively reduces the number of useful spaces. It should be noted that the trend isto provide only standard size stalls s because of the difficulty of preventing parking of standardsized vehicles in compact spaces.

Florida Department of Transportation Park and Ride Manual7-11
5
Figure 7-1. Parking Stall Layout Dimensions
(Reference 7)

Florida Department of Transportation Park and Ride Manual7-12
Figure 7-1 - (Text Addendum) Parking Layout Dimensions (in feet) for 8-ft. Stalls at Various Angles
Dimension (feet) OnDiagram
45o
60o
75o
90o
Stall width, parallel to aisle A 11.3 9.3 8.3 8.0Stall length of line B 21.6 19.0 17.3 16.0Stall depth of wall C 15.2 16.5 16.9 16.0Aisle width between stall lines D 12.0 13.5 19.5 22.0Stall depth, interlock E 13.3 15.2 16.3 16.0Module, wall to interlock F 40.5 45.2 52.7 54.0Module, interlocking G 38.6 43.9 52.1 54.0Module, interlock to curb face H 38.5 42.9 50.2 51.5Bumper overhand (typical) I 2.0 2.3 2.5 2.5Offset J 5.4 2.4 0.5 0.0Setback K 9.5 7.2 4.4 0.0Cross aisle, one-way L 12.0 12.0 12.0 12.0Cross aisle, two-way - 22.0 22.0 22.0 22.0
Parking Layout Dimensions (in feet) for 9-ft. Stalls at Various Angles Dimension (feet) On
Diagram45
o60
o75
o90
o
Stall width, parallel to aisle A 12.7 10.4 9.3 9.0Stall length of line B 25.0 22.0 20.0 18.5Stall depth of wall C 17.5 19.0 19.5 18.5Aisle width between stalllines
D 12.0 16.0 23.0 26.0
Stall depth, interlock E 15.3 17.5 18.8 18.5Module, wall to interlock F 44.8 52.5 61.3 63.0Module, interlocking G 42.6 51.0 61.0 63.0Module, interlock to curbface
H 42.8 50.2 58.8 60.5
Bumper overhand (typical) I 2.0 2.3 2.5 2.5Offset J 6.3 2.7 0.5 0.0Setback K 11.0 8.3 5.0 0.0Cross aisle, one-way L 14.0 14.0 14.0 14.0Cross aisle, two-way - 24.0 22.0 24.0 24.0
Transit Terminal FacilitiesThe design of transit transfer terminals within a park-and-ride facility is comprised of twocomponents; the transit vehicle and the passenger. The terminal area should be designed to providefor safe and easy bus operations. Large turning radii should be provided for buses entering andexiting the site. Acute angles should be avoided. Circulation roadways in the terminal area shouldbe two lanes and operated in one direction of travel. A saw tooth design for the bus loading areaprovides for the easiest operation of buses but is only required for larger terminals with extensivebus service. Reinforced pavement is desirable in the terminal area because of the large wheel loadsand higher temperatures.

Florida Department of Transportation Park and Ride Manual7-13
Passenger amenities which should be considered for the terminal area are shelters, benches, andtransit information. Shelters should be provided where bus loadings are heavy, where transitidentity is to be promoted, where loading zones are to be located or waiting is to occur, and wherethe site allows for them [51]. For most park-and-ride lots with transit service, a minimum designwill be adequate. However, larger transfer points may require consideration of more significantstructures. Shelters at existing Florida facilities range from simple mass-produced plexiglass unitsto full-scale concrete structures.
Generally, the need for a shelter increases with the demand and the headway between transitvehicles. A rule of thumb is that a shelter is required if 100 or more users per day will transfer tobus and where total person waiting time is greater than 500 minutes [50].
The size of shelter required at a park-and-ride facility is dependent on the maximum accumulationof users at the transfer terminal. Size requirements should be based on eight square feet per person.For conceptual design purposes, the shelter size requirement can be assumed to be 25 square feetper 100 space facility. This is based on the followingassumptions:C) Eight square feet per shelter user.C) The number of kiss and ride drop offs is equivalent to 0.20 times the parking spaces in the
facility.C) The average wait time is 10 minutes.
Shelter modules can be purchased in standard sizes of 10 to 12 feet in length, five to seven feet inwidth, and seven to eight feet in height. These provide 50 to 72 square feet of covered area which isgenerally adequate for most installations. At larger park-and-ride lots, such as the Golden Glades lotin Miami and the Yukon Street Terminal in Tampa, concrete structures may be considered. Designdecisions should be based on the number of vehicles parked at one time, the number of passengers,bus frequency, weather, and funding.
Shelters should be of contemporary design, constructed of highly durable materials, highly visible,provide ample weather protection, and should minimize installation and maintenance cost. Thecharacteristics of shelter design should include the following:
C) Visibility: Provides for user safety. The user should be able to see an approaching bus frominside the shelter.
C) Accessibility: Shelters should have a minimum of two access points to provide for convenientaccess and user safety. Each opening should be at least 2 • feet wide.
C) Appearance: Shelters should be visually pleasing and blend with the surrounding environment.The logo of the local transit agency should be clearly placed on the shelter.
C) Materials: Typical construction materials include steel, anodized aluminum, wood, concreteand tile block, reinforced concrete, fiber glass, plastics, and glass. Cost, durability, availabilityand appearance should guide the decision on construction materials.
C) Modular Construction: Modular construction facilitates capacity expansion, uniformity of

Florida Department of Transportation Park and Ride Manual7-14
design, and can reduce costs.C) Amenities: Protection from the weather and benches are minimum requirements. Other features
can include transit route maps, transit schedules, lighting, telephones, and trash receptacles.
Levinson, et al [51] suggests that a minimum service life for shelters should be 15 years. Typicalunit costs range from $35 to $55 per square foot, or approximately $2,500 to $5,000 per unit.Annual maintenance and repair costs can range up to $750 per unit.
Pavement and DrainageThe design of pavements for park-and-ride facilities should conform to the Department’s•Greenbook• standards [38]. That document also refers the designer to standards set forth in thefollowing documents: C) FDOT •Flexible Pavement Design Manual• [46] referred to for design of flexible
pavements. C) AASHTO •Interim Guide for Design of Pavement Structures• [47] referred to for
design of rigid pavements.C) Publications by the Asphalt Institute, Portland Cement Association and the American
Concrete Pavement Association for other design standards as determined applicable bythe design professional.
The following considerations must be taken into account when designing park-and-ride facilitypavement:
C) Drainage: Must conform to State and local design standards. Standing and flowingwater should be avoided in areas where pedestrians walk or stand. Local codes related toon-site retention of storm runoff should be conformed with.
C) Drains: Should be designed to withstand the maximum expected wheel loadings(transit or maintenance vehicles), be maintenance free, vandal-proof, and have short,narrow openings placed perpendicular to traffic to minimize the hazard to pedestriansand bicyclists.
C) Pavement Types: Up to three different types of pavements will be needed for a facility.The heaviest load carrying pavement is needed for bus drives, loops, and loading areas.Rigid pavements are recommended for bus layover and loading areas because of thehigh static wheel loads and high temperatures. Light load carrying pavement is neededfor internal circulation roadways, aisles, and kiss-and-ride roadways. The lightest loadcarrying pavement would be used for car parking areas and bike paths.
CCCC) Widths: Minimum widths of 12 feet on tangents and 15 feet on curves arerecommended for roadways carrying transit vehicles. Minimum widths for bike pathsare five feet for one-way paths and eight feet for two-way paths. The maximum designspeed for bike paths in a park-ride facility is 10 mph. Refer to the FDOT •BicycleFacilities Planning and Design Manual• [48] for proper design standards.
Signing/Marking

Florida Department of Transportation Park and Ride Manual7-15
Within the park-and-ride facility, different types of signing may be required including: C) Guide signs to direct vehicles to kiss-and-ride parking and drop-off areas, handicapped
parking, and bicycle paths and parking areas.C) Guide signs to direct traffic to facility exits which is particularly applicable to large lots.C) Regulatory and warning signs to control traffic on roadways particularly at locations
where vehicular/pedestrian/bicycle conflicts are anticipated.C) Regulatory signs to prohibit unauthorized use.C) Parking restriction signs including handicapped parking, no parking zones, short-term
parking durations, bus stop, tow-away zones, overnight parking prohibition, etc.C) Information signs describing transit information, proper use of the facility, declarations
of liability responsibility, or construction funding information particularly if Federalfunds were used.
C) Information signs indicating the responsible administrating agency which helps toreduce unauthorized use of the facility.
C) Information signs identifying specific section of a large lot to facilitate vehicle retrieval.
Recommended practice is to conform with the MUTCD [44] standards to the degree possible.Where particular signs applicable to park-and-ride facilities are not contained in the MUTCD,consistency and conformity to local applications should be practiced.
Pavement markings within the facility are used to control traffic and provide for orderly parking of vehicles. Except for those markings associated with parking, all markings should be reflectorizedand conform to MUTCD standards. The types of pavement markings which are applicable to the park-and-ride facility include the following:
C) Centerlines, lane separation lines and channelizing lines.C) Stop lines.C) Symbol arrowsC) Pedestrian crosswalks.C) Parking space demarcation lines.C) Handicapped parking symbol markings.
Pedestrian Crosswalks may require a higher degree of demarcation than at typical urbanintersections. One reason is that pedestrians may be crossing roadways at unexpected locations.Another is that motorist attention may be diverted away from the traveled way because ofattempting to locate suitable parking spaces or fellow car-poolers. In addition, more clearlydemarcated crosswalks near transit transfer stations on the site help to better define the station,making it a safer facility.
LandscapingLandscaping is important for aesthetic as well as ecological reasons and helps to better balance thefacility in its surrounding environment. Landscaping which creates a park-like environment was

Florida Department of Transportation Park and Ride Manual7-16
considered important by a FDOT District program administrator. A lot with well-maintainedlandscaping can increase the perception of security while poorly maintained landscaping willcertainly have the opposite effect.
Plantings used at park-and-ride facilities should be clean, long lasting, reasonably decorative, andmost of all, hardy. These plants must be able to tolerate shade, wind, pollution, poor water and soilconditions, and exhaust fumes. Plants with wide-spreading thorns or branches which may snagclothing, as well as plants which drop berries or sap that can damage car finishes should not beused. The results of a considerable research effort into landscaping of transit transfer facilities hasbeen published in •Transit Planting: A Manual• [49] and should be utilized in the landscape designfor a park-and-ride facility.
C) Landscaping should not obscure visibility between the lot and adjacent roadways inorder to maximize perceptions of security.
C) Landscaping should be compatible with the site’s surroundings.C) Plantings and their placement should not interfere with lighting of the facility, the
proper placement of traffic control devices, the ability of pedestrians to use the facility,and the safe line-of-sight of motorists.
C) Trees provide shade and visual interest, reduce glare, and are less costly to maintainthan shrubs and ground cover.
C) The design should minimize places where vandals can hide.C) Landscaping is effective for establishing walking patterns within the site.C) Sufficient set back must be provided so that vehicle overhang does not injure or kill the
plants or block sprinklers. Also, maintenance can take place while cars are parked.C) Extreme care should be exercised in placing plantings near entrances/exits so that sight
distances are not restricted. Plants with limited growth patterns should be used in suchareas so that sight distances do not become restricted as the plant matures.
C) Swales, berms, and mounds provide a low-cost means for providing screening,delineation, visual interest, and drainage.
SecuritySecurity at park-and-ride facilities is best maximized through the site selection. However, there area number of design features which can provide for increased security including:
C) adequate illumination, C) fencing,C) number and location of access points,C) visibility from adjacent roadways,C) selection of construction materials,C) careful design of landscaping,C) minimizing places for vandals to hide on the site,C) selection of the types of amenities located at the site, andC) control over non-authorized use of the facility, e.g., parking trucks, abandoned vehicles,
dumping trash, etc.

Florida Department of Transportation Park and Ride Manual7-17
Boundary IdentificationBoundary identification is important primarily from the standpoint of minimizing unauthorized useof the facility. This is more likely a larger issue for joint use lots than free-standing facilities.Materials which have been used to delineate park-and-ride spaces from adjacent areas includefencing, plantings such as hedges, delineator posts, concrete or bituminous curbs, railroad ties, andconcrete bumpers.
User AmenitiesDesign elements included in the amenities category include trash receptacles, telephones, shelters,bicycle/motorcycle parking areas and newspaper racks. While not considered essential to properfacility design, these elements can improve facility operation and possibly sustain transit patronage[45]. However, there are other considerations which might preclude their installation, namelycapital and operating cost constraints and local conditions.
Trash receptacles, while being an inexpensive means of litter control, can also be abused. Suchreceptacles have been used as an alternative to paid commercial trash removal service. A trashremoval schedule would need to be established with the associated cost included in the annualoperating budget for the facility. Posting regulatory signs indicating penalties/fines for littering havebeen found to be generally ineffective [19].
Telephones provided at park-and-ride facilities can be used for emergencies as well as arranging forprivate auto or taxi pickup. There was some indication from the lot user survey conducted duringthis study that telephones are a desired amenity. Pay phone service would be provided by SouthernBell at no charge if the facility averages 25 calls per day. The other way free service would beprovided is if the local police department requested service and demonstrated a public safety need.Semi-public service can be provided at a cost for other situations. These costs vary by situation butfor planning purposes the installation cost of a booth and phone can be considered to be $150 andthe monthly fee to be $25.
Shelters may be considered at facilities where kiss-and-ride is expected to be significant. Thesestructures provide shelter during inclement weather for car-poolers who are dropped off at thefacility to wait for the carpool vehicle. They can also serve as a central meeting place for a carpoolgroup. For planning purposes, the shelter size requirement can be assumed to be 25 square feet per100 space facility. This is based on the following assumptions: C) Eight square feet per shelter user.
•) The number of kiss and ride drop offs is equivalent to 0.20 times the number of parkingspaces in the facility.
•) The average wait time is 10 minutes.
A discussion of shelter costs and materials can be found in the •Bus Terminal Facilities• sectionabove.

Florida Department of Transportation Park and Ride Manual7-18
Where large concentrations of bicycle or motorcycle traffic is expected, the facility design shouldinclude storage areas for these types of vehicles. The design of bicycle and motorcycle parkingareas should consider identification and accessibility, type of storage racks, lot boundary screeningand protection, and provision of locking devices to prevent casual and professional theft. Whilethere are various types of racks on the market, the designer/specifier should be concerned withdurability, versatility related to placement, and ease of maintenance in making the finalspecification. Space requirements should be based on 2 x 5 stalls for bicycles and 3 x 6 stalls formotorcycles. Parking areas should be close to transfer locations since bicyclists will tend to usefences and building posts which are conveniently located over a distant empty parking rack. Racksshould be separated from roadways by curbs or barriers to prevent accidental damage fromautomobiles. The use of lockers in lieu of or to supplement racks has been thought to encouragebicycle access since they provide a higher level of security [7]. This could be an important designfeature in highly used facilities since lockers could potentially make more space available for autoparking.
The designer needs to consider newspaper racks from the standpoint of controlling where thesedevices are placed. The best location is where people will congregate; bus transfer locations andcarpool shelters. The design of these areas must account for enough space to accommodate thenumber of racks to be permitted.

Florida Department of Transportation Park and Ride Manual8-1
CHAPTER 8: PROMOTION
The impact of promotion on park-and-ride facility use is not well documented; however, it isreasonable to assume that a facility cannot attract users until information about the facility isdisseminated. Further, the park-and-ride clientele cannot be considered static due to mode shifts andchanges in residence and work place. Consequently, a continuing marketing program forpark-and-ride services should be maintained to enhance usage. Promotion of new park-and-ridefacilities can increase usage as well as accelerate the rate of growth in usage and transit revenueswhere service is provided.
The material contained in this chapter was originally presented in Working Paper 4: FacilityAnalysis [2]. Promotional activities can be categorized into four areas:
C) Promotional and informational campaigns to inform the public of a new service orfacility.
C) Continuing programs of information dissemination to provide the public with theinformation needed to make use of services and facilities.
C) Advertising campaigns conducted to increase the public awareness of the social andpersonal benefits of a service or facility.
C) Special transit pass programs to foster fare prepayment and increase transit usage.
An effective promotion program needs to identify the market and determine the most effectivemechanism for communicating the desired information. Relevant promotional techniques forpark-and-ride facilities include the following marketing procedures:
C) Roadside share-a-ride signs.C) News releases.C) Multi-trip transit pass programs.C) Brochures delivered door-to-door to residents within the service area.C) Public service announcements on radio and TV.C) Newspaper advertisements.C) Posters, bumper stickers, and maps showing the location of lots.C) Transit routes and schedules.C) Posters and billboards.C) Brochures distributed to large employers.C) Employer-coordinated activities.C) Telephone information services.C) Internet and World Wide Web postings on transportation-related bulletin boardsC) Direct mail using employee databases
Table 8-1 presents a summary of the contexts in which each of the above techniques are bestapplied. The table presents these contexts in terms of applicable lot size, locational setting of thelot, and transit service requirements. The lot size requirements identified in Table 8-1 indicate thatsome techniques are best considered in relation to promoting •large• lots. This measure is difficult

Florida Department of Transportation Park and Ride Manual8-2
to quantify and is best determined by the agency conducting the marketing effort.Table 8-1. Application of Park-and-Ride Promotional Techniques
Technique Lot Size Setting Transit Service Time Scope
Roadside share-a-ridesigns All sizes Urban or Rural Not required Long term
News releases Large Urban or Rural Not required Short term
Multi-trip transit pass programs All sizes Urban Required Long term
Brochures delivered door-to-door toresidents within the service area
Large Urban Best if provided but notrequired
Short term
Public service announcements onradio
All sizes Urban or Rural Best if provided but notrequired
Long term
Public service announcements on TV Large Urban Provided Short term
Newspaper ads All sizes Urban or Rural Not required Short andLong term
Promotional posters, bumperstickers, and maps showing thelocation of lots
Large Urban Provided Short term
Transit routes guides and schedules Large Urban Provided Long term
Posters and billboards NA Urban NA Short term
Brochures distributed to largeemployers
Large Urban or Rural Best if provided but notrequired
Long term
Employer-coordinated activities Large Urban or Rural Vanpool program and/ortransit established
Long term
Telephone information services NA Urban Not required Long term
Internet/WWW All sizes All Not required Long term
Direct Mail All sizes All Not required Short term
Approximately 40 percent of all Florida facilities have 50 or fewer spaces while 65 percent have100 or fewer spaces [1]. The guiding principal should be that the technique will be most effective ifused for promoting as large a lot as possible. For those techniques where lot size is not applicable,the techniques are used to promote a program, such as carpool matching or transit, wherepark-and-ride may also be incorporated into the promotional campaign. Locational setting refers tourban versus rural facilities. Some techniques are not effective in rural locations and is the result ofa number of factors such as population densities, service area size, and transit service availability.
Florida Department of Transportation Park and Ride Manual8-3
Generally speaking, the techniques presented in Table 8-1 are most applicable when a facility isserved by transit, although this is not always required. Some techniques consist of incorporatingpark-and-ride promotion into transit or rideshare marketing efforts.Suggested principals which should guide in the marketing and promotion of park-and-ride facilitiesare as follows:
C) It should not be assumed that the public knows where park-and-ride facilities arelocated no matter how visible.
C) Coordination of promotional efforts with other programs benefits all programsinvolved. Efforts should be made to coordinate with agencies providingcomplementary services such as transit agencies, carpool matching programs,transportation management associations, and ridesharing programs.
C) Focus the marketing effort on the travel characteristics of the target audience.Employer-directed marketing programs and roadside information signs are based onthis strategy.
C) Focus the promotion effort on the demographic/socioeconomic characteristics of thetarget audience door-to-door marketing campaigns and public serviceannouncements on television follow this principle.
C) Utilize public information channels established by such organizations as MPO’s,transit and transportation authorities, city councils and support committees, as wellas the Florida Department of Transportation. Such organizations may publishperiodic newsletters for public dissemination and will probably includearticles/information related to park-and-ride facilities upon request.
C) Promotion efforts should be consistent with the scale of the facility or service.Effectiveness is directly related to facility size and visibility.
C) Promotion should incorporate both short- and long-term efforts. Short-term effortsare associated with the initial communications which inform the public of a newfacility. Long-term promotion consists of information dissemination directed atcontinually making the public aware of existing facilities and programs.
The following sections describe the park-and-ride promotion techniques presented in Table 8-1.
ROADSIDE SHARERIDE SIGNSThis technique consists of providing phone numbers for carpool matching, ridesharing, and transitagencies on park-and-ride lot guide signs. This supports the facility operation by informing thosemost likely to use it about services which attract facility usage. Agency/program logos should alsobe included on the signs.
This can be considered as an effective long-term, low-cost promotional technique which hasdefinite application to Florida. A common practice found throughout Florida is the erection of signswhich provide only one function: park-and-ride lot locational guidance, carpool matching services,or rail station locational guidance. No examples of signs with both lot guidance and carpool

Florida Department of Transportation Park and Ride Manual8-4
matching phone information were found. The Hillsboro Area Regional Transit Authority includesits logo on all park-and-ride facilities serviced by express bus service.
NEWS RELEASESThese are mainly oriented to the opening of a new facility. The size of the facility should besufficient to be newsworthy. This is a short-term technique intended to inform the public of a newfacility. The public information office for the agency involved in the promotion should beconsulted on the procedures for involving the press, television, and radio news services.
MULTI-TRIP TRANSIT PASS PROGRAMSThis promotional technique is primarily directed at increasing transit ridership and fare prepayment. Most, if not all transit properties in Florida already operate and advertise such a program. Park-and-ride facilities served by transit can benefit from these programs through the increasesresulting from such a program.
A variation of this technique is to institute multi-trip passes offering added discounts for users ofthose transit routes serving park-and-ride facilities.
DOOR-TO-DOOR CAMPAIGNSPromotion through direct mail and hand delivery of brochures should be targeted to the service areaof the facility. This technique is best applied to promoting corridor and urban fringe lots becausethe service areas are usually well defined, limited in size, and tend to provide a greater number ofusers. Approximately 50 percent of the users of such lots come from within two miles of the lot[1]. The campaign should be limited to this area. The technique is less effective in rural locationssince the service area is generally very much larger than for urban area lots. In addition, thepopulation base is typically smaller for rural lots than for urban lots. This technique can be used asa one-time promotion of a new facility or on a continuing basis to promote existing facility. Thetechnique can be more effective if incorporated with the promotion of new or existing transitservice.
PUBLIC SERVICE ANNOUNCEMENTSPublic service announcements are generally applicable to the promotion of urban park-and-ridefacilities because of the transmission areas of television and radio stations. Research conducted inLincoln, Nebraska found that television advertising is more effective and better remembered thanany other form of media campaign, even personal contact at the home [52].The announcements should address the positive aspects of park-and-ride, carpooling, and transitusage. The target audience needs to be made favorably aware of the benefits, both personal andsocietal, to attract new users.
Air time is generally very expensive on commercial networks. Such networks may have publicinformation programs provided free or at a nominal cost to public and not-for-profit organizations.Public television and radio also provide air time for public service announcements and should beutilized to the extent possible.

Florida Department of Transportation Park and Ride Manual8-5
Another cost related to this promotion technique is the cost of making video and audio tapes whichare to be played over television or radio. The broadcasting network may provide this free ifrequested; however, this should not be assumed without investigation.
NEWSPAPER ADSThis technique consists of placing periodic advertisements in syndicated and communitynewspapers. Costs associated with this technique include ad space and production of art work. Thead should consist of promotional verbiage regarding the park-and-ride program along with the otherservice provided by the advertising agency (rideshare programs, transit service) and the informationphone number. An alternative would be to place an ad with information regarding the location of anewly opened facility. This can be a performed on either a short- or long-term basis depending onthe marketing budget.
PROMOTIONAL MATERIALSThese can consist of almost anything imaginable including posters, maps, bumper stickers, caps, teeshirts, pens and pencils, cups, rulers, oversize paper clips, balloons, key rings, etc. Promotionalmaterials are best used in conjunction with special promotional events or employer programs. Thistechnique is normally used on a short-term basis.Unauthorized placement of bumper stickers on private automobiles should not be practiced since itwill result in bad public relations. However, coordinating with local governments and transitagencies to place bumper stickers on their vehicles can be effective.
TRANSIT ROUTE GUIDES/SCHEDULESThis consists of including park-and-ride facility identification on the route guides and schedules forthe local transit system. Park-and-ride facilities should be shown on both the individual route guidesas well as system maps. Some systems describe locations in the written matter on their system mapsbut do not depict these locations on the maps.
POSTERS/BILLBOARDSPosters can be printed and placed in public places such as libraries, government office buildings,parks, etc. Billboard advertising is considered to be a short-term technique because of the costinvolved for the art work and billboard rental. Placement of posters and billboards should be in thevicinity of existing park-and-ride facilities.
EMPLOYER PROGRAMSThe use of this technique will be more effective if coordinated with ridesharing promotionalprograms. The experience with this method is extensive and well documented. The most effectivestrategy is to target large employers and employers in concentrated employment areas such asbusiness parks and CBD’s,
TELEPHONE INFORMATION SERVICEThis consists of providing location information in conjunction with transit route and schedule

Florida Department of Transportation Park and Ride Manual8-6
information services. Observations have shown that (1) users do find out about the programs.
INTERNET/WWW POSTINGSMore and more information is available on the Internet via the World Wide Web. If a RegionalCommuter Assistance Program, TMA, transit operator, or other transportation entity in the Park andRide service area has a Web site, this site could also be used to post maps and information about thepark and ride program.
DIRECT MAIL TO EMPLOYEESUsing the resources of an RCAP or TMA employee database, one can identify potential users of apark and ride system and send them information directly. This can be facilitated through the use ofa GIS [56].

Florida Department of Transportation Park and Ride Manual9-1
CHAPTER 9: PLANNING ANCILLARY SERVICES
The research together with the findings from this study indicate that there are services that can beprovided at park-and-ride facilities which can have a positive impact on facility usage. Theseservices include those which are directly related to the facility operation such as feeder bus service,express bus service, transit loading areas, van- and carpool staging areas, and security provision.The ancillary services also include those which can be thought of as providing a support function tothe users such as day care services, coffee shops, vendor services, and retail shops. The exactresponse of travelers to these various services, excepting maybe transit services, is not wellunderstood by the transportation community. However, the general consensus is that they dopromote park-and-ride and can augment its use by commuters.
The following sections present considerations for implementing the ancillary park-and-ride facilityservices mentioned above. The material contained in this chapter was originally presented inWorking Paper 4: Facility Analysis [2].
TRANSIT SERVICEOften, transit service is the primary reason for establishing a park-and-ride facility. Many of thefacilities in Miami, Tampa, Jacksonville, and Orlando were established to increase system ridershiplevels. Observations of lot usage showed that lots served by transit are the highest used facilities inthe State [1]. These findings furnish strong support for establishing transit service at park-and-ridelots not currently being served by transit. However, transit service does not automatically meanadded facility usage. It is critical that conditions supporting transit are in place in order for increasedpark-and-ride utilization to be realized.
The evidence indicates that lot usage can increase by 100 percent or more with the provision oftransit service between the facility and major employment centers. Findings in Tampa indicate thatthe maximum demand for carpool-only lots is 30 vehicles while this jumps to 75 to 100 vehicles forlots served by transit [l]. Findings from other areas of the United States support these figures. Astudy of park-and-ride facilities located throughout the country found that the maximum usage ofcarpool-only lots was 60 vehicles (averaging 20 to 30 vehicles) while facilities served by transitwere found to contain parked vehicles numbering 150 or more [26].
Three types of transit services are relevant to park-and-ride facilities•feeder bus service betweenthe home and lot, express service between the lot and work destinations, and shuttle service fromactivity center peripheral lots to various destinations within the activity center. Feeder service istypically provided to facilities served by line haul modes such as express bus, urban rail, andcommuter rail. These types of facilities are typically located in urban corridors. Express bus servicehas been found to be implemented at both urban fringe and urban corridor lots in Florida. Shuttleservice pertains to activity center peripheral parking facilities.
Observations indicate that feeder bus service to a park-and-ride facility served by line-haul transitservice accounts for 10 percent of the access trips to such facilities [11]. This suggests that up to a

Florida Department of Transportation Park and Ride Manual9-2
10 percent increase in line haul transit utilization can be expected from the institution of suchservice. This marginal increase may not be large enough to institute new service but may be worthlimited changes to established routes in the area of the park-and-ride facility.
A doubling of usage cannot be considered an automatic result of establishing line-haul service fromthe park-and-ride facility. This type of increase can only occur when the conditions supportingtransit utilization exist. The conditions which should prevail when considering line-haul service at afacility are presented in Table 3-1 under the urban corridor and HOV corridor lot types. Theseconditions include a market size supportive of transit, significant employment concentrations, andsignificant levels of congestion and amounts of traffic.
Shuttle transit services provide access to an activity center from a peripheral parking facility.Shuttle service should be provided when average walking distances are larger than a certainthreshold value; typically a few city blocks or less. For an existing peripheral facility, shuttle serviceshould be considered if utilization is low. For a new facility, shuttles should be planned for if it is toserve a geographically large activity center where walking distances are anticipated to be longerthan • mile.
Shuttle headways on the order of 10 minutes will be required during commuting hours with longerhours applicable during off-peak hours. All-day service should be planned for at a minimum.Phased implementation related to service coverage can be performed as a way to limit expenditureson the service. Tri County Transit in Orlando has done this with its Meter Eater-Downtown Trolley.The success of the Trolley has resulted in increased coverage being instituted with service beingprovided to other trip generators such as apartments and retirement institutions located neardowntown Orlando.
Coordination with the local transit agency will be required in order to establish service to a facility.There are examples in Florida where lots have been built without such coordination. The resultshave been no transit service provision, no lot usage, and the ultimate closure of these facilities. It isstrongly recommended that coordination take place as early as possible in the planning stages of afacility. This should be done to determine if service can in fact be accommodated by the transitagency and what site requirements must be met.
Site requirements for transit relate to geometries, pavement and access. Adequate turning radii,roadway widths and stop areas must be provided to accommodate the anticipated number of transitvehicles. Pavement structures must support the higher wheel loadings produced by transit vehiclesoperating at low speeds. Rigid pavements are recommended for the bus stop area.
Access to the facility is possibly more important than design features in determining if transit canbe provided on the site. The ideal site will be located on an existing route. It should be recognizedthat the transit agency will need to revise route schedules to accommodate the new stop. Reroutinga bus route into a facility will add to the scheduled run time because of the time required to access,stop at, and load and unload passengers at the site. This added time can affect transfer coordination

Florida Department of Transportation Park and Ride Manual9-3
in other parts of the transit system.
In some cases, an existing stop can be eliminated and replaced at the park-and-ride site. The closerthe facility is to an existing route, the easier it will be to make these types of adjustments. Also,providing a stop on the existing route and adjacent to the site can eliminate the access time to thelot. However, this option requires the site to be located on the side of the road which carries themorning inbound traffic.
Another consideration related to direct access of transit to the site is the provision of traffic signals.Signals should be provided for vehicles required to make a left turn across a multilane arterial intothe site. As a matter of operating policy, Tri County Transit in Orlando will not route a bus so that itwill be required to make a non-signal-controlled left turn across a multilane arterial. Coordinationwill need to be made with the jurisdiction responsible for erecting signal controls in order to achieve this objective.
BUS LOADING AREASBus loading areas should be considered for park-and-ride facilities served by transit. The impacts of constructing formal bus stop areas on facility usage is not well documented and is most likelymarginal. One lot in Tampa (Hanley and Commanche) does not have a shelter but was found to behighly used.
Formal bus loading areas are recommended for inclusion in the facility design. Retrofitting requires consideration of the pavement in the area where the stop is to be placed. Rigid pavement should beplaced where vehicles are to stop for the loading and unloading operations. Bituminous pavementis suitable for roadways but should be designed to accommodate the wheel loadings of a transitvehicle operating at slow speed.
A bus shelter should be constructed in the bus stop area. Design specifications were presentedearlier, and design ideas can be found in FDOT’s Pedestrian and Transit Friendly Design manual[57].
VANPOOL/CARPOOL STAGING AREASThe impact of providing staging areas for vanpools and carpools is not well documented and isconsidered to have a marginal impact on facility usage. These staging areas consist of a shelter,benches, and adequate space for dropping off passengers. Two conditions should exist forconsidering the installation of vanpool/carpool staging areas: (1) the facility does not have a transitstop area consisting of shelters and benches, and (2) the facility is large. Existing or planned busstops can also act as staging areas for vanpools and carpools. Consideration for increasing thecapacity of these areas may be required if it is expected that they will be heavily used by vanpooland carpool users.
Installing a vanpool/carpool staging area is most applicable to large facilities since it provides acentral meeting place. However, this may be a nonessential improvement since experience has

Florida Department of Transportation Park and Ride Manual9-4
shown that users tend to meet in prearranged areas in the lot.
SECURITYResults of the surveys conducted during this study indicated that security is one of a number ofcritical factors considered in the decision to use a park-and-ride. The best security measure is tolocate lots in areas considered to be safe from crime. An interview with the Connecticut DOTindicated that their experience has been that lots with vandalism problems are not used in spite ofpatrolling. The lowest parking rates at Metrorail stations in Miami are found in those areasconsidered to have crime problems, and these are patrolled by Metro-Dade Transit security. Basedon these findings, it is safe to assume that no reasonable level of security will produce significantincreases in park-and-ride facility usage.
Nonetheless, security should be a concern of the facility operator. Arrangements need to be made toinsure that security measures are in place and operating at the time of facility opening. Suchmeasures can include closed circuit video cameras, police and security patrols, guards or attendants,and fences. Coordination with the local police or other statutory jurisdiction responsible for securitymatters needs to occur. It should not be presumed that the local police department will assumesecurity responsibilities at the required levels for a park-and-ride facility.

Florida Department of Transportation Park and Ride Manual10-1
CHAPTER 10: EVALUATING PERFORMANCE OF EXISTINGFACILITIES
The current price and availability of fuel together with the huge need for the limited availabletransportation revenues has produced a general de-emphasis in park-and-ride programs around thecountry with the associated low spending levels and manpower allocations [1,54]. This has resultedin the tendency to devote program resources almost totally to new facility development and leaseadministration. However, asconstruction resources get scarcer,more active management of existingfacilities will need to occur.Management activities will includemonitoring and evaluating existingfacility usage, identifying measures toimprove under-and over-utilizationconditions, and considering optionssuch as lot closures and land disposal.In this chapter, a set of performancemeasures and associated criteria arepresented for use in determiningwhether a facility is successful,unsuccessful, marginal, or isexperiencing operational problems.Department actions related tosuccessful lots include doing nothingand capacity expansion. Actionsrelated to unsuccessful and marginallots include revision of ancillaryservices or promotion, lot closure, andlot disposal.The material contained in this chapterwas originally presented in WorkingPaper 4: Facility Analysis [2].PROCESS OVERVIEWFigure 10-l presents an evaluation process for assessing lot performance and determining theresultant actions which might be taken to correct any operating deficiencies. The first step consistsof collecting the primary data required to evaluate the performance of individual lots and to makeassessments of success levels. These preliminary performance evaluations are performed in thesecond step of the process. The third process step consists of the collection of additional data. Thiseffort is focused on specific data elements required by the findings of the preliminary facilityassessments. The final step of the evaluation process is concerned with evaluating the candidateoptions for each site considered to need remedial action.
Figure 10-1: Evaluation Process

Florida Department of Transportation Park and Ride Manual10-2
PRIMARY DATA COLLECTIONThe primary data collection effort should be part of a continuing performance monitoring programthe purpose of which is to assemble basic information which can be used to assess the level ofperformance of all facilities in the inventory on a continuing basis.
These data are generally assembled by technicians. The specific data elements are summarized inTable 10-1 and include:
C) Number of short-term, long-term, and handicapped spacesC) Number of parked vehicles in short-term, long-term, and handicapped spacesC) Number of illegally parked vehiclesC) Pavement condition inventoryC) Traffic control device inventoryC) Number and types of complaintsC) Number and types of accidents related to the park-and-ride facilityC) Inventory of land use on property adjacent to the siteC) Accessibility of facility to transit
The number of spaces and parked vehicles are used to compute facility utilization. The collection ofthe number of spaces must be carefully performed. Results of the facility inventory work performedduring this study showed that all spaces at joint use lots tend to be included in the space counts eventhough not all spaces are eligible for use by park-and-ride vehicle parking. This has the effect ofunderstating utilization and can give a false reading regarding the level of success of a facility. Thefield survey technicians will need to be given special instructions in order to obtain the correctnumber of spaces for these types of facilities.
The suggested frequency for collecting utilization data as shown in Table 10-1 is recommended todetermine the fluctuations in usage over the year and to gain an accurate assessment of actual usage.The counts should be scheduled preferably between Tuesday and Thursday but Monday is alsoacceptable. Counts should not be scheduled for Fridays because utilization has been observed todrop dramatically on this day of the week. It is recognized that some agencies do not collect thisinformation at all since it is not used to evaluate facility performance. One suggestion is tocoordinate parking counts with Traffic Statistics so that they can be performed more reasonably atthe times that traffic counters are being placed near park-and-ride facilities. A good historical recordof parking counts is critical to securing bond financing.

Florida Department of Transportation Park and Ride Manual10-3
Table 10-1. Performance Evaluation Input Data SpecificationData Element Evaluation Type Collection Frequency Unit of Measurement
Spaces by type1
Capacity On file Number
Parked vehicles byspace type
1Usage 2 to 4 times annually Number of vehicles
Illegally parkedvehicles
Capacity 2 to 4 times annually Number of vehicles
Pavementcondition
Maintenance Semiannually Extent/severity of cracking,potholes,raveling,patching, rutting, spelling, etc.
Traffic controldevice inventory
Safety Same frequencyas counts
Type and condition both on and off site
Complaints Capacity, safety,maintenance,illegal parking
Continuing, Summarizedannually
Number by type
Accidents relatedto the facility
Safety Once per year Accidents by type
Adjacent propertyinventory
Expandability Annually Land use typeand amount
Accessible transitservice
Serviceadequacy
Once per yearor as required
Type(s) of service, stop locations
1Space types include long-term,short-term, and handicapped
Counts of illegal parking is a subjective assessment. Tell-tale indications include posted for salesigns, commercial vehicles, junk autos, and single vehicles which are conspicuously parked invacant areas of the park-and-ride facility. Interviews with the maintenance office responsible for thefacility can also assist in identifying the incidence of illegal parking.
Pavement conditions data should be collected by trained and experienced evaluators. Assessmentswill need to be made on the extent and severity of the various factors which can be analyzed todetermine maintenance requirements of the base and pavement structures.
The inventory of traffic control devices will actually be used to assess the adequacy of access andinternal circulation control and safety. The inventory should include off-site devices which affectvehicles accessing the park-and-ride facility.
A log of complaints should be kept and summarized on an annual or more frequent basis. Such alog can be an effective means of identifying problems at a facility which would otherwise bedifficult to identify. A number of different agencies in the locality including county public works,

Florida Department of Transportation Park and Ride Manual10-4
county and city traffic engineer, as well as different offices within the Department, such asmaintenance, traffic operations, and planning may receive complaints. Coordination with theseagencies and offices should be effected to attain an accurate assessment of possible problems.
Accident data should be collected on a scheduled, preferably annual basis. These data are used toassess safety problems related to facility access and egress. With the latest change in policereporting requirements, low-value property-damage-only accidents may not be contained in thepolice reports. Complaints received by the Department may help to isolate safety problems.Interviews with the police department having jurisdiction in the areas where park-and-ride facilitiesare located can aid in assessing traffic safety problems.
Information related to the types of land use adjacent to the facility will not be needed until after theperformance evaluation stage of the process. However, this information should be collected at thetime the utilization counts are performed for the sake of efficiency. The inventory should extend upto 1000 feet away from the facility with this distance depending on the location and size of theexisting facility. An accompanying sketch is recommended.
The facility should be investigated for transit service. Contacting the local transit agency willprovide the most accurate Information. Information required includes the type of transit serviceprovided such as local or express service, and placement of bus stops. Notes regarding bus stopamenities should also be taken. Stop locations both on and adjacent to the site should be noted.
PERFORMANCE EVALUATIONSPerformance evaluations conducted on an annual basis are recommended to assess the level ofsuccess of each facility in the system. The results will include the determination that the facility is:
C) under-utilized and should possibly be closed or disposed of,C) operating marginally well but could possibly experience higher usage with some
modification in supporting facilities or services,C) is operating well but experiences an important deficiency in operation which should be
corrected, orC) operating adequately with no further actions required,C) over-utilized and requires corrective action,
Table 10-2 presents performance measures and associated operating standards which are useful inmaking the above determinations. The intent of this evaluation is to determine if corrective actionsare warranted and if further investigations are necessary.
The performance measures suggested at this level of analysis are relatively straight forward sincethey are used to trigger additional studies as required. In spite of this, those measures shown inTable 10-2 must not be used solely at face value. Percent utilization has been found to not alwaysreflect actual conditions, particularly at joint use lots. Low utilization percentages can result fromincluding non-park-and-ride spaces in the space counts. High utilization percentages can be derivedfrom counting illegally parked vehicles or vehicles associated with use of other services located at

Florida Department of Transportation Park and Ride Manual10-5
the joint use lot. Every effort must be taken to accurately collect meaningful data at the site.

Florida Department of Transportation Park and Ride Manual10-6
Table 10-2. Performance Evaluation Criteria
AssessmentPerformanceMeasure Suggested Operating Standard Potential Corrective Actions
Unsatisfactoryoperation
Parked vehiclesPercent utilization
<10 vehicles<10 percent
CloseDispose
Marginaloperation
Parked vehiclesPercent utilization
10-20 vehicles10-60 percent
Added transit service TransitamenitiesAdded promotionImprove accessImprove security
Operatingdeficiency
Complaints Number based on nature ofcomplaints
Based on nature ofcomplaints
Accidents/trafficsafety
>1 per year Traffic engineering measures
Pavementconditions
Unsatisfactory Patch, repave or reconstruct
Signing conditions Unsatisfactory Replace, add new signs
Illegal parkers >3 per month Increase enforcement
Security >1 incident per year Increase enforcement
Satisfactoryoperation
Parked vehiclesPercent utilization
>20 vehicles60-80 percent
Over-utilized Percent utilizationFacility size
>80 percent>30 spaces
Modify geometrics, striping
Expand
Construct on new site
NOTE: See text regarding the use of utilization for facilities which have been Intentionally over-designed.NOTE: May it also be noted that performance evaluation criteria is dependent on lot type.
Two performance measures, number of vehicles and percent utilization, are suggested for this levelof evaluation. Percent utilization alone does not accurately reflect actual operations. For example,low utilization values can be produced at a large facility even though a large number of vehicles areparking. Consequently, the number of vehicles parked combined with percent utilization provides amore realistic assessment of operational performance. These values must be reviewed in the light ofagency development policies. Low utilization may be a designed feature of a facility where future
Florida Department of Transportation Park and Ride Manual10-7
demand is expected to increase or where fuel emergency contingency planning is practiced.
The suggested operating standards shown in Table 10-2 serve as threshold values for determiningthe operating status of a park-and-ride facility. The investigator must use discretion in using thesestandards. Conditions at the site as well as the policies of the operating agency must be considered.For example, some jurisdictions consider utilization of only one vehicle enough to keep a facilityopen and operating. Others believe that only 10 to 20 vehicles using a facility does not warrantcorrective actions. In the Tampa area, 100 percent additional capacity is constructed to account forfuture growth in usage and as a contingency for possible fuel crises.
SITE-SPECIFIC DATA COLLECTIONFollowing the performance evaluations, additional information will be needed to determine thefeasibility of implementing corrective actions at facilities appraised as needing them. Thisinformation will be site- and problem-specific and will generally be developed by professional-levelstaff. Table 10-3 presents the data required which include:
C) Projections of facility demandC) Projections of future land use in the market area(s) of the facilityC) Costs of right-of-way in the areaC) Site design plansC) Transit schedules and system maps•) Level of service conditions on access roadsC) Inventory of traffic control devices in vicinity of the site

Florida Department of Transportation Park and Ride Manual10-8
Table 10-3. Input Data Specification for Site EvaluationsData Element Corrective Action Evaluation
Demand projections ExpansionClosureDisposal
Capacity needs
Land use projections in marketareas
ExpansionClosureDisposal
Capacity needs
Planned/programmedimprovements
Disposal Coordination of improvements
Right-of-way costs ExpansionDisposal
Expansion costValue capture
Site design plans Service modificationFacility modification
Circulation adequacy Transit amenitiesTraffic control
Transit schedules and system maps Transit service modification Added usage generated by new/improvedservice
Traffic operations on access roads Access modificationSafety modification
Road capacity expansion Safetyimprovements
Traffic control device inventory Access modificationSafety modificationSigning improvements
Adequacy of traffic control
Not all of the information shown in Table 10-3 will need to be collected in all situations. This isbecause the data will be used to assess the feasibility of implementing specific measures at specificpark-and-ride facilities. In addition, some of the information, such as facility design plans andinventories of traffic control devices, should already be on file.
Projections of future facility demand and/or land use in the service area of the facility underinvestigation will be useful in determining future capacity needs. The same concepts andprocedures for estimating demand as presented in Chapter 4 above can be used. Detailedprojections of lot demand will be the most accurate; however, a simpler approach is to define themarket areas (as per Chapter 4) and accumulate the traffic analysis zone data for the current andfuture years. A simple trend computation can add valuable insight into the potential capacity needs.However, this must be tempered with conditions at the site which may deter use.
An inventory of planned and programmed transportation improvements is needed to determine thefuture need of the facility under investigation. Such improvements may make an otherwise useless
Florida Department of Transportation Park and Ride Manual10-9
facility valuable in future years and can aid in the decision to maintain it. Sources of thisinformation includes the area’s Transportation Improvement Program (TIP), Long-RangeTransportation Plan, and work programs for those jurisdictions which are not included in the localTIP.
Right-of-way cost data will be needed only in circumstances where facility expansion or disposal isbeing considered. These data will aid in making assessments related to expanding the exitingfacility on adjacent property, constructing a new facility on a new site, the potential value return,and the feasibility of a higher and better use of the land.
Site design plans are needed to assess the types and feasibility of geometric and circulationimprovements. Final plans or as-built plans should be available and on file.
Transit schedule and coverage information is used to determine the level of transit service and theaccess provided by transit from the park-and-ride facility to major destination areas.
Congestion on access roads to a park-and-ride facility can be a significant deterrent to utilization.Traffic operations data including traffic counts, intersection layouts, road section and intersectioncapacities, and signal timing information will be needed to assess congestion levels and their impacton lot usage.
Accident data and traffic control device inventories were recommended earlier to be included in anon-going data collection program. These data will be important in developing solutions to safetyand traffic operations problems adjacent to park-and-ride facilities assessed as having operatingdeficiencies. The required data includes accident information of sufficient detail to produceaccident diagrams, and placement and condition of traffic control devices including assessments ofvisibility and legibility.
ANALYZE SOLUTIONSThis step in the process has two purposes. First is to gain a full understanding of the problems at thefacilities assessed as requiring further investigation in the preliminary performance evaluation stage.As mentioned above, problems can range from no utilization to over-utilization and can includeoperating deficiencies such as hazardous access, poor access, and poor maintenance. The secondpurpose is to identify feasible solutions to rectify the operating problems at each site. Possiblesolutions range from do nothing to increased promotion to new construction.
An important initial activity in defining the course of corrective action for a park-and-ride facilitywas described in the previous section. The fact finding effort concentrated at the site underinvestigation will most often lead to conclusions concerning the operation of the facility whichotherwise would not be understood through a desk survey. Access, security, traffic operations, andsafety problems can be better defined through the field investigation.
The tables in this section were developed to aid in the identification of effective actions to execute

Florida Department of Transportation Park and Ride Manual10-10
in response to site-specific operating problems. These are discussed below in relation to theparticular category of problem.
Unsatisfactory OperationTable 10-4 shows the conditions for those actions appropriate for sites which are so under-utilizedthat there is no positive course of action to execute. The listed conditions should exist in order toconsider closure of a facility. Closing and vacating a facility are significant acts. Any existing userswill be negatively, and possibly significantly impacted. Closing a facility acknowledges the uselessinvestment of public funds in developing the site. Vacation means the site can not be used in thefuture without repurchase at possibly a much higher price. Numerous agencies around the countrywere found to very infrequently close and almost never dispose of an existing facility because of thepreceding considerations [53].
Table 10-4. Conditions for Lot Closure and DisposalAction Conditions
Close site and hold for futureuse
C) Feasible to relocate existing users to a more cost-effective location.C) Demand not expected to increase in the near future.C) Other corrective actions will not produce significant usage increases.C)Alternative uses are implementable.C)Right-of-way required for future improvement project.C)Soft real estate marketC)Site size/configuration not suitable for resale.
Dispose of property C) Low probability of future growth in usage through development orincreased congestion.
C) Right-of-way not required for future improvements.C) Alternative uses not attractive.C) Commercial/industrial zoning.C) Site size/configuration appropriate for developmentC) Vandalism/assault problems not correctable.C) Future transit service highly unlikely.
The decision to close a facility should be based on two factors: inability to implement correctiveactions which could improve usage and ability to provide alternative parking for any existing users.Once the decision is made to close a facility, the next decision consists of opting to hold the facilityin public ownership or disposing of it. If demand is expected to increase in the future or if theproperty is needed for future transportation improvements, the lot should be held. Use of the facilityfor other purposes should be considered. For larger lots, partial closure may be an attractive optionto full closure. An example is the Yukon Street transit terminal in Tampa. This facility consists of306 spaces, approximately half of which are fenced off to restrict public access. This closed area ofthe facility is used by the local transit property and ambulance services for driver training.
Marginal OperationTable 10-5 shows the actions and related conditions which are appropriate to sites assessed as

Florida Department of Transportation Park and Ride Manual10-11
having low usage which can be improved. Actions which have been suggested to have a positiveimpact on usage include:
C) New or increased transit usageC) Access improvementsC) Increased securityC) Construction of transit amenities such as stops and sheltersC) Improved promotion
Table 10-5. Conditions for Corrective Actionsat Marginally Operating Facilities
Action Potential Usage Increase Conditions
Added TransitService
1/2 to 1 percent increase per 1 percentimprovement in frequencyPotentially 100 percent increase with new service
Market area supportive of transit.Area planned for express service.Congested access to majordestination area.Existing headways greater than 15minutes.
Access Improvement 50% increase per 5 minute improvement in accesstimes.
Congested access roads to park-and-ride facility.Heavily traveled corridor with majordestination area.Site is visible and otherwiseappears attractive.Market area not serviced by otherpark-and-ride facilities.
Transit Amenities Indeterminable, probably slight Other improvements planned forfacility.
Improved Security Slight unless full-time security is provided Security problem existsPeripheral facility adjacent to areawith under supply of parking
Promotion Less than 10 % In conjunction with special transitpromotion programs.Characteristics of origin marketinfluence area supportive ofpark-and-ride.Congested commuting corridor.
The effects of transit amenities are uncertain but are thought to be slight. It is suggested that the bestapproach is to implement such improvements in conjunction with other actions such as new transitservices, promotional events, or lot beautification.

Florida Department of Transportation Park and Ride Manual10-12
The conditions shown in Table 10-5 should exist to consider the associated corrective actions forimproving usage of a facility assessed as marginal in the preliminary performance evaluations. Twoof the actions shown in the table have an indeterminate impact on usage and are probablynegligible. The findings of the survey work conducted during this study indicated that a facility witha security problem will most likely never be used to its full potential unless full-time security isprovided. It has been found that crime will only temporarily decrease with added patrolling. Thebest implementation appears to have the facility placed on the normal patrol route of the localenforcement agency so that it receives frequent patrolling every day. It must be assumed that crimewill approach the previous levels once patrolling has been curtailed or discontinued.
Critical Operating DeficiencyOperating deficiencies at otherwise satisfactory park-and-ride facilities include security, pavementand traffic control device maintenance, accidents, poor circulation, and illegal parking. Some ofthese problems are associated with increased liability exposure and should be corrected at theearliest opportunity. Identification of these problems will come from analysis of the field data aswell as from complaints for users and neighbors.
Over-UtilizationTable 10-6 presents a set of actions which should be considered for responding to over utilization ofa park-and-ride facility. Over-utilization can discourage usage because of the uncertainty of findinga parking space. Except in very limited situations, the motoring public will not significantlyincrease vehicle occupancies to access a lot in response to over-use. Table 10-6 defines theconditions and consideration related to each of 15 possible actions related to providing additionalcapacity to an over-used facility. Some actions will not add significantly to capacity but may beacceptable as a result of low additional capacity needs and cost considerations.
Actions related to revising parking fees requires that fees can be legally adjusted. Bonded facilitiesmay not have this option available. In addition, these actions should be implemented as a means toshift parkers to near-by, under-utilized facilities. It is better to reduce fees at the near-by facility inconcert with promoting the lower fees as compared to raising fees at the over-used lot.
An important consideration of constructing a new facility is the feasibility of providing transitservice. Coordination with the local transit agency will be required to determine if such services arepossible. Similar service as exists at the over-crowded facility should be instituted at the new one.

Table 10-6. Over-Utilization Solution Evaluation MatrixSolution
AlternativeCost Added
CapacityLotSize
Existing DesignFeatures
Right-of-wayConditions
OtherConditions
Eliminate Illegal Parking Low < 5% Small na na Illegal Parkingexists
Reduce Stall Widths Low < 5% Small >=9’ wide stalls na Adequate aislewidths (28’optimal)
Standard-size To Compact-size StallConversion
Low Up to 10%w/ 50%
converted
Moderateto large
No compact-sizestalls
na Large percentageof compacts
Reorient Stalls From Angle To90-Degrees
Low < 8% Large Angle parkingexists
na
Replace Design Features With Stalls Low 5 to 20% Moderateto large
Berms, aisle endislands adequate
for conversion
na
Reduce Parking Charges at CompetingFacilities
Low Large Moderateto large
na na Adjustment ofcharges legal
Increase Parking Charge Low Large Moderateto large
na na Adjustment ofcharges legal
Reorient Aisles to Long Dimension ofLot
Low 10 to 20% Moderateto large
na na Length/width ratio> 1.5
Reduced Parking Charge for ArrivingCarpools
Low Moderate Large na Adjustment ofcharges legal
Preferential Parking for Carpools Low capitalHigh operating
Low Large na na Best used whereattendant feecollection exists
Satellite Parking with Shuttle Service Capital low tohigh, operating
moderate
Large na na AffordableROW available
Rail service at siteNew site nearhome end of trip
Expand on Adjacent Land High 10+% na na AffordableROW available
Acceptable soilconditions
Expand Within Existing Right-of-Way High 1O+% na na ROWAvailable
Acceptabledrainageconditions
New Site Low to high 10+% na na AffordableROW available
Near existingfacilityGood access andvisibility
Structure on Existing Site Very High 50+% Large na na Site size andconfiguration

Florida Department of Transportation Park and Ride Manual11-1
CHAPTER 11: PROGRAM PERFORMANCE EVALUATIONS
This chapter presents a set of performance measures relevant to monitoring a park and rideprogram. Procedures for estimating these measures as well as descriptions of input data and data sources are also presented. The performance measures presented herein are useful for:C) assessing impacts and user benefits produced by the program,C) monitoring progress in constructing park and ride lots,C) assessing program effectiveness,C) assessing lot maintenance needs, andC) preparing annual budget requests.
The material contained in this chapter was developed from Working Paper 2: Program Analysis[54 ]. Reference to that document should be made for the supporting research that is not includedhere.
A performance matrix is presented in Table 11-1 that considers the program level and the area ofapplication. Program levels include statewide, district and local scopes of responsibility.Application areas include impact assessment, program assessment, management, and budgeting.Easily applied procedures for calculating the performance measures in this matrix are described.These procedures are consistent with the systems-level of analysis to which they apply.
The evaluation measures and procedures presented below were developed from surveys of local,regional and state programs in Florida; interviews with program administrators in other parts of thecountry; and findings from the literature.
The performance measures relate to four basic application areas which include assessment ofprogram impacts, program effectiveness, program management, and program budgeting. Thefollowing sections presents the contexts in which program-level performance evaluations areperformed. These are followed by a table of performance measures applicable to program-level evaluations.
APPLICATION AREA DESCRIPTIONSThe following descriptions address the issues that are typically considered during programevaluations. These issues relate to four categories of application including:C) Assessments of impacts accrued by the programC) Assessments of program effectivenessC) Management of program components including production, maintenance, and liabilityC) Program budget preparation
These application areas vary by the level of government in which the evaluation is beingconsidered. The Statewide Park & Ride Program is primarily concerned with funding, statewideimpacts and benefits, improving coordination within the Department, management, and technical

Florida Department of Transportation Park and Ride Manual11-2
support. The FDOT District offices tend to be concerned with facility development andmanagement. Local transit agencies are concerned with issues related to enhancing ridership andproductivity of the transit system.
Impact AssessmentsThese evaluations are performed to understand the level of impact that the park-and-ride programhas on transportation operations, economic factors, and the environment. Relevant performancemeasures relate to the objectives of the agency in which the evaluations are performed. Theseobjectives can relate to increasing transit usage, reducing vehicle miles of travel, increasing autooccupancies, decreasing fuel consumption, increasing carpool formation, attaining air qualitystandards, and many others. Typical questions which might be addressed by impact assessments atthe program-level include:C) How many commuters are benefiting from facilities provided by the program systemwide?C) What are the state- or district-wide impacts resulting from the program?C) Have increases in auto occupancy been realized as a result of the program?C) What systemwide air quality impacts have been produced?C) What savings in fuel consumption have been realized systemwide?
Program AssessmentThese evaluations are aimed at assessing the effectiveness of the park-and-ride program. Sinceeffectiveness is the primary issue, performance measures must relate to dollar expenditures or someother unit of program cost. Typical questions which are addressed include:C) What level of production is the program achieving?C) What level of benefit is the program achieving?C) What benefits have accrued from the accomplished production?C) How effective has the production been?C) What are the benefits of one implementation action over another?
ManagementPerformance measures applied to program management evaluation should reflectmanagement-related concerns like production and productivity of the various operating componentsof the program including:C) Production levelsC) Maintenance productionC) Liability costsC) Inter- and intra-agency coordinationC) Security
BudgetingAs mentioned in the discussion of the survey results, justification of park-and-ride program budgetsis generally not performed. Typically, the only justification consists of defining the functions of theexisting positions and specifying the related labor costs. This type of budgeting process willpossibly change in the future, either as the result of more funds becoming available or from

Florida Department of Transportation Park and Ride Manual11-3
additional funding constraints. Additional funding creates a need to determine the actual positionswhich should be added to the budget and the benefit which accrues from them. Imposition offunding cutbacks requires additional justification to maintain current staffing levels.
PERFORMANCE MEASURESTable 11-1 presents a set of performance measures relevant to program-level analyses. The tableshows the application area, scope of analysis, input data required, and source of data for eachperformance measure. The use of these measures would generally be on a systemwide basis. Forexample, computation of vehicle miles of travel for assessing the impacts associated with aprogram would be computed based on all facilities in Florida, the District, or the local areadepending on whether the Statewide, District or local park and-ride agency is performing theevaluation. In spite of this, the identified measures relevant to impact assessments could also beapplied at a facility level of analysis. However, site-level analyses should be performed at a muchgreater degree of detail then that proposed here for program-level evaluations.

Table 11-1. Program Performance MeasuresMeasure Application
AreaScope of
ApplicationInformation/Data Information/ Data
SourceAnnual VMTreduction
Impactassessment
StatewideDistrictLocal
Parked vehicles by lottypeLot/destination averagetrip lengths
Inventory/ surveySee Table 11-2
Annual user costsavings
Impactassessment
StatewideDistrictLocal
VMT reductionOperating cost per VMT
CalculatedSee Table 11-2
Change invehicleoccupancy
Impactassessment
StatewideDistrictLocal
Parked vehiclesBefore/after pervehicleoccupanciesLot/destination modeshares
Inventory/ surveySee Table 11-2
See Table 11-2
Annual fuelsavings
Impactassessment
Statewide DistrictLocal
VMT reductionAvg. fuel consumptionrates
CalculatedSee Table 11-3
Annualemissionsreduction
Impactassessment
StatewideDistrictLocal
VMT reductionAvg. emission rates
CalculatedSee Table 11-3
Increase intransit ridership
Impactassessment
StatewideDistrictLocal
System ridership
P&R route ridership
Local transit agencyLocal transit agency
Increase intransit revenue
Impactassessment
DistrictLocal
System revenue
P&R route revenue
Local transit agencyLocal transit agency
Value ofaccidentsreduced
Impactassessment
StatewideDistrictLocal
VMT reductionAvg. accident rate by typeAvg. economic value byaccident type
CalculatedFlorida Departmentof Transportation ratesFatality =$220,000,Injury =$9,300,PDO =62,000
Lives saved Impactassessment
StatewideDistrictLocal
VMT reductionFatalities per VMT
CalculatedFDOT rates
Annual VMTreduction perprogram dollar
Programassessment
Statewide DistrictLocal
Lots by typeLot/destination avg. trip bylot typeBefore/after autooccupancies
InventorySee Table 11-2
See Table 11-2Annual user costsavings perprogram dollar
Programassessment
Statewide DistrictLocal
VMT reduction Operatingcost per VMTProgram costs
P&R implementationofficeP&R implementationofficeP&R implementationoffice
Annual fuelsavings perprogram dollar
Programassessment
Statewide DistrictLocal
VMT reductionAvg. fuel consumptionrate Program costs
CalculatedSee Table 11-3 P&Rimplementation office
Annualemissionsreduction perprogram dollar
Programassessment
Statewide DistrictLocal
VMT reductionAvg. emission ratesProgram costs
CalculatedSee Table 11-3 P&Rimplementation office

Florida Department of Transportation Park and Ride Manual11-5
Table 11-1. Program Performance Measures (Continued)Measure Application
AreaScope of
ApplicationInformation/Dat
aInformation/ Data Source
Increase intransit ridershipper programdollar
Programassessment
StatewideDistrictLocal
System ridershipP&R routeridershipProgram costs
Local transit agencyLocal transit agencyP&R implementation office
Increase intransit revenueper programdollar
Programassessment
StatewideDistrictLocal
System revenueP&R routerevenueProgram costs
Local transit agencyLocal transit agencyP&R implementation office
Change inpassengers perrevenue mile
Programassessment
StatewideDistrictLocal
System ridership P&Rroute ridershipSystem revenuemilesRoute revenuemiles
Local transit agency
Value ofaccidentsreduced perprogram dollar
Programassessment
StatewideDistrictLocal
VMT reductionAvg. accidentrate by accidenttype Avg.economic valueby accident typeProgram costs
CalculatedSee Table 11-2
See Table 11-2
P&R implementation officeDollar value ofprogrammedP&R projects
Budgeting DistrictLocal
Work programTIP
Agency programming officeMPO
Leaseadministrationman-hours
Budgeting DistrictLocal
Internalestimates
Responsible agency
Number ofcongestedcorridors withP&R application
Budgeting District AdoptedPlanningdocuments
MPO, RPC or other localplanning agency
Areasconsidered forexpress busimplementation
Budgeting Local Internalassessments
Responsible agency
Programmedspaces perprogram dollar
Budgeting DistrictLocal
Work programPast productionhistory vs.programbudgets
Internal records
Programmedfacilities perprogram dollar
Budgeting DistrictLocal
Work programPast productionhistory vs.programbudgets
Internal records

Florida Department of Transportation Park and Ride Manual11-6
Measure ApplicationArea
Scope ofApplication
Information/Data
Information/ Data Source
Per space cost offacilitydevelopment
Productionmanagement
DistrictLocal
ConstructioncostsLease costs
Construction managementoffice Operations/budget/fiscal office
PD&E roadwayprojectsreviewed by P&Roffice
Productioncoordinationmanagement
StatewideDistrict
Number ofprojectsreviewed andnotreviewed atPD&E stage
ProgrammingInternal records
Percent of totalPD&E projectsreviewed by P&Roffice
Productioncoordinationmanagement
StatewideDistrict
Number ofPD&E projectsreviewed andnot reviewed
Programming Internalrecords
Number of JPA’ssigned
Implementation management
StatewideDistrictLocal
Number ofsigned JPA’s
Contracts office
Total and perspace value ofclaims
Riskmanagement
DistrictLocal
Value of paidclaimsNumber ofspaces
Budget/fiscal officeInventory
Total and perspace number ofclaims
Riskmanagement
DistrictLocal
Number of paidclaimsNumber ofspaces
Budget/fiscal officeInventory
Total and perspace tons ofmix used infacilityrehabilitation
Maintenancemanagement
DistrictLocal
MaintenancerecordsNumber ofspaces insystem
Maintenance officeInventory
Distribution ofspaces bypavementcondition index
Maintenancemanagement
DistrictLocal
Conditionindices Numberof spaces
Maintenance officeInventory
Number ofunauthorizedparkers onexisting facilities
Maintenancemanagement
DistrictLocal
Counts Office responsible for counts
Maintenancecost of illegalparking inunauthorizedlocations
Maintenancemanagement
DistrictLocal
Maintenancecosts
Maintenance office
Number of policereports byincident type
Securitymanagement
DistrictLocal
Police reports Police department
NOTE: TIP = Transportation Improvement ProgramP&R = Park-and-ride
MPO = Metropolitan Planning OrganizationRPC = Regional Planning Council
PD&E = Project Development and Environmental

Florida Department of Transportation Park and Ride Manual11-7
NOTE: P&R = Park-and-ridePD&E = Project Development and Environmental
JPA = Joint participation agreement
The data specified in Table 11-1 reflects the high level at which program evaluations are performed.These data are easily collected, easy to understand, and are input to computation processes whichcan be executed quickly and simply using system averages instead of site-specific data. Thejustification for this approach and level of analysis is time. As an example, the computation ofstatewide fuel savings associated with park-and-ride implementation would be prohibitively timeconsuming if site-specific computations were conducted. Such computations would includedeterminations of the change in operating speeds from each lot to final destination, the trip lengthfrom each lot to associated destination, fuel consumption rates at the before and after operatingspeeds, and the resultant impacts on fuel consumption. A more appropriate approach forprogram-level evaluations would be to use easily acquired data, such as number of parked vehicleswhich should be contained in an up-to-date inventory, and to apply average trip lengths and fuelconsumption rates.As can be seen, the data source column for a number of performance measures refers to Tables 11-2 and 11-3 which are presented below. These tables contain statistics derived from observation ofactual lot use in Florida [1]. The statistics consist of system average trip lengths, vehicleoccupancies, vehicle operating costs, mode shares, and accident rates classified by lot type; andaverage fuel consumption and vehicle emission rates.
Table 11-2. System-Average Trip Lengths, Occupancies andOperating Costs for Park-And-Ride Facilities
Urban Corridor Peripheral Urban Fringe Remote
Auto Occupancies(persons/vehicle ):Before HBW 1.20 1.20 1.35 1.35After home to lot 1.14 1.15 1.28 1.17After lot to work 3.17 2.43 3.21 4.17
Average Trip lengths (miles):Home to lot 3.3 12 3.3 7.9Lot to work 17.2 1 16.1 33.1
Auto Operating Cost ($/1000 Vehiclemiles):
206 204 206 134
Annualization Factor: 233 226 213 233
Mode Shares from Lot to WorkDestination:Carpools 5 or 201 38 64 100Transit 20 or 801 62 36 0
Accident Frequency(per million VMT):
2
Fatality3 0.0264 0.032 0.02644 0.019Injury3 1.8384 2.650 1.83844 1.025Property-damage-only 10.2764 16.523 10.2764 4.028

Florida Department of Transportation Park and Ride Manual11-8
(Reference 1 unless noted)1For lots with transit service. Use 100 percent carpools for facilitiesnot served by transit. Use 5% carpool/95% transit for rail lots. Use
20% carpool/80% transit for express bus lots.2(Reference 31)
3Values represent number of person involved, not accidents.4Assumes 50% freeway travel and 50% arterial travel.

Florida Department of Transportation Park and Ride Manual11-9
Table 11-3. System-Average Fuel Consumption andVehicle Emission Rates
Vehicle Emissions (Tons/million VMT)Planning
Year Fuel Consumption
(Gallons/1000VMT)
CO HC NOX TOTAL
1985 48 39 5 4 481990 38 25 3 3 311995 36 18 2 2 232000 36 15 2 2 192005 36 15 2 2 192010 36 15 2 2 19
(Reference 2)
The following definitions are provided for categorizing lots by functional type:C) Urban Corridor•Lots located along a major commute corridor within an urban area which are
served by line-haul transit such as express bus, urban rail, or commuter rail services. Triporigin patterns tend to be dispersed along the corridor. Trip destination patterns may bedispersed along or concentrated at one end of the corridor.
C) Peripheral•Facilities typically located at the periphery or fringe of an intensely developed,highly congested activity center. The access distances to the lot are typically longer than othertype facilities while egress distances from the lot to the activity center are usually shorter.
C) Urban Fringe•Lots located at the fringe of urban development. Trips tend to originate outsideor at the outer limits of the urban area while destinations may be concentrated or dispersedwithin the urban area. Fringe area lots are generally not served by transit.
C) Remote or Rural•Lots located outside the urban area generally in a rural or small town setting. Trips lengths, for both home-to-lot and lot-to-work legs of the commute trip are muchlonger than lots of other types.
Most of the performance measures presented in Table 11-1 can be computed in a straight forward manner. However, calculating values of a number of these measures should be explained. These are primarily related to the impact assessment measures. Procedures for computing these are presentedin the concluding sections of this chapter.
VMT ReductionThe VMT reduction value is used to compute a number of other performance measures includingthose related to user cost savings, fuel consumption, vehicle emissions, value of accidents, andfatalities. The approach proposed here starts with totaling the number of parked vehicles by lottype. These totals are then multiplied by the average trip lengths from lot to destination for each lot

Florida Department of Transportation Park and Ride Manual11-10
type. The average trip lengths are found in Table 11-1. This product is then converted to an annualamount using the annualization factor for each lot type as shown in Table 11-1. The formula forthis computation is as follows:
VMTi = 2 * Parkedi * Li * Afaci
System VMT reduction = ΣI=1,lot typesVMTi
where:VMTi = VMT reduction for lots of type IParkedi= Number of parked vehicles in lots of type ILi = Average lot-to-destination distance for lot type IAfaci = Annualization factor for lot type i from Table
User Cost SavingsThe computation of user cost savings consists of calculating the savings in vehicle operating costs. The approach does not consider costs saved through avoidance of parking fees or costs incurredsuch as transit fares and parking fees. The approach is simply to multiply the annual VMTreduction for each lot type as computed by the above method by the average operating cost as foundin Table 11-2.
The formula for this computation is as follows:
Costi = VMTi * OpcostiSystemwide User Cost Savings = Σi=1,lot typesCosti
where:Costi = Annual cost savings for users of lot type iVMTi = Annual VMT reduction for lots of type iOpcosti= Average vehicle operating cost for vehicles parked at lots of type i as found in Table
11-2
Change In Vehicle OccupancyThis performance measure relates specifically to a stated Florida Transportation Plan objective. Theuser must be careful to subdivide lots into those with and without transit service. The followingsequence of formulas compute the change in vehicle occupancies:
Cocci =[l/(Mti/20 + Mci/Aocci)] - Boccifor Mti > 0 for Mti = 0Ppci =(Mci/Mti )/[{(BOCCi/AOCCi)/(1-Bocci/Aocci)+1}+Mci/Mti] = 1Egressi =Parkedi * Bocci * [Ppci/(Aocci-Bocci)] +(l-Ppci)/20Change in VehicleOccupancy= Σi=1,lot types(Cocci * Egressi)/Σi=1,lot typesEgressi

Florida Department of Transportation Park and Ride Manual11-11
where:Parkedi= Number of parked vehicles in lots of type IAocci = Auto occupancy of car-poolers from lot to work for lot type i. Refer to Table
11-2 for default values.Bocci = Before auto occupancy for lot type i. Refer to Table 11-2 for default values.Cocci = Change of occupancy for lot type i.Egressi = Number of egressing carpools and transits vehicles from lots of type i.Ppci = Proportion of parkers that are carpool passengers.Mti = Transit mode share from lot to work destination for lot type i. Refer to Table 11-2
for default values.Mci = Carpool mode shares from lot to work destination for lot type i. Refer to Table 11-2 for
default values.Annual Fuel SavingsThe computation of annual fuel savings is based on the VMT reduction computed above. Averagefuel consumption rates from Table 11-3 are used. The following formula computes annual fuelsavings:
Annual fuel savings = Fratey * VMT reduction/1,000 (gallons)where:Fratey = Average fuel consumption rate in gallons per 1,000 vehicle miles
from Table 11-3.Annual Emission ReductionsThe computation of annual emission reductions is based on the VMT reduction as computed above.Average emission rates from Table 11-3 are used. Rates are provided by pollutant. The appropriaterate would be selected based on the type of analysis being performed. For example, onlyhydrocarbon rates would be used for computing emission credits in non attainment areas for ozone.The following formulas compute annual emission reductions:
CO reduction (annual tons) = COy * VMT reduction/1,000,000HC reduction (annual tons) = HCy * VMT reduction/1,000,000NOX reduction (annual tons) = NOXy * VMT reduction/1,000,000Total reduction (annual tons) = TOTALy * VMT reduction/1,000,000
where:Coy = Average emission rate in tons per million vehicle miles from
Table 11-3.HCy = Average emission rate in tons per million vehicle miles
from Table 11-3.NOXy = Average emission rate in tons per million vehicle miles
from Table 11-3.TOTALy = Average emission rate in tons per million vehicle miles
from Table 11-3.

Florida Department of Transportation Park and Ride Manual11-12
Value of Accident ReductionThis computation is based on multiplying the VAT reduction by lot type by average accidentfrequencies found in Table 11-2. The computation produces number of fatalities, number ofinjuries, and number of property-damage-only (PDO) accidents. These values are then equated toeconomic values based on FDOT’s standard rates of $220,000 per fatality, $9,300 per injury, and$2,000 per PDO accident. The following equations compute accident-related statistics:
Fatalities = Σi=1,lot types(FATi * VMTi/1,000,000)Injuries = Σi=1,lot types(INJi * VMTi/1,000,000)PDO Accidents = Σi=1,lot types(PDOi * VMTi/1,000,000)
Economic value of accident reduction (annual dollar value) =220,000 * Fatalities + 9,300 * Injuries + 2,000 *PDO accidents
where:FATi = Fatalities per million vehicle miles of travel for lot type I from Table 11-2INJi = Injuries per million vehicle miles of travel for lot type i from Table 11-2PDOi = Property-damage-only accidents per million vehicle miles of travel for lot type i
from Table 11-2VMTi = Accumulated vehicle miles of travel for lots of type i

Florida Department of Transportation Park and Ride Manual11-13

Florida Department of Transportation Park and Ride Manual12-1
CHAPTER 12: PRIVATE PARTICIPATION
This chapter presents a catalog of techniques for involving the private-sector in the developmentand operation of park-and-ride facilities. The catalog provides a description of each techniqueincluding:C) The purpose of the action including facility development, provision of ancillary services, and
fundingC) Responsibilities of the Department in using the techniqueC) Description of participating entitiesC) Types of facilities to which the technique is applicableC) Potential benefits which can result from the actionC) Barriers to utilizing the techniqueC) Identification of agencies which have experience in the use of the technique
The material contained in this chapter is an abridgment of information presented in Working Paper3: Private Participation [55]. That document contains supporting research information notpresented here.
The catalog is presented from the perspective that the techniques are applied to reduce the financial burden of the Department. Local agencies may also make use of the catalog with the caveat thattheir perspective will most likely be different than FDOT’s and will require some changes to thedescriptions to represent that perspective.
The majority of the techniques presented in the following pages are applicable to development ofnew facilities. A few are presented which are more applicable to other purposes such as generating construction revenues and providing ancillary services which can promote usage of existingfacilities.
Some of the techniques have formidable barriers to their effective use in Florida. Such barriersinclude gaining organized labor endorsement and passing amended development ordinances. Inaddition, certain conditions must exist for effective use of the technique. These conditions aredescribed.
Not all techniques are appropriate for all types of facilities. For example, formation of a parkingauthority can only work in areas where parking fees can be assessed which implies application toCBD or similar peripheral faculties.
Table 12-1 summarizes the most important information concerning the implementation of each ofthe techniques presented in the catalog. The table shows the purpose of application, assessments ofthe implementation potential resulting from legal and institutional barriers, and qualitativeappraisals of the potential cost savings in utilizing each of the techniques presented.

Table 12-1. Private Participation Techniques SummaryTechnique Application Implementation
PotentialLegal Barriers Institutional
BarrierPotential PublicCost Reduction
Joint use ofshopping centerlot
Facilitydevelopment
High Minimal Moderate Significant
Joint use withcompatibleprivate use
Facilitydevelopment
High Minimal Moderate Significant
Joint use of localagency facility
Facilitydevelopment
High Minimal Moderate Significant
Joint use onnon-profit land
Facilitydevelopment
High Minimal Moderate Significant
Sale of surplusright-of-way
Facilitydevelopment
Moderate to high Minimal Moderate Significant
TMA Facility financing,development,operation
Low to moderate Moderate Considerable Moderate tosignificant
Generalpartnership
Facility financingdevelopmentoperation
Low to moderate Moderate Considerable Moderate tosignificant
Developer landcontribution
Facilitydevelopment
Low to moderate Considerable Moderate Moderate tosignificant
Off-site parkingsubstitution
Facility financing,development
Moderate to high Moderate Moderate Moderate
Impact fees Facility financing Moderate to high Moderate Moderate Moderate tosignificant
Parking condos Facility financing,development
Low Moderate Considerable significant
Parking authority Facility financing,developmentoperation
Low Moderate Considerable Significant
Contract withprivate transitprovider
Provision ofamenities
Low Considerable Considerable Moderate
Vendors permits Provision ofamenities
High Moderate Moderate Slightly negative
Preferential HOVparking credits
Provision ofamenities
High Moderate Moderate No reduction
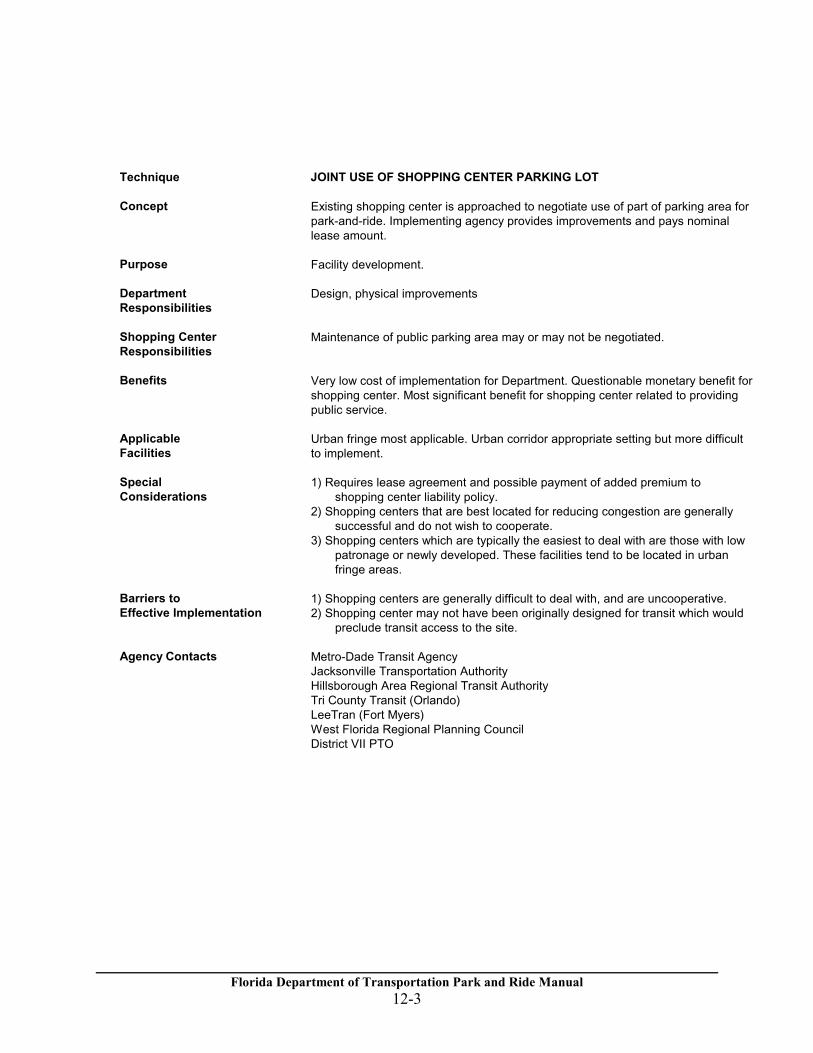
Florida Department of Transportation Park and Ride Manual12-3
Technique JOINT USE OF SHOPPING CENTER PARKING LOT
Concept Existing shopping center is approached to negotiate use of part of parking area forpark-and-ride. Implementing agency provides improvements and pays nominallease amount.
Purpose Facility development.
DepartmentResponsibilities
Design, physical improvements
Shopping CenterResponsibilities
Maintenance of public parking area may or may not be negotiated.
Benefits Very low cost of implementation for Department. Questionable monetary benefit forshopping center. Most significant benefit for shopping center related to providingpublic service.
ApplicableFacilities
Urban fringe most applicable. Urban corridor appropriate setting but more difficultto implement.
SpecialConsiderations
1) Requires lease agreement and possible payment of added premium toshopping center liability policy.
2) Shopping centers that are best located for reducing congestion are generallysuccessful and do not wish to cooperate.
3) Shopping centers which are typically the easiest to deal with are those with lowpatronage or newly developed. These facilities tend to be located in urbanfringe areas.
Barriers toEffective Implementation
1) Shopping centers are generally difficult to deal with, and are uncooperative.2) Shopping center may not have been originally designed for transit which would
preclude transit access to the site.
Agency Contacts Metro-Dade Transit AgencyJacksonville Transportation AuthorityHillsborough Area Regional Transit AuthorityTri County Transit (Orlando)LeeTran (Fort Myers)West Florida Regional Planning CouncilDistrict VII PTO

Florida Department of Transportation Park and Ride Manual12-4
Technique JOINT USE WITH COMPATIBLE PRIVATE DEVELOPMENT.
Concept Existing development is approached to negotiate use of part of parking area forpark-and-ride. Implementing agency provides improvements and pays nominallease amount. Development is of type which has adequate parking during daytimehours.
Purpose Facility development.
DepartmentResponsibilities
Design, construction, physical improvements.
ParticipantResponsibilities
Provides land and maintenance.
Benefits Very low implementation cost for Department. SlightOperation cost related to nominal lease amount. Slight monetary benefit fordevelopment through lease. Most significant developer benefit related to publicservice provision.
Applicable Facilities No restriction.
SpecialConsiderations
1) Types of compatible land uses include movie theaters, bowling alleys, drive-intheaters, dinner restaurants or other uses with predominantly night-timebusiness patterns.
2) Bars have been used but may not be the best affiliation from an appearancestandpoint. Restaurants may fall into this category as well.
3) Lease agreement is required. Lease terms may require Department to pay foradded liability premium.
Barriers to EffectiveImplementation
Short-term leases cannot be entered in to if improvements are made such as aregulatory sign or vehicle stops. Developers tend to not want to sign long-termleases.
Agency Contacts Michigan Department of Transportation

Florida Department of Transportation Park and Ride Manual12-5
Technique JOINT USE OF LOCAL AGENCY FACILITY
Concept Local government provides land to construct parking of which part is agreed to beused for park-and-ride. Alternately, local government agrees to allow use ofexisting facility. Local government provides maintenance while the Departmentconstructs or improves.
Purpose Facility development.
DepartmentResponsibilities
Design, construction, physical improvements.
ParticipatingAgencyResponsibilities
Land and maintenance provided by government agency including city/countyoffices, city halls, courthouses, community colleges, parks, schools, libraries, etc.
Benefits Low Department cost since right-of-way purchase is not required. Communityreceives improvement to public facility at nominal cost.
ApplicableFacilities
No restriction. Technique appears to be most often used in rural areas. Publicfacilities needing paved parking are likely located in rural areas.
SpecialConsiderations
1)Design must include enough spaces to accommodate the needs of both thepublic facility and the park-and-ride operation.
2)Requires joint-participation agreement.3)Urban area sites will probably not need significant improvements. Effort will be
largely related to negotiating use of existing, improved facilities.4)Types of applicable public facilities include city halls, courthouses, government
offices, parks, schools, libraries, community colleges.5)Potential for parking conflicts if public facility has high daytime use.
Barriers toEffectiveImplementation
None other than the limited number of opportunities.
Agency Contacts Metro-Dade Transit AgencyHillsborough Area Regional Transit AuthorityDistrict III PTODistrict VII PTOWest Florida Regional Planning Council

Florida Department of Transportation Park and Ride Manual12-6
Technique JOINT USE ON LAND PROVIDED BY NONPROFIT ORGANIZATION
Concept Nonprofit organization is approached to negotiate use of part of parking area forpark-and-ride. Implementing agency provides improvements and pays nominallease amount.
Purpose Facility development
DepartmentResponsibilities
Design, construction, physical improvements.
ParticipantResponsibilities
Land and maintenance provided by fraternal organization, privatecollege/university, or similar nonprofit organization with adequate daytime parkingsupply.
Benefits Low implementation cost for Department. Slight monetary benefit to nonprofitthrough lease value with greater benefit if improvements are made by thedepartment. Most significant benefit related to providing public service.
ApplicableFacilities
No restriction.
SpecialConsiderations
1)Types of organizations include private colleges/universities, fraternalorganizations.
2)Lease or use agreement is required.3)Sites may not be adequately located or sized.4)Lease terms may require Department to pay premium for added liability
coverage.
Barriers toEffectiveImplementation
Lease terms must be consistent with State legislation and/or local laws.
Agency Contacts Southeast Michigan Area Regional TransitMichigan Department of Transportation

Florida Department of Transportation Park and Ride Manual12-7
Technique SALE OF SURPLUS RIGHT-OF-WAY
Concept Government unit negotiates park-and-ride lot construction in terms of sale ofsurplus right-of-way.
Purpose Facility development.
Department Responsibilities Sells surplus right-of-way of interest to developers, and negotiates park-and-ridefacility as sale terms for reduced sale price.
Participant Responsibilities Purchases land and constructs parking facility in conjunction with newdevelopment.
Benefits Liquidation of surplus property and construction of facility at no cost since land hasalready been purchased. Developer acquires value property at reduced price.
ApplicableFacilities
No restrictions but most applicable to urban corridor lots in attracting development.
SpecialConsiderations
1) Parcel size must be large enough to support development.2) Access will likely be a problem and will need to be resolved.
Barriers toEffectiveImplementation
Availability of parcels of sufficient size and location to attract development.Concurrency in congested corridors.
Agency Contacts Michigan Department of Transportation

Florida Department of Transportation Park and Ride Manual12-8
Technique TRANSPORTATION MANAGEMENT ASSOCIATION
Concept Nonprofit group of employers, property owners, developers, and governmentestablished to pool resources to address community transportation problemsincluding parking.
Purpose Facility development.
DepartmentResponsibilities
Ex-officio member of management board providing technical guidance andpossible funding contributions to construction.
ParticipantResponsibilities
Supports solution initiatives, finances improvements, provides transit services ifany, and provides funding for operation of the technical staff.
Benefits Takes advantage of strengths of both the public and private agencies involved toimplement transportation improvements.
ApplicableFacilities
Peripheral facilities to major activity centers.
Special Considerations 1) Well defined area with significant congestion and parking problems.2) Growth area.
Barriers to EffectiveImplementation
Area transportation problems need to be perceived as being significant enough toform the association.
Agency Contacts Westshore Transportation Management Association (Tampa)Orlando Transportation Management AssociationDistrict V PTODistrict VII Planning

Florida Department of Transportation Park and Ride Manual12-9
Technique GENERAL PARTNERSHIP.
Concept Public/private partnership utilizing the best attributes of each partner to establishparking facilities with maximum benefit to all parties.
Purpose Facility development.
DepartmentResponsibilities
Land acquisition and possibly capitalization of facilities.
ParticipantResponsibilities
Developer group buys facilities back from State as development comes on line.
Benefits Department cost related only to land costs. Developers benefit from depreciationand equity of structures.
Applicable Facilities Structured peripheral parking to a major activity center.
Special Considerations 1) Needs to be located near growth area where development can be expected tocontribute.
2) Developer cooperation must exist to form the management committee.3) Congested activity center with parking problems.
Barriers to EffectiveImplementation
Formation of the partnership must be accomplished. Florida law does not allow theDepartment to be •paid back• in the manner suggested here. Will probably localgovernment involvement to gain full benefit of possible financingarrangements.

Florida Department of Transportation Park and Ride Manual12-10
Technique DEVELOPER CONTRIBUTES LAND THROUGH DEVELOPMENT ORDINANCEMANDATES.
Concept Large development dedicates land for park-and-ride facility through localdevelopment review requirement. Construction is negotiated or is responsibility oflocal regulatory government.
Purpose Facility development.
DepartmentResponsibilities
Will depend on development ordinance. Can range from no involvement to designand construct depending on the situation. Land will be in local government controland will require joint participation agreement for Department involvement.
ParticipantResponsibilities
Dedicates land specifically for park-and-ride facility through platte/site plan reviewprocess. Development of scale to support the future facility.
Benefits At a minimum, price of land eliminated from public development cost. Potential tohave entire cost of project supported by the developer but is contingent on thedevelopment ordinance and negotiations. Developer receives site approval. Otherpotential benefits include reduced road improvement assessments, satisfaction ofconcurrency requirement, or impact fee credits depending on the situation andordinance.
ApplicableFacilities
Normally urban fringe facilities since most development occurs in that area. Anyarea where the development is of a scale to require the dedication
SpecialConsiderations
1) Must be able to technically support relationship between development size andability to support the park-and-ride facility.
2) May need to include transit service expansion as justification for requiring landdedication for park-and-ride. This will provide an incompatibility betweenwhen the development has been built out enough to support transit and whenthe developer demands service that he has provided land for.
3) Most applicable to the larger urban areas with a major activity center,significant development occurring or anticipated, and significant roadwaycongestion, i.e., Miami, Orlando, Jacksonville.
Barriers toEffective Implementation
Development ordinance will need to be amended and adopted. Parking facilitybecomes responsibility of the local government where the development is located.Potential conflict with FDOT’s implementation goals.
Agency Contacts Hillsborough Area Regional Transit Authority
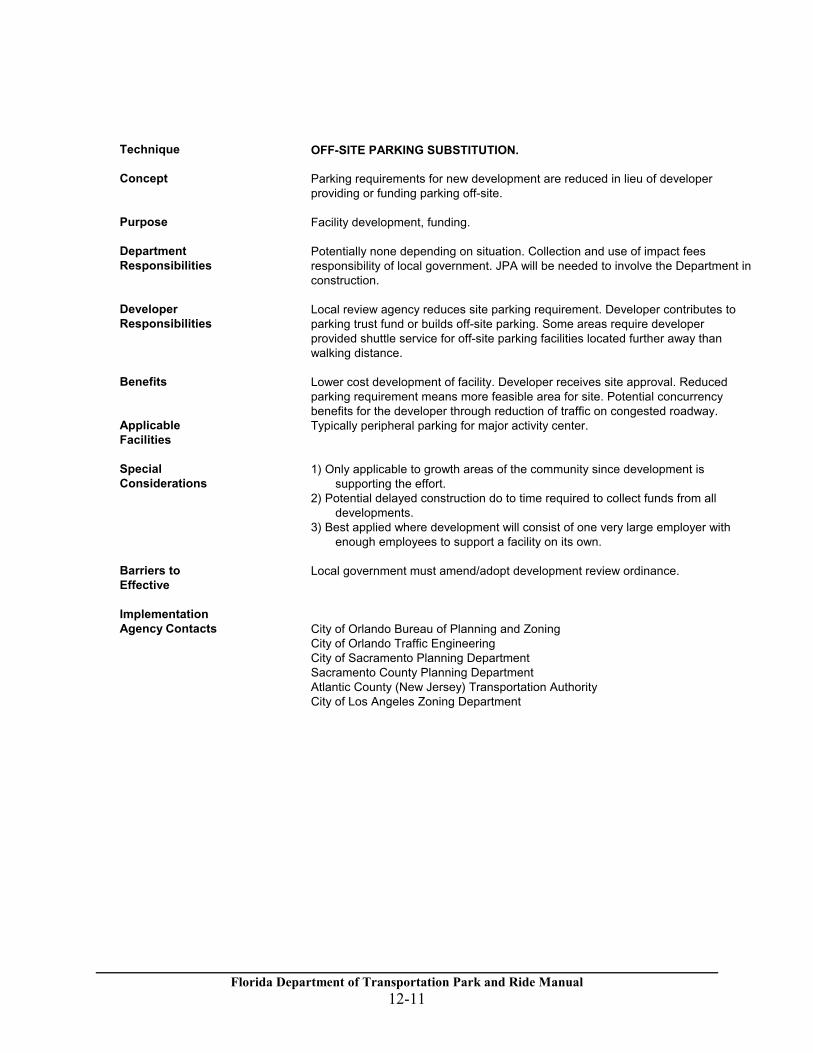
Florida Department of Transportation Park and Ride Manual12-11
Technique OFF-SITE PARKING SUBSTITUTION.
Concept Parking requirements for new development are reduced in lieu of developerproviding or funding parking off-site.
Purpose Facility development, funding.
DepartmentResponsibilities
Potentially none depending on situation. Collection and use of impact feesresponsibility of local government. JPA will be needed to involve the Department inconstruction.
DeveloperResponsibilities
Local review agency reduces site parking requirement. Developer contributes toparking trust fund or builds off-site parking. Some areas require developerprovided shuttle service for off-site parking facilities located further away thanwalking distance.
Benefits Lower cost development of facility. Developer receives site approval. Reducedparking requirement means more feasible area for site. Potential concurrencybenefits for the developer through reduction of traffic on congested roadway.
ApplicableFacilities
Typically peripheral parking for major activity center.
SpecialConsiderations
1) Only applicable to growth areas of the community since development issupporting the effort.
2) Potential delayed construction do to time required to collect funds from alldevelopments.
3) Best applied where development will consist of one very large employer withenough employees to support a facility on its own.
Barriers toEffective
Implementation
Local government must amend/adopt development review ordinance.
Agency Contacts City of Orlando Bureau of Planning and ZoningCity of Orlando Traffic EngineeringCity of Sacramento Planning DepartmentSacramento County Planning DepartmentAtlantic County (New Jersey) Transportation AuthorityCity of Los Angeles Zoning Department

Florida Department of Transportation Park and Ride Manual12-12
Technique DEVELOPER IMPACT FEE ASSESSMENTS.
Concept New development supports park-and-ride through payment of impact feeassessments. Basis of assessment can include cost of park-and-ride facilities ormay only be based on roadway improvement costs.
Purpose Facility financing.
Department Responsibilities Potentially none but depends on situation. Collection and use of impact feesresponsibility of local government. JPA will be needed to involve the Department.
ParticipantsResponsibilities
Local government collects impact fee from developer. Fee calculation may includecost of the park-and-ride facility if stipulated in impact fee ordinance. Localgovernment may likely need to provide transit service to support the justification ofthe impact fee.
Benefits Funding provided by private development. Time for accrual of total fees will belong which suggests that expedited construction might not occur. Government willstill need to capitalize the construction.
Applicable Facilities Normally urban fringe facilities since most development occurs in that area;however, may apply to any facility where development is still occurring.
SpecialConsiderations
1) Government may still need to capitalize construction due to the •pay out•schedule dictated by the pace of development in the community.
2) Must develop a formally-adopted park-and-ride facilities plan. At aminimum, park-and-ride facility costs must be included in Long-RangePlan road costs upon which impact fees are assessed.
3) Technical justification required to support the market area around thefacility where the fees will be assessed.
4) Must technically support the relationship between the fee and benefit frompark-and-ride.
5) Planned facilities should be located where a reasonable cost can beassessed.
Barriers toEffectiveImplementation
Must amend/adopt impact fee ordinance. Must technically justify relationshipbetween assessment and benefit to the payee. May need to formerly adoptpark-and-ride facilities plan as part of Long-Range Plan depending on theordinance provisions.
Agency Contacts Hillsborough County Planning and ZoningBroward County Office of PlanningPalm Beach County

Florida Department of Transportation Park and Ride Manual12-13
Technique PARKING CONDOMINIUMS
Concept Parking spaces at transit terminals are reserved through joint public/privatedevelopment of parking with Individual spaces being sold to parkers.
Purpose Facility development and financing.
Department Responsibilities Similar to other joint development projects. Combines with privateinvestors/developers to plan, design, condemn, and construct parking at transitterminals.
Participant Responsibilities Depends on arrangement but can include all functions as specified above for theDepartment plus financing, management, and sales.
Benefits Most of the entire parking facility cost is paid by the ultimate users of the providedimprovement through payment of true cost of construction. Reduces the requirednumber of •public• parking spaces, resulting in lower public-side cost.
Applicable Facilities Rail stations with large parking shortage. Peripheral parking garages to CBD’s withparking shortage.
Special Considerations 1) Limited experience in the application of this technique. Public may not besupportive of the concept if prices are not competitive.
2) Has been identified with rail systems in the Northeast. Miami appears to bethe only location where this approach can be applied to rail.
3) Downtowns with severe parking shortages are attractive.4) UMTA Suburban Mobility Parking Initiative grants available for technical and
capital assistance.
Barriers to EffectiveImplementation
Investor acceptance may be low since this is a new and largely untested approachto joint development initiatives. Will need to institute parking restrictions in areas tomake the approach more attractive.
Agency Contacts Urban Mass Transportation Administration

Florida Department of Transportation Park and Ride Manual12-14
Technique ESTABLISH PARKING AUTHORITY TO DEVELOP PARKING FACILITIES
Concept A public agency with bonding authority is established with powers to bond,condemn, construct and manage parking facilities in a defined area.
Purpose Financing and operation of parking facilities.
Department Responsibilities None.
Participant Responsibilities Local unit of government establishes separate authority to administer parking in adefined area.
Benefits Bonding to capitalize development of facilities.
Applicable Facilities Peripheral facilities adjacent to major activity center.
Special Considerations 1) Requires situation where parking fees can be set at a level to support thebonding.
2) Applicable to situations where the parking supply is particularly acute andrequires a dedicated staff outside the normal government operation toalleviate the supply problem.
3) Large activity centers.
Barriers to EffectiveImplementation
Requires establishing another unit of government with bonding capacity.
Agency Contacts Downtown Tampa Parking Authority

Florida Department of Transportation Park and Ride Manual12-15
Technique CONTRACT WITH PRIVATE PROVIDER FOR TRANSIT SERVICES.
Concept Private transit provider supplies service to commuter lot at a reduced costcompared to locally supplied service.
Purpose Enhance services to parking facility.
DepartmentResponsibilities
Provision of operating and capital funds in support of local transit operators.
Participant Responsibilities Contracts with private provider and provides financing. Contractor providesexpress bus or shuttle service.
Benefits Reduced cost to transit operator in providing service to facility.
Applicable Facilities Urban corridor lots where commuter-type transit services are applicable.
Special Considerations 1) Corridor not presently served by transit.2) Larger urban area where charter commute providers can operate profitably.
Barriers to EffectiveImplementation
Conflicts with transit union and Federal Section 13requirements.
Agency Contacts Metro-Dade Transit AuthorityDallas Area Regional Transit AuthoritySouthern California Rapid Transit District

Florida Department of Transportation Park and Ride Manual12-16
Technique USER PERMITS TO VENDORS AT PARK-AND-RIDE LOTS.
Concept Increase facility usage through provision of ancillary support services such ascatering trucks, flower sellers, etc.
Purpose Provision of amenities to increase usage.
Department Responsibilities Grants use permits to vendors wishing to do business at parking facilities.
Participant Responsibilities Licensed vendors provide services at facilities during commuting hours. Requirescoordination with local government issuing business licenses.
Benefits Improves facility amenities at little cost. May create problems with local retailestablishments near the site.
ApplicableFacilities
No restrictions other than large facilities will be the most attractive to the vendors.
Special Considerations 1) Special permission required for joint use lots.2) Facilities large enough to provide sufficient business to vendor.3) Consideration for local businesses which may already be providing services to
be dispensed by vendors.
Barriers to EffectiveImplementation
Enabling legislation needs to allow for use of State property for private gain. Localestablishments may contest competition from vendors.

Florida Department of Transportation Park and Ride Manual12-17
TechniqueREDUCTION IN REQUIRED SPACES FOR PROVISION OF HOV PARKING ATDESTINATION.
Concept Create demand for carpools by giving preferential parking at destination.
Purpose Increase usage of existing facilities.
Department Responsibilities None.
Participant Responsibilities Local government provides space allowances through development reviewprocess. Developer designates carpool only parking- spaces in a preferredlocation.
Benefits Developer benefits from reduced parking requirement. Provides impetus to formcarpools which may result in higher usage of facilities.
Applicable Facilities Facilities in major travel corridor.
Special Considerations 1) Requires extraordinary conditions to produce significant increases in lotusage.
2) Should be packaged with other initiatives such as ridesharing promotion togain significant impact.
3) Needs to be applied over a significant area to produce noticeable impacts.
Barriers to EffectiveImplementation
Amendments/adoption of development ordinances and zoning codes will need tobe made.
Agency Contacts City of Sacramento Planning DepartmentSacramento County Planning DepartmentVillage of Schaumburg, IllinoisCity of Seattle Department of Construction and Land UseCity of Roseville (California) Planning Department

Florida Department of Transportation Park and Ride Manual12-18
TECHNICAL APPENDICES
The following technical appendices present technical information referred to in the main body ofthis manual or the working papers. These appendices are organized as follows:
Appendix A ReferencesAppendix B BibliographyAppendix C GlossaryAppendix D Florida park-and-ride lot inventoryAppendix E Site selection evaluation methodologyAppendix F Lot survey materialsAppendix G Analysis worksheets

A-1
APPENDIX AREFERENCES
This appendix contains a list of reference documents cited in this manual. Appendix B contains thecomplete bibliography of literature used during the State Park & Ride Lot Program Study.
1. ��State Park and Ride Lot Program.�� Working Paper 1: Data Development. Prepared for theOffice of Public Transportation, Florida Department of Transportation by Frederic R. Harris, Inc.Tallahassee, Florida. October, 1989.
2. ��State Park and Ride Lot Program.�� Working Paper 4: Facility Analysis. Prepared for theOffice of Public Transportation, Florida Department of Transportation by Frederic R. Harris, Inc.Tallahassee, Florida. October, 1989.
3. Kerchowskas, K. and A. K. Sen. ��Ride Sharing and Park and Ride: An Assessment of PastExperience and Planning Methods for the Future. Volume III: The Park and RidePlanning Manual.�� Prepared for the Office of University Research, Research and SpecialPrograms Administration, U.S. Department of Transportation by the School of Urban Sciences,University of Illinois at Chicago Circle. Springfield, Virginia: National Technical Information Service.November 1977.
4. Shearin, Guillame. ��National Ridesharing Demonstration Program: Employer- andCommunity-Based Rideshare Promotion in Cincinnati, OH.�� Prepared for the Office ofTechnical Assistance, Urban Mass Transportation Administration by Crain and Associates, Inc.Springfield, Virginia: National Technical Information Service. December, 1985.
5. ��National Ridesharing Demonstration Program: Employer-Based Rideshare Promotion inAtlanta, GA.� Prepared for the Office of Management Research and Transit Services, UrbanMass Transportation Administration by Charles River Associates, Inc. Springfield, Virginia:National Technical Information Service. May, 1985.
6. Burns, E. N. ��Priority Rating of Potential Park-and-Ride Sites.�� ITE Journal. Institute ofTransportation Engineers. Washington, D.C. February 1979.
7. Guide for the-Design of High Occupancy Vehicle and Public Transfer Facilities.Washington, D.C.: American Association of State Highway and Transportation Officials. 1983.
8. ��SR 94 Urban Corridor PTO Conceptual Design Study.�� Final Report. Prepared for theDistrict VI Public Transportation Office, Florida Department of Transportation by Frederic R.Harris, Inc. (formerly PRC Engineering, Inc.). Miami, Florida. 1985.
9. Grice, B. District III, Florida Department of Transportation. Chipley, Florida. Interview. August 3,1989.
10. Fernandez, T. Q. District V, Florida Department of Transportation. Orlando, Florida. State Parkand Ride Program Progress Meeting #2. October 19, 1989.
11. Bureau of Economic Research, College of Business Administration. Florida Statistical Abstract.

A-2
Gainesville, Florida: University of Florida. Annual publication.
12. Urban Transportation Planning Model Update�Phase III. ��Task 11 Final Report: Modal SplitModel Refinement and Calibration Standards �� . Prepared for the Florida Department ofTransportation by Schimpeler-Corradino Associates. Tallahassee, Florida. May, 1984.
13. Christainson, D. L. ��Alternative Mass Transportation Technologies Technical Data�� .Prepared for the Transportation Planning Division, Texas Department of Highways and PublicTransportation by the Texas Transportation Institute, Texas A&M University. Springfield,Virginia: National Technical Information Service. December 1985..
14. Klinger, D. and J. R. Kuzmyak. ��Personal Travel In the United States.�� Volume II:1983-1984 Nationwide Personal Transportation Study. Prepared for the Federal HighwayAdministration by COMSIS Corporation. Springfield, Virginia: National Technical InformationService. September 1986.
15. Wattleworth, J. A., K. G. Courage, G. Long, and C. E. Wallace. ��1-95/NW 7th AvenueBus/Carpool Priority System Evaluation�� . Report II-1: Evaluation of the I-95 Express Busand High Occupancy Vehicle Priority System. Prepared for the Florida Department ofTransportation by the Department of Civil Engineering, University of Florida. Springfield,Virginia: National Technical Information Service. January, 1978.
16. ��Southeast Regional Planning Model Validation and Alternate Transportation Strategies(SERPM/ATS).�� Technical Memorandum 5: Mode Split. Prepared for the Bureau ofMultimedia Systems Planning, Florida Department of Transportation by Frederic R. Harris, Inc.Tallahassee, Florida. September 1988.
17. Pasco, Pinellas, Hillsborough Travel Characteristics Evaluation.�� Final Report. Prepared byfor the Bureau of Multimedia Systems Planning, Florida Department of Transportation.Tallahassee, Florida. April 1986.
18. �Parking Principles�. Special Report 125. Washington, D.C.: Highway Research Board. 1971.
19. Bowler, C. E., E. C. Noel, R. Peterson, D. Christiansen. ��PARK-AND-RIDE FACILITIES -Guidelines for Planning Design and Operation.�� Prepared for the Office of TrafficOperations Traffic Engineering Division, Federal Highway Administration by Daniel Consultants,Inc. and Texas Transportation Institute. Springfield, Virginia: National Technical InformationService. January 1986.
20. Nungesser, L. G. and N. P. Ledbetter. ��Procedures for Estimating Park-and-Ride Demand inLarge Texas Cities.�� Report No. FHWA/TX-87/24+339-7. Prepared by the TexasTransportation Institute, Texas A&M University for the Transportation Planning Division, TexasState Department of Highways and Public Transportation. Springfield, Virginia: NationalTechnical Information Service. February 1987.
21. Bureau of Multimedia Systems Planning. ��Generalized Daily Level of Service MaximumVolumes for Florida’s Urbanized Areas.�� Florida Department of Transportation.Tallahassee, Florida. 1987.

A-3
22. Park & Ride Facilities Demand Estimate�� I-95 System Maintenance of Traffic Program. WPI86070-1498. Prepared for the Florida Department of Transportation by Frederic R. Harris,Inc. Fort Lauderdale, Florida. August 1987.
23. ��Simplified Aids for Transportation Analysis.�� Report No. UMTA-UPM-20-80-1. Office ofPlanning and Methods Support, Urban Mass Transportation Administration. Springfield,Virginia: National Technical Information Service. January 1980.
24. ��Southeast Regional Planning Model Validation and Alternate Transportation Strategies(SERPM/ATS).� Technical Memorandum 1: Trip Generation Model. Prepared for the Bureauof Multimedia Systems Planning, Florida Department of Transportation by Frederic R. Harris,Inc. Tallahassee, Florida. September 1988.
25. Urban Transportation Planning Model Update�Phase II. �Task C: Develop StandardizedDistribution and Assignment Models�. Prepared for the Florida Department of Transportationby COMSIS Corporation. Tallahassee, Florida. October, 1981.
26. Pratt, R. H. and J. N. Copple. ��Traveler Response to Transportation System Changes.��DOT-FH-11-9579. Prepared for the Federal Highway Administration by R.H. Pratt & Co.Division, Barton-Aschman Associates, Inc. Washington, D.C.: U.S.Government Printing Office.July 1981.
27. Hu, P. S., L. S. Williams, and D. J. Beal. ��Light-Duty Vehicle MPG and Market SharesReport: Model Year 1988.� Prepared for the Office of Transportation Systems, U.S.Department of Energy by Oak Ridge National Laboratory. Springfield, Virginia: NationalTechnical Information Service. April, 1989.
28. ��Energy Impacts of Transportation Systems Management.�� Final Report. ReportNY-09-8007-82-1. Prepared for the Office of Planning Assistance, Urban MassTransportation Administration by the New York State Department of Transportation.Springfield, Virginia: National Technical Information Service. October, 1981.
29. Environmental Protection Agency. �Compilation of Air Emission Factors.�� Research TrianglePark, North Carolina. September, 1985.
30. ��Highway Capacity Manual.�� Special Report 209. Washington, D.C.: Transportation ResearchBoard. 1985.
31. ��Characteristics of Urban Transportation Supply.�� Prepared by for the TransportationSystems Center, U.S. Department of Transportation by COMSIS Corporation. Springfield’Virginia: National Technical Information Service. October, 1981.
32. Gilbert, K. ��Transportation System Management: Handbook of Manual AnalysisTechniques for Transit Strategies (Dallas-Fort Worth).�� Report No. TX-09-0045-81-1.Prepared for the North Central Texas Council of Governments by Alan M. Voorhees andAssociates, Inc. Springfield, Virginia: National Technical Information Service. May, 1981.

A-4
33. Raus, J. ��A Method for Estimating Fuel Consumption and Vehicle Emissions on UrbanArterials and Networks.�� Report No. FHWA-TS-81-210. Office of Research andDevelopment, Federal Highway Administration. Washington, D.C.: U.S. Government PrintingOffice. April, 1981.
34. ��Justification Report Interstate 95 From I-195 to SR 808 in Dade, Broward and PalmBeach Counties.�� Compiled by the Division of Transportation Planning, Florida Departmentof Transportation. Tallahassee, Florida. July, 1978.
35. Metro-Dade Transit Agency. ��Dadeland North Metrorail Parking Garage ProjectJustification.�� Miami, Florida. June, 1987.
36. Stopher, P. R. ��Derivation of Values of Time From Travel Demand Models.��Transportation Research Record 587. Washington, D.C.: Transportation Research Board.1975.
37. A Manual on User Benefit Analysis of Highway and Bus-Transit Improvements.Washington, D.C.: American Association of State Highway and Transportation Officials. 1977.
38. �� Interchange Approval 1-75 Corridor Study.�� Prepared for the Office of Highway Planningand Statistics, Florida Department of Transportation by Harland Bartholomew & Associates,Inc. and lunter/RS&H, Inc. Tallahassee, Florida. December, 1988.
39. ��Manual of Uniform Minimum Standards for Design, Construction and Maintenance forStreets and Highways, State of Florida.�� Prepared by the Florida Department ofTransportation, State Design Engineer-Highways. Tallahassee, Florida. August 1986
40. A Policy on Geometric Design of Highways and Streets, 1984. Washington, D.C.: AmericanAssociation of State Highway and Transportation Officials. 1984.
41. Parking Consultants Council, National Parking Association. The Dimensions of Parking. SecondEdition. Washington, D.C.: Urban Land Institute and National Parking Association. 1983.
42. ��Policy and Guidelines for Vehicular Connections to Roads on the State HighwaySystem.�� Florida Department of Transportation. Tallahassee, Florida. February 1985.
43. Office of Traffic Operations, Federal Highway Administration. ��Standard Highway Signs.�� U.S.DOT. Washington, D.C.
44. Federal Highway Administration, U.S. Department of Transportation. Manual on Uniform TrafficControl Devices for Streets and Highways. 1988 Edition. Washington, D.C.: U.S.Government Printing Office. 1988.
45. Christiansen, D. L. and D. Rathbone. ��Design Guidelines for Park-and-Ride Facilities.��Report No. TTI-2-10- �4-205-3. College Station, Texas: Texas Transportation Institute.1978.

A-5
46. ��Flexible Pavement Design Manual.�� Prepared by the Florida Department of Transportation.Tallahassee, Florida. 1984.
47. �� Interim Guide for Design of Pavement Structures--1972.�� 1981 Revision. Washington,D.C.: American Association of State Highway and Transportation Officials. 1981.
48. ��Bicycle Facilities Planning & Design Manual.�� Official Standards. Division of Planning,Florida Department of Transportation. Tallahassee, Florida. 1982.
49. The American Horticultural Society. ��Transit Planting: A Manual.�� Final Report. Report No.VA-06-0006. Urban Mass Transportation Administration. Washington, D.C.
50. Transportation and Traffic Engineering Handbook. Second Edition. Washington, D.C.:Institute of Transportation Engineers. 1982.
51. Levinson, H. S., C. L. Adams, and W. F. Hoey. �Bus Use of Highways: Planning and DesignGuidelines�. NCHRP Report 155. Washington, D.C.: Transportation Research Board. 1975.
52. ��National Ridesharing Demonstration Program: Home-End Ridesharing in Lincoln,Nebraska.�� Prepared for the Service and Methods Division, Urban Mass TransportationAdministration by Crain and Associates, Inc. Springfield, Virginia: National TechnicalInformation Service. April, 1985.
53. District VI Estimates, Florida Department of Transportation. ��Average Cost Per Mile ForRoadway Construction.�� Miami, Florida. 1988.
54. ��State Park and Ride Lot Program.�� Working Paper 2: Program Analysis. Prepared for theOffice of Public Transportation, Florida Department of Transportation by Frederic R. Harris,Inc. Tallahassee, Florida. November, 1989.
55. ��State Park and Ride Lot Program.�� Working Paper 3: Private Participation. Prepared for theOffice of Public Transportation, Florida Department of Transportation by Frederic R. Harris,Inc. Tallahassee, Florida. December, 1989.
56. "FDOT District Three Park-and Ride Program",Florida Institute for Marketing AlternativeTransportation, Florida State University, Tallahassee FL 1995.
57. Pedestrian and Transit Friendly Design, Reid Ewing, Florida DOT, March 1996

B-1
APPENDIX B. BIBLIOGRAPHY
This appendix contains a complete bibliography of literature used during the State Park & Ride LotProgram Study. The documents are ordered alphabetically. A list of references cited in this document iscontained is contained in Appendix A.
A Manual on User Benefit Analysis of Highway and Bus-Transit Improvements.Washington, D.C.: American Association of State Highway and Transportation Officials. 1977.
The American Horticultural Society. ��Transit Planting: A Manual.�� Final Report. ReportNo. VA-06-0006. Urban Mass Transportation Administration. Washington, D.C.
A Policy on Geometric Design of Highways and Streets, 1984. Washington, D.C.:American Association of State Highway and Transportation Officials. 1984.
��Bicycle Facilities Planning & Design Manual.�� Official Standards. Division of Planning,Florida Department of Transportation. Tallahassee, Florida. 1982.
Bowler, C. E., E. C. Noel, R. Peterson, D. Christiansen. �PARK-AND-RIDE FACILITIESGuidelines for Planning, Design and Operation.�� Prepared for the Office of TrafficOperations Traffic Engineering Division, Federal Highway Administration by Daniel Consultants,Inc. and Texas Transportation Institute. Springfield, Virginia: National Technical InformationService. January 1986.
Bureau of Economic Research, College of Business Administration. Florida StatisticalAbstract. Gainesville, Florida: University of Florida. Annual publication.
Bureau of Multimedia Systems Planning. ��Generalized Daily Level of Service MaximumVolumes for Florida’s Urbanized Areas.�� Florida Department of Transportation.Tallahassee, Florida. 1987.
Burns, E. N. �Priority Rating of Potential Park-and-Ride Sites.� ITE Journal. Institute ofTransportation Engineers. Washington, D.C. February 1979.
��Characteristics of Urban Transportation Supply.�� Prepared by for the TransportationSystems Center, U.S. Department of Transportation by COMSIS Corporation. Springfield,Virginia: National Technical Information Service. October, 1981.
Christianson, D. L. ��Alternative Mass Transportation Technologies Technical Data�� .Prepared for the Transportation Planning Division, Texas Department of Highways and PublicTransportation by the Texas Transportation Institute, Texas A&M University. Springfield,Virginia: National Technical Information Service. December 1985.
Christiansen, D. L. and D. Rathbone. ��Design Guidelines for Park-and-Ride Facilities.��Report No. TTI-2-10-74-205-3. College Station, Texas: Texas Transportation Institute. 1978.
Cima, B. and F. Banerjee. ��Development of a Peripheral Parking Program forDowntown Los Angeles.�� Compendium of Technical Papers, 57th Annual Meeting of the

B-2
Institute of Transportation Engineers. Washington, D.C.: Institute of Transportation Engineers.1987.
District VI Estimates, Florida Department of Transportation. ��Average Cost Per Mile ForRoadway Construction.�� Miami, Florida. 1988.
��Energy Impacts of Transportation Systems Management.�� Final Report. ReportNY-098007-82-1. Prepared for the Office of Planning Assistance, Urban Mass TransportationAdministration by the New York State Department of Transportation. Springfield, Virginia:National Technical Information Service. October, 1981.
Federal Highway Administration, U.S. Department of Transportation. Manual on UniformTraffic Control Devices for Streets and Highways. 1988 Edition. Washington, D.C.: U.S.Government Printing Office. 1988.
Fernandez, T. Q. District V, Florida Department of Transportation. Orlando, Florida. StatePark and Ride Program Progress Meeting #2. October 19, 1989.
��Flexible Pavement Design Manual.�� Prepared by the Florida Department ofTransportation. Tallahassee, Florida. 1984.
Gilbert, K. ��Transportation System Management: Handbook of Manual AnalysisTechniques for Transit Strategies (Dallas-Fort Worth).�� Report No. TX-09-0045-81-1.Prepared for the North Central Texas Council of Governments by Alan M. Voorhees andAssociates, Inc. Springfield, Virginia: National Technical Information Service. May, 1981.
Grice, B. District III, Florida Department of Transportation. Chipley, Florida. Interview. August3, 1989.
Guide for the Design of High Occupancy Vehicle and Public Transfer Facilities.Washington, D.C.: American Association of State Highway and Transportation Officials. 1983.
��Highway Capacity Manual.�� Special Report 209. Washington, D.C.: TransportationResearch Board. 1985.
Hu, P. S., L. S. Williams, and D. J. Beal. ��Light-Duty Vehicle MPG and Market SharesReport: Model Year 1988.�� Prepared for the Office of Transportation Systems, U.S.Department of Energy by Oak Ridge National Laboratory. Springfield, Virginia: NationalTechnical Information Service. April, 1989.
�� Interchange Approval I-75 Corridor Study.�� Prepared for the Office of Highway Planningand Statistics, Florida Department of Transportation by Harland Bartholomew & Associates,Inc. and Hunter/RS&H, Inc. Tallahassee, Florida. December, 1988.
�� Interim Guide for Design of Pavement Structures--1972.�� 1981 Revision. Washington,D.C.: American Association of State Highway and Transportation Officials. 1981.
"Park & Ride Facilities Demand Estimates.�� I-95 System Maintenance of Traffic

B-3
Program. WPI 86070-1498. Prepared for the Florida Department of Transportation byFrederic R. Harris, Inc. Fort Lauderdale, Florida. August 1987.
Joint Center for Urban Mobility Research, Rice Center. ��Private Sector Involvement inUrban Transportation.�� Prepared for the Federal Highway Administration and the UrbanMass Transportation Administration. Springfield, Virginia: National Technical InformationService. December 1986.
��Justification Report Interstate 95 From I-195 to SR 808 in Dade, Broward and PalmBeach Counties.�� Compiled by the Division of Transportation Planning, Florida Departmentof Transportation. Tallahassee, Florida. July, 1978.
Kerchowskas, K. and A. K. Sen. ��Ride Sharing and Park and Ride: An Assessment ofPast Experience and Planning Methods for the Future. Volume III: The Park and RidePlanning Manual.�� Prepared for the Office of University Research, Research and SpecialPrograms Administration, U.S. Department of Transportation by the School of Urban Sciences,University of Illinois at Chicago Circle. Springfield, Virginia: National Technical InformationService. November 1977.
Klinger, D. and J. R. Kuzmyak. ��Personal Travel in the United States.�� Volume II:19831984 Nationwide Personal Transportation Study. Prepared for the Federal HighwayAdministration by COMSIS Corporation. Springfield, Virginia: National Technical InformationService. September 1986.
Levinson, H. S., C. L. Adams, and W. F. Hoey. �Bus Use of Highways: Planning and DesignGuidelines�. NCHRP Report 155. Washington, D.C.: Transportation Research Board. 1975.
��Manual of Uniform Minimum Standards for Design, Construction and Maintenancefor Streets and Highways, State of Florida.�� Prepared by the Florida Department ofTransportation, State Design Engineer-Highways. Tallahassee, Florida. August 1986.
Metro-Dade Transit Agency. ��Dadeland North Metrorail Parking Garage ProjectJustification.�� Miami, Florida. June, 1987.
��National Ridesharing Demonstration Program: Employer-Based RidesharePromotion in Atlanta, GA.�� Prepared for the Office of Management Research and TransitServices, Urban Mass Transportation Administration by Charles River Associates, Inc.Springfield, Virginia: National Technical Information Service. May, 1985.
��National Ridesharing Demonstration Program: Home-End Ridesharing in Lincoln,Nebraska.�� Prepared for the Service and Methods Division, Urban Mass TransportationAdministration by Crain and Associates, Inc. Springfield, Virginia: National TechnicalInformation Service. April, 1985.
Nungesser, L. G. and N. P. Ledbetter. ��Procedures for Estimating Park-and RideDemand in Large Texas Cities.�� Report No. FHWA/TX-87/24+339-7. Prepared by theTexas Transportation Institute, Texas A&M University for the Transportation Planning Division,Texas State Department of Highways and Public Transportation. Springfield, Virginia: National

B-4
Technical Information Service. February 1987.
Office of Traffic Operations, Federal Highway Administration. ��Standard Highway Signs.��U.S. DOT. Washington, D.C.
Parking Consultants Council, National Parking Association. The Dimensions of Parking. Second Edition. Washington, D.C.: Urban Land Institute and National Parking Association.1983.
��Parking Principles�� . Special Report 125 Washington, D.C.: Highway Research Board.1971.
��Policy and Guidelines for Vehicular Connections to Roads on the State HighwaySystem." Florida Department of Transportation. Tallahassee, Florida. February 1985.
Pratt, R. H. and J. N. Copple. ��Traveler Response to Transportation System Changes.�� DOT-FH-11-9579. Prepared for the Federal Highway Administration by R.H. Pratt & Co.Division, Barton-Aschman Associates, Inc. Washington, D.C.: U.S. Government PrintingOffice. July 1981.
Public Technology, Inc. ��Joint Development: A Handbook for Local GovernmentOfficials.�� Prepared for the Office of Planning Assistance, Urban Mass TransportationAdministration. Washington, D.C.: Technology Sharing Program, Office of the Secretary ofTransportation, USDOT. September 1983.
Raus, J. ��A Method for Estimating Fuel Consumption and Vehicle Emissions on UrbanArterials and Networks.�� Report No. FHWA-TS-81-210. Office of Research andDevelopment, Federal Highway Administration. Washington, D.C.: U.S. Government PrintingOffice. April, 1981.
��Secretary Skinner Announces Initiative To Promote Parking Space Condominiums.��News:. Washington, D.C.: Office of the Secretary of Public Affairs, USDOT. 24 April 1989.
Shearin, Guillame. ��National Ridesharing Demonstration Program: Employer- and Community-Based Rideshare Promotion in Cincinnati, OH.�� Prepared for the Office ofTechnical Assistance, Urban Mass Transportation Administration by Crain and Associates,Inc. Springfield, Virginia: National Technical Information Service. December, 1985.
��Simplified Aids for Transportation Analysis.�� Report No. UMTA-UPM-20-80-1.Office of Planning and Methods Support, Urban Mass Transportation Administration.Springfield, Virginia: National Technical Information Service. January 1980.
Smith, S.A. and S.J. Tenhoor. ��Model Parking Code Provisions to EncourageRidesharing and Transit Use.�� Prepared for the Federal Highway Administration by JHK& Associates. Springfield, Virginia: National Technical Information Service. September 1983.
��SR 94 Urban Corridor PTO Conceptual Design Study.�� Final Report. Prepared for theDistrict VI Public Transportation Office, Florida Department of Transportation by Frederic R.
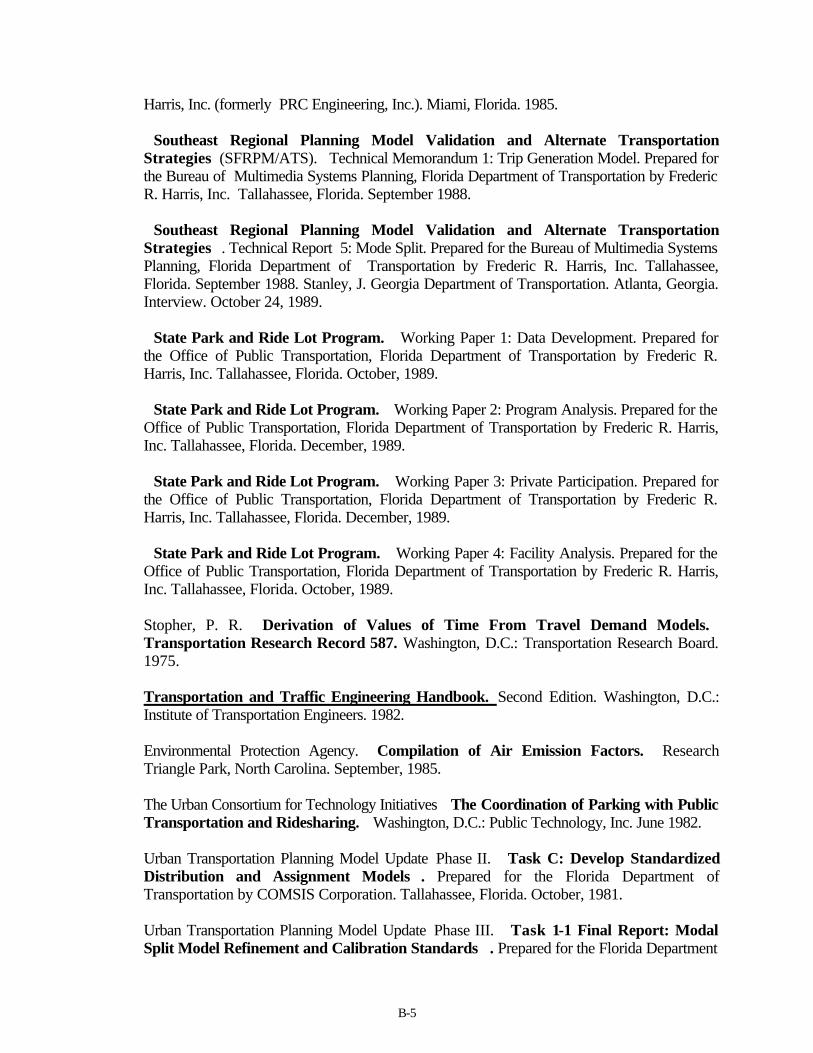
B-5
Harris, Inc. (formerly PRC Engineering, Inc.). Miami, Florida. 1985.
��Southeast Regional Planning Model Validation and Alternate TransportationStrategies (SFRPM/ATS).� Technical Memorandum 1: Trip Generation Model. Prepared forthe Bureau of Multimedia Systems Planning, Florida Department of Transportation by FredericR. Harris, Inc. Tallahassee, Florida. September 1988.
��Southeast Regional Planning Model Validation and Alternate TransportationStrategies�� . Technical Report 5: Mode Split. Prepared for the Bureau of Multimedia SystemsPlanning, Florida Department of Transportation by Frederic R. Harris, Inc. Tallahassee,Florida. September 1988. Stanley, J. Georgia Department of Transportation. Atlanta, Georgia.Interview. October 24, 1989.
��State Park and Ride Lot Program.�� Working Paper 1: Data Development. Prepared forthe Office of Public Transportation, Florida Department of Transportation by Frederic R.Harris, Inc. Tallahassee, Florida. October, 1989.
��State Park and Ride Lot Program.�� Working Paper 2: Program Analysis. Prepared for theOffice of Public Transportation, Florida Department of Transportation by Frederic R. Harris,Inc. Tallahassee, Florida. December, 1989.
��State Park and Ride Lot Program.�� Working Paper 3: Private Participation. Prepared forthe Office of Public Transportation, Florida Department of Transportation by Frederic R.Harris, Inc. Tallahassee, Florida. December, 1989.
��State Park and Ride Lot Program.�� Working Paper 4: Facility Analysis. Prepared for theOffice of Public Transportation, Florida Department of Transportation by Frederic R. Harris,Inc. Tallahassee, Florida. October, 1989.
Stopher, P. R. ��Derivation of Values of Time From Travel Demand Models.��Transportation Research Record 587. Washington, D.C.: Transportation Research Board.1975.
Transportation and Traffic Engineering Handbook. Second Edition. Washington, D.C.:Institute of Transportation Engineers. 1982.
Environmental Protection Agency. ��Compilation of Air Emission Factors.�� ResearchTriangle Park, North Carolina. September, 1985.
The Urban Consortium for Technology Initiatives ��The Coordination of Parking with PublicTransportation and Ridesharing.�� Washington, D.C.: Public Technology, Inc. June 1982.
Urban Transportation Planning Model Update�Phase II. ��Task C: Develop StandardizedDistribution and Assignment Models�� . Prepared for the Florida Department ofTransportation by COMSIS Corporation. Tallahassee, Florida. October, 1981.
Urban Transportation Planning Model Update�Phase III. ��Task 1-1 Final Report: ModalSplit Model Refinement and Calibration Standards �� . Prepared for the Florida Department

B-6
of Transportation by Schimpeler-Corradino Associates. Tallahassee, Florida. May, 1984.
Wattleworth, J. A., K. G. Courage, G. Long, and C. E. Wallace. �� I-95/NW 7th AvenueBus/Carpool Priority System Evaluation�� . Report II-1: Evaluation of the I-95 Express Busand High Occupancy Vehicle Priority System. Prepared for the Florida Department ofTransportation by the Department of Civil Engineering, University of Florida. Springfield,Virginia: National Technical Information Service. January, 1978.
"Pasco, Pinellas, Hillsborough Travel Characteristics Evaluation.�� Final Report.Prepared by for the Bureau of Multimedia Systems Planning, Florida Department ofTransportation. Tallahassee, Florida. April 1986.

C-1
APPENDIX CGLOSSARY
Access - the street system providing access to a parking facility, sometimes involving several streets,particularly if one-way.
Adequate rate covenant - often required in revenue bond financed projects; guarantees the operatorwill charge adequate rates to produce revenue necessary to cover principal and interest payments.
Aisle, driving - the traveled path through a parking facility between one or two rows of parkedvehicles.
Allocation model - a mathematical model used to determine the percentage of parking space to beused by all-day, short-term, and other parkers.
Angle, parking - the angle at which the parking stall extends from the edge of the parking bay, usuallyranging from 50 to 90 degrees.
Angle, stall - see Angle, parking.
Approach traffic - using approach streets to a parking facility.
Auto-free zone - an area, usually in or near downtown, where vehicular traffic is severely limited orcompletely restricted.
Automated parking facility - a facility operated by automatic parking equipment rather than byemployees.
Automatic controls - equipment such as ticket dispensers, card readers, and parking gates used in anautomated facility.
Automatic pre-cashiering - automatic prepayment machines located in or near a parking facility forthe purpose of permitting the prepayment of parking fees before the patron retrieves his vehicle from theparking stall.
Average length of stay - average length of time vehicles are parked in a particular facility.
Back-in stalls - parking spaces into which the vehicle is backed from the driving aisle.
Bay - a parking facility unit that has two rows of parking stalls and a central aisle.
Building area - that portion of a lot or land parcel on which a building can be constructed.
Building code - local ordinances controlling the building methods and component requirements forconstruction of various types.
Bumper - a wheel stop placed at the front of a parking stall to keep the vehicle from striking walls orextending beyond the specified parking area.

C-2
Bus and carpool lanes, preferential lanes, or HOV lanes - a form of preferential treatment inwhich lanes on streets and highways are reserved for the exclusive use of high occupancy vehicles.
Busway - a roadway designed for exclusive or predominant use by buses in order to improve busmovement and travel times.
CBD - the central business district or downtown area of a community.
Capacity, facility - the number of vehicles that can be accommodated in any given parking facilityunder a particular type of operation.
Capacity, roadway - the capacity, in terms of vehicles that can be accommodated per day or per houron any given street or roadway.
Capture rate - the percentage of vehicles passing a transfer facility that would be induced to use thefacility.
Car size classifications - designation of vehicles by size: subcompacts, compacts, intermediate,standard, and luxury.
Car width - in relation to a parking stall; most U.S. cars now range from 60 to 80 inches in width.
Carbon monoxide (CO) - a colorless, odorless, poisonous gas emitted from vehicle exhausts.
Carbon monoxide detectors - devices used to measure the concentration of CO and emit warnings ifharmful levels are reached.
Carpool - any vehicle, usually an automobile, carrying two or more occupants, including the driver, or agroup of people sharing automobile transportation.
Catchment zone - a term used to define the market area for a specific site or corridor.
CBD fringe - that portion of a municipality immediately outside the CBD in which there is a wide rangein type of business activity, generally including small commercial, light industrial, warehousing,automobile service activities, and intermediate strip development, as well as some concentratedresidential areas.
CCTV - see closed-circuit television.
Change of mode - the transfer from one form of transportation to another.
Channelization - construction of islands or barriers, usually on roadways, to assist in control of trafficflow patterns.
Circular ramp - a ramp between floors of a parking facility whose center line is circular.
Circulation - traffic flow pattern, such as two-way or one-way, for an on-street system or off-street

C-3
parking facility.
Clear height - clear vertical height inside a parking structure; usually 7 feet is a desirable minimum.
Clear-span facility - a parking structure with vertical columns on the outside edge of the structure anda clear span between columns, making it unnecessary for vehicles to maneuver between columns.
Closed-circuit television - a system providing security in parking facilities by the use of TV camerasthat cover portions of the facility.
Code requirements - the parking facility requirements contained in a community’s codes that affectzoning and construction, as well as plumbing, electrical, and similar specialties.
Commuter parking - parking areas, usually specially designated, for users of mass transportation orcarpool operations.
Commuter shed - a term used to define the market area for a particular park-and-ride facility or travelcorridor.
Compact car - a small car, usually less than 15 feet in overall length and 72 inches in width.
Contract documents - the design plans and specifications for construction of a facility.
Contract parking - long-term or specified-term parking arranged in advance, usually on a fixed feebasis.
Construction cost data - information which includes current cost for individual constructioncomponents and that forms the basis for preparation of project cost estimates.
Cordon count - the simultaneous counting of all traffic at strategic points entering and leaving a givenarea such as a CBD. Corridor - a broad geographical band that identifies a general directional flow oftraffic. It may encompass a number of streets and highways and transit route alignment.
Cost, operation and maintenance - the cost of operating and maintaining a facility, including staffcharges, utilities, insurance, supplies, and repairs. Such costs are deducted form gross revenue.
Cost per stall - the costs of a facility divided by the number of parking stalls.
Cost per square foot - the cost of a facility divided by the number of square feet in the facility.
Cost, project - the total cost of a facility, including land, construction, engineering fees, contingencycosts, and any unusual charges.
Coverage, debt service - the ration of revenue less all facility operating and maintenance costs,divided by the required annual payments for principal and interest; usually expressed as a percentage.
Curb distance - the straight-line distance required along a curb for a parking stall-and varying in lengthdepending upon the stall angle.

C-4
D factor - directional distribution of peak hour traffic on a two-way roadway. Usually stated as theproportion or percentage of two-way traffic operating in the dominant direction.
Delay - the time lost by a person, a vehicle during travel and due to circumstances which impede thedesirable movement of traffic. It is the travel time difference between congested and free-flow traveltimes.
DHV - design hour volume (a volume of traffic selected as the basis for design criteria of a facility).
Demand - the number of potential customers for a parking facility or parking system.
Demand/Supply - a ratio of parking demand (vehicles) and parking supply (spaces) that indicates anexcess or shortage of available space.
Depreciation - a percentage of the value of an improvement deducted each year for wear and tear.
Design/build system - a system in which a single entity is responsible for both the design andconstruction of a facility, often involving the fast-track method of construction; also referred to as�design/construct.�
Design standards - a set of criteria established to define the design characteristics of a parking facility.
Destination - the end point of a single trip such as home, school, work, or church. Diameter, ramp -the measurement from outside wall to outside wall across a circular ramp.
Dimension, stall - the length and width of a parking stall.
Discharge time - the time required to empty a parking facility of parked vehicles.
Double striping of parking lots - the practice of separating adjacent parking stalls using two stripesseparated by 2 to 4 feet of pavement. Thus, each stall has a �double stripe� between it and adjacentstalls.
Duration - the length of time a vehicle is parked; average length of time all vehicles are parked in aparticular facility.
Emissions - gases and particular matter that pass through the exhaust system of a vehicle.
Environmental impact - measurement of the environmental consequences of a parking facility in termsof air, noise, and water pollution levels that are generated by the facility.
EPA - the Environmental Protection Agency, charged by the Congress with developing andenforcing environmental regulations.
Express bus - a conventional bus which minimizes stops between origin and destination using an HOVfacility or in mixed traffic on freeways or arterials.

C-5
Financial feasibility - determination of a project’s potential economic success.
Financing - means of providing funds for a parking facility through private capital, public sale of generalobligation or revenue bonds, special assessment or tax district funds, leases, not-for-profit associations,or a combination of these various sources.
Flat rate fee - a set amount charged for parking for a specific period of time such as an hour, a day, ora month.
Floor area - the area of a floor, measured by length times width; in some cases, the total floor area of afacility.
Flow system - the traffic flow pattern in a parking facility such as one-way, two way, or reverse flow.
Fringe parking - the term fringe parking refers to any parking facility located outside of an activitycenter such as a central business district.
Functional design - the design of a structure or facility which increases its overall efficiency andprovides maximum user acceptance; a parking concept plan showing traffic flow, stall geometry, andother features that determine the interior design of parking facilities.
General obligation bonds - bonds sold by a public agency to finance public improvements and whichguarantee the full faith and credit of the agency regarding repayment.
Grade - the degree of incline or slope in a ramp or floor of a parking structure.
Gross area - the entire area of a building, usually measured in square feet or square meters.
Half bay - a parking facility unit that has one row of car stalls and a central aisle.
Head-in - parking system where vehicles park front first in the parking stall.
Headroom - the vertical clearance in a parking structure, usually about 7 feet.
Headway - this is the time interval between successive vehicles crossing a point on the roadway.
Helical ramp - a spiral or circular ramp.
Herringbone - a pattern for the layout of parking spaces with alternate rows set at oblique angles toone another.
High occupancy vehicle (HOV) - motor vehicles carrying more persons than Just the driver. It couldbe a bus, car or van used for pooling, or any other motor vehicle that meets the minimum occupancyrequirements, generally two, three, four or more, specified for a particular location or area.
High turnover - a parking facility with a high rate of turnover or high number of vehicles per space perday.

C-6
Hydrocarbons - compounds containing hydrogen and carbon that result from the operation of aninternal combustion engine.
Intermediate - a mid-sized car, between a compact and a full-sized car.
Inventory spaces - total number of parking spaces available in a facility or in a parking system.
Island - a raised area in a roadway, driveway, or parking facility, used to control or direct traffic flow.
K factor - percentage of 24-hour traffic on a roadway traveling during the peak hour
Kiss-and-ride (passenger load and unload) - the transfer mode whereby a transit or commuterpassenger is driven to or picked up from his or her first transit terminal point in a private vehicle drivenby another person who does not originate or terminate the trip at the terminal.
Lane control signal (red/green) - illuminated signal lights positioned over exit lanes to indicate whenthe lane is open (green) or closed (red) to traffic.
Lane width - width of a lane, expressed in feet.
Level of service - a descriptive measure of the quality and quantity of transportation service providedwhich incorporates finite measures of quantifiable characteristics such as travel time, travel cost, numberof transfers, etc.
License plate inventory - periodic recording of all vehicle license plate numbers in a parking facility inorder to determine length of stay and prevent fraud by patrons claiming lost tickets.
Life safety code - a recently developed code aimed at guaranteeing adequate requirements for newconstruction.
Locator, parking space - signs or other means of helping motorists locate their vehicles when theyreturn to a parking facility.
Long-term parking - vehicles parked for at least half a day or longer.
Lot design - the layout of a parking lot in terms of physical features.
Market area or target market area - this is the imaginary irregular fan shaped area radiating awayfrom the CBD with the apex of the fan located slightly closer to the CBD than the park-and-rideparking lot. It is from this area patrons for a park-and-ride facility originate.
Metered parking - parking controlled as to time and fee by meters or numbers at each space; see slotboxes.
Mode of access - the form of transportation used to access a transfer facility. Modes typically used intransportation planning studies include walk, drive-alone auto, shared-ride auto, kiss-ride, park-ride,bus transit, and rail transit.

C-7
Mode share - percentage of person-types using particular mode of travel.
Mode split analysis - estimation of the amount of travel by travel mode.
Mode of travel - means of reaching a destination including walking, riding transit, driving a car, andbeing a car passenger.
Module - a portion of a parking facility, usually a bay containing a central aisle and two rows of parkingspaces. _
Modular width - the unit width, in feet, of a module.
NFPA - the National Fire Protection Association, a professional association involved in the promotionof fire safety.
NPA - the National Parking Association, a professional association representing the parking industry.
Occupancy rate - the rate at which a given parking facility or a parking system is occupied, on anhourly, daily, or annual basis.
O&M Costs - operation and maintenance costs; the costs, usually expressed in terms of annualamounts, to operate, staff, and maintain a parking facility.
Parallel parking spaces - spaces designed parallel to the curb of a street, a lot, or a parking structurewall.
Parking angle - the angle formed by a parking stall and the wall or center line of the facility, rangingfrom 90 degrees (perpendicular) to 30 degrees.
Parking bay - the section of a parking facility containing an aisle and one or two rows of parkingspaces.
Parking inventory - a tabulation of the number of parking spaces available in a given area categorizedby curb or off-street spaces, public or private use, or by other classifications.
Parking load - the total number of space hours used during a given period of time. Its peak is reachedat peak accumulation, when capacity is used to its fullest extent.
Peak period - period of maximum parking activity; can be by the hour, day of week, or seasonal.
Peripheral lot - Facilities typically located at the periphery or fringe of a major activity center. Accessdistances to the lot are typically longer while egress distances from the lot to the final trip destination areusually shorter than other facility types.
PHT - person-hours of travel.
Practical parking capacity - this is after less than the available parking capacity by from 5 to 15percent. This is related to time wasted in driving, parking maneuvers, time searching for a space and

C-8
encroachment. Caused by misplacement of vehicle in the stall.
Queue - a waiting line of vehicles, e.g. traffic at-a signal or buses at a park-and -ride facility.
Ramp - an inclined portion of a parking structure; can be for travel purposes only, or can also provideparking spaces on one or both sides.
Ramp, express - a ramp, usually extending several floors or levels, for direct exit from the facility.
Ramp, garage - a garage or deck composed entirely of ramped floors connected at various levels.
Remote lot - Lots generally located outside the urban area in a rural or small town setting. Trip lengthsfor both home-to-lot and lot-to-work legs of the commute trips are much longer than lots of other types.
Reservoir space - storage space within a parking facility for vehicles entering or exiting (also calledqueue area).
Revenue projection - a projection of revenue anticipated from a parking facility or system.
Ridesharing - any form of group travel in autos, vans or special service buses.
Scissors design - a design format in which ramped floors are situated opposite one another like theblades of scissors; also called �double leaf.�
Search pattern - the flow pattern through a parking facility of vehicles in search of available parkingspaces.
Search time - the time required to find an available space.
Short-term parking - parking for a short period of time, usually less than four hours.
Shuttle bus - local bus used to transport passengers between parking facilities or other terminals andmajor generators.
Simulation model - a mathematical model developed to simulate the use of a given improvement, inthis case, a parking facility.
Site - the area on which a parking facility or other improvement is constructed.
Site characteristics - the physical features of a site such as shape, area, topography, soil conditions,and access.
Site location analysis - an investigation of a given site and the determination of its usability forparticular purposes.
Space count - total number of spaces in a facility or system.
Special tax district - an area defined by ordinance where special taxes can be imposed to fund

C-9
improvements such as parking.
Stall - the area, usually marked with distinguishing lines, in which one vehicle is to be parked; a parkingspace.
Stall depth - length of the stall.
Stall width - width of the stall.
Striping - painted lines delineating stalls and circulation patterns.
Storage capacity - see Reservoir space.
Study period - the time during which the study is being conducted which could be only one or moreparts of a day or all day.
Subcompact - a very small vehicle, smaller than a compact.
Subscription commuter service - a service in which routes and schedules are prearranged for riderswho sign up for service in advance.
Superelevation - the banking of a curved roadway or ramp to improve vehicle handling.
Trip purpose - the primary purpose of a person making a trip. Typical purposes include shopping,work, and business.
TSM (transportation system management) - the operation and coordination of all phases of thetransportation system to provide more efficient and effective use of existing transportation services andfacilities.
Turning radius - the pavement or ramp width necessary to permit a vehicle to complete a turningmaneuver.
Turnover - the number of vehicles using a given space or facility each day.
Turnpike Corridor - Lots located along the Florida Turnpike in Broward County (Fort Lauderdale).This corridor is a major commuting corridor within a highly developed urban area and is not served byline-haul transit. Trip origin patterns tend to be dispersed along the corridor. Trip destination patternsare primarily concentrated at the Miami end of the facility but are also dispersed to a lesser degree alongthe corridor.
Unsatisfied demand - the number of vehicles that cannot be accommodated in a parking facility orsystem.
Urban Fringe - Lots located at the fringe of urban development. Trips tend to originate outside theurban area while destinations tend to be dispersed within the urban area. Fringe area lots are generallynot served by transit, although they may be.

C-10
Urban Transit Corridor - Lots located along a major commute corridor within an urban area whichare served by line-haul transit such as express bus, urban rail, and commuter rail services. Trip originpatterns tend to be dispersed along the corridor. Trip destination patterns may be dispersed along orconcentrated at one end of the corridor.
Utilization - the percentage of a parking facility’s capacity that is occupied under average conditions.Usually Implied as the maximum percentage of capacity used under average conditions. Sometimesexpressed as a percentage greater than 100 percent when lots are saturated and illegal space use inoccurring.
Utilization counts - counts of parked vehicles at a facility.
Vehicle counter - a device used to count vehicles entering and leaving a facility.
Vehicle detector - a device intended to sense the presence of a vehicle in a traffic lane.
VHT - vehicle-hours of travel.
VMT - vehicle miles of travel; the total vehicle miles of travel within any parking facility.
Walking distance - the approximate distance patrons will walk between a parking facility and trafficgenerators.
Walk-ins - People using a park-ride lot that walk in to use public transportation.
Wearing surface - the topmost layer of any pavement.
Wheel load - the added load in a parking structure created by the parked vehicle (live load).
Wheel stop - a bumper or block placed at the head of a parking stall to restrain the vehicle frommoving forward.
Work trip - a trip from home to work or from work to home.
Zoning - the regulation of land use, on a parcel or area basis, by local ordinance.

C-11

D-1
APPENDIX D: FLORIDA PARK-AND-RIDE LOT INVENTORY
This appendix section presents an inventory of existing park-and-ride facilities located in Florida. Thisinventory provides a resource of information useful to further evaluations of park-and-ride. Theinventory was initially based on the September 30, 1988 State Park & Ride Lot Quarterly Reportinventory compiled by the Department’s Central Office of Public Transportation in Tallahassee and wasexpanded upon through additional information provided by the Department’s District offices and localagencies with park-and-ride ministerial responsibilities. Additional and more accurate information wasobtained through a series of site visits conducted by the Florida Institute for Marketing AlternativeTransportation. The site visits began in June of 1996 and concluded in late July of 1996. The inventoryis as complete as was possible to make it during the Study effort which produced this Planning Manual;however, it should be recognized that there are holes in the data including missing facilities. Theinventory should provide a good base upon which to produce a complete listing of all facilities in theState. Of course, the inventory will be out of date a year from the date of this report. An on-goingupdating process is required to maintain the usefulness of the inventory. The format of the informationpresented below was originally adopted from the State Park & Ride Lot Quarterly Report inventoryformat. That format has been expanded upon to provide a more formal presentation of additionalinformation concerning maintenance and construction responsibility, services, and functional lot type.The later data element is important to the execution of a number of the evaluation methodologiescontained in this planning manual. The format of the inventory includes the following data elements:
C. Spaces availableC. Spaces utilized and percent utilizationC. Comments concerning operation, special services, status, and special conditionsC. Location including FDOT District, County, area and nearest landmark
The following table presents a synopsis of the inventory, showing the number of facilities organized bydistrict.
Summary of Lot Inventory by District
DISTRICT NUMBER OF FACILITIES1 52 223 154 235 66 257 18TOTAL 114

D-2
Visit Date MON 6/24/96 MON 6/24/96 MON 6/24/96 MON 6/24/96 MON 6/24/96Visit Time 8:45 a.m. 9:45 a.m. 10:45 a.m. 1:00 p.m. 3:30 p.m.District 1 1 1 1 1County Lee Lee De Soto Polk PolkCounty Site # 1 2 1 1 2Area Ft. Myers Ft. Myers Arcadia Bartow LakelandLocation Summerlin Sq. SR 82 & Ortiz SR 70 & SR 35 US 17 & CR 559 I-4 & SR 33Maintained By Shopping Center FDOT FDOT FDOT FDOT# Handicapped* 2# Spaces see comments 30 22 24 30# Used 5 0 13 0 5% Used see comments 0.00% 59.09% 0.00% 16.67%Security OK OK OK OK OKPavement OK under water OK OK OKDebris OK No No No NoSigning No Yes No Yes YesFencing No No No No YesBus svc. Yes, shelter No No No NoAccess OK OK OK OK OKIllegal parking No Yes, on roadside No Yes NoComments located in shopping
center and spacesnot marked; couldnot determine whowere park and ride
users.
lot is flooded, not visible from road
1 Truck Rig for sale, 1truck in grass
*Included in # Spaces Count

D-3
Visit Date WED 6/13/96 WED 6/13/96 WED 6/13/96 WED 6/13/96 WED 6/13/96 WED 6/13/96Visit Time 12:00 p.m. 12:30 p.m. 1:00 p.m. 1:02 p.m. 1:05 p.m. 1:15 p.m.District 2 2 2 2 2 2County Duval Duval Duval Duval Duval ClayCounty Site # 1 2 3 4 5 1Area Jacksonville Jacksonville Jacksonville Jacksonville Jacksonville JacksonvilleLocation Dunn & Monaco Normandy & I-295 Cedar Hills, Blanding & West Ricker & 103rd Wells & Blanding TargetMaintained By Shopping Shopping Center Shopping Center Shopping Center Shopping Center Shopping Center# Handicapped*# Spaces see comments see comments see comments see comments see comments see comments# Used 2 0 0 12 0 5% Used see comments see comments see comments see comments see comments see commentsSecurity OK OK OK OK OK OKPavement OK OK OK OK OK OKDebris No No No No No NoSigning No No No No No NoFencing No Yes No No No NoBus svc. Yes Yes Yes Yes Yes YesAccess OK OK OK OK OK OKIllegal parking No No No No No NoComments Located in
shoppingcenter; unclearwhich spaces
are P&R.
Located inshopping center;
unclear whichspaces are P&R.
Located inshopping center;
unclear whichspaces are P&R.
Located inshopping center;
unclear whichspaces are
P&R.
Located inshopping center;
unclear whichspaces are
P&R.,
Located in shopping center;unclear which spaces are
P&R. Orange Park flyerexpress, new lot.
*Included in # spacescount

D-4
Visit Date WED 6/13/96 WED 6/13/96 WED 6/13/96 WED 6/13/96 WED 6/13/96 WED 6/13/96Visit Time 1:30 p.m. 1:40 p.m. 2:10 p.m. 2:20 p.m. 2:30 p.m. 2:45District 2 2 2 2 2 2County Clay Clay Duval Duval Duval DuvalCounty Site # 3 2 6 7 8 9Area Jacksonville Jacksonville Jacksonville Jacksonville Jacksonville JacksonvilleLocation Kingsley &
Mound DQKingsley &
Blanding KmartSR 13 & Marbon SR 13 & I-295 SR 13 & Old St.
Augustine KmartPhilips & Butler
Maintained By ShoppingCenter
Shopping Center Shopping Center Shopping Center Shopping Center Shopping Center
# Handicapped* see comments see comments see comments 0 see comments see comments# Spaces see comments see comments see comments 84 see comments 75# Used 6 4 see comments 41 1 0% Used na na see comments 48.81%Security OK OK OK OK OK OKPavement OK Ok Not yet OK OK OKDebris No No Yes No No NoSigning OK No Not yet Yes No YesFencing No No Not yet No No NoBus svc. Yes Yes Not yet Yes Yes YesAccess OK OK OK OK OK OKIllegal parking No No No No No NoComments Express service
on road behindSC. Orange
Park flyerexpress. Couldnot distinguishP&R spaces
from SCspaces
Orange Park flyerexpress. Could not
distinguish P&Rspaces from SC
spaces
New lot underconstruction, will
have service.
Some cars parkedin shade, not inspaces, great
location
Could notdistinguish P&Rspaces from SC
spaces
New, as of April 1995, busenters lot.
*Included in # spaces

D-5
Visit Date WED 6/13/96 WED 6/13/96 WED 6/13/96** WED 6/13/96 Not SeenVisit Time 3:00 p.m. 3:15 p.m. 3:20 p.m. 3:30 p.m. Not SeenDistrict 2 2 2 2 2County Duval Duval Duval Duval DuvalCounty Site # 10 11 12 13 14Area Jacksonville Jacksonville Jacksonville Jacksonville JacksonvilleLocation Arlington &
SouthsideMonument Pointe &St. Johns Winn Dixie
Skyway Terminal,1-10,
I-95, JTA
Gary & Hendricksunder I-95overpass
Winn Dixie - US 17 &Timuquana
Maintained By Shopping Center Shopping Center FDOT FDOT Shopping Center# Handicapped* see comments see comments see comments 0 see comments# Spaces see comments see comments see comments 78 see comments# Used 2 10 0 18% Used na na na 0.00% see commentsSecurity OK OK OK OKPavement OK OK OK OKDebris No No No NoSigning Yes Yes Yes NoFencing No No Yes YesBus svc. Yes Yes Yes YesAccess OK OK OK OKIllegal parking No No Yes NoComments P&R part of
Shopping Center lot;unable to determine
P&R users. Busenters Regency Sq.
mall by Sears
New lot. P&R part ofShopping Center lot;unable to determine
P&R users.
Some parking onstreet outside of
fenced lots.
Bus outside fencedarea, dark, leaking,from I-95 overpass
David Martin of JTAgave average usageof lot, Orange Park,
flyer express
*Included in # spaces

D-6
Visit Date 6/14/96 6/14/96 6/14/96 6/14/96 6/14/96Visit Time 1:15 p.m. 1:25 p.m. 1:40 p.m. 1:50 p.m. 2:45 p.m.District 2 2 2 2 2County Alachua Alachua Alachua Alachua AlachuaCounty Site # 2 4 1 3 5Area Gainesville Gainesville Gainesville Gainesville GainesvilleLocation Museum Rd. &
Hume HallHull Rd. near SR 24,
fine arts lotMuseum Rd. &
WoodlawnMuseum Rd. &
Center Dr.Archer & 16th
Maintained By University &FDOT
University & FDOT University &FDOT
University &FDOT
University & FDOT
# Handicapped* seecomments
0 0 0 0# Spaces** see
comments618 438 153 or 362 232
# Used 20 see comments see comments see comments% Used 3%Security OK OK OK OKPavement OK OK OK OKDebris No NO No NoSigning Yes No No NoFencing No No No NoBus svc. Yes Yes Yes Yes YesAccess OK OK OK ?Illegal parking No No NoComments 70 spaces on
ground,garage built
over P&R, UFshuttle, citybus service
UF shuttle (nosummer service), onlylot listed on map andsign designating P&R
UF shuttle, citybus service on
fraternity row, lotexpanded. P&Rnot designated,
so could notdetermine
usage.
City bus serviceonly, lot
expanded. P&Rnot designated,
so could notdetermine
usage.
UF shuttle only,difficulty finding lot.
P&R not designated,so could not
determine usage.
*Included in # spaces**counts provided byGreg Dubois at UFparking

D-7
Visit Date 7/12/95 7/13/95 7/13/95 7/13/95Visit Time 11:10 a.m. 10:35 a.m. 1:35 p.m. 2:15 p.m.District 3 3 3 3County Leon Gadsden Liberty LibertyCounty Site # 1 1 2 1Area Tallahassee Gretna Hosford BristolLocation Bannerman &
ThomasvilleCity Hall on US 90 SR 65 at Hosford
Elem/Jr. High SchoolSR 20 at Liberty Co.
High SchoolMaintained By FDOT City County County# Handicapped* 0 0 0 0# Spaces 20 17 61 17# Used 4 12 14 8% Used 20.00% 70.59% 22.95% 47.06%Security OK OK OK OKPavement OK OK OK OKDebris No No No NoSigning Yes Yes Yes YesFencing No No No NoBus svc. No No No NoAccess OK OK OK OKIllegal parking No No No NoComments*Included in # spaces countNote: This set of visits tookplace last year for the District 3East Park and Ride Plan.

D-8
Visit Date TU 6/11/96 TU 6/11/96 TU 6/11/96 TU 6/11/96 TU 6/11/96 TU 6/11/96Visit Time 11:00 a.m. 12:30 p.m. 12:35 p.m. 1:50 2:30 2:45District 3 3 3 3 3 3County Jackson Holmes Holmes Okaloosa Santa Rosa Santa RosaCounty Site # 1 1 2 1 2 1Area Campbellton Ponce de Leon Ponce De Leon Holt (Galiver) Pace MiltonLocation Water Tower US 90 E. &
WestvilleCity Hall US 90 & CR
189US 90 & SR
281US 90 & CR191A
Maintained By City City City FDOT FDOT FDOT# Handicapped* 0 0 1 0 0# Spaces 18 10 12 15 44 15# Used 5 1 5 1 13 2% Used 27.78% 10.00% 41.67% 6.67% 29.55% 13.33%Security OK OK OK OK OK OKPavement Needs
stripingGood Good Good Good Needs paving,
Debris No No No No No Yes, litterSigning Yes Yes Yes Yes Yes YesFencing No No No No No NoBus svc. No No No No No NoAccess OK OK OK OK OK OKIllegal parking No No No No Yes YesComments Staff park in
back, not at P&R1 boat, 3 cars
for sale1 car for sale, cars at
tree*Included in # Spaces

D-9
Visit Date WED 6/12/96 WED 6/12/96 WED 6/12/96 WED 6/12/96 WED 6/12/96Visit Time 8:45 a.m. 9:10 a.m. 10:45 a.m. 1:50 p.m. 4 p.m.District 3 3 3 3 3County Escambia Escambia Escambia Walton JacksonCounty Site # 3 2 1 1 2Area Pensacola Pensacola/Bellview Century Freeport Grand RidgeLocation Mariner Mall Pine Forest & 9 Mile Courthouse City Hall Town HallMaintained By Shopping Mall FDOT County City City# Handicapped* 0 0 2 0# Spaces see comments 8 13 32 can’t tell# Used 0 1 5 3 0% Used na 12.50% 38.46% 9.38% naSecurity OK OK OK OK OKPavement OK Needs paving, OK Needs striping Needs paving,Debris No No No No NoSigning Yes Yes, not on main rd. Not internally Not internally Yes, misleading/NotFencing Yes No No No NoBus svc. No No No No NoAccess OK OK OK OK OKIllegal parking No Yes No Yes NoComments Mall is closed,
lot not used12 cars parked near
trees or at gasstation
Somespaces taker
back
2 staff cars, signnot on main road
Not on US 90 but on69
*Included in # spaces

D-10
Visit Date THUS 7/18/96 THUS 7/18/96 THUS 7/18/96 THUS 7/18/96 THUS 7/18/96 THUS 7/18/96Visit Time 4:35pm 4:44pm 4:20pm 1:30pm 1:45pm 1:10pmDistrict 4 4 4 4 4 4County Palm Beach Palm Beach Broward Palm Beach Palm Beach Palm BeachCounty Site # 6 2 1 3 4 5Area Boca Raton W. Palm Beach Deerfield Beach Delray Beach Boynton Beach Lake WorthLocation Commerce
Blvd.I-95 &
Congress AveHillsboro Blvd. &
NW 12 Ave.I-95 & W Atlantic
AveHypoluxo & High
RidgeLake Worth Rd & I-95
Maintained By FDOT FDOT FDOT FDOT FDOT FDOT handicapped# 2 11 14 6 10 5# Spaces 57 419 102 107 88 84# Used 52 27 57 31 37 34% Used 91.23% 6.44% 55.88% 28.97% 42.05% 40.48%Security Good Minimal Good Good Good GoodPavement Good Excellent Good Good Excellent GoodDebris None Minimal None None None MinimalSigning Good Excellent Good Good Good GoodFencing None Yes Good None None GoodBus/Train svc. Yes Bus only Yes Yes Yes PartiallyAccess OK Good Good OK Good GoodIllegal parking None None None None None NoneComments Nice facility,
very wellmaintained
Brand newfacility, not inexisting data,has six bus
Site is currentlybeing expanded,
should increase insize by 3 to 4 times
Three shelters onsite but has little
lighting
*Included in #spaces count.

D-11
Visit Date THUS 7/18/96 THUS 7/18/96 THUS 7/18/96 THUS 7/18/96 THUS 7/18/96 THUS 7/18/96Visit Time 2:00pm 2:18pm 2:36pm 2:45pm 3:15pm 4:05pmDistrict 4 4 4 4 4 4County Broward Broward Broward Broward Broward BrowardCounty Site # 2 3 4 5 6 10Area Ft. Lauderdale Ft Lauderdale Ft. Lauderdale Ft. Lauderdale Margate Pompano BeachLocation Airport Trirail
Ravenswood RdBroward & I-95 I-95 &
CommercialCypress Creek Rd &
AndrewsUS 441 & Atlantic NW 8 Ave & Sample
Rd
Maintained By FDOT FDOT FDOT FDOT FDOT FDOT# Handicapped* 2 18 2 5 0 11# Spaces 195 397 86 373 82 272# Used 118 2 9 136 4 56% Used 60.51% 0.50% 10.47% 36.46% 4.88% 20.59%Security Very good Excellent, on
duty guardGood Minimal Poor Good
Pavement Good Excellent Good Excellent Acceptable ExcellentDebris Minimal None Minimal None Minimal NoneSigning Good Excellent Good Good Poor GoodFencing Excellent Excellent Good Partially None NoneBus/Train svc. Yes Yes Bus only Bus only Bus only YesAccess Good Good OK Good Poor GoodIllegal parking None None None None None NoneComments Very well
maintained lotHard to find lot mustgo through shopping
center or BostonMarket to access
Well maintained
*Included in #spaces

D-12
Visit Date THUS 7/18/96 THUS 7/18/96 THUS 7/18/96** THUS 7/18/96 THUS 7/18/96 THUS 7/18/96Visit Time 12:00pm 12:48pm 4:50pmDistrict 4 4 4 4 4 4County Broward Broward Palm Beach Broward Broward BrowardCounty Site # 8 9 1 7 11 12Area Hollywood Pembroke Pines West Palm Beach Coconut Creek Coral Springs DavieLocation I-95 &
HollywoodCB Smith Park West Palm Beach
TrirailTurnpike & Sample
Rd.Coral Springs Mall
Sample & UniversityTurnpike & SR 84
Maintained By FDOT FDOT FDOT closed Shopping Center closed# Handicapped* 8 3 0# Spaces 181 71 see comments see comments see comments see comments# Used 132 10 15% Used 72.93% 14.08% naSecurity Fair Good MinimalPavement Good Good NoneDebris Minimal Minimal NoneSigning Good Good GoodFencing Partially Yes NoneBus/Train svc. Yes None YesAccess Good OK GoodIllegal parking None None 15Comments Picnic area,
shelter, andvolleyball court
No real parkingspaces, all users
parked on shoulderof the road
Site no longer exists Unable to determinespecific lot site.
Assumed that userscould park anywherein shopping center
so an accurate countcould not be made
Site no longerexists
*Included in #spaces
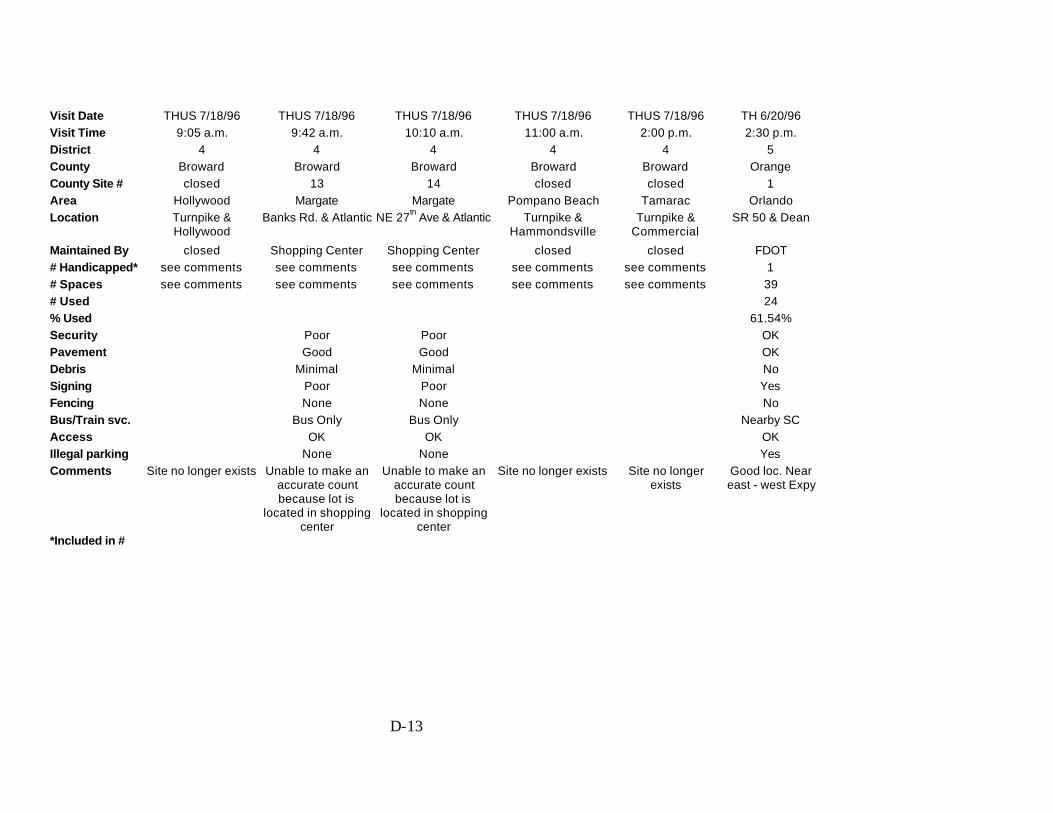
D-13
Visit Date THUS 7/18/96 THUS 7/18/96 THUS 7/18/96 THUS 7/18/96 THUS 7/18/96 TH 6/20/96Visit Time 9:05 a.m. 9:42 a.m. 10:10 a.m. 11:00 a.m. 2:00 p.m. 2:30 p.m.District 4 4 4 4 4 5County Broward Broward Broward Broward Broward OrangeCounty Site # closed 13 14 closed closed 1Area Hollywood Margate Margate Pompano Beach Tamarac OrlandoLocation Turnpike &
HollywoodBanks Rd. & Atlantic NE 27th Ave & Atlantic Turnpike &
HammondsvilleTurnpike &
CommercialSR 50 & Dean
Maintained By closed Shopping Center Shopping Center closed closed FDOT# Handicapped* see comments see comments see comments see comments see comments 1# Spaces see comments see comments see comments see comments see comments 39# Used 24% Used 61.54%Security Poor Poor OKPavement Good Good OKDebris Minimal Minimal NoSigning Poor Poor YesFencing None None NoBus/Train svc. Bus Only Bus Only Nearby SCAccess OK OK OKIllegal parking None None YesComments Site no longer exists Unable to make an
accurate countbecause lot is
located in shoppingcenter
Unable to make anaccurate countbecause lot is
located in shoppingcenter
Site no longer exists Site no longerexists
Good loc. Neareast - west Expy
*Included in #

D-14
Visit Date TH 6/20/96 TH 6/20/96 FRI 6/21/96 FRI 6/21/96 FRI 6/21/96 WED 7/17/96Visit Time 2:50 p.m. 3:20 p.m. 10:00 a.m. 3:00 p.m. 3:00 p.m. 9:15amDistrict 5 5 5 5 5 6County Orange Orange Volusia Orlando Orlando DadeCounty Site # 2 3 1 4 5 1Area Bithlo Orlando Deltona Orange Orange HomesteadLocation SR 50 & SR
419SR 15 &BeeLine
I-4 & Dirkson Blvd. Centroplex I Centroplex II Harris Field SW 312th
St. & US 1Maintained By FODT FDOT FDOT FDOT FDOT City# Handicapped* 5 1 0# Spaces 80 15 50 421 336 4# Used 19 9 41 86% Used 23.75% 60.00% 82.00% 38% 48% 0Security OK OK OK OK OK 0%Pavement OK OK OK OK OK OKDebris No No No No No GoodSigning Yes Yes No Yes Yes MinimalFencing No No No No No NoneBus svc. Yes, bench No No Yes Yes YesAccess OK OK OK OK OK NoneIllegal parking No No No No No OKComments Good sign on Downtown Downtown Not sure if correct lot*Included in # Spaces

D-15
Visit Date WED 7/17/96 WED 7/17/96 WED 7/17/96 WED 7/17/96 WED 7/17/96 WED 7/17/96Visit Time 9:40am 9:50am 10:00am 10:30am 11:10am 11:30amDistrict 6 6 6 6 6 6County Dade Dade Dade Dade Dade DadeCounty Site # 1 3 2 4 5 6Area SW Dade SW Dade SW Dade Kendale Lakes Kendale Lakes Kendale LakesLocation Tpk Ext. 11 & SW
216thTpk Ext 13 &SW 186th St.
Tpk Ext 16 & SW152nd St.
Hammocks TownCenter 104th & 154 St.
SW 157th & 72nd Ave Sunset & SW 117th Ave
Maintained By Turnpike Turnpike Transit Agency Shopping Center Shopping Center Shopping Center# Handicapped* 0 0 0 8 4 8# Spaces ? ? ? ? 21 ?# Used 0 1 15 ? 8 ?% Used 0% ? 38.10% ?Security Minimal Minimal Minimal Good Good GoodPavement Acceptable Acceptable Acceptable Good Excellent ExcellentDebris Minimal Minimal Minimal None None NoneSigning None None Yes None None NoneFencing None None None None None NoneBus/Train svc. None None Bus only Bus only Bus only Bus onlyIllegal parking None None None None None NoneAccess Good Good Good Good Good GoodComments Not maintained at all, Not
maintainedSpaces
unmarked,Unable to make an Needs signs to tell Unable to make accurate
*Included in #

D-16
Visit Date WED 7/17/96 WED 7/17/96 WED 7/17/96 WED 7/17/96 WED 7/17/96 WED 7/17/96Visit Time 12:00pm 12:15pm 12:30pm 12:45pm 1:05pm 1:15pmDistrict 6 6 6 6 6 6County Dade Dade Dade Dade Dade DadeCounty Site # 7 8 9 10 11 12Location Coral Way & SW 122
Ave113th & 104th Metro Dade CC
107th & 100thSR 874 & SW 88th St. SW 87th Ave & Sunset
Dr.West Lake Plz Sunset & 157th
AveArea Kendale Lakes Kendale Lakes Kendale Lakes Kendall Kendall Kendale LakesMaintained By Shopping Center FDOT Community FDOT FDOT Shopping Center# 4 0 12 0 0 8# Spaces see Comments 144 see Comments 25 77 see Comments# Used see Comments 16 see Comments 0 0 see Comments% Used see Comments 11% see Comments 0% 0% see CommentsSecurity Good Good Good Minimal None GoodPavement Good Excellent Excellent Poor Acceptable ExcellentDebris None None None Excessive Excessive NoneSigning None None None None None NoneFencing None None None Yes Yes NoneBus/Train svc. Bus only Bus only Bus only Bus only Bus only Bus OnlyAccess Good Good Good Good OK GoodIllegal parking None None None None None NoneComments 2 Bus stops on
roadside, goodaccess but no
designated area forPark & Ride lot so
accurate count wasnot possible
New facility notin existing data,has small bus
shelter.
Assumed thatusers can parkanywhere on
campus lot andtake bus fromthere, so an
accurate countcould not be
made.
Abandoned, poorlymaintained. Goodwill
truck parked theretaking up spaces
Lot in very poorcondition, lighting
non-existent, debris,everywhere, spaces
destroyed
No designated area for Park &Ride lot within shopping
center so an accurate countcould not be made
*Included in #

D-17
Visit Date WED 7/17/96 WED 7/17/96 WED 7/17/96 WED 7/17/96 WED 7/17/96 WED 7/17/96Visit Time 2:43pm 3:00pm 3:30pm 3:45pm 4:05pm 4:21pmDistrict 6 6 6 6 6 6County Dade Dade Dade Dade Dade DadeCounty Site # Metrorail Map Metrorail Map Metrorail Map Metrorail Map Metrorail Map Metrorail MapLocation Dadeland S Metrorail
StationDadeland N
Metrorail StationS. Miami Metrorail
StationUniversity Metrorail
StationDouglas Rd Metrorail
StationCoconut Grove Metrorail
StationArea Miami Miami Miami Miami Miami MiamiMaintained By MDTA MDTA MDTA MDTA MDTA MDTA# 21 32 15 7 4 5# Spaces 1404 1963 1798 293 440 199# Used 1350 1406 836 109 147 53% Used 96% 72% 46% 37% 33% 27%Security Excellent Excellent Excellent Average Minimal MinimalPavement Excellent Excellent Excellent Good Good GoodDebris None None None Minimal Minimal ExcessiveSigning Good Good Good Good Good GoodFencing None None None None None NoneBus/Train svc. Yes Yes Yes Yes Yes YesAccess Good Good Good OK Good GoodIllegal parking None None None None None NoneComments Big parking garage Big parking
garageBig parking
garage*Included in #

D-18
Visit Date WED 7/17/96 WED 7/17/96 WED 7/17/96 THUS 7/18/96 THUS 7/18/96 THUS 7/18/96Visit Time 4:30pm 8:44am 9:00am 9:15amDistrict 6 6 6 6 6 6County Dade Dade Dade Dade Dade DadeCounty Site # Metrorail Map Metrorail Map Metrorail Map Metrorail Map Metrorail Map Metrorail MapArea Miami Miami Miami Site A Hialeah MiamiLocation Vizcaya Metrorail
StationOvertown Metrorail
StationCulmer Metrorail
StationMiami Airport Tri-rail
SE14 St. & SE 9Terrace
OkeechobeeMetrorail Station
Hialeah MetrorailStation
Maintained By MDTA MDTA MDTA FDOT MDTA MDTA# Handicapped* 3 see comments 2 24 5# Spaces 91 35 64 1081 316# Used 24 29 52 589 81% Used 26% 83% 81% 54% 26%Security Minimal Minimal Excellent AveragePavement Good Good Excellent GoodDebris Minimal Minimal None MinimalSigning Good Good Good GoodFencing Yes None None PartiallyBus/Train svc. Yes Yes Yes YesAccess OK OK Good OKIllegal parking None None None NoneComments Could not find site
but used data fromOct '95 FDOT report
Site no longer exists Has 4 shelters,hard to find from
main road
Parking garage.About 200 spaceswere closed on the
upper level andwere not counted
when calculating #of spaces and %
occupied*Included in #

D-19
Visit Date MON 6/24/96 MON 6/24/96 MON 6/24/96 MON 6/24/96 MON 6/24/96 MON 6/24/96Visit Time 4:15 p.m. 4:30 p.m. 4:50 p.m. 5:18 p.m. 6:16 p.m. 9:29 a.m.District 7 7 7 7 7 7County Hillsborough Hillsborough Hillsborough Hillsborough Hillsborough HillsboroughCounty Site # 1 2 3 4 5 6Area Dover Brandon Brandon Brandon Mango/Seffner TampaLocation SR 60 & Dover Sadie & Pinewood Bryan & Bl’dale US 301 & Expy US 92 & SR 579 I-275 & YukonMaintained By FDOT County Church Church FDOT Transit Agency# Handicapped* 2 4 8 3# Spaces 14 116 63 111 85 306# Used 4 15 22 3 0 4% Used 28.57% 12.93% 34.92% 2.70% 0.00% 1.31%Security OK OK OK OK OK OKPavement OK OK OK OK OK OKDebris No No No No No NoSigning Yes Yes No No Yes YesFencing No No No Yes No YesBus svc. No Yes Yes No Yes YesAccess OK OK OK OK OK OKIllegal parking No No No Yes No NoComments needs striping parking in shade,
not designatedspaces
parking in shade,not in spaces
2 school busses after hours visit needs striping
*Included in # Spaces

D-20
Visit Date TU 6/25/96 TU 6/25/96 TU 6/25/96 TU 6/25/96 TU 6/25/96 TU 6/25/96Visit Time 9:55 a.m. 10:45 a.m. 10:55 a.m. 11:35 a.m. 11:50 12:25 p.m.District 7 7 7 7 7 7County Hillsborough Hillsborough Pasco Hillsborough Hillsborough HillsboroughCounty Site # 7 8 1 9 10 11Area Temple
TerraceLutz New Port Richie Citrus Park Carrollwood W. Carrollwood
Location City Hall & 56th US 41 & Crystal Lake SR 54 & US 41 Gunn Hwy. Casey & Gunn Ehrlich & ShawMaintained By City Church County FDOT FDOT Shopping Center# Handicapped* 6 1 4 2 3# Spaces 167 147 na - on grass 120 150 157# Used 51 16 0 4 4 11% Used 30.54% 10.88% na 3.33% 2.67% 7.01%Security OK OK OK OK OK OKPavement OK OK None OK OK OKDebris No No No No No NoSigning Yes Yes No Yes Yes YesFencing No No No partial No NoBus svc. Yes Yes No Yes Yes YesAccess OK OK OK OK OK OKIllegal parking Yes No No Yes No NoComments 1 commercial
truck parkedsome spaces are 15-minute parking, someday care/school vans
all carsconfirmed to be
sheriff’s or emer.Mgmt.’s
1 car for sale, atCo. park & fire
station
needs striping,has landscaping
by power plant12 spaces 15
minute
8 visitor spaces
*Included in # Spaces

D-21
Visit Date TU 6/25/1996 TU 6/25/1996 TU 6/25/1996 TU 6/25/1996 TU 6/25/1996 TU 6/25/1996Visit Time 12:50 p.m. 1:20 p.m. 2:30 p.m. 3:50 p.m. 4:20 p.m. 4:45District 7 7 7 7 7 7County Hillsborough Hillsborough Pinellas Pinellas Pinellas PinellasCounty Site # 12 13 1 2 3 4Area N. Carrollwood Town-n-Country Clearwater Clearwater Largo St. PetersburgLocation Dale Mabry &
N. Lakeview Dr.Hanley Rd. & Comanche
US 19 nearCurlew
McMullen Booth Rd.& SR 60, S of Drew
SR 688 & 125Ulmerton Road
22nd Ave. N & 19th St. Nnear I-275
Maintained By Transit Agency Church FDOT County County County# Handicapped* 4 3 0 5 1 0# Spaces 174 103 42 149 43 31# Used 7 17 18 1 11 16% Used 4.02% 16.50% 42.86% 0.67% 25.58% 51.61%Security OK OK OK OK OK OKPavement OK OK OK OK OK OKDebris No No No No No NoSigning Yes Yes Yes No Yes YesFencing No No No No No NoBus svc. Yes Yes Yes No Yes NoAccess OK OK OK OK OK OKIllegal parking No No Yes No Yes YesComments 4 spaces for staff
carssheriff’s office
closed lot, usedfor cop car
storage, Co.Courthouse still
there though
no bus after bridgebuilt, now calledBayside Family
Church
Local bus onUlmerton, 1 not
in parkingspace
1 car for sale, 1 comm.truck
*Included in # Spaces

D-22

E-1
APPENDIX ESITE SELECTION EVALUATION METHODOLOGY
This appendix contains technical material related to the evaluation and rank ordering of a number ofpark-and-ride sites. This material was taken from the AASHTO Design Guide for HOV and PublicTransfer Facilities [6].
Guide for the Design of High Occupancy Vehicle and Public Transfer FacilitiesPublished by the American Association of State Highway and Transportation Officials.
General Offices located at 444 North Capitol Street, N.W. Suite 225 Washington, D.C. 20001Copyright, 1983, by the American Association of State Highway and Transportation Officials. All
Rights Reserved. Printed in the United states of America The b or parts thereof, may not be reproducedin any form without permission of the publishers.
Appendix APRIORITY RATING OF PARK-AND-RIDE SITES
It is important to recognize that the methodology presented is offered for assistance to those agencies orindividuals having the responsibility for selecting transfer facilities. The specific factors used, as well asvalues_ assigned to the rating system, may vary, depending on local conditions or other situations thatarise in the site selection process. Those using the rating system should feel free to use other factors o.rating values as desired. A point rating system for each factor from zero to ten is used for simplicity withthe higher rating being desirable. It may also be desirable that the user apply a weight multiplier to thefactors selected for consideration.
There are many factors influencing the decision to implement a park-and-ride facility, includinggeographic, economic and human elements, as well as the people moving capability of transportationfacilities. Each of the factors should be reviewed for applicability to the local area.
The major elements covered are based on information gathered from those agencies currently operatingpark-and-ride facilities and reference sources used to develop this manual. The rating chart (Figure A-l)covers the major criteria and factors which are used to develop the priority ratings of sites to determine,from best available data, which sites in a given corridor or zone appear to offer the best chance forsuccess and investment of funds to implement park-and-ride facilities.
The primary categories of factors may be classified as follows:
1. Location Criteria2. Site Considerations3. Economic Considerations4. Potential User Costs and Time

Figure A-1Site 1 Site 2 Site 3
Location Criteria Within Dense Corridor
Tranist Service Potential
Proximity to Freeway Bottleneck
Visibility of Site
Distance to CBD or Activity Center
Access Convenience
Local Traffic Circulation
Commuter Driving Distance
Congestion - Site to Freeway
Bike Route Access
Total
Site Considerations Impact on Local Community (Adjacent)
Number of Parking Spaces
Expansion Potential
Parking Capacity - Adjacent Streets
Parking Security
Total Points
Economic Considerations Land Cost
Ease of Land Acquistion
Development Cost
Total Points
Grand Total
Potential Users Cost Driving Cost
Parking Cost
Transit Cost
Total Cost
Potential Users Time Driving Time
Waiting Time
Transit Time
Walking Time
Total Time

E-3
The last category, Potential User Costs and Time, is not used directly in the rating system, but doesprovide additional information that may prove of value in the site selection process.The following guidelines address each factor in Figure A-l that should be considered. The list of factorsmay be reduced or increased, depending on the availability of data and local conditions.
Location CriteriaThese factors relate to good or bad location features of a site based on the experience of park-and-ridesites that have already been implemented in various locations.
A. Within a Dense Corridor�If the potential site is within a dense corridor, the distance from the majorartery or freeway is the measuring value, with closeness to the artery the most desirable feature. Use thefollowing guide for reference in your rating:
AlongMajor Artery
10 Points
Within � MileOf Major Artery
8 Points
Within � MileOf Major Artery
6 Points
B. Transit Service Potential�If the site is near an existing transit line, this is a desirable feature. Use thefollowing guide for reference in your rating:
AlongTransit Line
10 Points
Within � Mile of Transit Line
8 Points
Within � Mileof Transit Line
6 Points
C. Outside Major Artery Bottleneck�Desirable sires should be located immediately upstream from abottleneck, to reduce vehicular traffic inbound through the bottleneck. Use the following guide forreference in your rating (distance relates to proximity upstream from arterial congestion).
Within� Mile
10 Points
Within One Mile8 Points
WithinTwo Miles6 Points
D. Visibility of Site�In order to attract users to a park-and-ride lot, the site should be visible from thefreeway or major arterial used by the commuter. Use the following guide for reference in your rating:
ClearlyVisible
10 Points
PartiallyVisible8 Points
NotVisible
O Points
E. Distance to CBD or Activity Center�Sites should be located more than one mile from the centralbusiness district or activity center, as commuters will normally accept walking distances less than onemile. However, if sites are too remote from the central business district or activity center, they also willnot generate sufficient users, and transit service will not be economically feasible. Use the followingguide for reference in your rating: (Keep in mind that metropolitan population areas over 1.5 million mayhave acceptable sites greater than 10 miles removed).
1-3 Miles 10 Points
5 Miles8 Points
10 Miles5 Points

E-4
F. Site Access Convenience A potential site should have good access (ingress and egress) from theroadway adjacent to the site in order to encourage use of the lot. In the case of new potential sites, itmay be possible to design for good access. whereas existing sites under consideration have more limitedoptions Use the following guide for reference in your rating:
Excellent10 Points
Good8 Points
Fair6 Points
G. Other Park-and-Ride Competition�If a site is too close to another existing park-and-ride facility,it will either attract commuters from that site, or not generate sufficient users to make the site aworthwhile investment. Use the following guide for reference in your rating:
NoCompetition
10 Points
PossibleCompetition
7 Points
DefiniteCompetition
4 Points
H. Local Traffic Circulation�A brief traffic engineering study should be performed to assure that theadditional traffic generated can be accommodated with minimum disruption to the present trafficcondition during anticipated peak hour usage. Use the following guide for reference in your rating oflocal traffic circulation:
Excellent10 Points
Good8 Points
Fair6 Points
I. Commuter Driving Distance�Previous experience indicates that 50 percent of park-and-ridecommuters drive less than five miles from their home to the site and approximately 90 percent drive lessthan ten miles. Use the following guide for reference in your rating:
1-3 Miles10 Points
4- 5 Miles 8 Points
7-10 Miles6 Points
J. Traffic Congestion�Site to Major Arterial or Freeway�Ability of the commuter to reach the sitefrom the freeway (or the return trip) is a measure of the attractiveness of any potential site. Trafficsignals on the route to the site are the normal cause of delay that can be measured, but other congestioncausing factors may also be used. Use the following guide for reference in your rating:
NoTraffic Signals
10 Points
1-2Traffic Signals
8 Points
3Traffic Signals
6 Points
K. Bike Route Access�Bicycle commuters may play a significant role in site selection. If so, theproximity of a bicycle route to the site should be considered. Use the following guide for reference inyour rating:
Bike RouteAt Site
10 Points
Bike RouteWithin 1 Mile
8 Points
Bike RouteWithin 3 Miles
6 Points
Site ConsiderationsA number of site consideration factors must be reviewed that are pertinent to selecting the best sitessuited to park-and-ride, including: the negative impact on the local community, the size of the site andpossible need for expansion, the extent of parking on adjacent streets and security.

E-5
A. Adverse Impact on Local Community�Certain local communities are very sensitive to additionaltraffic generators being placed in their environment, while others tend to be enthusiastic towardenergy/fuel conservation or traffic congestion relief measures. Use the following guide for reference inyour rating:
Minimal10 Points
Some8 Points
Serious3 Points
B. Land Area�Number Parking Spaces�This factor may or may not be necessary as a pertinentmeasure of the site selection evaluation process. However, if the number of site options is limited, theremay be a considerable variation in the amount of land area available for possible use at each site. Usethe following guide for reference in your rating:
Sufficient ToMeet Demand
10 Points
50 or LessParking Spaces
5 Points
C. Site Expansion Potential�In certain park-and-ride programs, a successful facility will cause theparking demand or usage to exceed the original site parking capacity. When this is a factor worthy ofconsideration in comparing sites, the expansion capability should be investigated. Use the followingguide for reference in your rating:
Excellent10 Points
Good8 Points
Fair6 Points
D. Parking Capacity�Adjacent Streets�A survey of daytime parking capacity on adjacent and nearbystreets should be made to determine whether potential users might prefer to park on existing streets andwalk to a transit stop, rather than use a park-and-ride facility. Available parking is therefore a detrimentto park-and-ride. Use the following guide for reference in your rating:
No ParkingAvailable10 Points
Some ParkingAvailable7 Points
ConsiderableAvailable4 Points
E. Parking Security�If a driver must risk the chance of vandalism or car theft, a site with this potentialproblem either will not be desirable, or will require fencing and gates or possibly an attendant. Use thefollowing guide. for reference in your rating:No Need ForAdded Security10 Points
Fence andGate Needed7 Points
AttendantNeeded4 Points
Economic ConsiderationsThese factors may be the most critical in your choice of park-and-ride sites, depending on availablesource of capital funding for construction of a new site, or possibly the time required to acquire land fora new site.
A. Land Cost�It is relatively simple to compare site cost when an opportunity to use publiclyowned land is compared with the purchase of private land. When comparing several sites that requireland purchase, the value of land in each area will vary. It is left to the individual or agency to make thisdetermination. Use the following guide for reference in your rating:
Lease Or Medium High

E-6
No Cost10 Points
Cost8 Points
Cost5 Points
B. Ease of Land Acquisition�Time to acquire and develop a site may also be an important factorwhen considering the need for park-and-ride implementation. Use the following guide for reference inyour rating:
Less Than 3 Months10 Points
SixMonths 7 Points
12Months4 Points
C. Develop Cost�A comparison of developmental costs for each site should be made. Use thefollowing guide for reference in your rating.
ExistingDeveloped Site
10 Points
MinimalCost
7 points
SubstantialCost
4 points
ProcedureThe above factors can be rated and summarized to make a direct comparison of potentialpark-and-ride sites. You will note that several factors have been weighted to a limited extent, andassigned lower point values because of the general degree of importance of the factor.
However, no attempt is made within this rating system to weigh all the various factors according toimportance because in some metropolitan areas certain factors may have more significance than thesame factors in other areas. The rater should feel free to apply weighted values if in his opinion onefactor should carry more importance than another.
Potential User Costs and TimeThese factors are not included in the point rating methodology for site comparison since their values(user cost and time) are not easily translated into the point rating system with a simple estimated value.However, each factor is directly related to the site selection process and deserves consideration. Costand lime factors are therefore included in Figure A for comparison purposes.
A. User Costs�Three components make up the total direct costs to the user: driving, parking andtransit costs.
1. Driving Cost�Estimate vehicle operating cost for the average trip distance from home to thepark-and-ride site and return.
2. Parking Cost�A charge for parking at the park-and-ride facility is not recommended. Noparking cost should be necessary, unless parking demand in the local community or centralbusiness district warrants some minimal charge.
3. Transit Cost�Use the fare structure of the local transit operating agency.
B. User Time1. Commuter Driving Time�This is the time from the commuter’s home to the park-and-ride site.
The following guide should be used for reference:

E-7
0-1 Mile5 Minutes
2-5 Miles6-10 Minutes
6-10 Miles11-20 Minutes
2. Waiting Time�This should usually be one-half the transit vehicle headway time. A suggestedheadway range is five minutes minimum and a desirable 10 minutes maximum. If waiting timeexceeds I5 minutes, it is likely that published transit schedules may be necessary.
3. Transit Time�is the time from the park and ride lot to the central business district or activitycenter. The following guide may be used for reference:
0-1 Mile5 Minutes
2-5 Miles6-15 Minutes
6-10 Miles16-30 Minutes
4. Walking Time�is the time from termination of the transit trip at the central business district oractivity center to the office or destination.
Using a four feet per second average walking speed and an average city block length of 30() feet’ anestimate of 100 seconds per block may be used. This also include an average delay for traffic signals.
SummaryThe methodology presented herein offers many subjective measures. It, therefore, is intended primarilyas a guide and quick reference to those factors believed to be essential to the site selection process witha reasonable degree of assurance of implementing a successful park-and-ride facility. It is alsorecognized that more advanced knowledge and experience will produce better methods of sitecomparison. However, in the meantime, the priority rating method can be used and modified asnecessary to satisfy local conditions.
Also, it should be recognized that these factors are most useful when comparing sites which have asimilar ridership potential. Given that the modal split for each of the sites being considered is close, thesite selection process should identify those sites which will attract the greatest number of riders, have areasonable cost, and at the same time have a favorable impact on the community.

F-1
APPENDIX F. LOT SURVEY MATERIALS
This appendix contains forms for use in conducting lot user and lot condition surveys. Theseforms were used during the Lot User Survey conducted during this study.

F-2
FDOT PARK & RIDE LOT USER SURVEYMORNING SURVEY FORM
LOT: _____________________________________ DATE: ________________________________________Good morning. I am conducting interviews of users of this lot for the FDOT. Your answers will assist in the future planning,construction and operation of park and ride lots to better serve Florida commuters. May I please ask you a few questionsconcerning your use of this lot today?
Where did your trip begin? CITY ___________________________________________________ADDRESS/ INTERSECTION ________________________________________________________
Is this your home? YES NO (circle one)About how long did it take you to get here? ______ minutes
Where will your trip end? CITY________________________________________________________ADDRESS/INTERSECTION________________________________________________________
Is this your home? YES NO (circle one)
Time to travel from here to where your trip will end? ______ minutes
What is your occupation?_______________________________________________________________
Is your home a single family (detached) dwelling unit? YES NO (circle one)How many people of driving age are in your household?__________________________How many vehicles in running condition are kept atyour home?_____________________________
Arrival Mode ______ AUTO ______ BUS _______WALK _______ BIKE ________OTHER
If auto, did you __ DRIVE ALONE __ SHARE A RIDE __GET DROPPED OFF
If a shared ride, how many were in the vehicle with you? _____________________________
How many times per week do you use this lot?________________________________
Departure Mode ___ CARPOOL ____BUS ___OTHER (Specify)_________________________________ VANPOOL ____ RAIL
If pool vehicle, how many others ride with you?_________
Why do you use this lot? _______________________________________________________
Trip Purpose: ___ WORK ___ OTHER (Specify)
How did you hear about this park and ride lot ? ________________________________________________
How did you make this trip before you found out about this lot? ____ DIDN’T MAKE TRIP ____DROVE ALONE ____CARPOOLED____ USED TRANSIT ____OTHER (Specify) ____________________________________________
What do you think about this lot? Overcrowded? Unsafe?
Access Problems? Better advertised? Better signage?
Other comments? (Use back to record response if necessary)_______________________________________________________________________
_______________________________________________________________________Thank you for participating in this survey. Have a good day.

F-3
FDOT PARK & RIDE LOT USER SURVEYAFTERNOON SURVEY FORM
LOT: _____________________________________ DATE: ________________________________________Good afternoon. I am conducting interviews of users of this lot for the FDOT. Your answers will assist in the future planning,construction and operation of park and ride lots to better serve Florida commuters. May I please ask you a few questionsconcerning your use of this lot today?
Where did your trip begin? CITY ___________________________________________________ADDRESS/ INTERSECTION ________________________________________________________Is this your home? YES NO (circle one)
About how long did it take you to get here? ___________minutesWhere will your trip end? CITY________________________________________________________ADDRESS/INTERSECTION________________________________________________________Is this your home? YES NO (circle one)
Time to travel from here to where your trip will end? __________ min
What is your occupation?_______________________________________________________________
Is your home a single family (detached) dwelling unit? YES NO (circle one)
How many people of driving age are in your household? __________________________
How many vehicles in running condition are kept at your home?_____________________________
Arrival Mode ___ CARPOOL ____BUS ___ VANPOOL ____ RAIL ____ OTHER(Specify)__________________
If pool vehicle, how many others ride with you?_________
Departure Mode: ______ AUTO ______ BUS _______WALK _______BIKE ______OTHER
If auto, did you __ DRIVE ALONE __ SHARE A RIDE __GET DROPPED OFFIf a shared ride, how many were in the vehicle with you? _____________________________How many times per week do you use this lot? ________________________________
Why do you use this lot? _______________________________________________________Trip Purpose: ___ WORK ___ OTHER (Specify)
How did you hear about this park and ride lot ? ________________________________________________
How did you make this trip before you found out about this lot? ____ DIDN’T MAKE TRIP____DROVE ALONE ____CARPOOLED ___ USED TRANSIT ____ OTHER (Specify)
What do you think about this lot? Overcrowded? Unsafe?
Access Problems? Better advertised? Better signage?Other comments? (Use back to record response if necessary)_______________________________________________________________________
_______________________________________________________________________Thank you for participating in this survey. Have a good evening.

F-4
PARKING ACCUMULATION SURVEY
LOT: DATE:
TOTAL MARKED SPACES:TIME OCCUPIED SPACES NOTES
6:30 am6:457:007:157:307:458:008.158:308:459:00

F-5
LOT INVENTORY SHEET
SKETCH
NUMBER OF SPACES: _________________________
SECURITY:________________________________________________________________________________________________________________________________________________
PAVEMENT:_______________________________________________________________________________________________________________________________________________
SIGNING:___________________________________________________________________________________________________________________________________________________
FENCING:__________________________________________________________________________________________________________________________________________________
BUS STOPS/SERVICE:________________________________________________________
ACCESS:____________________________________________________________________
ILLEGAL PARKING: __________________________________________________________
COMMENTS:_____________________________________________________________________________________________________________________________________________________________________________________________________

F-6
FLORIDA DEPARTMENT OF TRANSPORTATIONPARK-AND-RIDE USER SURVEY
Dear Park-and-Ride User:Due to upcoming design revisions in the Turnpike rebuilding project, several Park-and-Ride lots need tobe relocated.
Please answer the following questions so that we may better serve your needs when choosing analternate site. All answers are confidential. Thank you for your cooperation.
1. Which Park-and-Ride lot are you currently using?
_____Sample Road & Turnpike_____Hammondsville Road & Turnpike_____Commercial Blvd. & Turnpike_____Sunrise Blvd. & Turnpike_____Hollywood B1vd. & Turnpike_____Other (please specify)
2. Approximately how many times per week do you use a Park-and-Ride lot? ________
3. Do you carpool? ___ Yes ___ No
If so, with how many other people? ____________
4. When using the Park-and-Ride lot, do you then use the Turnpike for your carpooling trips? ___Yes ____ No
5. What are the two nearest cross streets to your residence? In what city?________________
6. Why do you use Park-and-Ride lots? ___________________________________________________________________________________________________________________________________________________________________________________________________________________________________________
7. Please provide any other comments on back of paper.
ONCE AGAIN, THANK YOU VERYMUCH
Please mail to: Allison C. Smith, PTO,Department of Transportation, 760 SW 24 St., Ft. Laud., FL 33315
Figure 4. District IV Turnpike Questionnaire

G-1
APPENDIX G. ANALYSIS WORKSHEETSThis appendix contains worksheets for use in executing the demand estimation and impact assessmentprocedures presented in this planning manual. The following four tables provide an index to theworksheets.
WORKSHEETS FOR DEMAND ANALYSISWORKSHEET T I T L ED-1 Demand estimation for remote lotsD-2 Demand estimation for urban fringe lots and small area corridor lots without transitD-3 Alternative method for developing total daily trip interchanges for corridor lotsD-4 Mode split input data for corridor lots with transitD-5 Modal disutilities for large urban area corridor lotsD-6 Primary-level mode shares for large urban area corridor lotsD-7 Secondary-level modal shares for large urban area corridor lotsD-8 Parking space requirement for large urban area corridor lotsD-9 Modal disutilities for small urban area corridor lots with transitD-10 Primary-level modal shares for small urban area corridor lots with transitD-11 Secondary-level modal shares for small urban area corridor lots with transitD-12 Parking space requirements for small urban area corridor lots with transitD-13 Demand estimation for peripheral lot
WORKSHEETS FOR FUEL CONSUMPTION AND EMISSION IMPACT ANALYSISWORKSHEET T I T L EI-1 Impact analysis for remote lotsI-2 Impact analysis for peripheral lotsI-3 Annual VMT reductions for urban fringe and corridor lotsI-4 Segment-level fuel consumption change for urban fringe and corridor lotsI-5 Summary fuel consumption changes for urban fringe and corridor lotsI-6 Changes in daily segment-level carbon monoxide emissionsI-7 Summary carbon monoxide emission changes for urban fringe and corridor lotsI-8 Changes in daily segment-level hydrocarbon emissionsI-9 Summary hydrocarbon emission changes for urban fringe and corridor lotsI-10 Changes in daily segment-level nitrogen oxide emissions -I-11 Summary nitrogen oxide emission changes for urban fringe and corridor lots
WORKSHEETS FOR TRAVEL TIME IMPACT ANALYSISWORKSHEET T I T L ET-1 Travel time elements for path segments of urban fringe and corridor lotsT-2 Summary of travel time elements for highway paths of urban fringe and corridor lotsT-3 Daily path VHT and PHT reductions for urban fringe and corridor lotsT-4 Annual reduction in VHT and PHT for urban fringe and corridor lots
WORKSHEETS FOR SYSTEM PERFORMANCE ANALYSISWORKSHEET T I T L EP-1 VMT reductionP-2 User cost savingsP-3 Change in average vehicle occupancyP-4 Annual fuel savings and emission reductionsP-5 Value of accident reduction

G-2
WORKSHEET APPLICATION REFERENCE TABLE
Facility LevelDemandAnalysis
FuelImpacts
EmissionsImpacts
Travel TimeImpacts
VMTReduction
User Cost Savings Change in Occupancy AccidentImpacts
System-Wide P-4 P-4 P-1 P-2 P-3 P-5
Remote D-1 I-1 I-1 I-1
Peripheral D-13 I-2 I-2 I-2
Large AreaCorridor
D-3D-4
I-4I-5
I-6I-7
T-1T-2
I-3
D-5 I-8 T-3D-6 I-9 T-4D-7 I-10D-8 I-11
Small AreaTransit Corridor
D-3D-4
I-4I-5
I-6I-7
T-1T-2
I-3
D-9 I-8 T-3D-10 I-9 T-4D-11 I-10D-12 I-11
Urban Fringe andSmall Area Non-transit Corridor
D-2 I-4I-5
I-6I-7I-8I-9
T-1T-2T-3T-4
I-3
I-10I-11

G-3
WORKSHEET D-1 DEMAND ESTIMATION��REMOTE LOT
Data Required: 1. Count of actual informal parking.2. Population growth data at the home end and the employment growth data at the destination end.
Definitions: POPd Design year population at the home end.POPc Current year population at the home end.EMPd Design year employment at the destination end.EMPc Current year employment at the destination end.Fpop Population growth factor.FEMP Employment growth factor.OIP Observed informal parking.
1. Compute Population and Employment Growth Factors:A. Population Growth Factor = ( ______ / ______ ) = ________
POPd POPc Fpop
B. Employment Growth Factor = ( ______ / ______ ) = ________ EMPd EMPc FEMP
2. Compute the Design Year Parking Demand:Design Year Parking Demand = (1+ ______) * SQRT( ______ * _______) = ______________
OIP Fpop Fpop Femp
WORKSHEET D-1

G-4
WORKSHEET D-2 DEMAND ESTIMATION��URBAN FRINGE LOTS AND SMALL AREA CORRIDOR LOTS WITHOUT TRANSIT
Data Required: Traffic volume counts for the adjacent primary and secondary facilities, preferably 15-minute counts so the �design period� can be identified.Definitions: ADTp Two-way average daily traffic for the primary facility.
ADTs Two-way average daily traffic for the secondary facility.K Peak hour percentage. Refer to Table 4-5.D Directional distribution of traffic. Refer to Table 4-5.DP Design Period, the pronounced peak traffic period, identified from the 15 minute traffic counts or suggested value from Table 4-4.
1. Convert AADT Traffic Volume to the �Design Period� Volume, if 15-minute counts are not available
A. Convert primary facility AADT to �Design Period� Volume =_____ * ______ * ______ * ______ / 60 = _______ADTp K D DP Vp
B. Convert secondary facility AADT to �Design Period� Volume =_____ * ______ * ______ * ______ / 60 = _______ADTs K D DP Vs
2. Estimate the Parking DemandParking Demand = 0.03 * _______ + 0.01 * _______ = _______
Vp Vs
WORKSHEET D-2

G-5
WORKSHEET D-3 ALTERNATIVE METHOD FOR DEVELOPING TOTAL DAILY TRIP INTERCHANGES FOR CORRIDOR LOTS
Data Required: 1. Dwelling units in the origin market influence area, from FSUTMS data sets.2. Employment data from FSUTMS data sets.3. Average home-base work trip length from local urban model if available.
Definitions: TRIPod Trip interchanges between the origin and destination market influence areas.DUo Dwelling units in the origin market influence area with one or more autos. See STEP 1A in �Detailed Methodology for Transit
Facilities.� Section, Chapter 4.EMPd Destination area employment, tallied from FSUTMS data set for those zones in the destination market influence area specified
by following the STEP 1B in �Detailed Methodology for Transit Facilities� Section, Chapter 4.HBW Home-base work trip rate from urban model or Table 4-7.EMPtot Total urban area employment by summing employment of all TAZ zones in the urban area model.Lavg Average home-base work trip length from urban model trip distribution output or use Table 4-7.Dp Average distance between the origin and destination influence areas. Measured from maps.
Compute Trip InterchangesPerson Trip Interchanges:TRIPod= _____ * ______ * (_______ / ______) / 2 * (_______ / ______) = _________
DUo HBW EMPd EMPtot Lavg Dp Tripod
WORKSHEET D-3

G-6
WORKSHEET D-4 MODE SPLIT INPUT DATA FOR CORRIDOR LOTS WITH TRANSIT
Mode VariableIn Vehicle
Travel Time(minutes)
Excess Time
(minutes)Out of Pocket
Costs (dollars)Cost
(dollars)
1. Drive-Alone Auto Origin terminal timeDrive timeDestination terminal timeTollsParking costOut operating costTotal
1A. Drive Alone auto accessing Origin terminal time park-and-ride facility Travel time to lot
Lot access timeLot park cost per occupantWait timeLot to destination driving timeDestination egress timeTollsParking costAuto op costTotal
2. Two-Occupant Auto Origin terminal timeDrive timeDestination terminal timeToll charge/occupantParking cost/occupantOut operating cost/occupantTotal

G-7
Mode Variable
In VehicleTravel Time(minutes)
Excess Time
(minutes)
Out of PocketCosts
(dollars)
Cost(dollars)
2A. 2-occupant carpool accessing Origin terminal timepark-and-ride facility Travel time to lot
Lot park cost per occupantLot access timeWait timeLot to destination driving timeDestination egress timeToll charge/occupantDest. park cost per occupantAuto op cost per occupantTotal
3. Three-Occupant Auto Origin terminal timeDrive timeDestination terminal timeTolls charge/occupantParking cost/occupantOut operating cost/occupantTotal
3A. 3+ occupant carpool accessing Origin terminal timepark-and-ride facility Travel time to lot
Lot park cost per occupantLot access timeWait timeLot to destination driving timeDestination egress timeDest. park cost per occupantAuto op cost per occupantTotal

G-8
Mode Variable
In VehicleTravel Time(minutes)
Excess Time
(minutes)Out of Pocket
Costs (dollars)Cost
(dollars)
4. Local Bus with Walk Access Walk timeWait timeBus run timeTransfer timeDestination egress timeBus fareTransfer chargeTotal
5. Line Haul with Walk or Local Bus Walk timeAccess1 Wait time
Bus run timeTransfer timeDestination egress timeLocal bus fareLine haul fareLine haul run timeTotal
6. Line Haul with Drive Alone Auto Origin terminal time Access1 Drive time
TollsPark costAuto operating costLot access timeWait timeLine haul travel time
1Note: Data for modes 5 and 6 are required for larger Line haul fare
urban area model only Destination egress timeTotal
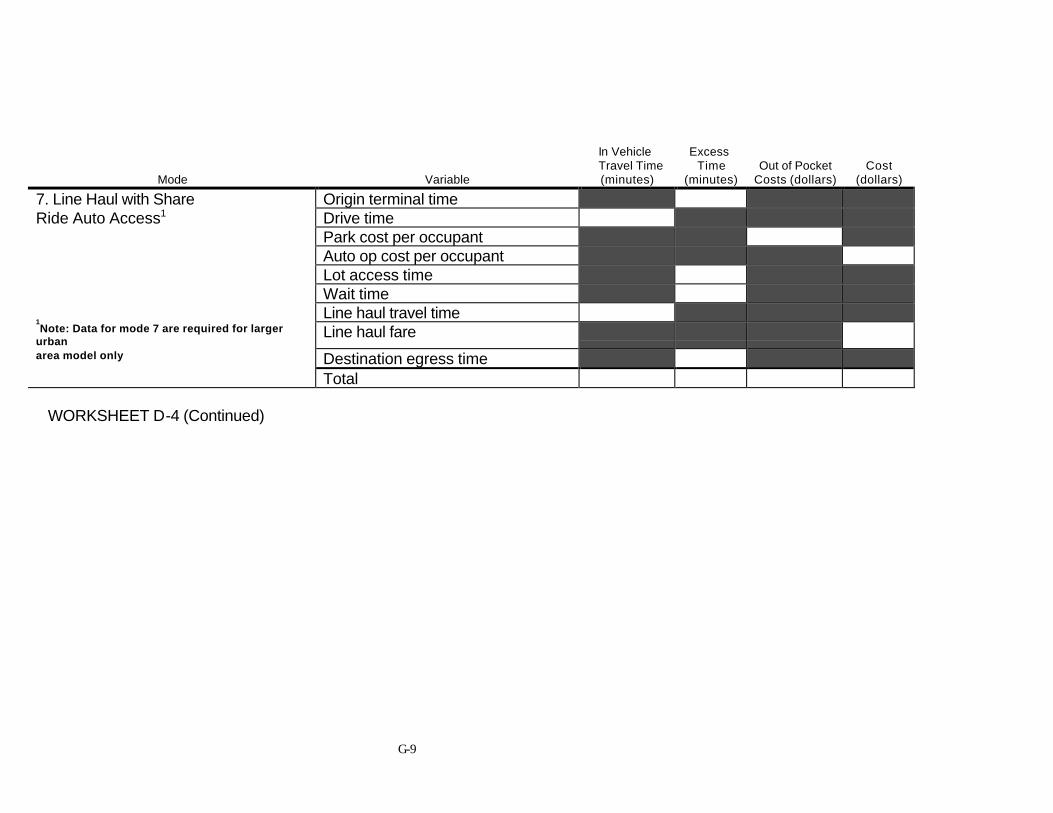
G-9
Mode Variable
In VehicleTravel Time(minutes)
Excess Time
(minutes)Out of Pocket
Costs (dollars)Cost
(dollars)
7. Line Haul with Share Origin terminal timeRide Auto Access1 Drive time
Park cost per occupantAuto op cost per occupantLot access timeWait timeLine haul travel time
1Note: Data for mode 7 are required for larger
urbanLine haul fare
area model only Destination egress timeTotal
WORKSHEET D-4 (Continued)

G-10
WORKSHEET D-5 MODE DISUTILITIES FOR LARGE URBAN AREA CORRIDOR LOTS
Data Required: Worksheet D-4 Mode split input data for Corridor lots.
Definitions: IVTT In-Vehicle Travel Time. OC Other costsOVTT Excess Time. DUi Disutility of Mode i.PK Out of Pocket Cost.
Calculate Primary Level Mode Disutilities1. Drive Alone Auto:
DU1= .015 *_______ +.14*______ +.021 *_____ +.005 *______ +0.00 =________IVTT OVTT PK OC DU1
2. Two-Occupant Auto:DU2= .015 *______ +.14*______ +.021 *______ +.005 *_______ +1.90 =________
IVTT OVTT PK OC DU2
3. Three-Occupant Auto:DU3= .015 *______ +.14*_____ +.021 *______ +.005 *_______ +2.60 =_________
IVTT OVTT PK OC DU3
4. Local Bus W/ Walk Access:DU4= .015 *_____ +.14*_____ +.021 *______ +.005 *_______ +0.45 =_________
IVTT OVTT PK OC DU4
5. Line Haul W/ Walk or Local Bus Access:DU5= .015 *_____ +.14*_____ +.021 * ______ +.005 * ______ +1.70 =_________
IVTT OVTT PK OC DU5
6. Line Haul W/ Drive Alone Access:DU6= .015 *_____ +.14*______ +.021 *______ +.005 *_______ +3.40 =_________
IVTT OVTT PK OC DU6
7. Line Haul W/ Share-Ride Access:DU7= .015 *______ +.14*______ +.021 *______ +.005 *______ +4.25 =_______
IVTT OVTT PK OC DU7

G-11
WORKSHEET D-5 (Continued)
Calculate Secondary Level Mode Disutilities1. Drive Alone Auto Accessing Park-and-Ride Facility:
DU1A= .015 *______ +.14*______ +.021 *_______ +.005 *______ +3.40 =________ IVTT OVTT PK OC DU1A
2. Two-Occupant Auto Accessing Park-and-Ride Facility: DU2A= .015 *______ +.14*_____ +.021 *______ +.005 *______ +4.25 =________
IVTT OVTT PK OC DU2A
3. Three-Occupant Auto Accessing Park-and Ride Facility:DU3A= .015 *______ +.14*_____ +.021 *______ +.005 *______ +4.25 =________
IVTT OVTT PK OC DU3A
WORKSHEET D-5

G-12
WORKSHEET D-6 PRIMARY-LEVEL MODAL SHARES FOR LARGE URBAN AREA CORRIDOR LOTS
Data Required: Mode disutilities from Worksheet D-S.Definitions: DUi Disutility of mode i.
Pi Probability of using mode i.NEi Exponential of Negative DUi
SNE Sum of all NEi’sCompute Exponential of Negative Disutilities for Primary Level Modes and Sum
1. Exponential of negative DU1: EXP(-DU1)= EXP( - ______ ) = _______(Drive Alone Auto) DU1 NE1
2. Exponential of negative DU2: EXP(-DU2)= EXP( - ______ ) = _______(Two-Occupant Auto) DU2 NE2
3. Exponential of negative DU3: EXP(-DU3)= EXP( - ______ ) = _______(Three-Occupant Auto) DU3 NE3
4. Exponential of negative DU4: EXP(-DU4)= EXP( - ______ ) = _______(Local Bus W/ Walk Access) DU4 NE4
5. Exponential of negative DU5: EXP(-DU5)= EXP( - ______ ) = _______(Line Haul W/ Walk or Local Bus Access) DU5 NE5
6. Exponential of negative DU6: EXP(-DU6)= EXP( - ______ ) = _______(Line Haul W/ Drive Alone Access) DU6 NE6
7. Exponential of negative DU7: EXP(-DU7)= EXP( - ______ ) = _______(Line Haul W/ Share-Ride Access) DU7 NE7
___________________________________________________________________________________________________8. SUM ΣI=1, 7 EXP(-Dui) = __________
SNE
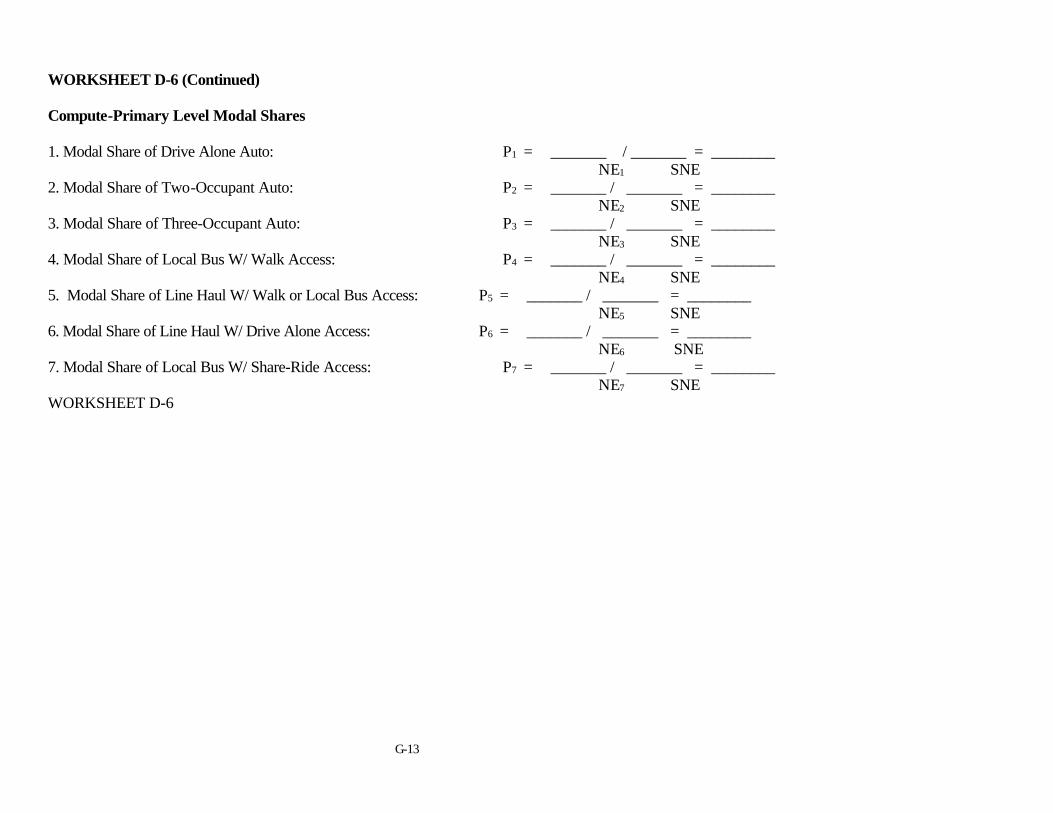
G-13
WORKSHEET D-6 (Continued)
Compute-Primary Level Modal Shares
1. Modal Share of Drive Alone Auto: P1 = _______ / _______ = ________NE1 SNE
2. Modal Share of Two-Occupant Auto: P2 = _______ / _______ = ________NE2 SNE
3. Modal Share of Three-Occupant Auto: P3 = _______ / _______ = ________NE3 SNE
4. Modal Share of Local Bus W/ Walk Access: P4 = _______ / _______ = ________NE4 SNE
5. Modal Share of Line Haul W/ Walk or Local Bus Access: P5 = _______ / _______ = ________NE5 SNE
6. Modal Share of Line Haul W/ Drive Alone Access: P6 = _______ / _______ = ________NE6 SNE
7. Modal Share of Local Bus W/ Share-Ride Access: P7 = _______ / _______ = ________NE7 SNE
WORKSHEET D-6

G-14
WORKSHEET D-7 COMPUTE SECONDARY-LEVEL MODAL SHARES FOR LARGE URBAN AREA CORRIDOR LOTSData Required: Mode disutilities from Worksheet D-5 and the primary modal shares from Worksheet D-6.Definitions: DUiA Disutility of secondary level mode iA.
NEiA Exponential of negative DU for mode iA.PiA Probability of using a particular mode iA.iA Notations for secondary level modes, i=1 to 3.
Compute Exponential of Negative Disutilities for Secondary Level Modes
1. Exponential of negative DU1A: EXP(-DU1A) = EXP( -_______ ) = ________(Drive Alone Auto Accessing P&R Facility) DU1A NE1A
2. Exponential of negative DU2A: EXP(-DU2A) = EXP( -_______ ) = ________(2-Occupant Auto Accessing P&R Facility) DU2A NE2A
3. Exponential of negative DU3A: EXP (-DU3A ) = EXP( -_______ ) = _______(3+ Occupant Auto Accessing P&R Facility) DU3A NE2A
Compute Secondary Level Modal Shares1. Modal Share of Mode 1A: P1A = ________ *_______ / ( ______ + ______ ) =________
(Drive Alone Auto Accessing P&R Facility) P1 NE1A NE1 NE1A P1A
2. Modal Share of Mode 2A: P2A = ________ * _______ / ( ______ + ______ ) = _________ (2-Occupant Auto Accessing P&R Facility) P2 NE2A NE2 NE2A P2A
3. Modal Share of Mode 3A: P3A = ________ *________ / ( ______ + ______ ) = _________(3+ Occupant Auto Accessing P&R Facility) P3 NE3A NE3 NE3A P3A
WORKSHEET D-7
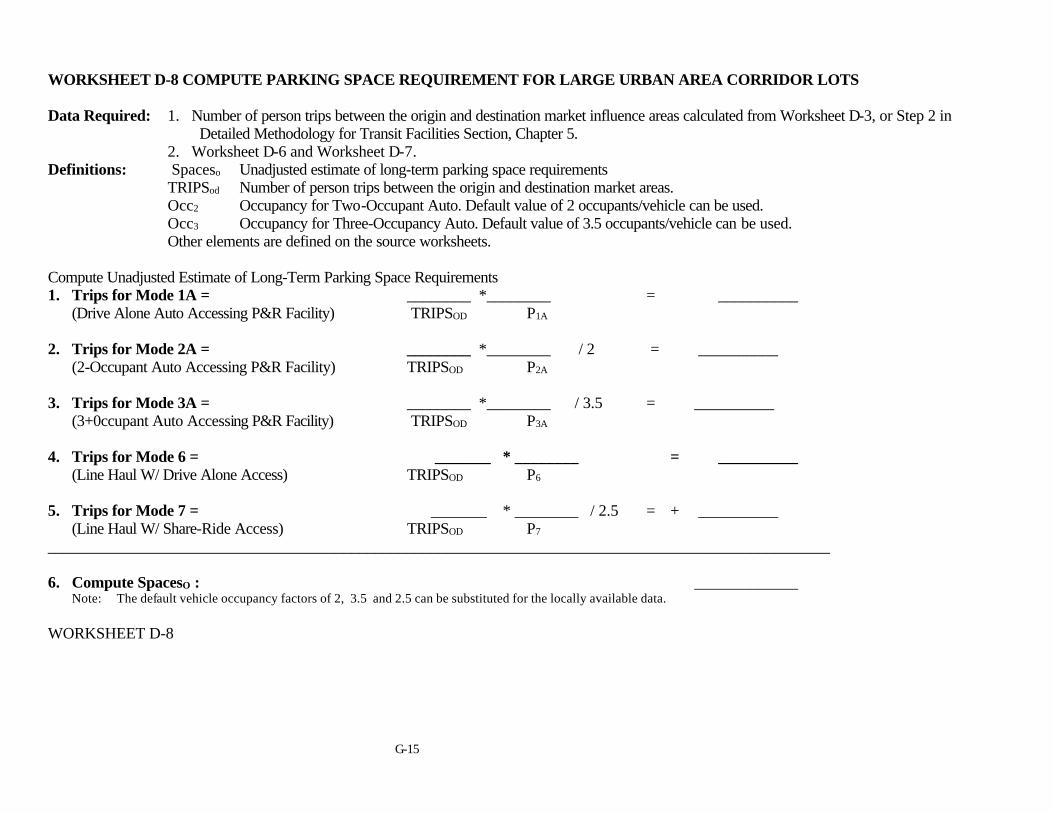
G-15
WORKSHEET D-8 COMPUTE PARKING SPACE REQUIREMENT FOR LARGE URBAN AREA CORRIDOR LOTS
Data Required: 1. Number of person trips between the origin and destination market influence areas calculated from Worksheet D-3, or Step 2 in�Detailed Methodology for Transit Facilities Section, Chapter 5.
2. Worksheet D-6 and Worksheet D-7.Definitions: Spaceso Unadjusted estimate of long-term parking space requirements
TRIPSod Number of person trips between the origin and destination market areas.Occ2 Occupancy for Two-Occupant Auto. Default value of 2 occupants/vehicle can be used.Occ3 Occupancy for Three-Occupancy Auto. Default value of 3.5 occupants/vehicle can be used.Other elements are defined on the source worksheets.
Compute Unadjusted Estimate of Long-Term Parking Space Requirements1. Trips for Mode 1A = ________ *________ = __________
(Drive Alone Auto Accessing P&R Facility) TRIPSOD P1A
2. Trips for Mode 2A = ________ *________ / 2 = __________(2-Occupant Auto Accessing P&R Facility) TRIPSOD P2A
3. Trips for Mode 3A = ________ *________ / 3.5 = __________(3+0ccupant Auto Accessing P&R Facility) TRIPSOD P3A
4. Trips for Mode 6 = _______ * ________ = __________(Line Haul W/ Drive Alone Access) TRIPSOD P6
5. Trips for Mode 7 = _______ * ________ / 2.5 = + __________(Line Haul W/ Share-Ride Access) TRIPSOD P7
__________________________________________________________________________________________________
6. Compute SpacesO : _____________Note: The default vehicle occupancy factors of 2, 3.5 and 2.5 can be substituted for the locally available data.
WORKSHEET D-8

G-16
WORKSHEET D-9 MODE DISUTILITIES FOR SMALL URBAN AREA CORRIDOR LOTS WITH TRANSIT
Data Required: Worksheet D-4 Mode split input data for corridor lotsDefinitions: IVTT In-Vehicle Travel Time. OVTT Excess Time.
PK Out of Pocket Cost. OC Other Costs.
Calculate Primary Level Mode Disutilities1. Drive Alone Auto:
DU1 = .015 *_______ +.14 *________ +.021 *_______ +.005 *________ +0.00 =_________IVTT OVTT PK OC DU1
2. Two-Occupant Auto:DU2 = .015 *_______ + .14 *_______ +.021 *_______ +. 005 *_______ + 2.18 = __________
IVTT OVTT PK OC DU2
3. Three-Occupant Auto:DU3 = .015 *________ + .14 *______ +.021 *_______ + .005 *_______ +3.34 = ________
IVTT OVTT PK OC DU3
4. Transit:DU4 = .015 *________ + .14 *_______ + .021 * _______ + .005 *_______ + 1.31 = ________
IVTT OVTT PK OC DU4
Calculate Secondary Level Mode Disutilities1. Carpools from Drive Alone Auto:
DU1A = . 015 *________ + . 14 *________ + .021 * ________ + .005 *________ + 3.34 =__________IVTT OVTT PK OC DU1A
2. Carpools from Two-Occupant Auto:DU2A = .015 *________ +.14 *________ + .021 *_________ +.005 *________ + 5.52 = _________
IVTT OVTT PK OC DU2A
3. Carpools from Three-Occupant Auto:DU3A =. 015 *________ + .14 *________ + .021 *_________ + .005 *_______ + 6.68 =__________

G-17
IVTT OVTT PK OC DU3A
WORKSHEET D-9

G-18
WORKSHEET D-10 PRIMARY-LEVEL MODAL SHARES FOR SMALL URBAN AREA CORRIDOR LOTS WITH TRANSITData Required: Mode disutilities from Worksheet D-9
Definitions: DUi Disutility of mode i. Pi Probability of using mode iNEi Exponential of negative DUi SNE Sum of all NEi �s
Compute Exponential of Negative Disutilities for Primary Level Modes and Sum
1. Exponential of negative DU1: EXP ( -DU1 ) = EXP (-______ ) =________(Drive Alone Auto) DU1 NE1
2. Exponential of negative DU2: EXP ( -DU2 ) = EXP (-______ ) =________(Two-Occupant Auto) DU2 NE2
3. Exponential of negative DU3: EXP ( -DU3 ) = EXP (-______ ) =________ (Three-Occupant Auto) DU3 NE3
4. Exponential of negative DU4: + EXP ( -DU4 ) = EXP (-______ ) =________(Transit) DU4 NE4
_____________________________________________________________________________________
5. Sum Σi=1,4 EXP(-DUi) =________ SNE
Compute Primary Level Modal Shares
1. Modal Share of Drive Alone Auto: P1 = ________ /________ = _________NE1 SNE
2. Modal Share of Two-Occupant Auto: P2 = ________ /_________ = _________NE2 SNE
3. Modal Share of Three-Occupant Auto: P3 = ________ /_________ = _________NE3 SNE
4. Modal Share of Transit: P4 = ________ / ________ = _________ NE4 SNE

G-19
WORKSHEET D-10
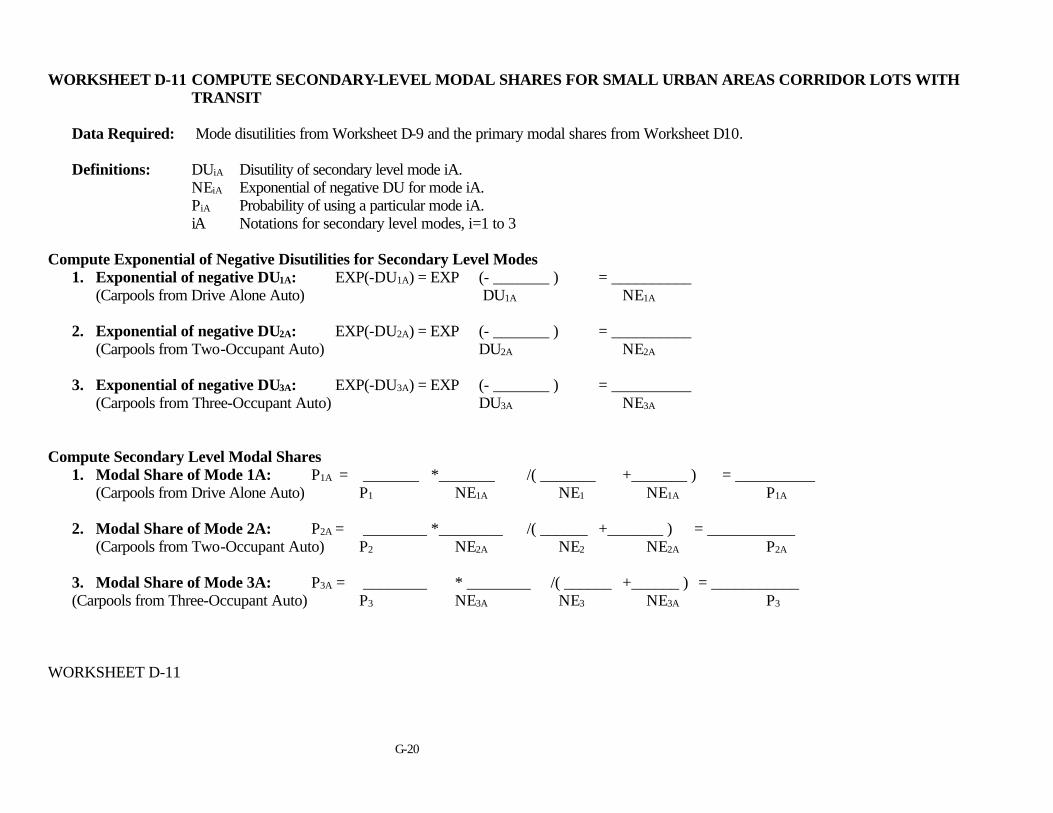
G-20
WORKSHEET D-11 COMPUTE SECONDARY-LEVEL MODAL SHARES FOR SMALL URBAN AREAS CORRIDOR LOTS WITHTRANSIT
Data Required: Mode disutilities from Worksheet D-9 and the primary modal shares from Worksheet D10.
Definitions: DUiA Disutility of secondary level mode iA.NEiA Exponential of negative DU for mode iA.PiA Probability of using a particular mode iA.iA Notations for secondary level modes, i=1 to 3
Compute Exponential of Negative Disutilities for Secondary Level Modes1. Exponential of negative DU1A: EXP(-DU1A) = EXP (- _______ ) = __________
(Carpools from Drive Alone Auto) DU1A NE1A
2. Exponential of negative DU2A: EXP(-DU2A) = EXP (- _______ ) = __________(Carpools from Two-Occupant Auto) DU2A NE2A
3. Exponential of negative DU3A: EXP(-DU3A) = EXP (- _______ ) = __________(Carpools from Three-Occupant Auto) DU3A NE3A
Compute Secondary Level Modal Shares1. Modal Share of Mode 1A: P1A = _______ *_______ /( _______ +_______ ) = __________
(Carpools from Drive Alone Auto) P1 NE1A NE1 NE1A P1A
2. Modal Share of Mode 2A: P2A = ________ *________ /( ______ +_______ ) = ___________(Carpools from Two-Occupant Auto) P2 NE2A NE2 NE2A P2A
3. Modal Share of Mode 3A: P3A = ________ * ________ /( ______ +______ ) = ___________(Carpools from Three-Occupant Auto) P3 NE3A NE3 NE3A P3
WORKSHEET D-11

G-21
WORKSHEET D-12 COMPUTE PARKING SPACE REQUIREMENT FOR SMALL URBAN AREA CORRIDOR LOTS WITH TRANSIT
Data Required: 1. Number of person trips between the origin and destination market influence areas calculated from Worksheet D-3, or Step 2 in�Detailed Methodology for Transit Facilities� Section, Chapter 5.
2. Worksheet D-11.
Definitions: Spaceso Unadjusted estimate of long-term parking space requirements.TRIPSod Number of person trips between the origin and destination market areas.Occ2 Occupancy for Two-Occupant Auto. Default value of 2 occupants/vehicle can be used.Occ3 Occupancy for Three-Occupancy Auto. Default value of 3.5 occupants/vehicle can be used.Other elements are defined on the source worksheets.
Compute Unadjusted Estimate of Long-Term Parking Space Requirements
1. Trips for Mode 1A = ________ * _________ = _________(Carpools from Drive Alone Auto) TRIPSod P1A
2. Trips for Mode 2A = ________ * _________ /2 = __________(Carpools from Two-Occupant Auto) TRIPSod P2A
3. Trips for Mode 3A = ________ * _________ /3.5 = + __________(Carpools from Three-Occupant Auto) TRIPSod P3A
_________________________________________________________________________________________________
4. Compute Spaceso: ____________
Note: 1. The default vehicle occupancy factors of 2, 3.5 and 2.5 can be substituted for the locally available data.

G-22
WORKSHEET D-12

G-23
WORKSHEET D-13 DEMAND ESTIMATION��PERIPHERAL LOT
Data Required: 1. Activity center employment from urban model ZDATA file.2. Home-base work mode share data from urban model if available.3. Home-base work vehicle occupancy data from urban model if available.4. Activity center parking inventory from local parking authority.
Definitions: EMP Total activity center employment.Tshare Proportion of work trips using transit. Use local data or Table 5-1.Occ Auto Occupancy for activity center work trips. Use local data or Table 5-2.Rw Proportion of parking spaces used for work trip parking. See Table 5-3.Supply Existing Parking supply.PD Parkinq Deficiency.Vadj Traffic volume on the adjacent roadways from which parkers are expected to access the parking facilityVall Total traffic volume on commuting arterials and highways accessing the activity center
Compute Parking Deficiency1. Total Parking Demand = [( _________ * ( 1 -_________ ) ) / ( ________ * ________)] =__________
EMP Tshare Occ Rw 2. Subtract Supply: - ___________
Supply3. Parking Deficiency = _______________
___________PD
Compute Maximum Parking Capture
Maximum Parking Capture = ________ * ( ________ /________) =______________PD Vadj Vall

G-24
WORKSHEET D-13

G-25
WORKSHEET I-1 IMPACT ANALYSIS FOR REMOTE LOTS
Data Required: 1. Parking demand from Worksheet D-1.2. Average trip length from lot to destination, from the survey or assumption based on knowledge of local travel behavior.
Definitions: VMTs Annual VMT reduction.Lavg Average trip length from lot to destination.PV Estimated vehicle parked at the remote lot.Crate Average fuel consumption rate in gallons per mile for the study year under investigation. Refer to Table 6-2.Eco Fleet average carbon monoxide emission rate in grams per vehicle mile. Refer to Table 6-2.Enox Fleet average nitrogen oxide emission rate in grams per vehicle mile. Refer to Table 6-2.Ehc Fleet average hydrocarbon emission rate in grams per vehicle mile. Refer to Table 6-2.
Compute Annual Vehicle Miles of Travel (VMT) Reduction
1. Annual VMT Reduction = ________ * ________ * 233 * 2 = _________ Vehicle Miles Lavg PV VMTs
Commute Annual Fuel Savings and Emission Reductions
1. Annual Fuel Savings = _______ * _________ = __________annual gallons VMTs Crate
2. Annual CO Emission Reduction = _______ * _________ / 907,184 = __________ tons/year VMTs Eco
3. Annual NOX Emission Reduction = _______ * _________ / 907,184 = __________ tons/year VMTs Enox
4. Annual HC Emission Reduction = _______ * _________ / 907,184 = __________ tons/year VMTs Enox

G-26
WORKSHEET I-1

G-27
WORKSHEET I-2 IMPACT ANALYSIS FOR PERIPHERAL LOTS
Data Required: Arterial traffic volumes within the activity center from either the urban area model assignment or traffic count maps.Definitions: VMTi Annual VMT change for roadway i.
Vb Peak period traffic volume on roadway i for before condition.Va Peak period traffic volume on roadway i for after condition. _L Length of roadway i.K1 Coefficient value from Table 6-10.K2 Coefficient value from Table 6-10.Sa Average Speed in miles per hour over the distance of the roadway i.Eco Average carbon monoxide emission rate in grams per vehicle mile. Refer to Table 6-11 to 6-13.Enox Average nitrogen oxide emission rate in grams per vehicle mile. Refer to Table 6-17 to 6-19.Ehc Average hydrocarbon emission rate in grams per vehicle mile. Refer to Table 6-14 to 6-16.
Compute Annual Vehicle Miles of Travel (VMT) Reduction
1. Annual VMT Reduction = (______ - ________) * _________ * ________ * 226 * 2 =_________ Vehicle MilesVb Va L PV VMTi
Compute Annual Fuel Consumption and Emission Changes
1. Annual Fuel Consumption Changes = _______ * (_______ + _______ / ________) = __________ annual gallons VMTi K1 K2 Sa < 35 MPH
2. Annual CO Emission Changes = ________ * ________ / 907,184 =__________ tons/year VMTi Eco
3. Annual NOX Emission Changes = ________ * ________ / 907,184 =___________ tons/year VMTi Enox
4. Annual HC Emission Changes = ________ * ________ / 907,184 =__________ tons/year VMTi Ehc

G-28
WORKSHEET I-2

G-29
WORKSHEET I-3 ANNUAL VMT REDUCTIONS FOR URBAN FRINGE AND CORRIDOR LOTS
Data Required: 1. Park-and-ride lot size from demand estimation, average distance for each highway travel path measured from map.2. Proportion of total parked vehicles traveling via each highway path. See Step 2 in �Urban Fringe and Urban Corridor Lot Impacts�
Section, Chapter 6.
Definitions: VMTj Annual reduction in VMT for highway travel path j.D Number of parked vehicles projected for the planning year. From Worksheet D-2.Lj Average distance for highway travel path j.Pj Proportion of total parked vehicles traveling via highway travel path j.AF Annualization Factor, 213 for urban fringe lots and 233 for urban corridor lotsj j = 1 to n, n is the number of major travel path for a lot.
Estimate Annual VMT Reduction by Major Travel Path(s)
1. Annual VMT reduction for Path 1: 1 : ______* _______* ______* 2 * _____ = _________ Vehicle Miles j L1 D P1 AF VMT1
2. Annual VMT reduction for Path 2: 2 : _____* _______* ______* 2 * _____ = _________ Vehicle Miles j L2 D P2 AF VMT2
3. Annual VMT reduction for Path 3: 3 : _____* _______* ______* 2 * _____ = _________ Vehicle Miles j L3 D P3 AF VMT3
4. Annual VMT reduction for Path 4: 2 : _____* _______* ______* 2 * _____ = _________ Vehicle Miles j L4 D P4 AF VMT4
5. Annual VMT reduction for Path 5: 2 : _____* _______* ______* 2 * _____ = _________ Vehicle Miles j L4 D P5 AF VMT5
6. Total VMT reductions: ΣΣ VMTj=1 to 5 = ________ Vehicle Miles
WORKSHEET I-3

G-30
WORKSHEET I-4 SEGMENT LEVEL FUEL CONSUMPTION CHANGES FOR URBAN FRINGE AND CORRIDOR LOTSFuel Path No. __________Segment No. __________ to Segment No.__________
Data Required: Length and traffic volume on segment of highway path.Definitions: FCpi Fuel consumption change for Path p, Segment i.
Li Length of segment i, path p in mile.Crateib Auto fuel consumption rate for segment i, path p ~ r before condition. From Table 6-5 or Table 6-6.Crateia Auto fuel consumption rate for segment i, path p for after condition. From Table 6-5 or Table 6-6.Busrateia Bus fuel consumption rate for segment i, path p for after condition. From Table 6-7.RVOLi Vehicles removed from segment i, path p. (Equal to �D * Pj� specified on Worksheet I-3).TVOLi Total traffic for segment i, path p for before condition, from urban area model assignment or traffic count mapBVOLi Transit vehicle volume for segment i, path p, from bus scheduleAF Annualization Factor. 213 for urban fringe lots or 233 for urban corridor lots
1. Fuel Change for Path ________ Segment ______ =
2* _______* _______* {(_______* _______)+[_______* (_______- _______ )] - (________* _________ )}= ___________ AF Li Crateib TVOLi Crateia TVOLi RVOLi BUSrateia BVOLi
2. Fuel Change for Path ________ Segment ______ =
2* _______* _______* {(_______* _______)+[_______* (_______- _______ )] - (________* _________ )}= ___________ AF Li Crateib TVOLi Crateia TVOLi RVOLi BUSrateia BVOLi
3. Fuel Change for Path ________ Segment ______ =
2* _______* _______* {(_______* _______)+[_______* (_______- _______ )] - (________* _________ )}= ___________ AF Li Crateib TVOLi Crateia TVOLi RVOLi BUSrateia BVOLi
4. Fuel Change for Path ________ Segment ______ =
2* _______* _______* {(_______* _______)+[_______* (_______- _______ )] - (________* _________ )}= ___________ AF Li Crateib TVOLi Crateia TVOLi RVOLi BUSrateia BVOLi

G-31
WORKSHEET I-4

G-32
WORKSHEET I-5 SUMMARY FUEL CONSUMPTION CHANGES FOR URBAN FRINGE AND CORRIDOR LOTS
Data Required: Use Worksheet I-4 to compute the fuel change on each segment of a highway path. Transfer the results to this sheet segment by segment forsumming up totals.
Fuel Changes(gallons/year)
Segment No. Path 1 Path 2 Path 3 Path 4 Path 5
1 _________ _________ _________ _________ _________
2 _________ _________ _________ _________ _________
3 _________ _________ _________ _________ _________
4 _________ _________ _________ _________ _________
5 _________ _________ _________ _________ _________
6 _________ _________ _________ _________ _________
7 _________ _________ _________ _________ _________
8 _________ _________ _________ _________ _________
9 _________ _________ _________ _________ _________
10 +________ +________ +________ +________ +________
Total ofEach Path _________ +_________ +__________ +__________ +________ =_________
Grand Total
WORKSHEET I-5

G-33
WORKSHEET I-6 CHANGES IN DAILY SEGMENT-LEVEL CARBON MONOXIDE EMISSIONSCO Path No. ______Segment No. _________ to Segment No. ________
Data Required: Length and traffic volume on segment of highway path.Definitions: COip Daily segment carbon monoxide change on the path i, in grams.
Li Length of segment i in milesCOrateib Automobile CO emission rate for segment i, path p for before condition. From Table 6-8 or 6-9.COrateia Automobile CO emission rate for segment i, path p for after condition. From Table 6-8 or 6-9.BCOrateia Bus CO emission rate for segment i, path p for the after condition. From Table 6-7.RVOLi Vehicles removed from segment i, path p. (Equal to �D * P’� specified on Worksheet I-3).TVOLi Total traffic for segment i, path p for before condition, from urban area model assignment or traffic count map.BVOLi Transit vehicle volume for segment i, path p, from bus schedule
1. Daily CO Reduction for Path ______ Segment ________ =
2 * {________* (_______* _______ )+ [________* (_______- _______ )] - (________* ________ )} =__________Li COrateib TVOLi COrateia TVOLi RVOLi BCOrateia BVOLi
2. Daily CO Reduction for Path ______ Segment ________ =
2 * {________* (_______* _______ )+ [________* (_______- _______ )] - (________* ________ )} =__________Li COrateib TVOLi COrateia TVOLi RVOLi BCOrateia BVOLi
3. Daily CO Reduction for Path ______ Segment ________ =
2 * {________* (_______* _______ )+ [________* (_______- _______ )] - (________* ________ )} =__________Li COrateib TVOLi COrateia TVOLi RVOLi BCOrateia BVOLi
4. Daily CO Reduction for Path ______ Segment ________ =
2 * {________* (_______* _______ )+ [________* (_______- _______ )] - (________* ________ )} =__________Li COrateib TVOLi COrateia TVOLi RVOLi BCOrateia BVOLi

G-34
WORKSHEET I-6

G-35
WORKSHEET I-7 SUMMARY CARBON MONOXIDE EMISSION CHANGES FOR URBAN FRINGE AND CORRIDOR LOTSData Required: Use Worksheet I-6 to compute daily carbon monoxide reductions for each segment on a highway path. Transfer the results to this sheet
segment by segment for summing up totals.Data Element: AF Annualization Factor. 213 for urban fringe lots or 233 for urban corridor lot.
DGTCO Daily grand total of CO emission changes, in grams.
CO Emission Reductions(Grams)
Segment No. Path 1 Path 2 Path 3 Path 4 Path 5
1 _________ _________ _________ _________ _________
2 _________ _________ _________ _________ _________
3 _________ _________ _________ _________ _________
4 _________ _________ _________ _________ _________
5 _________ _________ _________ _________ _________
6 _________ _________ _________ _________ _________
7 _________ _________ _________ _________ _________
8 _________ _________ _________ _________ _________
9 _________ _________ _________ _________ _________
10 +________ +________ +________ +________ +________
Total ofEach Path _________ +_________ +__________ +__________ +_______ = _________
Grand Total
Total Annual CO Emission = _______ * _______ /907,184= _________ tonsAF DGTco
WORKSHEET I-7

G-36
WORKSHEET I-8 CHANGES IN DAILY SEGMENT-LEVEL HYDROCARBON EMISSIONSHC Path No.__________Segment No. _________to Segment No.__________Data Required: Length and traffic volume on segment of highway path.Definitions: HCip Daily segment hydrocarbon change on the path i, in grams
Li Length of segment i in miles.HCrateib Automobile HC emission rate for segment i, path p for before condition. From Table 6-8 or 6-9.HCrateia Automobile HC emission rate for segment i, path p for after condition. From Table 6-8 or 6-9.BHCrateia Bus HC emission rate for segment i, path p for the after condition. From Table 6-7.RVOLi Vehicles removed from segment i, path p. (Equal to �D * Pj � specified on Worksheet I-3).TVOLi Total traffic for segment i, path p for before condition, from urban area model assignment or traffic count map.BVOLi Transit vehicle volume for segment i, path p, from bus schedule.
1. Daily HC Reduction for Path _________Segment ___________=
2 * {________* (_______* _______ )+ [________* (_______- _______)] - (________* ________)} = _________Li HCrateib TVOLi HCrateia TVOLi RVOLi BHCrateia BVOLi
2. Daily HC Reduction for Path _________Segment ___________=
2 * {________* (_______* _______ )+ [________* (_______- _______)] - (________* ________)} = _________Li HCrateib TVOLi HCrateia TVOLi RVOLi BHCrateia BVOLi
3. Daily HC Reduction for Path _________Segment ___________=
2 * {________* (_______* _______ )+ [________* (_______- _______)] - (________* ________)} = _________Li HCrateib TVOLi HCrateia TVOLi RVOLi BHCrateia BVOLi
4. Daily HC Reduction for Path _________Segment ___________=
2 * {________* (_______* _______ )+ [________* (_______- _______)] - (________* ________)} = _________Li HCrateib TVOLi HCrateia TVOLi RVOLi BHCrateia BVOLi

G-37
WORKSHEET I-8

G-38
WORKSHEET I-9 SUMMARY HYDROCARBON EMISSION CHANGES FOR URBAN FRINGE AND CORRIDOR LOTSData Required: Use Worksheet I-8 to compute daily hydrocarbon reductions for each segment on a highway path. Transfer the results to this sheet segment
by segment for summing up totals.
Data Element: AF Annualization Factor. 213 for urban fringe lots or 233 for urban corridor lots.DGThc Daily grand total of HC emission changes, in grams.
HC Emission Reductions(Grams)
Segment No. Path 1 Path 2 Path 3 Path 4 Path 5
1 _________ _________ _________ _________ _________
2 _________ _________ _________ _________ _________
3 _________ _________ _________ _________ _________
4 _________ _________ _________ _________ _________
5 _________ _________ _________ _________ _________
6 _________ _________ _________ _________ _________
7 _________ _________ _________ _________ _________
8 _________ _________ _________ _________ _________
9 _________ _________ _________ _________ _________
10 +________ +________ +________ +________ +________
Total ofEach Path _________ +_________ +__________ +__________ +_______ = _________
Grand Total
Total Annual HC Emission = _______ * _______ /907,184= _________ tons

G-39
AF DGThc
WORKSHEET I-9

G-40
WORKSHEET I-10 CHANGES IN DAILY SEGMENT-LEVEL NITROGEN OXIDE EMISSIONSNOX Path No. ___________Segment No. ___________ to Segment No. _________Data Required: Length and traffic volume on segment of highway path.Definitions: NOXip Daily segment nitrogen oxides emission change on the path i, in grams.
Li Length of segment i in miles.NOXrateib Automobile NOX emission rate for segment i, path p for before condition. From Table 6-8 or 6-9.NOXrateia Automobile NOX emission rate for segment i, path p for after condition. From Table 6-8 or 6-9.BNOXrateia Bus NOX emission rate for segment i, path p for the after condition. From Table 6-7.RVOLi Vehicles removed from segment i, path p. (Equal to �D * P`� specified on Worksheet I-3).TVOLi Total traffic for segment i, path p for before condition, from urban area model assignment or traffic count map.BVOLi Transit vehicle volume for segment i, path p, from bus schedule.
1. Daily NOX Reduction for Path ______ Segment_______ =
2* {________* (________* _______)+ [________ * (________- ________ )] - (________* _______)} = _______Li NOXrateib TVOLi NOXrateia TVOLi RVOLi BNOXrateia BVOLi
2. Daily NOX Reduction for Path ______ Segment_______ =
2* {________* (________* _______)+ [________ * (________- ________ )] - (________* _______)} = _______Li NOXrateib TVOLi NOXrateia TVOLi RVOLi BNOXrateia BVOLi
3. Daily NOX Reduction for Path ______ Segment_______ =
2* {________* (________* _______)+ [________ * (________- ________ )] - (________* _______)} = _______Li NOXrateib TVOLi NOXrateia TVOLi RVOLi BNOXrateia BVOLi
4. Daily NOX Reduction for Path ______ Segment_______ =
2* {________* (________* _______)+ [________ * (________- ________ )] - (________* _______)} = _______Li NOXrateib TVOLi NOXrateia TVOLi RVOLi BNOXrateia BVOLi

G-41
WORKSHEET I-10

G-42
WORKSHEET I- 11 SUMMARY NITROGEN OXIDE EMISSION CHANGES FOR URBAN FRINGE AND CORRIDOR LOTS
Data Required: Use Worksheet I-10 to compute daily nitrogen oxide reductions for each segment on a highway path. Transfer the results to this sheetsegment by segment for summing up totals.
Data Element: AF Annualization Factor. 213 for urban fringe lots or 233 for urban corridor lots.DGTno Daily grand total of NOX emission changes, in grams.
NOX Emission Reductions(Grams)
Segment No. Path 1 Path 2 Path 3 Path 4 Path 5
1 _________ _________ _________ _________ _________
2 _________ _________ _________ _________ _________
3 _________ _________ _________ _________ _________
4 _________ _________ _________ _________ _________
5 _________ _________ _________ _________ _________
6 _________ _________ _________ _________ _________
7 _________ _________ _________ _________ _________
8 _________ _________ _________ _________ _________
9 _________ _________ _________ _________ _________
10 +________ +________ +________ +________ +________
Total ofEach Path _________ +_________ +__________ +__________ +_______ = _________
Grand Total
Total Annual NOX Emission = __________ * _________ /907,186 = ________ tons

G-43
AF DGTnox
WORKSHEET I-11

G-44
WORKSHEET T-1 TRAVEL TIME ELEMENTS FOR PATH SEGMENTS OF URBAN FRINGE AND CORRIDOR LOTSData Required:Segment-level travel time and speed. See Step 7 in �Urban Fringe and Urban Corridor Lot Impacts� Section, Chapter 6.
Path:____________Definitions: Hbttpi Highway travel time for segment i, path p for before condition.
Hattpi Highway travel time for segment i, path p for after condition.Cattpi Carpooler travel time for segment i, path p for after condition.Tattpi Transit travel time for segment i, path p for after condition.Lpi Length of segment i, path p in mileSbpi Average travel speed on segment i, path p for before condition.Sapi Average travel speed on segment i, path p for after condition.Etime Excess time, from Worksheet D-4.
Segment ____________1. Highway before condition travel time:= ________ / _________= __________
Lpi Sbpi Hbttpi
2. Carpooler travel time in before condition: Hbttpi= Cbttpi
3. Highway after condition travel time: = ________ / _________= __________Lpi Sapi Hattpi
4. Carpooler travel time in after condition:= (_______ / ________ ) + (________ / 60)= _________Lpi Sapi Etime Cattp
5. Transit travel time in after condition: Cattp = Tattp

G-45
WORKSHEET T-1

G-46
WORKSHEET T-2 SUMMARY OF TRAVEL TIME ELEMENTS FOR HIGHWAY PATHS OF URBAN FRINGE AND CORRIDOR LOTS
Data Required: Use Worksheet T-1 to calculate the travel time elements for each segment on a path. Then transfer the results to this worksheet for summingup totals. Use one worksheet for each path.
Data Element: Hbttp Highway travel time for path p in before condition.Hattp Highway travel time for path p in after condition.Cattp Carpooler travel time for path p in after condition.Tattp Transit travel time for, path p in after condition.
Path:_____________
Segment Hbttp Hattp Cbttp Cattp Tattp
1 _________ _________ _________ _________ _________2 _________ _________ _________ _________ _________3 _________ _________ _________ _________ _________4 _________ _________ _________ _________ _________5 _________ _________ _________ _________ _________6 _________ _________ _________ _________ _________7 _________ _________ _________ _________ _________8 _________ _________ _________ _________ _________9 _________ _________ _________ _________ _________10 +________ +________ +________ +________ +________
Total _________Hbttp
+_________Hattp
+__________Cbttp
+__________Cattp
+_________ Tattp
WORKSHEET T-2

G-47
WORKSHEET T-3 DAILY PATH VHT AND PHT REDUCTIONS FOR URBAN FRINGE AND CORRIDOR LOTS
Data Required: Worksheet T-1 and Worksheet T-2
Definitions: TVOLp Total volume for path p in before condition.Hbttp Highway travel time for path p for before condition. from Worksheet T-1.RVOLp Volume Reduced from path p, equal to D*Pj on Worksheet I-3.Hattp Highway travel time for path p for after condition, from Worksheet T-1.OCChbw Auto occupancy for before condition. Occupancy for home-base work trip is typically used. Default value is 1.2 persons per auto.Occa Auto Occupancy for after condition for egress carpool vehicles. Default value of 3.2 persons per auto can be used.CVOLp Vehicles associated with carpools formed at the park-and-ride facility for path p. CVOLp =RVOLp.Cattp Carpool travel time for path p for after condition, from Worksheet T-2.Tattp Transit travel time for path p for after condition, from Worksheet T-2.
Path: _________________
1. Daily Vehicle-Hours of Travel Reduction:
VHTp= [_______* ________- (________ -_________) * _________ - (_________ / (_______- _______ ) + 1) * ________* ________ ] * 2 = _______ TVOLp Hbttp TVOLp RVOLp Hattp Occhbw Occa Occhbw CVOLp Cattp VHTp
2. Daily Person-Hours of Travel Reduction:
PHTp= [_______* ________* ________- (______- _______) * _______* ______- (_____ / (_____- ______) + 1) *_______* _______ ) * ______ - ______ * ______ ] *2 = ______
TVOLp Hbttp OCChbw TVOLp RVOLp Hattp Occhbw Occa Occa Occhbw CVOLp Cattp Occa Passp Tattp PHTp
WORKSHEET T-3

G-48
WORKSHEET T-4 ANNUAL REDUCTION IN VHT AND PHT FOR URBAN FRINGE AND CORRIDOR LOTSData Required: Use Worksheet T-3 to calculate the daily VHT and PHT reductions for each path. Use one worksheet T-4 for each path. Transfer VHT
and PHT of all paths to this worksheet for summing up annual total VHT and PHT reductions.Definitions: AF Annualization factor, equals 213 for urban fringe lots and 233 for urban corridor lots.
Path VHTp PHTp
1 ________________ ________________
2 ________________ ________________
3 ________________ ________________
4 ________________ ________________
5 ________________ ________________
6 ________________ ________________
7 ________________ ________________
8 ________________ ________________
9 ________________ ________________
10 +_______________ +_______________
Total DailyReductions ________________ ________________
MultiplyAnnualization *_______________ *_______________
Total AnnualReductions ________________ ________________
G-49
VHT (annual) PHT (Annual)
WORKSHEET T-4

G-50
WORKSHEET P-1 VMT REDUCTIONData Required: Number of parked vehicles at each urban corridor lot.Definitions: VMTc Annual VMT reduction for urban corridor lots
VMTp Annual VMT reduction for peripheral lotsVMTf Annual VMT reduction for urban lotsVMTr Annual VMT reduction for remote lotsParkedi Daily parked vehicles at lot I of each lot typeLc Average lot-to-destination distance for urban corridor lot. Default value is 17.2 milesLp Average lot-to-destination distance for peripheral lot. Default value is 2 miles.Lf Average lot-to-destination distance for urban fringe lot. Default value is 16.1 miles.Lr Average lot-to-destination distance for remote lot. Default value is 33.1 miles.
1. VMT Reduction for Urban Corridor Lots:VMTc= 2 * 233 * ________* (_______+_______+ _______+ _______+ _______+
Lc Parked1 Parked2 Parked3 Parked4 Parked5
_______+ _______+ _______+ _______+ _______+ )= ____________ Parked6 Parked7 Parked8 Parked9 Parked10 VMTc
2. VMT Reduction for Periperal Lots:VMTp= 2 * 226 * ________* (_______+_______+ _______+ _______+ _______+
Lp Parked1 Parked2 Parked3 Parked4 Parked5
_______+ _______+ _______+ _______+ _______+ )= ____________ Parked6 Parked7 Parked8 Parked9 Parked10 VMTp
3. VMT Reductions for Urban Fringe Lots:VMTf= 2 * 213 * ________* (_______+_______+ _______+ _______+ _______+
Lf Parked1 Parked2 Parked3 Parked4 Parked5
_______+ _______+ _______+ _______+ _______+ )= ____________ Parked6 Parked7 Parked8 Parked9 Parked10 VMTf

G-51
WORKSHEET P-1 (continued)
4. VMT Reductions for Remote Lots:VMTr=2 * 233 * ________* (_______+_______+ _______+ _______+ _______+
Lr Parked1 Parked2 Parked3 Parked4 Parked5
_______+ _______+ _______+ _______+ _______+ )= ____________ Parked6 Parked7 Parked8 Parked9 Parked10 VMTr
5. System VMT Reduction = _______+ _______+ _______+ _______= _______ VMTc VMTp VMTf VMTr

G-52
WORKSHEET P-1

G-53
WORKSHEET P-2 USER COST SAVINGS
Data Required: Worksheet P-1 VMT Reduction
Definitions: VMTc Annual VMT reduction for urban corridor lotsVMTp Annual VMT reduction for peripheral lotsVMTf Annual VMT reduction for urban lotsVMTr Annual VMT reduction for remote lotsOpcostc Average vehicle operation cost for vehicles parked at urban corridor lot. Default value $0.206 / vehicle miles can be used.Opcostp Average vehicle operation cost for vehicles parked at peripheral lots. Default value $0.204 / vehicle miles can be used.Opcostf Average vehicle operation cost for vehicles parked at urban fringe lots. Default value $0.206 / vehicle miles can be used.Opcostr Average vehicle operation cost for vehicles parked at remote lots. Default value $0.134 / vehicle miles can be used.
Systemwide User Cost Savings:
______* ______+ ______* ______+ ______* ______+ ______* ______= ______VMTc Opcostc VMTp Opcostp VMTf Opcostf VMTr Opcostr
WORKSHEET P-2

G-54
WORKSHEET P-3 CHANGE IN AVERAGE VEHICLE OCCUPANCY
Data Required: Parked vehicle counts
Definitions: Parkedi Number of parked vehicles in lot type i, i = cb, cr, p, f, and r.Aocci Auto occupancy of car-poolers from lot to work for lot type i, i = cb, cr, p, f, and r. (Refer to Table 11-2 for Aocci values.)Bocci Before auto occupancy for lot type i, i = cb, cr, p, f, and r. (Refer to Table 11-2 for Bocci values.)Cocci Change for occupancy for lot typ i, i = cb, cr, p, f, and r. Egressi Number of egress carpool and transit vehicles from lot i.Ppci Proportion of parkers that are carpool passengers. Calculated based on the formula:
Ppci = (Mci/Mti) / [{Bocci / Aocci)/ (1-Bocci / Aocci) + 1} +Mci / Mti], if Mti > 0. Or Ppci = 1 for Mti + 0. See the lastpage of this worksheet for the formula derivations.
Totali Total number of a park and ride lot's users, including drivers and passengers picking up carpooling passengers.Drivei Driving carpool vehicles from a lot to it final work destination.Mti Transit mode share from lot to work destination (see Table 11-2.)Mci Mode shares of carpools from lot to work destination (see Table 11-2.)cb Notation for urban corridor lots with bus service.cr Notation for urban corridor lots with rail service.p Notation for peripheral lots.f Notation for urban fringe lots.r Notation for remote lots.

G-55
WORKSHEET P-3 (continued)
Summarize Total Parked Vehicles for Each Type of Lots
Lot No. UrbanCorridor
w/bus
UrbanCorridor
w/rail
Peripheral UrbanFringe
Remote
1 _________ _________ _________ _________ _________
2 _________ _________ _________ _________ _________
3 _________ _________ _________ _________ _________
4 _________ _________ _________ _________ _________
5 _________ _________ _________ _________ _________
6 _________ _________ _________ _________ _________
7 _________ _________ _________ _________ _________
8 _________ _________ _________ _________ _________
9 _________ _________ _________ _________ _________
10 _________ _________ _________ _________ _________
Total _________Parkedcb
_________Parkedcr
_________Parkedp
_________Parkedf
_________Parkedr

G-56
WORKSHEET P-3 (continued)
Compute Change of Occupancy for Each Type of Lot
Cocccb = [ 1 / ( _______ / 20 + _______ / _______ ) ] - _______ + _______ Mtcb Mccb Aocccb Bocccb CCocccb
Cocccr = [ 1 / ( _______ / 20 + _______ / _______ ) ] - _______ + _______ Mtcr Mccr Aocccr Bocccr CCocccr
Coccp = [ 1 / ( _______ / 20 + _______ / _______ ) ] - _______ + _______ Mtp Mcp Aoccp Boccp CCoccp
Coccf = [ 1 / ( _______ / 20 + _______ / _______ ) ] - _______ + _______ Mtf Mcf Aoccf Boccf CCoccf
Coccr = [ 1 / ( _______ / 20 + _______ / _______ ) ] - _______ + _______ Mtr Mcr Aoccr Boccr CCoccr
Compute Number of Egress Vehicles
Egresscb = ________* ________ * [________ / ( ________- ________ ) + (1- 0.168 )/ 20] = ________ Parkedcb Bocccb Ppccb Aocccb Bocccb Ppccb Egresscb
Egresscr = ________* ________ * [________ / ( ________- ________ ) + (1- 0.033 )/ 20] = ________ Parkedcr Bocccr Ppccr Aocccr Bocccr Ppccr Egresscr
Egressp = ________* ________ * [________ / ( ________- ________ ) + (1- 0.235 )/ 20] = ________ Parkedp Boccp Ppcp Aoccp Boccp Ppcp Egressp
Egressf = ________* ________ * [________ / ( ________- ________ ) + (1- 0.507 )/ 20] = ________ Parkedf Boccf Ppcf Aoccf Boccf Ppcf Egressf
Egressr = ________* ________ * [________ / ( ________- ________ ) + (1- 1.000 )/ 20] = ________

G-57
Parkedr Boccr Ppcr Aoccr Boccr Ppcr Egressr

G-58
WORKSHEET P-3 (continued)
Compute Systemwide Change in Average Vehicle Occupancy
Change in Vehicle Occupancy =(_______* _______+ _______* _______+ _______* _______+ _______* _______+ _______* _______+ ) / Ccobcb Egresscb Cocccr Egresscr Coccp Egressp Coccf Egressf Coccr Egressr
( _______ + _______+ _______+ _______+ _______) = _______ Egresscb Egresscr Egressp Egressf Egressr
Formula Derivation for the Proportion of parkers that are carpool passengers
Base Equations
Bocci * Drivei + Ppci * Parkedi * Bocci = Mci * Totali (1)(1 - Ppci) * Parkedi * Bocci = Mti * Totali (2)( Bocci * Drivei + Ppci * Parkedi * Bocci ) / Drivei = Aocci (3)
Derivations
From Equations (1) and (2)Drivei + Ppci * Parkedi + (Mci / Mti) * (1 - Ppci) * Parkedi (4)
From Equation (3)Drivei = [Ppci * (Bocci / Aocci) * Parkedi] / [ 1 - (Bocci / Aocci)] (5)
From Equations (4) and (5)[Ppci * (Bocci / Aocci ) / ( 1 - (Bocci / Aocci) ] + Ppci = (Mci / Mti) * (1 - Ppci) (6)
From Equation (6)Ppci = ( Mci / Mti) / [ { ( Bocci / Aocci) / (1- Bocci / Aocci) + 1 } + Mci / Mti ]

G-59
WORKSHEET P-3

G-60
WORKSHEET P-4 ANNUAL FUEL SAVINGS AND EMISSION REDUCTIONS
Data Required: Worksheet P-1 VMT Reduction
Definitions: Fratey Average fuel consumption rate in gallons per 1,000 vehicle miles. See Table below.COy Average emission rate in tons per million vehicle miles. See Table below.HCy Average emission rate in tons per million vehicle miles. See Table below.NOXy Average emission rate in tons per million vehicle miles. See Table below.TOTALy Average emission rate in tons per million vehicle miles. See Table below.
1. Annual Fuel savings = _______* _______________ / 1,000 = __________ gallons Fratey VMT Reduction
2. Annual CO reduction = _______* _______________ / 1,000,000 = __________ tons COy VMT Reduction
3. Annual HC reduction = _______* _______________ / 1,000,000 = __________ tons HCy VMT Reduction
4. Annual NOX reduction= _______* _______________ / 1,000,000 = __________ tons NOXy VMT Reduction
System Average Fuel Consumption and Vehicle Emission RatesVehicle Emissions
Fuel Consumption (tons/million VMT)Planning Year (Gallons/1000 VMT) CO HC NOX Total1985 48 39 5 4 481990 38 25 3 3 311995 36 18 2 3 232000 36 15 2 2 192005 36 15 2 2 192010 36 15 2 2 19

G-61
WORKSHEET P-4
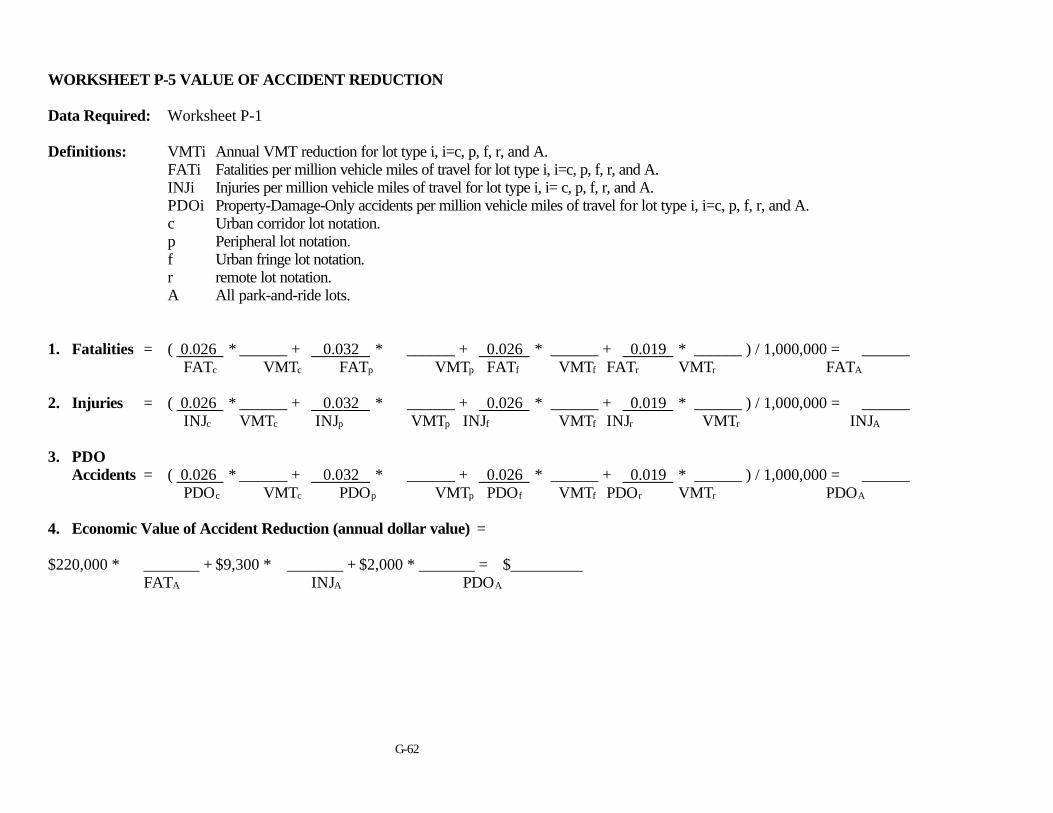
G-62
WORKSHEET P-5 VALUE OF ACCIDENT REDUCTION
Data Required: Worksheet P-1
Definitions: VMTi Annual VMT reduction for lot type i, i=c, p, f, r, and A.FATi Fatalities per million vehicle miles of travel for lot type i, i=c, p, f, r, and A.INJi Injuries per million vehicle miles of travel for lot type i, i= c, p, f, r, and A.PDOi Property-Damage-Only accidents per million vehicle miles of travel for lot type i, i=c, p, f, r, and A.c Urban corridor lot notation.p Peripheral lot notation.f Urban fringe lot notation.r remote lot notation.A All park-and-ride lots.
1. Fatalities = ( 0.026 * ______ + 0.032 * ______ + 0.026 * ______ + 0.019 * ______ ) / 1,000,000 = ______ FATc VMTc FATp VMTp FATf VMTf FATr VMTr FATA
2. Injuries = ( 0.026 * ______ + 0.032 * ______ + 0.026 * ______ + 0.019 * ______ ) / 1,000,000 = ______ INJc VMTc INJp VMTp INJf VMTf INJr VMTr INJA
3. PDOAccidents = ( 0.026 * ______ + 0.032 * ______ + 0.026 * ______ + 0.019 * ______ ) / 1,000,000 = ______
PDOc VMTc PDOp VMTp PDOf VMTf PDOr VMTr PDOA
4. Economic Value of Accident Reduction (annual dollar value) =
$220,000 * _______ + $9,300 * _______ + $2,000 * _______ = $_________FATA INJA PDOA

G-63
WORKSHEET P-5