state of the green belt 2021 - home - cpre
TRANSCRIPT

Countryside next door:
State of the Green Belt 2021 February 2021

2
State of the Green Belt 2021
Executive summary
Green Belt is the countryside next door for 30 million people living in our largest towns and cities. One of the primary roles of the Green Belt is to maintain the openness of the countryside, and it encourages housing to be placed near to where we work and the amenities we need.
The countryside near to where people live has never had a greater test of its importance to people’s health and wellbeing than during the start of the coronavirus pandemic. However, Green Belt land continues to be threatened by development, decreasing its ability to provide for nature and reduce the impacts of climate change and people’s access to green spaces.
This report from CPRE, the countryside charity, highlights the threat that is currently being faced, and will be faced, by the Green Belt as a result of unsuitable housing developments. The main findings are:
The current and future threat of housing development faced by Green Belt land continues to be
unprecedented. There are currently 257,944 homes proposed for greenfield land removed from
the Green Belt in advanced local plans, which remains a high level of threat in comparison to our
previous reports. We are likely to see this number increase in the future, as the government’s
proposed method for calculating housing need will put extreme pressure on Green Belt. For
example, in London there will be a need to find space for an excess of 177,907 homes beyond
what current London brownfield land can accommodate, resulting in pressure on the Green Belt.
Developments in the Green Belt are land-hungry, and are not providing the affordable homes we
need to face the housing crisis; the majority of developments are on land which was previously
greenfield. Of the developments on Green Belt land between 2015/16 and 2019/20, only 10% of
these are considered affordable by the government. Furthermore, they are being built at a
density of 14 houses per hectare, which is far below that of developments outside the Green
Belt. Of the Green Belt land developed, 74% of this was previously greenfield land, an increase of
8% since the previous report.
To enable the Green Belt to continue to fulfil its function, while allowing for the provision of new homes, CPRE recommends the government:
reintroduces the use of effective strategic city regional planning into planning law through the
upcoming Planning Bill
ensures the Strategic Environmental Assessments process is not weakened, so their ability to
identify more sustainable or less harmful alternative to Green Belt release is maintained
introduces a clear ‘brownfield first’ or ‘renew zone first’ policy in the Planning Bill, which ensures
that suitable previously developed land can be prioritised for redevelopment over any greenfield
Green Belt sites, as well as taking a more proactive approach to identifying new brownfield sites

3
1. Introduction
The countryside near to where people live has never had a greater test of its importance to people’s health and wellbeing than during the coronavirus pandemic. Since the first lockdown in 2020, there has been a surge in appreciation for the countryside, and the positive role that accessing green and natural spaces can have on our wellbeing.1 The pandemic also highlighted the inequalities of access to good quality green spaces, with those living in deprived areas, minority ethnic groups and people living with disabilities less likely to have such access, for example.2
Green Belt is the countryside next door for 30 million people living in our large towns and cities. One of the primary roles of the Green Belt is to maintain the openness of the countryside, and it encourages housing to be placed near to where we work and the amenities we need. However, the potential of this land is much greater than this. The protection of this land also provides a space for nature and recreation, with it already containing a significant number of our nature reserves, as well as double the national density of public rights of way.3 Through the protection and enhancement of Green Belt, we can increase the natural and recreation value of this land, as well as providing a natural solution to the climate emergency through its ability to sequester carbon. Crucially, the defining feature of countryside which is designated as ‘Green Belt’, is its permanence; the assurance that it will remain for generations to come to enjoy its benefits. The National Planning Policy Framework (NPPF) formalises this, through stating that development in the Green Belt or alteration of its boundaries should only occur under ‘very special’ or ‘exceptional’ circumstances, and should be done through the local plan process.4 CPRE, the countryside charity, led the campaign for the creation of the Green Belts. To date, they have been a great success in terms of protecting the countryside near to many of our towns and cities and reducing the damage of urban sprawl to both people and the environment. However, Green Belts continue to be threatened by development, decreasing the ability of this land to provide for nature, reduce the impacts of climate change, and people’s access to green spaces.
While the government's recently announced package of proposals for the planning system do not weaken the protections that Green Belt designation offers, they do not offer any additional protection.5 A lack of stronger protections may become an issue as the new Standard Method is adopted, which focuses housing delivery targets on large cities, many of which are surrounded by Green Belt. This report by CPRE investigates past and future proposals for development of greenfield Green Belt land. It shows that building on the Green Belt is not the answer to the housing crisis, and instead recommends investment in the Green Belt and enhancing it for the enjoyment of communities today and for generations to come.
1 CPRE (2020), Lockdown lesson for government: over two thirds want green spaces enhanced: https://www.cpre.org.uk/about-us/cpre-media/two-thirds-want-green-space-enhanced/. Accessed 16 Feb 2021 2 Natural England (2020) A rapid scoping review of health and wellbeing evidence for the Framework of Green Infrastructure Standards: http://publications.naturalengland.org.uk/publication/4799558023643136. Accessed 5 Feb 2021 3 CPRE (2016), Our Green Belt: worth investing in: https://www.cpre.org.uk/resources/our-green-belt-worth-investing-in/. Accessed 5 Feb 2021 4 MHCLG (2019), National Planning Policy Framework (NPPF), pg.40: https://assets.publishing.service.gov.uk/government/uploads/system/uploads/attachment_data/file/810197/NPPF_Feb_2019_revised.pdf. Accessed 5 Feb 2021 5MHCLG (2020) ‘Planning for the Future’ White Paper: https://www.gov.uk/government/consultations/planning-for-the-future. Accessed 5 Feb 2021

4
2. Analysis of completed developments
Our analysis continues to show that developments on the Green Belt continue to build executive homes, and not the affordable housing that people need. The vast majority of these are also built on land which was previously greenfield and at very low densities. The unsuitability and inefficiency of these developments is making poor use of this land, and not contributing to solving the housing crisis.
2.1 Affordability
We need to build new homes but, more importantly, the new homes that people actually need. Housing that is being built in the Green Belt is not providing the affordable homes communities are crying out for.
Table 1 shows that of all the homes that have been developed on greenfield Green Belt since 2015/16, only 10.1% of these have been affordable by the NPPF’s definition. Table 1. The number of homes completed on greenfield land that had been removed from Green Belt land since 2015/16. Data source: Glenigan / CPRE analysis.
Number of housing units on completed sites
Number of affordable homes on completed sites
Proportion of affordable homes on completed sites
On greenfield land within the Green Belt (2015/16-2019/20) 17,698 * 1,786 10.1%
Yearly average 3,540 357 * Note that a further 5 projects for 417 homes were also completed but the number of affordable homes figures were not clear in the documentation accompanying the planning application.
2.2 Density
In addition to a lack of affordable homes, Green Belt development does not use greenfield land efficiently. Since we last reported in October 2019, the average density of newly created residential addresses within
Case study: The Seven Cornfields is an area of Green Belt land in Staffordshire that has been recently proposed for the development of 1,300 houses on 284 acres of the land. It is made up of woodland, farmland, a dirt road and footpaths, which are frequently used by local residents, and have been for decades. Woodland nearby, including Alder Coppice Wood, is ancient and contains rare bluebells. The area of Green Belt is highly regarded by the local community for its beauty and recreational value, as well as the wildlife it supports. A petition against the proposal gained 2,000 signatures in only 48 hours highlighting the site as well-loved green space.

5
the Green Belt land has remained at just 14 dwellings per hectare (dph) 6. This is a quarter the density of developments outside of the Green Belt which still stand at 31 dph (Table 2) 7. Table 2. Average density of residential addresses within the Green Belt and outside of the Green Belt. Data Source: MHCLG Land use change statistics 8
Within the Green Belt Outside the Green Belt
2013-2014 18 32
2014-2015 16 32
2015-2016 14 32
2016-2017 21 32
2017-2018 14 31
2018/2019 N/A N/A
Of all land developed into residential uses in the Green Belt between 2013 to 2018, 1,969ha, or 74%, was on greenfield land, the majority of which was previously used as farmland (Table 3). This is an increase of greenfield use in the Green Belt of 8% since our previous State of the Green Belt report. Density also remains very low, pointing towards an inefficient use of this land.
6 CPRE (2019) Space to Breathe: State of the Green Belt 2019: https://www.cpre.org.uk/wp-content/uploads/2019/11/Space_to_Breathe.pdf. Accessed 5 Feb 2021 7 MHCLG (2020), Table P330 - Live tables on Land Use Change Statistics: 2017-2018 residential address change: https://www.gov.uk/government/statistical-data-sets/live-tables-on-land-use-change-statistics. Accessed 5 Feb 2021 8 MHCLG (2020), Table P330 - Live tables on Land Use Change Statistics: 2017-2018 residential address change: https://www.gov.uk/government/statistical-data-sets/live-tables-on-land-use-change-statistics. Accessed 5 Feb 2021

6
Table 3. Hectares of land changing to residential use on greenfield land in the Green Belt. Data source: MHCLG Land use change statistics 9 Agriculture Forest,
open land and water
Outdoor recreation
Residential garden
Undeveloped land
Vacant land
2013/14 103 17 4 11 24 68
2014/15 173 31 4 16 36 87
2015/16 110 27 2 14 25 96
2016/17 108 23 2 16 13 99
Land which is developed on the Green Belt for ‘exceptional circumstances’ needs to be used far more
efficiently, making use of higher densities of dwellings. Greenfield land in the Green Belt is a valuable
resource in terms of people’s access to the countryside, as well as providing a natural solution to the climate
emergency. Increasing the density of developments in the Green Belt supports the use of public transport,
and active travel, while reducing air pollution and providing space for nature
2.3 Brownfield
Brownfield land is land that has been built on previously. CPRE has shown that there is space for over one
million homes on brownfield land across England, and that it’s a perpetually regenerating resource. By
building homes on brownfield, we can build the homes we need in places which already have existing
infrastructure and amenities. Through maintaining processes of community input and accountability, this
brownfield land can be used to deliver the affordable homes we need, as well as wellbeing and cultural uses.
9 MHCLG (2020), Table P382 - Live tables on Land Use Change Statistics: 2017-2018 land use change tables: https://www.gov.uk/government/statistical-data-sets/live-tables-on-land-use-change-statistics. Accessed 5 Feb 2021
Case study: Yew Tree Farm is a historic farm located in the Bristol Green Belt which has been recently been put under threat by a development of 200 houses and removal from the Green Belt. It has been argued by the local community that the proposal does not meet the required ‘exceptional circumstances’ required for Green Belt release as this land is both open, and has been historically farmed. The land also contains a supply of footpaths which are easily accessible from the nearby city, providing much needed green space to city dwellers. The local authority has (as of May 2019) noted that the removal of this land from the Green Belt is a concern, but have offered no further response.

7
Not all development in the Green Belt is necessarily harmful, including the regeneration of suitable, well-
located brownfield sites. As a result, we have removed these sites from the analysis. Table 4 shows the total
number of homes which have been built on brownfield land contained in the Green Belt. An increased effort
needs to be made to ensure a proactive approach to identifying more suitable brownfield land that can be
brought forward for development within and outside of the Green Belt.
Table 4. The number of housing units built on brownfield land contained within the Green Belt and the total area of brownfield land used between 2015/16 and 2019/20. Data source: Glenigan / CPRE analysis Number of
completed projects Number of housing units
Area of land (Ha)
Completed projects on brownfield land within Green Belt
1,600
39,064
7,683
3. Analysis of planned development
3.1 Removal of land from the Green Belt
Local plans are created by local authorities, with opportunity for community input to set the vision for development in their local area. Councils are encouraged to review local plans every five years and, within them, are required to show that they have enough land to meet their housing targets for the next five years.
In order to meet these targets, local authorities often remove land from the Green Belt designation. According to planning policy, this should only happen under ‘exceptional circumstances’, such as for a major urban extension or new settlements. However, from the results of this and previous reports, it appears that local authorities continue to release significant amounts of Green Belt for residential developments, raising the question of whether Green Belts are protected enough in planning policy.
For this analysis, we examined local plans that had reached a late stage of the plan-making process (pre-submission publication under Regulation 19 or later - for more details please see Annex 1). We excluded proposals to release Green Belt land in local plans that had not reached that stage.
We found that a minimum of 257,944 homes is planned on land that has been removed from its Green Belt designation in adopted plans or will be removed from local plans in the future, across 71 local authorities (Table 5). This continues to be a high level of threat since we identified 266,089 homes for Green Belt land in CPRE’s 2019 State of the Green Belt report.10
While this figure is lower than that previous analysis (in August 2019), it should be noted that Bath and North East Somerset, Chiltern, St Albans and Sevenoaks, whose local plans were included in the previous analysis, have been withdrawn by local authorities or found unsound by the inspectorate, representing 19,685 homes. Given the high proportions of undeveloped land in each of these areas that is designated as Green Belt, there is likely to be renewed pressure for Green Belt release in future iterations of these plans.
10 CPRE (2019) Space to Breathe: State of the Green Belt 2019: https://www.cpre.org.uk/wp-content/uploads/2019/11/Space_to_Breathe.pdf. Accessed 5 Feb 2021
8
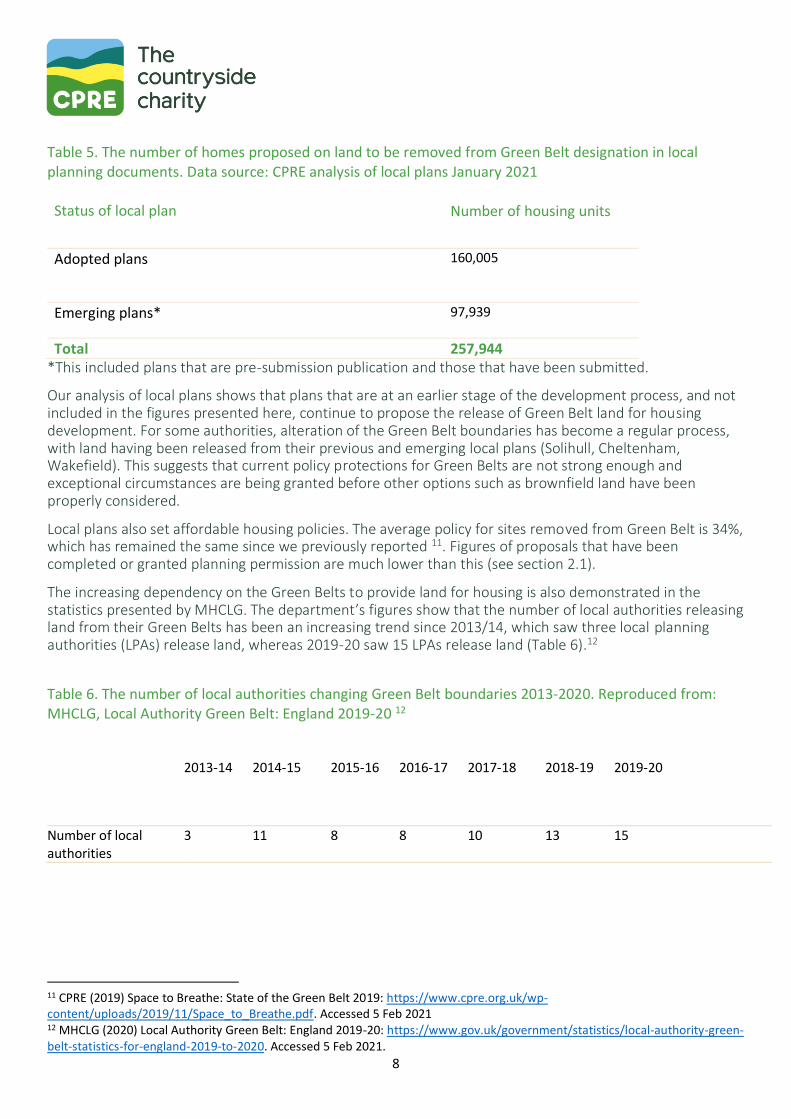
Table 5. The number of homes proposed on land to be removed from Green Belt designation in local planning documents. Data source: CPRE analysis of local plans January 2021 Status of local plan Number of housing units
Adopted plans 160,005
Emerging plans* 97,939
Total 257,944 *This included plans that are pre-submission publication and those that have been submitted.
Our analysis of local plans shows that plans that are at an earlier stage of the development process, and not included in the figures presented here, continue to propose the release of Green Belt land for housing development. For some authorities, alteration of the Green Belt boundaries has become a regular process, with land having been released from their previous and emerging local plans (Solihull, Cheltenham, Wakefield). This suggests that current policy protections for Green Belts are not strong enough and exceptional circumstances are being granted before other options such as brownfield land have been properly considered.
Local plans also set affordable housing policies. The average policy for sites removed from Green Belt is 34%, which has remained the same since we previously reported 11. Figures of proposals that have been completed or granted planning permission are much lower than this (see section 2.1).
The increasing dependency on the Green Belts to provide land for housing is also demonstrated in the statistics presented by MHCLG. The department’s figures show that the number of local authorities releasing land from their Green Belts has been an increasing trend since 2013/14, which saw three local planning authorities (LPAs) release land, whereas 2019-20 saw 15 LPAs release land (Table 6).12
Table 6. The number of local authorities changing Green Belt boundaries 2013-2020. Reproduced from: MHCLG, Local Authority Green Belt: England 2019-20 12
2013-14 2014-15 2015-16 2016-17 2017-18 2018-19 2019-20
Number of local authorities
3 11 8 8 10 13 15
11 CPRE (2019) Space to Breathe: State of the Green Belt 2019: https://www.cpre.org.uk/wp-content/uploads/2019/11/Space_to_Breathe.pdf. Accessed 5 Feb 2021 12 MHCLG (2020) Local Authority Green Belt: England 2019-20: https://www.gov.uk/government/statistics/local-authority-green-belt-statistics-for-england-2019-to-2020. Accessed 5 Feb 2021.

9
3.2 Applications on land within the Green Belt
Approved applications on existing Green Belt land: There is an increasing trend in the number of homes that
have been granted planning permission on greenfield Green Belt land since 2009/10 (Table 7 and Figure 1).
This increasing trend is most notable since the adoption of the NPPF in 2012, whereby the number of
approved applications has been generally rising. While the number of approved applications in 2019/20 is
reported to have decreased, it is important to note that a delay between submission of the application and
its approval is expected – demonstrated by the increase in approvals in the years 2015/16, 2016/17,
2017/18, 2018/19 seen since the previous report.13
Submitted applications on existing Green Belt land: Similarly, the trend for submitting applications on
greenfield Green Belt land continues to increase. There have been a further 148 applications submitted in
the year 2019/20, an increase on the previous high of 136 in 2018/19. These applications equate to 27,861
additional homes being built on the Green Belt, over a quarter of all submitted housing units over the
previous 10 years (Table 7).
Table 7. Number of submitted and approved applications and the resulting number of housing units since 2009/10 to 2019/20 financial years. Data source: Glenigan Number of
applications Number of housing units
Approved applications 337 52,829
Submitted applications 793 128,608
Figure 1. The number of applications and the number of units approved on greenfield land between 2009/10 and 2019/20 financial years. Data source: Glenigan
13 CPRE (2019) Space to Breathe: State of the Green Belt 2019: https://www.cpre.org.uk/wp-content/uploads/2019/11/Space_to_Breathe.pdf. Accessed 5 Feb 2021

10
4. Future pressure on Green Belt land
In December 2020, the government announced a change in approach to calculating housing need in England. This was in response to a fierce backlash to the previously proposed algorithm in August 2020’s Changes to the current planning system consultation, which would have resulted in high housing targets in many rural areas. The new December 2020 algorithm instead proposes to apply a Cities and Urban centres uplift, whereby 20 of England’s largest urban areas will have their housing targets increased by 35% .14
As well as the current and immediate threats to Green Belt land from housing development that have been discussed in this report, this proposed uplift will add further pressure to the Green Belts which surround many of these 15 urban areas.
We have identified six urban areas which, with the added urban uplift, do not have enough brownfield land on their registers to accommodate their five-year housing supply and, as a result, will have to consider building on their Green Belts (Table 8). London and Bristol will face the largest pressure on their Green Belts, having to find space for 177,907 and 5,948 homes respectively once all of their current brownfield land has been developed.
Table 8. The number of housing units in the Standard method, Standard method ‘uplift’, the brownfield capacity and number of houses above brownfield capacity of six urban areas with Green Belt. Source: Lichfield analysis 15 / CPRE brownfield analysis 16 Urban area Standard
method with uplift
5-year housing target
Brownfield land capacity
Number of homes required above brownfield capacity
Bradford 2,300 11,500 10,716 784
Bristol 3,196 15,980 10,032 5,948
Coventry 2,325 11,625 8,349 3,276
Derby 1,189 5,945 3,301 2,644
London 93,579 467,895 289,988 177,907
Newcastle-upon-Tyne 1,399 6,995 6,432 563
While the governement’s recent urban and brownfield focus is welcome, there is currently not enough brownfield land identified to cover the jump in assessed need in many areas. There needs to be more proactive identification of brownfield and the government needs to allow time for this. Also, a number of areas outside and beyond the major urban areas need regeneration and the government’s intervention
14 MHCLG (2020), Housing and economic needs assessment: https://www.gov.uk/guidance/housing-and-economic-development-needs-assessments. Accessed 16 Feb 2021 15 Lichfields (2020), Mangling the mutant: change to the standard method for local housing need: https://lichfields.uk/blog/2020/december/16/mangling-the-mutant-change-to-the-standard-method-for-local-housing-need?how-many-homes. Accessed 16 Feb 2021 16 CPRE (2020), Recycling our land: State of Brownfield: https://www.cpre.org.uk/resources/state-of-brownfield-2020/. Accessed 16 Feb 2021

11
could mean that instead of this happening, the soft and quick, but ultimately unnecessary, option of Green Belt release (either through plans or speculative applications) is taken instead.
5. Conclusion and recommendations
It is regularly argued that Green Belt restricts the building of the homes we need. But as we have shown here, developments in the Green Belt continue to be land-hungry, and lack the affordable housing that people actually need. At the same time, we are faced with a new way of calculating housing need which will only increase the pressure faced by local authorities to build on Green Belt land.
It is clear that we are faced with the prospect of our Green Belts continuing to be chipped away for unsuitable housing, while swathes of land that has already been built on lies wasted and under-used and the housing crisis continues.
The threat to Green Belt land has increased considerably since regional plans were abolished in 2009, and since the adoption of the NPPF in 2012, despite the government’s commitment to the protection of Green Belt in 2010. The consequences for Green Belt land due to these policies needs to be addressed.
The loss of this land is a loss for the people who rely on it for their health and wellbeing, to the wildlife that calls it home and a loss of potential for reducing the impacts of the climate emergency. We can restore and enhance our Green Belts to provide more space for nature and as a place to relax, play and grow our food. In order to deliver a positive future for our Green Belt, and build the homes we need. CPRE recommends the government:
reintroduces the use of effective strategic city regional planning into planning law through the
upcoming Planning Bill
ensures the Strategic Environmental Assessments process is not weakened, so their ability to
identify more sustainable or less harmful alternative to Green Belt release is maintained
introduces a clear ‘brownfield first’ or ‘renew zone first’ policy is adopted in the Planning Bill,
which ensures that suitable previously developed land can be prioritised for redevelopment over
any greenfield Green Belt sites, as well as taking a more proactive approach to identifying new
brownfield sites.

12
Annex: Method
This report investigates the two key ways in which Green Belt is developed:
1. ‘Exceptional circumstances’ are required to remove land from the Green Belt, usually with the
intention of future development, through the local plan process.
2. ‘Very special circumstances’ are required to build on land currently designated as Green Belt
determined through planning applications.
As with previous CPRE Green Belt reports, this report incorporates a range of data sources:
Planning application data: a dataset and report detailing the planning applications was provided by Glenigan,
a construction industry research consultancy. Further details of their approach are within their reports.
Additional analysis of planning application documentation provided the affordable homes figures for each
application.
Local plans: The data includes proposals identified in plans that have reached a late stage in their
development, from ‘pre-submission’ (regulation 19) publication to adopted plans. We did not include
allocations for safeguarded land and previously developed land whenever possible. When we could not
determine exact proposals to remove Green Belt designation local planning documents, we contacted Local
Planning Authorities (LPAs) directly.
Government publications: are used and referenced where relevant, in particular the Land Use Change
Statistics