state of microfinance in nepal of microfinance in nepal... · state of microfinance in nepal ......
TRANSCRIPT

State of Microfinance in Nepal
Prepared for
Institute of Microfinance (InM)
As part of the project on State of Microfinance in SAARC Countries
By
Shankar Man Shrestha
2009

2 | State of Microfinance in Nepal
Disclaimer
Any opinions expressed and policy suggestions proposed in the document are the author’s own and do not necessarily reflect the views of Institute of Microfinance (InM). The report also does not represent the official stand of the Government of the countries studied.
Institute of Microfinance (InM)| 3
Table of Contents
Chapter I: Introduction 5
1.1 Introduction 5
1.2 Objective 9
1.3 Scope 9
1.4 Methodology: 9
1.5 Limitations 10
Chapter II: Microfinance Models 11
2.1 Brief History of Microfinance 11
2.2 Microfinance Models 13
Chapter III: Outreach Assessment 19
3.1 Institutional Development and Outreach Growth 19
3.2 Outreach under Different Models 21
Chapter IV: Trend Analysis of Major Microfinance Institutions 27
4.1 Performance of Sixty Major Microfinance Institutions 27
4.2 Comparative Performance of the Four Categories of MFIs 31
4.3 Top Twenty MFIs 38
4.4 Financial Performance and Sustainability 40
Chapter V: Wholesale Lending Institutions 53
5.1 Rural Self-Reliance Fund (RSRF) 53
5.2 Rural Microfinance Development Centre Ltd. (RMDC) 56
5.3 Sana Kisan Bikas Bank Ltd. (SKBBL) 60
5.4 Commercial Banks (CBs) 63
Chapter VI: Interest Rate Policy and Practice 65
6.1 Interest Rate Policy 65
6.2 Common Practices 65
6.3 Method of Charging Interest 66
6.4 Interest Rate Charged by Wholesale Lenders 66
6.5 Interest Rate vis-à-vis Borrowing Cost 67
Chapter VII: Impact Assessment 68
7.1 Study Report of the 'Centre for Policy Studies and Rural Development' 68
7.2 Study Report of 'SAP-INAFI Nepal' 69
7.3 Study Report by RMDC 69
7.4 Case Stories 72
4 | State of Microfinance in Nepal
Chapter VIII: Policy, Legal and Regulatory Framework 76
8.1 Microfinance Policy 76
8.2 Regulatory Authorities and Regulated Institutions 77
8.3 Laws and Regulations 77
8.4 Implementation of Laws and Regulations of Financial Intermediaries 81
Chapter IX: Competition in Micro Credit Market and the Issue of Overlapping 84
9.1 Nature and impact of competition in the micro credit market 84
9.2. Impact of overlapping of clients 85
Chapter X: Challenges of the Microfinance Industry 88
10.1 Problems and Challenges 88
10.2 Recommendations 90
References 93

Institute of Microfinance (InM)| 5
Chapter I: Introduction
1.1 Introduction
a. Country background
Geography: Nepal is a land locked country sandwiched between China in the north and India in other three directions. Its altitude ranges from 70 meters to 8,848 meters from the mean sea level. The country stretches from East to West with a mean length of 885 km and north to south with a mean width of 193 km. The country has a total of 147,181 square kilometer area. Geographically, the country is divided into three ecological zones, the high mountains and Himalayas in the north, the hills and small mountains in the middle and the Terai (plains) in the south. Administratively, the country is broadly divided into five development regions - eastern, central, western, mid-western and far-western development regions. The five development regions have 14 zones and 75 districts.
Demography: The population census of 2001 indicated an annual growth rate of 2.25% and on this basis the total population has been estimated to have reached to 26.994 million in 2008. According to the National Living Standards Survey (2004), the country has 52.8% economically active population (15-59 years). The average family size is 5.3. And the average female headed households' stands at 19.6%.
Economy: At the current prices, the annual per capita income in 2006-07 stood at US $ 383. Nearly 86.1% of the total populations live in rural areas and 66% of the total population depends on agriculture and related activities for their livelihood. Agriculture, tourism, hydropower and forestry are the major areas for broad-based development of the country. Nepal has high potential for accelerated growth and development as it is situated between the two fast growing giant neighbors – China and India1.
b. Poverty Situation
Nepal is one of the poorest countries in the South Asia region and in the world. Poverty is the main challenge of economic development in Nepal. According to Nepal Living Standards Survey (NLSS) 2003/04, during the last eight years, the people living below the absolute poverty line, has fallen to 31 percent from 42 percent. The reasons behind this poverty reduction are:
• Increased wage rate in both the agricultural and non-agricultural sectors,
• Increasing urbanization,
• Increased proportion of active human resources in the population, and
• Inflow of huge amount of remittances2
1 Microfinance Industry Report, 2008 2 Three-year Interim Plan, 2007-09

6 | State of Microfinance in Nepal
However, during this period, the Gini-coefficient, which shows the inequality of income distribution, has increased from 0.34 to 0.41, which indicates that, the gap between the rich and the poor has increased further. Similarly, according to the Human Development Report of 2006, although the human development index of Nepal has increased from 0.513 in the previous year to 0.527, Nepal still remains as the country with the least HDI in South Asia, and Nepal is placed at the 138th position in the global human index3.
The poverty reduction rate is low due to low per capita income, and high population growth rate. Taking Rs. 7,696 as the average national poverty line as per the Nepal Living Standards Survey (NLSS) 2003/04, 30.85% of the population of Nepal falls below the poverty line. On the basis the of Survey's benchmark of one dollar a day according to the purchasing power parity (PPP) terms, 24.1% of the total population falls below the poverty line. In the context of poverty alleviation, it is important to analyze poverty incidence, poverty gap and squared poverty gap. Poverty incidence indicates the proportion of the population living below the poverty line, whereas poverty gap indicates how far and what percentage of the population is distributed below the poverty line. The squared poverty gap is an indicator that shows how deep the inequality that exists even among the poor is. The following table shows the changes in poverty line, poverty gap and squared poverty gap region-wise between fiscal years 1995/96 and 2003/04. This table has been abridged from the survey report.
Table 1: Poverty Measurement (1995/96 and 2003/04) (Percentage)
Region Population below Poverty Line
Poverty gap Squared Poverty gap
1995/96 2003/04 1995/96 2003/04 1995/96 2003/04 Urban 21.55 9.55 6.54 2.18 2.65 0.71 Rural 43.27 34.62 12.14 8.50 4.83 3.05 Nepal 41.76 30.85 11.75 7.55 4.67 2.70
Source: National Planning Commission
In the urban areas people under poverty line has declined by 12 percentage points, while in the rural areas it has declined only by 8.65 percentage points making the overall reduction of people below poverty line by 10.91 percentage points. The key reasons for this decline are rise in the remittance income and increase in the agricultural wages and the growth in the economically active population. However, the Gini coefficient, which measures the inequality in income distribution, has reached to 0.41 in FY 2003/04 from 0.34 in FY 1995/96. This implies a sharp increase in the income of the rich people as compared to the poor people. The Gini coefficient between geographical regions (accessible and remote areas) and between various castes and ethnic groups has also grown bigger.
According to the Nepal Living Standard Survey (NLSS) 2004, among those living below the poverty line, 67% are in agricultural employment and 11% are agricultural laborers. Thus, 78% of the poor depend on agriculture for their livelihood. Among the various ethnic groups, 46% of Dalits, 44% of hill ethnic groups, 41% of Muslims, 35% of Terai indigenous peoples and 31% of other minority ethnic groups live below the poverty line. Furthermore, 14% of Newars, 18% of Brahmins/Chhetris and 21% of Terai middle classes also live below the poverty line.
3 Three Years Interim Plan

Institute of Microfinance (InM)| 7
The NLSS report also indicates that 29.4% of Nepal's total poor live in rural mid and eastern hills. This figure is 23.6% in rural western hills, 23.5% in rural eastern Terai, 18.9% in the rural western Terai and 4.7% in urban areas. Similarly, of the total poor, 7.5% are estimated to live in the mountainous region, 47.1% in the hills and 45.4% in the Terai. Table 1 also indicates a drop in poverty gap from 11.75% in FY 1995/96 to 7.55% in FY 2003/04, and squared poverty gap from 4.67% to 2.70% for the same years. Reduction in poverty gap and squared gap are good symptoms of economic progress with good income distribution as this brings down the gap between rich and poor with respect to income inequality.
The current Three-Year Interim Development Plan 2007-09 (TYIP) is aimed at reducing unemployment, poverty, and inequality and establishing sustainable peace. In order to achieve these objectives, the Government of Nepal (GON) has come up with 6 strategies and has been working for promoting investment in corresponding sectors. The six strategies include: 1] lay special stress on relief, re-construction and re-integration, 2] realize employment-oriented, pro-poor and broad-based economic growth, 3] increase effectiveness in the promotion of good governance and the delivery of services, 4] increase investment in physical infrastructure development, 5] emphasize social development of the people, and 6] follow inclusive approach in development and launch targeted programs. The interim plan is aimed at reducing population under poverty line from 31% to 24%, and attain growth rate of 5.5% within three years. For this, the GoN is implementing inclusive approach to development that would bring class, community and regions, which were left out from the mainstream development4.
With the objective of freeing people of various social classes, communities and regions unable to join the mainstream of development due to economic, social and cultural reasons, from poverty and backwardness targeted programs have been implemented. Such targeted programs cover women, Dalits, indigenous people, Madhesis and backward sections, communities living in remote areas, ultra-poor and small farmer households.
The discussion made above has indicated that a huge section of the country’s population is in a state of destitution. These people need microfinance services to achieve the national objective of gradually reducing poverty through promoting capital formation and generating self-employment opportunities.
c. Microfinance Services
Microfinance is one of the best alternatives to generate self-employment. It provides services to the communities who have no collateral to offer against the loans they take but have indigenous skills and strong desire to undertake economic activities for self employment and income generation. Women who could gain access to microfinance services have been able to create self-employment opportunities and have been economically and socially empowered through increased income earning from their small projects. The MFIs and the wholesale lending institutions such as RMDC together have raised the level of awareness and the required skills of these women to successfully carry out locally feasible income generating activities. Many participating women have now become self-reliant both economically and socially with the acquired knowledge and skills, and the resultant income from the microfinance program. Thus, microfinance has become a strong means to reduce poverty especially of the women. Among the many developmental programs implemented in Nepal, microfinance programs have a strong rural orientation and are targeted at the poor. They have been in continuous operation even during the period of conflict or Maoist war.
4 "Poverty Alleviation Efforts and Current Challenges" (Nepali version) – an article appeared in Annapurna Post Daily on Thursday, April 14, 2009.

8 | State of Microfinance in Nepal
The Nepal Rastra Bank (NRB) under the "Priority Sector Loan Program" (prathmikta chhetra karja karyakram) directed the commercial banks to provide institutional loans to the Priority Sector in April 19745. Accordingly, they were required to disburse five percent of their total deposit as loans to this sector such as agriculture, cottage industry and services.
In 1975, the Agriculture Development Bank, Nepal (ADBN), started Small Farmer’s Development Program (SFDP) on a pilot basis in two Village Development Committees (VDCs) of the two districts, one in the hill and the other in Tarai. The success of this pilot testing prompted the then government to expand it to all over the country. The number of Sub-Project Offices (SPOs) reached 422 covering 652 Village Development Committees (VDCs) by December 19966. Now, the SPOs are in the process of transformation into Small Farmers Cooperative Limited (SFCLs). Sana Kisan Bikas Bank Limited (SKBBL) has also been established in 2002 to provide wholesale loans to the SFCLs. Thus far, 228 SFCLs have been formed with 139,368 members and 111,494 borrowers. As of April 2009 a savings amount of Rs. 916.18 million has been mobilized, a cumulative loan of Rs. 4,702.80 million disbursed to the ultimate clients (group members), out of which Rs. 3,898.51 million have been recovered leaving Rs. 804.29 million as outstanding. The overdue amount stood at Rs. 21.36 million and the overdue rate at 2.65%.
The Government of Nepal (GoN) and the central bank introduced Grameen Bank (GB) approach of Bangladesh by establishing two GBBs, one in the Far-Western Development Region and another in the Eastern Development Region in the year 1992. Soon after 3 more GBBs were also established one each in the remaining three development regions. Five private GB-model replicating banks and several Financial Intermediary Non-Government Organizations (FI-NGOs), and Savings and Credit Cooperative Societies (SCCSs) also came into existence following the GB approach which enhanced the accessibility of the poor to the microfinance services at their doorstep. The group members understand the problems and capabilities of all members, and the Loan Officer, who goes to provide service at the doorstep, also gets an opportunity to closely assess the reality of the local situations. Both these factors help to effectively use the loan funds provided to the group members and a system of close monitoring for productive use of loans is also made possible by the decisions of the group together with the Loan Officer. The total coverage of members and borrowers by the 60 principal MFIs following GB approach stand at 842,205 and 655,536, respectively in July 2008. The cumulative loan disbursement has reached Rs. 41,508.50 million, loan recovery Rs. 35,061.97 million and the outstanding Rs. 6,446.53 million. The total overdue loan stood at Rs. 264.75 million generating an overdue rate of 4.10% on average. The total savings mobilized by July 2008 stood at Rs. 2,229.24 million (34.58% of loan outstanding).
Since early 1990s, the government of Nepal (GoN) and the Nepal Rastra Bank (the Central Bank of Nepal) have been initiating a number of measures to ensure that supply of credit is made adequately to the targeted families on time and with easy terms and conditions. GoN also made provisions for wholesale lending to the MFIs. The Rural Self Reliance Fund (RSRF) was also established in 1991 to make small wholesale funds available to start up MFIs and another wholesale institution the Rural Microfinance Development Centre Ltd. (RMDC) was established in 1998 to extend larger wholesale funds to MFIs. Since then, RMDC has been playing a major role in the institutional development of MFIs. It has promoted more than 50 MFIs from the scratch and helped them develop the microcredit market. RMDC is focusing more on quality services and
5 National Micro-Finance Policy, 2005 6 Source: Impact Evaluation of Microfinance Programs on Poverty Reduction, June 2004

Institute of Microfinance (InM)| 9
sustainability of its partner organizations (POs). It has also has been effortful to persuade its POs to extend their services to remote areas.
In 1982, the government also launched a women focused microfinance program (PCRW) – 'Production Credit for Rural Women through the Women Development Section of the Ministry of Local Development with the support of the government owned commercial banks for credit, which has outreached 82,416 women.
Similarly, the government has been making provision of credit component in several donor assisted rural development projects also for supporting self-employment, promotion and income earning activities. These projects include Participatory District Development Program (PDDP), Poverty Alleviation Fund (PAF), Decentralized Local Governance Support Program (DLGSP) and many others which had followed the Self-Help Group (SHG)/Community Organization (CO) model of micro financing.
1.2 Objective
The key objective of this study is to document the status of progress achieved in poverty alleviation through microfinance programs of the Microfinance Institutions (MFIs) and /or Self-Help Groups (SHGs) in Nepal.
1.3 Scope
The study is focused on:
• History of Microfinance • Microfinance models • Outreach – Deepening and expansion of the programs • Impact of microfinance programs at household level, • Regulatory frameworks, • Sustainability of MFIs, and • Challenges before MFIs
1.4 Methodology:
The study report has drawn information from available literature on microfinance and reports of various Microfinance Institutions in Nepal. Concerned professionals of RMDC and other organizations were consulted to solicit their views and ideas at various stages of report preparation and their comments and

10 | State of Microfinance in Nepal
suggestions have been incorporated. The review is supported by updated statistics drawn from the published papers and progress reports.
1.5 Limitations
• There is a dearth of consistent set of data relating to various aspects of microfinance. This has hampered the collection of data as per the prescribed formats provided in annexes 1 and 2 of the terms of reference (TOR).
• Collecting time series data from MFIs is again a daunting challenge as many of them do not maintain records the way the information formats demand.
• In the case of cooperatives, there is also a difficulty in segregating data on microfinance services from that of non-microfinance services as they are providing both services.
• The performance of Self-Help Groups (SHGs) is not recorded with any agency. There is some information drawn from some of the reports of the project implementing agencies in the case of self-help groups promoted under those projects.
Despite these limitations, the present review provides an insight into the status of microfinance sector in Nepal and their contribution to poverty alleviation.
Institute of Microfinance (InM)| 11
Chapter II: Microfinance Models
2.1 Brief History of Microfinance
The term microfinance was not used in earlier part of the history of rural microfinance. It has been found used in Nepal only in the later part of 1990s. Rural credit in Nepal began in 1956 with the opening of Credit Cooperatives in Chitwan Valley to provide loans to the re-settlers coming from different parts of the country. The government through the creation of the Cooperative Development Fund (CDF) arranged some credit support to the re-settlers through those cooperatives. In 1963, the government established the Cooperative Bank, which was later converted into the Agricultural Development Bank Nepal (ADBN) in 1968. The Cooperatives faced problems of shortage of fund for credit disbursement to their members on the one hand and misappropriation of borrowed fund for personal uses by some of their officials on the other. Hence, the government commissioned a fact-finding mission in 1968 to probe the operations of 1489 cooperatives then registered with the Department of Cooperatives and the mission found most of them at defunct stage and recommended for their liquidation.
Thereafter, the government introduced the Cooperative Revitalization Program in 1971. It authorized the Agricultural Development Bank Nepal to run cooperatives under its guidance and management. In 1976, ‘Sajha Program’ was launched and the Cooperatives were renamed as ‘Sajha Societies’. The compulsory savings collected under the Land Reform Program of 1964 (2021 B.S) were converted into the share capital of the Sajha Societies. The NRB conducted a benchmark survey in 1983/84 to assess the situation of the cooperatives. The study found that 94% of cooperatives were dealing with transactions of agriculture inputs and 85% were also found extending credit. Most of the cooperatives were running at losses and over 75% of the outstanding loan was overdue for more than 1 year.
ADBN launched the Small Farmers Development Program in 1975 – first as pilot project at two sites, Sakhuwa Mahendranagar of Dhanush district in the Terai and Tupche of Nuwakot district in the hills. The strategy was to organize small farmers, tenants and landless laborers into groups and strengthen their receiving mechanism for tapping resources from service delivery agencies. Credit was provided under group guarantee. It also focused on developing a habit of thrift and personal savings among the members of the groups. They also started group savings to realize self-reliance in financial resources. A total of 142,711 members who were organized into 19,597 groups were benefited from the program by July 1991/92.
After the reinstallation of multiparty democracy in 1990, the government appointed a seven member National Cooperative Consultation Committee (NCCC) and dissolved the ‘Sajha Central Committee’. It also set up a National Cooperative Development Board (NCDB) constituted of 11 members to provide policy directives to the cooperatives. The government enacted a new Cooperative Act in 1992 to ease promotion and development of cooperatives as a vehicle of economic development in the rural areas. The government also emphasized the role of cooperatives for extending credit facilities and other services to the rural people in its Eight National Plan.
12 | State of Microfinance in Nepal
The Nepal Rastra Bank (NRB) initiated Small Sector Lending in 1974 directing the commercial banks (CBs) to invest 5% of their deposit balance in Small Sector, which was later designated as the “Priority Sector Lending” in 1976. The NRB subsequently initiated “Intensive Banking Program” (IBP) in 1981 to boost up PSL lending to the low income group and required CBs to raise PSL to 8% of CBs’ loans and advances, which was further raised to 12% in 1989. The main partners of PSL were the Nepal Bank Ltd. (NBL) and the Rastriya Banijya Bank (RBB) - the two state controlled CBs. The share of NBL and RBB in rural credit supply was 4.1% and 2.4% in the Sixth and 12.3% and 6.7% in the Seventh Plan periods. Loans under PSL were classified into agriculture, cottage industries and services. Target groups under PSL are low-income families with Rs. 2,511 or less as per capita income per year. The beneficiary must contribute 20% of the project cost if the loan size was more than Rs. 15,000. NBL and RB charged 15% to 16% interest rates on priority sector loans. They provided loans up to 80% of the appraised value of the collateral for low income and 70% for the high-income families. However, these CBs provided loans to the group members of Production Credit for Rural Women (PCRW) formed by Women Development Section (WDS) of the Ministry of Local Development and the groups formed by the bank staff without collateral on just group guarantee. The loan limit for such loans was Rs. 30,000.
The Grameen Bank model of Bangladesh was replicated in Nepal with the establishment of Eastern and Far-Western Grameen Bikas Banks (GBBs) in 1992. The target groups included in Tarai the farmers with holding less than 1 Bigha (0.67 ha) and in the hills with holding less than 10 ropani (0.5 ha), and the landless. It followed group approach in extending credit. Credit discipline was given top priority and loans were extended without collateral security on group guarantee. The board of directors of the GBBs comprised of the NRB and CB representatives and is headed by the Deputy Governor or Executive Director of NRB. The share capital of the first two GBBs was mainly contributed by the government and the NRB (75%), and by the CBs (25%). The first two GBBs started functioning from the middle of 1993. They charged 20% interest rate and the main source of fund for lending came from NRB and CBs. In the meantime, two NGOs – the Nirdhan and the Centre for Self-help Development (CSD) also launched microfinance programs replicating Grameen model in 1993 and 1994 respectively.
The financial Intermediaries Act was enacted in 1998 to regulate the financial intermediaries NGOs (FINGOs) on carrying out microfinance activities. This was claimed to be a breakthrough in legalizing the operation and activities of NGOs as microfinance operators. With the enforcement of this Act, two FI-NGOs, Nirdhan, and the Centre for Self-Help Development (CSD) also got registered under it. Later 47 NGO got license from the NRB to operate as FI-NGOs.
In 2004, the government introduced the Banks and Financial Institutions Ordinance (which was converted into an Act in 2006), which has a provision of licensing microfinance banks also as class 'D' banks. As a result, 13 microfinance banks have been issued license by the NRB till the date. In order to make available small wholesale funds to cooperatives and NGOs providing loans to the low income groups, the government had created a fund called Rural Self-Reliant Fund in 1991with Rs. 20 million contributed by the government. The government with the assistance from ADB and NRB also established the Rural Microfinance Development Centre Limited (RMDC) in 1998, to provide larger wholesale loans to MFIs through implementation of the ADB assisted Rural Microfinance Project (RMP). After the operation of RMDC, several MFIs were added in the microfinance market and the coverage by the microfinance institutions also increased with faster speed. The government had also instituted another wholesaler, the Sana Kisan Bikas Bank Limited (SKBBL) in 2001 to provide wholesale funds to the Small Farmers Cooperative Limited (SFCL) in 2001. With all these initiatives and efforts microfinance has gained a new momentum as an industry. Besides all these self-help groups also were promoted by several rural and community development projects of the government and donors to provide small credit to the self-help group members through grants for seed funds.

Institute of Microfinance (InM)| 13
2.2 Microfinance Models
There are quite a few prominent models of microfinance in the country. These include Cooperative model, SFCL model, Grameen Bank model, and Community based organizations (COs) or Self-Help Groups (SHGs) model. In addition, Production Credit for Rural Women (PCRW) and Village Banks are also considered separate programs/models of microfinance in Nepal. The programs like Decentralized Local Governance Support Program (DLGSP), Poverty Alleviation Fund (PAF) and some other rural development programs have also included microfinance as a component following the SHG model. Each model has its historical background and modus operandi of its own. They are highlighted below:
a. Cooperative Model
Historical background
The history of cooperative societies in Nepal dates back to 1956, when the government first started 13 cooperatives societies in Chitwan district. In 1963, the government established the Cooperative Bank, which later was merged into the Agricultural Development Bank, Nepal in 1968. Rural based cooperatives were established mainly to distribute loans for agricultural inputs to farmers and trading of agricultural inputs and consumer goods to the local people both in cash and credit. These cooperatives were initially managed by the members and supervised by the Department of Cooperatives. Later, in 1973 the government decided to hand over the management of these cooperatives to the Agricultural Development Bank initially for a period of five years, which was subsequently extended by another five years. Later, the management of the cooperatives was again handed over to the members themselves in 1992.
In 1991, the government of Nepal enacted the Cooperative Act 1992. Under this Act, a group of 25 persons from a community can form a cooperative by registering it with the Department of Cooperatives, Ministry of Agriculture and Cooperatives. The Savings and Credit Cooperatives (SCCs) do not come under the regulatory framework of the Nepal Rastra Bank (NRB). However, some cooperatives that have been licensed from NRB for limited banking services have been providing services to non-members as well. They come under its regulation and supervision.
Modus operandi
The SCCs can target all community members in a given locality irrespective of their social and economic status. Twenty-five people can get together to run a cooperative in their respective locality/village. Currently, most of the members of these organizations belong to well to do families who can make savings and the

14 | State of Microfinance in Nepal
average membership is around 100 per cooperative7. These cooperatives take savings deposits from their members and whoever wants to put savings in the cooperative is extended membership. They also provide loans to their members for a number of purposes. Loans provided to the members have a minimum term of three months to three years covering specific areas such as agriculture, housing, micro enterprises, or some social purposes. The SCCs are supposed to be self-regulated, which often are mismanaged due to the lack of control of members over the board of directors and members are not aware of the principles of a cooperative due to lack of membership education. These organizations have not been well regulated and supervised from higher authorities; as a result, many of them do not have standard accounting and sound management practices. They also lack good governance. In spite of all these, SCCs are considered more suitable financing model for the hills and mountains as they provide both savings and financial services to the members who are the local people in a homely atmosphere without much of bureaucratic process. Due to low cost operation, their interest rates also are lower than other financial institutions.
b. Small Farmer Cooperative Limited (SFCL) Model
Historical background
The Agricultural Development Bank Nepal (ADBN) initiated the Small Farmer Development Program (SFDP) as a pilot project in 1975. The Food and Agriculture Organization (FAO) donated US dollar 30,000 to initiate pilot testing of SFDP at two sites, Sakhuwa Mahendranagar in Dhanusha district (Terai) and Tupche in Nuwakot district (Hills). At that time, FAO was providing technical assistance to seven nations of Southeast and South Asia to implement this program8. After finding the successful implementation of the program in two pilot sites, the ADBN expanded the SFDP gradually to 422 sites covering a total of 652 VDCs in 75 districts, which catered to around 188,000 small farmer families9. The quality of service was somehow affected by the higher speed of expansion without developing the staff capabilities and failure to remain away from political pressure in implementation.
Later, an attempt was made with the technical and financial support of GTZ – German Technical Cooperation, Nepal to convert the Small Farmer Development Program Sub-Project Offices (SPOs) into Small farmer's Cooperatives. Institutional development for this conversion was initiated in 1988 under GTZ's Rural Finance Nepal Project (RUFIN). In 1993, four SPOs of Dhading district were first registered as Small Farmer Cooperative Limited (SFCL). At present more than 228 SFCLs in 41 districts have been registered covering 139,368 members and 111,494 borrowers. Out of this, 11 SFCLs are entirely managed by women members and 219 SFCLs are affiliated to the Sana Kisan Bikash Bank Ltd. (SKBBL)10 – a bank established in 2001 to provide wholesale finance to SFCLs. SFCL model has been honored with CGAP/IFAD Pro-Poor Innovation Challenge Award-2003, as the best model of poverty alleviation11.
7 Microfinance Industry Report, 2008 8 FAO Program Document on SFDP, 1974 The program was first implemented in Vietnam, S. Korea, Laos, Thailand, Indonesia, Sri Lanka and India 9 Source: Impact Evaluation of Microfinance Programs on Poverty Reduction, June 2004 10 Source: SFCL Model – Problems and Prospects – a paper presented in Microfinance Summit 2008. 11 Source: SKBBL Annual Report, 2008

Institute of Microfinance (InM)| 15
Modus operandi
SFCL has a three tiers structure. At the village level, promoters facilitate local household members to form groups; at the ward level. The farmers' groups with common interest and proximity are integrated into inter-group associations and at the VDC level, all groups and inter-groups are represented in the Executive Committee. For the operation of the SFCL, the Executive Committee is formed of the members elected by the General Assembly. The Executive Committee is responsible for hiring the Manager and other staffs and for deciding on the rules and regulation needed to ensure the smooth and effective operation of the organization.
The grassroots’ groups organize regular meetings to collect mandatory savings and loan repayments and applications for loan demand. These loan applications are forwarded to their respective inter-groups, which appraise them and forward with recommendations to the Executive Committee for final decision. The SFCL is generally confined to one VDC area and it targets only at the small farmers. The loans are extended mainly with collateral security. They also make some loans without collateral security. However, such cases are less than 10%. Each SFCL in an average serves around 500 households. SKBBL provides them with wholesale loans while the Federation of SFCLs regularizes and supervises their financial activities. SKBBL has provided wholesale loans to 219 SFCLs. Some 60 SFCLs are demonstrating very good performance12. Some of them have generated sufficient internal resources and are having an annual transaction of Rs. 40 – 60 million. However, these SFCLs have been borrowing a few hundred thousand rupees from SKBBL just to maintain good relation with it. Some SFCLs have also borrowed from RMDC. It is reported that some SFCLs have also been providing larger size loans to the graduated clients so that they do not lose these clients to other banks and financial institutions. Some also provide enterprise loans larger than the NRB defined ceiling of Rs. 150,000.
c. Grameen Bank Model
Historical background
The Grameen Bank concept of lending propounded by Prof. Muhammad Yunus of Bangladesh was introduced in Nepal during 1990s by the GoN and NRB by establishing five regional Grameen Bikas Banks (GBBs), one each in 5 development regions of Nepal. During the same time, two national level NGOs namely the Nirdhan and the Centre for Self-help Development (CSD) also launched microfinance programs replicating the same Grameen model and later they also established two microfinance development banks, Nirdhan Utthan Bank Limited (NUBL) at Bhairawa and Swablalmban Laghubitta Bank Limited, (SB bank) at Janakpur adopting the Grameen model. Similarly, other prominent NGOs - Chhimek, DEPROSC, NRDSC, FORWARD, and Jeevan Bikas Samaj (JBS) - also started their microfinance programs following this model. At present, GBBs, Private Microfinance Banks (PMFBs) and a host of FI-NGOs and SCCs are also providing microfinance services to the poor following Grameen model.
12 Source: Mr. Jhalendra Bhattarai – Manager, SKBBL

16 | State of Microfinance in Nepal
Modus operandi
This model is comparatively more successful in areas, where the market and road infrastructure is more developed and economic activities are vibrant. It is more feasible in Terai than in the hills and mountains. The approach is based on the formation of peer groups each comprising five members. Three to ten such peer groups form a center at a particular location – close to a village, where they meet once every week or fortnight or month as decided by the members. Each group elects a group chairperson and each center a center chief to oversee the activities of group members and maintain group discipline, check utilization of loans and ensure timely repayment of loan installment. In such meet, group members collect savings and make demand for loans and also settle the loans or interest due and repay loan installments as per schedule. They do not need to provide collateral security for the loans but need to provide group guarantee for repayment. To begin with, the potential target groups are identified with Participatory Rural Appraisal (PRA) techniques or Participatory Wealth Ranking (PRW) exercise to identify the target groups. After the target groups are identified, the eligible members participate in a weeklong pre-group training (PGT) or a compulsory group training (CGT) on microfinance procedures and organization and operation of groups and centers. The MFI field staff facilitates the fortnightly or monthly meeting, where they also collect mandatory and voluntary savings, loan repayment installments and loan demands from the members and also verifies the utilization of disbursed loans. The GBBs still follow the weekly meeting and other procedures of the traditional Grameen Bank model, while the replicating Private MF Banks and FI-NGOs have adjusted the model to suit their local conditions and requirements. Some of the institutions following Grameen Bank model also have diversified saving schemes such as education savings, pension fund savings, micro-insurance covering risks related to loans, life, health and their livestock as in Grameen Generalized System (GGS). Some dynamic groups also deal with other social problems and issues related to community and take necessary actions to resolve.
d. Self-Help Groups (SHGs)/Community Organizations (COs) model
Historical background
In Nepal there are several forms of informal self-help groups such as ‘dhukuti’, mothers’ group, and many other groups with specific objectives. This type of SHG needs not be pro-poor focused. Mostly, lower middle or middle class people are involved in this type of SHGs.
Another most popular informal self-help group is Aama Samuha (mothers’ group). Mothers’ group is mainly formed and activated by the local women with one or more objectives that could be related to income generation aspect and/or removing social evils and bring about positive changes in the society. Women empowerment is the main objective of the most mothers’ groups. These mothers’ groups organize campaigns against alcoholism, injustice to women, girl trafficking, and other social evils. They also mobilize their savings and provide credit to the needy members. However, these are not necessarily targeted at the poor. They are very common in the hills and mountains. They have been in practice now for more than 3 decades. They used to be widely practiced in the hills and mountains of Western Development Region. However, these groups are not recorded anywhere.

Institute of Microfinance (InM)| 17
In India, SHG model is widely applied in a number of states by the banks with a view to extending microfinance services to a large number of poor communities at a lower cost of transaction. They are also linked with the commercial banks for loans. However, in Nepal SHGs are not tied up with the formal banking institutions as yet except those promoted by WDS. SHGs or COs are formed and promoted under a number of rural development programs implemented by different agencies, such as Production Credit for Rural Women (PCRW – started in 1982), Participatory District Development Program (PDDP) and Decentralized Local Governance Support Program (DLGSP) supported by UNDP, and Poverty Alleviation Fund (PAF) funded by the World Bank.
Rural development programs also organize Community Organizations (COs) or Self-help Groups (SHGs) as vehicles for expediting people’s participation in the programs. Such programs focus on poverty reduction through local capacity building as in DLGSP and PAF. In most cases, SHGs/COs undertake savings and credit activities as well for enterprises development and livelihood improvement. In DLGSP, the COs receive some counterpart funds as seed money to the groups or the COs for providing financial support to their members for implementing economic activities or entrepreneurial development programs. The projects also provide various capability enhancement trainings to the COs. Some development agencies have converted these into savings and credit cooperatives by registering them with the Department of Cooperatives. However, most of them have remained informal and have gradually become non-functional after the projects are phased out. They also have failed to develop linkage with the formal financial institutions due to lack of legal status.
Modus operandi
The 'Dhukut' system is a very old form of self-help group in Nepal; it has been in operation for more than 4 decades. Closely affiliated and well-acquainted persons form a group and start contributing a specified amount at specified intervals of time. In each collection meeting, the cash collected is given to one of the needy members for use as per the rules set unanimously by the group. Rules are found generally unwritten, but agreed by all in the inception meeting. The member who has used the amount will also continue contributing the time bound amount till all the members get chance to use the money raised in each sitting. The essence of this practice is that with small installments contributed by all group members one needy member can use a huge sum of money that can accomplish a larger activity generating a lasting source of income. It is a self-help approach to development of members. Those who use the fund at the earlier opportunity can turn over the money and get benefited more through the time value of money. In this system, members do not need to pay interest as such, but depending on the rules they make, early seekers of the sum have to get little less money than what is collected in total and the last holder of the chance may just collect his/her total deposit and/or little more money left by the early seekers. Members may also make a rule to enjoy the surplus money by organizing picnic or opening lottery, which provides the lucky ones with surprise prizes.
The Local Development Fund (LDF) under PDDP and DGLSP assists local communities to get local people organized into Community Organizations (COs)/SHGs in various settlements within the Village Development Committee (VDC). COs are organized for separate groups for men or women or both. The COs also mobilize compulsory and other types of savings. Generally they charge 10-12% interest per annum to the borrowers under their lending schemes. COs conduct regular meetings in which members apply for loans and also collect due installments. COs determine the interest rates and other terms and conditions of loans if they lend money using their own savings. If a member demands more money than the CO can provide from its savings, the member would have to fill a separate application form addressed to the Local Development Fund (LDF). The CO recommends the loan and forwards it to the LDF for approval. Similarly, PAF also organizes local groups

18 | State of Microfinance in Nepal
of the target families known as COs through the use of local NGOs. They are provided with seed fund at the rate of Rs. 3,000 per family member. They are informal groups and not linked up with any financial institutions. They also charge about 10% interest per annum.
e. Village Bank Model
Historical background
The Village Bank (VB) model was evolved from Latin America and tried out in Nepal between 1998 and 2001 in USAID funded Women Empowerment Project (WEP) through PACT-Nepal. Village Banks are grassroots level financial institutions – community-managed savings and credit associations aimed at providing financial services to community women through the mobilization of their own resources and enable them to achieve financial self-reliance. They have been promoted by the Pact Nepal in collaboration with some local NGOs and Cooperatives in the Terai region of Nepal. The project also lent some money to build up the external account of the VB, which was then lent to its members. However, they have not been linked up with the financial institutions and most such banks have been non-functional after the phase out of the project.
Modus operandi
A typical VB consists of 40-50 women. It begins with a literacy class of six months where savings credit operation process also was taught. Later, the VB mobilizes members’ savings for providing loans for both productive and consumption purposes to the needy women members and also provides support for the capacity building of the banks. A member generally gets Rs. 3,000 to 10,000 at a time. The loan size depends on the amount of the savings available in the Village Bank. At the end of 16th week, the loan cycle must also end. All loans must be paid back to get new loans released. This is also called zero gathering, as old loans are settled and new loans are given in this gathering making a zero balance. Interest is not given on the savings deposits; however, at the end of each loan cycle, benefits from the proceeds are shared in proportion to the savings deposits. Benefits are distributed in the form of savings to the corresponding savings accounts based on a minimum balance kept for at least nine weeks instead of providing cash to the member depositors. The village banks generally charge 24% interest per annum and interest is collected on upfront basis. The management of the VB is generally done by the chair, the secretary and the treasurer elected by the members. They keep all the records, minutes and books of accounts maintained by themselves and all the documents are put in a tin box, triple locked by all the three officials and opened and locked in the meeting in front of all the members. Things are all kept transparent to the members. Such VBs have not been linked up with any financial institution during the project. However, some VBs have been linked with one SCC in Nawalparasi district under RMDC loan support. This model has advantage and suitability in the less accessible and the remote parts of the districts in Nepal.

Institute of Microfinance (InM)| 19
Chapter III: Outreach Assessment
3.1 Institutional Development and Outreach Growth
Institutional development is a prerequisite for the promotion and development of credit programs for the poor and their outreach. Towards this, the Nepal Rastra Bank directed the two commercial banks (CBs) to invest 5% of their deposit balance to low income groups in 1974. Later this kind of financing is named 'Priority Sector Lending' (PSL) and raised the limit to 8% of CBs loan and advances. The NRB initiated “Intensive Banking Program” (IBP) in 1981 and further raised the PSL limit to 12% in 1989. The main partners of PSL were the Nepal Bank Ltd. (NBL) and the Rastriya Banijya Bank (RBB) - the two state-owned CBs. The CBs provided short, medium and long term loans of one, five and ten year-terms, respectively. They provide loans up to 80% of the appraised value of the collateral for low income and 70% for the higher-income families. Later, these CBs also provided loans to the members of the groups formed under the Production Credit for Rural Women (PCRW) Project implemented by the Women Development Section (WDS) under the Ministry of Local Development and also to the members of groups formed by banks themselves by taking group guarantee from all the members. The limit for loans without collateral security was Rs. 30,000. However, the share of the commercial banks was less than 10% in the total supply of the credit in the country till 1990.
The government with a loan support from (ADB) launched Micro Credit Project for Women (MCPW) in 1993 as a supplementary program to PCRW. It was implemented in the selected places of 15 districts. Under PCRW, 82,416 women borrowed loans for various purposes from the program. In total, 933 million was disbursed in loans to the group members. In all 104 institutions mainly cooperative societies and some NGOs were formed and operated by the members under PCRW program.
The Agricultural Development Bank, Nepal also launched a Small Farmers Development Program in 1975 as the pilot project at two sites, one in the Terai and another in hills to provide credit services to the small farmers by organizing them into groups. A total of 142,711 members who were organized into 19,597 groups were benefited from the program by the end of FY 1991/92. The cumulative disbursement and recovery amounts had reached Rs. 1,471.8 million and 796.1 million, respectively. Later, the Sub-project Offices (SPOs) of the SFDP were converted into Small Farmer Cooperative Limited (SFCLs).
The decade of the 1990s is the landmark in the history of microfinance in Nepal. GBBs were established in the decade to expand outreach to the poorest segment of rural societies. Further, two private sector MFIs – Nirdhan and CSD also started microfinance during the same period.
Towards providing funds to small cooperatives and NGOs for lending to the poor, the government instituted the Rural Self Reliance Fund (RSRF) in 1991under the management of the Nepal Rastra Bank. In the late 1990s, the Nepal Rastra bank in collaboration with the commercial banks, GBBs and few other institutions established a larger wholesaler for microfinance "the Rural Microfinance Development Centre Ltd" in 1998. The government launched the Rural Microfinance Project (RMP) of US$ 20 million with funding support from ADB to back up MFIs with wholesale loan for on lending to the poor in rural areas and to build up their institutional capacity by employing RMDC as the principal implementing agency. At the same time, the
20 | State of Microfinance in Nepal
government promulgated the Financial Intermediaries Act 1998 to facilitate legal entity to the NGOs operating microfinance in the country.
Since the establishment of the Rural Microfinance Development Center Ltd. (RMDC) in 1998 (which started its operations in January 2000), the number of Partner MFIs increased steadily from eight in July 1999 to 60 in July 2008 and to 79 by July 2009. RMDC had disbursed Rs.3, 313.87 million wholesale funds to 79 MFIs and recovered Rs.1, 813.78 million by the mid July, 2009. The number of members had reached 842,205 in July 2008. The number of borrowers also reached 655,536 by July 2008. The cumulative loan disbursement and loan recovery amounts reached Rs. 41,508 million and Rs. 35,061 million respectively in July 2008. The repayment rate stood at 97.17% in July 2008. The members’ savings reached Rs. 2,229 million with the 60 MFIs in operation in July 2008. Saving balance per member also reached Rs. 2,647.
In the beginning of the same decade, the government enacted the Cooperative Act 1992 which has facilitated the establishment of the saving and credit cooperatives (SCCs) in the different parts of the country. In the last part of 1990s, a tremendous increase in the microfinance outreach was noticed in the country due to the creation of institutional infrastructure such as SCCs, GBBs, RSRF and RMDC.
The decade of 2000 has been a decade of a great booster to the microfinance industry in Nepal. A large number of MFIs have emerged with the technical assistance and capacity building support of RMDC. A large number of NGOs have got financial intermediaries license from NRB. Over 50% of them have been operating the Grameen type microcredit programs. A large number of SCCs (about 36) also cropped up as specialized microfinance institutions following Grameen model. These institutions, the microfinance banks and the government owned GBBS (four of them have been recently privatized) have the largest outreach of microfinance (750,000 families). The Sana Kisan Bank Ltd (SKBL) was established in 2001 with major ownership of the government and the Agricultural Development Bank to provide wholesale lending to SFCLs. It has aimed to upgrade and professionalize the operation of SFCLs. Most of the sub-projects of SEDP have been converted into self regulated clients’ owned cooperatives known as SFCLs. These institutions have an outreach of 111494 small farmer families.
The SKBBL as of December 2008 provided wholesale loans to SFCLs amounting to Rs. 3,229 million and collected Rs. 2,978 million in principal and Rs. 556 million in interest amounts. The outstanding amount of SKBBL is Rs. 1.52 billion and the recovery rate is near about 93%13 as of July 2008. The total members covered by 220 SFCLs have reached 139,368 and the loan disbursement of SFCLs reached Rs. 4,224 million and the loan recovery Rs. 2,779 million by July 2008. Thus, altogether there are about 14 million families under the services of the MFIs and other credit programs.
Microfinance in Nepal is broadly divided into two categories, formal and informal. The formal sector comprises of commercial banks, development banks, microfinance development banks, cooperatives operating under the limited banking licenses from NRB, Saving and Credit Cooperatives, SFCLs and FI-NGOs. It is reported that three quarters of microfinance in Nepal comes from informal sector14. Quick delivery of loans, flexibility in loan size and easy access might have attracted the poor towards the informal sector despite higher interest rates. The model-wise progress and achievements of microfinance in Nepal is presented below:
13 Source: Annual Report of SKBBL 2008 14 Source: Microfinance Industry Report, November 2008
Institute of Microfinance (InM)| 21
3.2 Outreach under Different Models
a. Cooperative Model
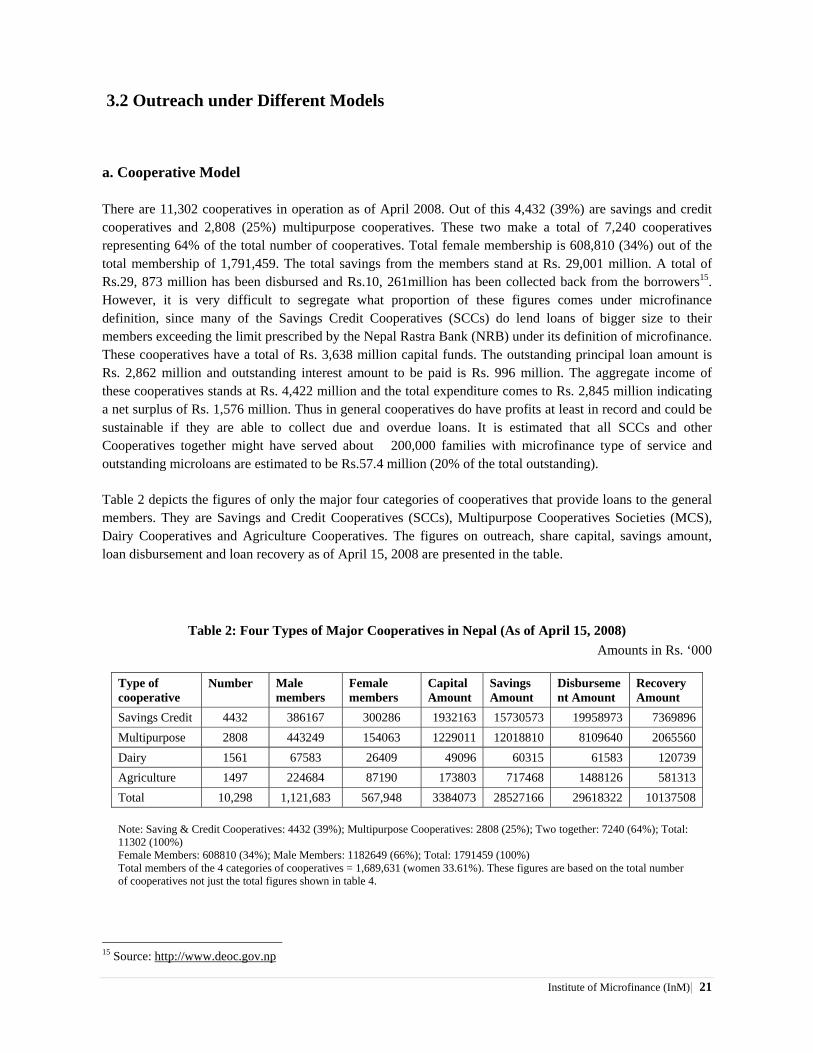
There are 11,302 cooperatives in operation as of April 2008. Out of this 4,432 (39%) are savings and credit cooperatives and 2,808 (25%) multipurpose cooperatives. These two make a total of 7,240 cooperatives representing 64% of the total number of cooperatives. Total female membership is 608,810 (34%) out of the total membership of 1,791,459. The total savings from the members stand at Rs. 29,001 million. A total of Rs.29, 873 million has been disbursed and Rs.10, 261million has been collected back from the borrowers15. However, it is very difficult to segregate what proportion of these figures comes under microfinance definition, since many of the Savings Credit Cooperatives (SCCs) do lend loans of bigger size to their members exceeding the limit prescribed by the Nepal Rastra Bank (NRB) under its definition of microfinance. These cooperatives have a total of Rs. 3,638 million capital funds. The outstanding principal loan amount is Rs. 2,862 million and outstanding interest amount to be paid is Rs. 996 million. The aggregate income of these cooperatives stands at Rs. 4,422 million and the total expenditure comes to Rs. 2,845 million indicating a net surplus of Rs. 1,576 million. Thus in general cooperatives do have profits at least in record and could be sustainable if they are able to collect due and overdue loans. It is estimated that all SCCs and other Cooperatives together might have served about 200,000 families with microfinance type of service and outstanding microloans are estimated to be Rs.57.4 million (20% of the total outstanding).
Table 2 depicts the figures of only the major four categories of cooperatives that provide loans to the general members. They are Savings and Credit Cooperatives (SCCs), Multipurpose Cooperatives Societies (MCS), Dairy Cooperatives and Agriculture Cooperatives. The figures on outreach, share capital, savings amount, loan disbursement and loan recovery as of April 15, 2008 are presented in the table.
Table 2: Four Types of Major Cooperatives in Nepal (As of April 15, 2008) Amounts in Rs. ‘000
Type of cooperative
Number Male members
Female members
Capital Amount
Savings Amount
Disbursement Amount
Recovery Amount
Savings Credit 4432 386167 300286 1932163 15730573 19958973 7369896 Multipurpose 2808 443249 154063 1229011 12018810 8109640 2065560 Dairy 1561 67583 26409 49096 60315 61583 120739 Agriculture 1497 224684 87190 173803 717468 1488126 581313 Total 10,298 1,121,683 567,948 3384073 28527166 29618322 10137508
Note: Saving & Credit Cooperatives: 4432 (39%); Multipurpose Cooperatives: 2808 (25%); Two together: 7240 (64%); Total: 11302 (100%) Female Members: 608810 (34%); Male Members: 1182649 (66%); Total: 1791459 (100%) Total members of the 4 categories of cooperatives = 1,689,631 (women 33.61%). These figures are based on the total number of cooperatives not just the total figures shown in table 4.
15 Source: http://www.deoc.gov.np

22 | State of Microfinance in Nepal
The sources of fund for these cooperatives come mainly from saving deposits from members. RSRF and RMDC also have met part of their loan funds. It is, however, not possible to segregate on lending to cooperatives from each possible source because there is no report and mechanism to this effect. The figures on overdue loans of cooperatives are also not available from the source. With regard to interest rate, the cooperatives pay much higher rate on savings compared to banks and finance companies. They generally pay 7 to 8% interest on savings and 9 to 13% on fixed deposits per annum. They charge 10 to 16% interest per annum on their loans.
The cooperative model is feasible for all regions of Nepal, terai, hills, mountains and valleys. Savings and Credit Cooperative (SCC) can achieve higher efficiency due to its lower operating costs and relatively larger loan sizes.
b. Small Farmers Cooperative Ltd. (SFCL) Model
There are 219 SFCLs plus one NGO working as MFI,, which avail loan funds from Sana Kisan Bikas Bank Limited (SKBBL) – a wholesale lender to SFCLs. The total members covered by 220 SFCLs are 139,368 in 220 VDCs. In total these SFCLs are providing financial services to 111,494 small farmers with 53,038 male (47.57%) and 58456 (52.43%) female members. The cumulative loan disbursement as of April 2009 has reached Rs. 4,702 million (Rs. 1,268 million handed over by ADBN and Rs. 3,434 million newly disbursed loans) and recovered Rs. 2,779 million (Rs. 1,236 million handed over loans and Rs. 2,662 million new loans). The figures on loan outstanding, loan overdue and member savings in July 2008 are reported to be Rs. 1,445 million Rs. 88 million and Rs. 916 million respectively. The overdue rate stands at 6.06%. In December 2008, the overdue amount went up to Rs. 1, 654 million and the overdue rate was recorded at 10.9%. This was due to the announcement in the budget speech by the government to give waiver of loans up to Rs. 30,000. By July 2009, all overdue loans have been replenished by the government and there are no overdue loans left. This step from the government side is not observed as a positive step as it would raise expectations of clients for waivers in the coming years as well, and the push down loans repayments. Besides SFCLs have been facing problem in segregating loans from their own members' savings and SKKBL. The members borrowing from their own savings source are not given waiver and are therefore found unsatisfied and reluctant to repay loans. SKBBL charges 9.5% to the SFCLs and SFCLs charge 13% to their clients. On an average there are 3 staffs working in each SFCL16.
c. Grameen Bank Model
There are five regional levels Grameen Bikas Banks (GBBs) and five Private MF Banks (PMFBs) such as SB Bank, Nirdhan, Chhimek, Deprosc and Nerude whose outreach progress reports have been added up17. The ten microfinance banks (five GBBs plus five PMFBs) have altogether 344 branch offices, of which 53% belongs to PMFBs and 47% to GBBs. These banks together have 484,911 members and 394,481 borrowers. The borrower member ratio is 81%. The GBBs together have covered 1,075 VDCs, while the PMFBs have
16 Data sheet made available by SKBBL 17 Progress Report of Grameen Banks and Replicating Banks as of mid July 2008 Microfinance

Institute of Microfinance (InM)| 23
covered 1,833 VDCs. There is a possibility of VDC duplication among MFIs. Out of the total membership 317,904 (66%) belongs to PMFBs and 167,007 (34%) to five GBBs. This indicates the relatively poor outreach performance of GBBs as compared to the PMFBs. However, the number of branch offices and staffs when compared between the two there is not much difference. The GBBs have a total of 160 branches and 975 staffs, while the PMFBs have 184 branches and 1,136 staffs (see Annex 2). The GBBs have an average 6.1 staff per branch while the PMFBs have 6.2. There is no significant difference.
When compared the number of borrowers among all 10 MFIs (five GBBs plus five PMBFs), the best performing GBB – Purbanchal Grameen Bikas Bank stands 4th in rank with 54,236 (14%) borrowers, SB Bank stands 3rd with 59,332 (15%) borrowers, Chhimek stands 2nd with 65,531 (16.6%) and Nirdhan stands 1st with 68,203 (17.3%) borrowers. Outreach-wise the poorest performing MFI among 10 institutions is Sudur Paschimanchal Grameen Bikas Bank (FW-GBB) with only 8,955 (2.2%) borrowers and Madhya Paschimanchal Grameen Bikas Bank (MW-GBB) with 14,071 (3.56%) of the total borrowers.
In terms of loan transactions, GBBs’ combined loan disbursement (general, other loans and group fund loan) stands at Rs. 18,608 million (55%), loans recovered stands at Rs. 16,558 million (57%) and outstanding loan stands at Rs. 2,050 million (46%). The combined loan disbursement, loans recovered and outstanding in case of PMFBs are Rs. 15,091 million (45%), Rs. 12,682 million (43%) and Rs. 2,409 million (54%), respectively. The comparative figures indicate GBBs performing slightly better both in disbursement and repayment as compared to PMFBs. GBBs contribute 55% of all loans disbursed, while the share of PMFBs stands at 45%. Similarly, GBBs collected 57% of the total loans recovery of Rs. 29,240 million. Thus, GBBs’ combined loan performance is slightly better than PMFBs combined total, while outreach-wise microfinance services of PMFBs seem better than the GBBs combined. There are two reasons for this outcome: Firstly, PMFBs came into operation little late (only 5-6 years after GBBs) and they provide relatively small loans only, and secondly, GBBs after introduction of privatization concept have started providing larger size loans as well as influencing both disbursement and recovery amounts.
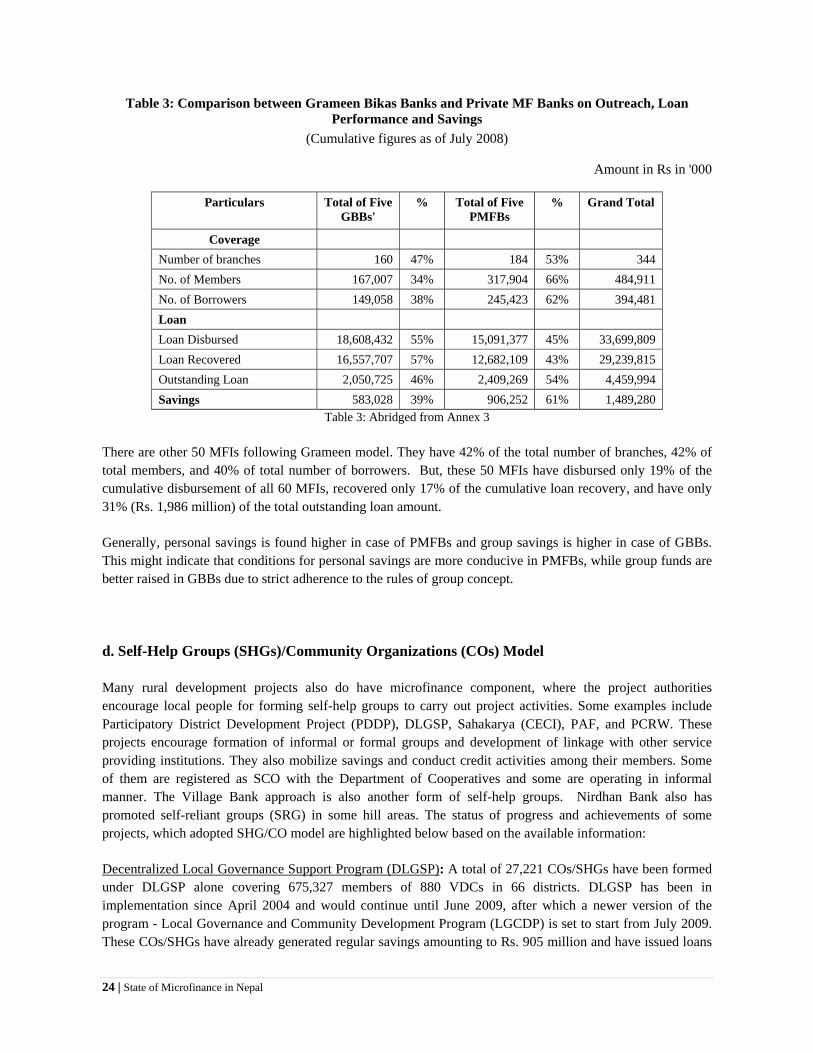
The total loan disbursed by these 10 banks (five GBBs plus five PMFBs) inclusive of general, other loans and group fund loans stands at Rs. 33,699 million and the total loans recovered (repaid) stands at Rs. 29,239 million. The total outstanding loan of these 10 banks is Rs. 4,459 million. Total combined savings of 5 GBBs is Rs. 583 million which is 39% of the grand total savings of 10 banks (Rs. 1,489 million), while the PMFBs contribute 61% in the total share. The comparative figures are given in Table 3 below.
24 | State of Microfinance in Nepal
Table 3: Comparison between Grameen Bikas Banks and Private MF Banks on Outreach, Loan Performance and Savings
(Cumulative figures as of July 2008)
Amount in Rs in '000
Particulars Total of Five GBBs'
% Total of Five PMFBs
% Grand Total
Coverage Number of branches 160 47% 184 53% 344 No. of Members 167,007 34% 317,904 66% 484,911 No. of Borrowers 149,058 38% 245,423 62% 394,481 Loan Loan Disbursed 18,608,432 55% 15,091,377 45% 33,699,809 Loan Recovered 16,557,707 57% 12,682,109 43% 29,239,815 Outstanding Loan 2,050,725 46% 2,409,269 54% 4,459,994 Savings 583,028 39% 906,252 61% 1,489,280
Table 3: Abridged from Annex 3
There are other 50 MFIs following Grameen model. They have 42% of the total number of branches, 42% of total members, and 40% of total number of borrowers. But, these 50 MFIs have disbursed only 19% of the cumulative disbursement of all 60 MFIs, recovered only 17% of the cumulative loan recovery, and have only 31% (Rs. 1,986 million) of the total outstanding loan amount.
Generally, personal savings is found higher in case of PMFBs and group savings is higher in case of GBBs. This might indicate that conditions for personal savings are more conducive in PMFBs, while group funds are better raised in GBBs due to strict adherence to the rules of group concept.
d. Self-Help Groups (SHGs)/Community Organizations (COs) Model
Many rural development projects also do have microfinance component, where the project authorities encourage local people for forming self-help groups to carry out project activities. Some examples include Participatory District Development Project (PDDP), DLGSP, Sahakarya (CECI), PAF, and PCRW. These projects encourage formation of informal or formal groups and development of linkage with other service providing institutions. They also mobilize savings and conduct credit activities among their members. Some of them are registered as SCO with the Department of Cooperatives and some are operating in informal manner. The Village Bank approach is also another form of self-help groups. Nirdhan Bank also has promoted self-reliant groups (SRG) in some hill areas. The status of progress and achievements of some projects, which adopted SHG/CO model are highlighted below based on the available information:
Decentralized Local Governance Support Program (DLGSP): A total of 27,221 COs/SHGs have been formed under DLGSP alone covering 675,327 members of 880 VDCs in 66 districts. DLGSP has been in implementation since April 2004 and would continue until June 2009, after which a newer version of the program - Local Governance and Community Development Program (LGCDP) is set to start from July 2009. These COs/SHGs have already generated regular savings amounting to Rs. 905 million and have issued loans
Institute of Microfinance (InM)| 25
totaling Rs. 1,932 million. Generally, more than 90% of the savings are in circulation among members as loans for various income-generating activities. So far, DLGSP has disbursed Rs. 810 million and recovered Rs. 440 million from the COs members leaving a balance outstanding of Rs. 370 million.
There are 835 staffs involved in the process of implementation of DLGSP activities that go beyond credit activities. The program spends over Rs. 10 million per annum to provide salary and meet other administrative costs. DLGSP is more focused on local development through capacity building of local governance system and local infrastructure development. Capacity development trainings are also provided to the members of COs/SHGs under the Village Development Program. This document highlights only the micro credit part of the program.
Poverty Alleviation Fund (PAF): PAF was created to address the problems of the poor communities. The goal of PAF is to help the poor find their way out of poverty. PAF has a 12-member governing board chaired by the Prime Minister. The government appoints the vice-chairperson (from among the members) and five members. Other 5 members are ex-officio – Secretary, NPC, Chairperson, Association of District Development Committee, Nepal (ADDCN), Chairperson, Association of Village Development Committee, Nepal (AVDCN), Chairperson, Nepal Women Commission, and Chairperson, Nepal Dalit Commission.
PAF has been working through COs, and local NGOs to help improve social and economic status of the poor in the society. It aims at empowering the socially excluded and disadvantaged poor households. It provides them the avenues for changing from the status of "dependents" to "independent" and to "interdependent" in relationship with traditionally dominant elite of the society and thus empowers the poor to become a part of the mainstream of development18.
PAF also provides some seed money and other subsidies to its grassroots members to carry out various other activities – raising a doubt on the sustainability of the local organizations once the support program is discontinued at the termination of the projects funded from various donor organizations/countries.
By the end of July 2008, PAF has covered almost 235,270 poor households in 1,554 /VDCs (857 HH through 242 POs and 697 HH through 7,693 COs) of 45 districts. By July 2008, PAF has invested Rs. 2,982 million in 7,510 COs for income generating activities, and Rs. 555 million in the same number of POs and COs for 1,445 community development infrastructures. Out of the total beneficiaries of 235,270, it has covered 67.6% hardcore poor (who have own production and wage earning sufficient to support livelihood for 3 months), 24.3% medium poor (who have own production and earning sufficient to support livelihood for 6 months), 7.9% poor (who have own production and earning sufficient to support livelihood for 12 months) and 0.2% marginal non-poor (who have own production and earning sufficient to support livelihood for more than 12 months). Gender-wise, it has covered 69% female and 31% male, while ethnicity-wise, 36% Dalit, 29% Janajati, and 35% others19. PAF has maintained 215 field staffs according to PAF report.
Production Credit for Rural Women (PCRW): This program was started in 1982-83 in Dhading20 district with the initial support from UNICEF to provide production credit to women for improving their quality of lives through increased employment opportunities and income. PCRW is a combination of credit, training and community development services. The program continued until December 31, 1997 with the support from IFAD, UNICEF, UNFPA, ADB/MCPW, USAID and HMG/N. The program activities continued with the savings mobilized and with assistance from other donors. The infrastructure of women’s groups, ward level 18 Case Studies PAF 2008 19 PAF In Brief as of 15 July 2008 provided by PAF, CEO, Mr. Jhank Prasad Shrestha 20 Data Base of PCRW of Central Development Region (CDR/Nepal)
26 | State of Microfinance in Nepal
committees and VDC level federations have been continuing the program activities with their savings and other available funds even after the end of the program support.
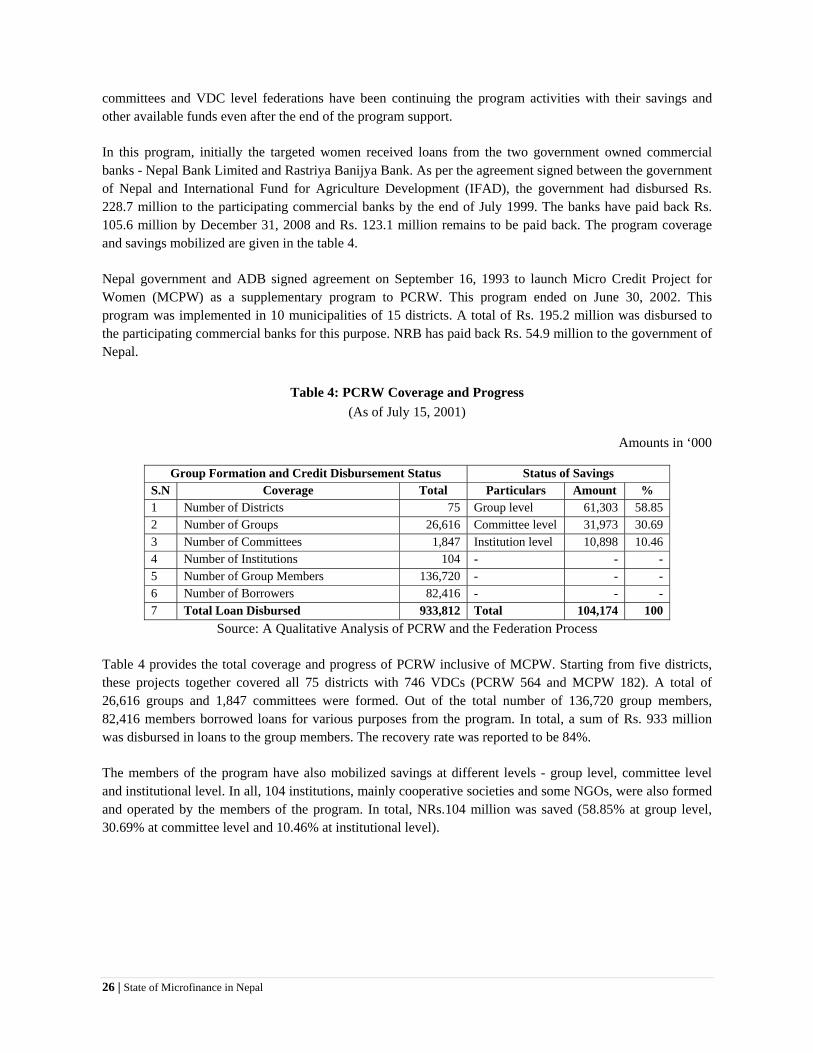
In this program, initially the targeted women received loans from the two government owned commercial banks - Nepal Bank Limited and Rastriya Banijya Bank. As per the agreement signed between the government of Nepal and International Fund for Agriculture Development (IFAD), the government had disbursed Rs. 228.7 million to the participating commercial banks by the end of July 1999. The banks have paid back Rs. 105.6 million by December 31, 2008 and Rs. 123.1 million remains to be paid back. The program coverage and savings mobilized are given in the table 4.
Nepal government and ADB signed agreement on September 16, 1993 to launch Micro Credit Project for Women (MCPW) as a supplementary program to PCRW. This program ended on June 30, 2002. This program was implemented in 10 municipalities of 15 districts. A total of Rs. 195.2 million was disbursed to the participating commercial banks for this purpose. NRB has paid back Rs. 54.9 million to the government of Nepal.
Table 4: PCRW Coverage and Progress (As of July 15, 2001)
Amounts in ‘000
Group Formation and Credit Disbursement Status Status of Savings S.N Coverage Total Particulars Amount % 1 Number of Districts 75 Group level 61,303 58.85 2 Number of Groups 26,616 Committee level 31,973 30.69 3 Number of Committees 1,847 Institution level 10,898 10.46 4 Number of Institutions 104 - - - 5 Number of Group Members 136,720 - - - 6 Number of Borrowers 82,416 - - - 7 Total Loan Disbursed 933,812 Total 104,174 100
Source: A Qualitative Analysis of PCRW and the Federation Process
Table 4 provides the total coverage and progress of PCRW inclusive of MCPW. Starting from five districts, these projects together covered all 75 districts with 746 VDCs (PCRW 564 and MCPW 182). A total of 26,616 groups and 1,847 committees were formed. Out of the total number of 136,720 group members, 82,416 members borrowed loans for various purposes from the program. In total, a sum of Rs. 933 million was disbursed in loans to the group members. The recovery rate was reported to be 84%.
The members of the program have also mobilized savings at different levels - group level, committee level and institutional level. In all, 104 institutions, mainly cooperative societies and some NGOs, were also formed and operated by the members of the program. In total, NRs.104 million was saved (58.85% at group level, 30.69% at committee level and 10.46% at institutional level).

Institute of Microfinance (InM)| 27
Chapter IV: Trend Analysis of Major Microfinance Institutions
4.1 Performance of Sixty Major Microfinance Institutions
The study has assembled the operational data of sixty major MFIs for a period between 1999 and 2008 based on the availability of information. The analysis of trend on different aspects of their performance is highlighted below21.
a. Outreach Progress
Since the establishment of the Rural Microfinance Development Center Ltd. (RMDC) in 1998 (which started its operations in 2000), the number of MFIs has increased steadily from eight in July 1999 to 60 in July 2008. The number of branches has also reached 590 in ten years’ time from a level of 195 branches. The number of members which was 151,678 in July 1999 reached 842,205 in July 2008. The number of borrowers has also steadily increased to 655,536. The ratio of borrowers to members hovered around 78-89% (see Table 5). The increment in key parameters of the outreach, members and borrowers, has been depicted in Chart No. 1 below.
Chart 1: Trend of MFIs’ Members and Borrowers
21 Time series data for ten years is generated in RMDC. It does not include other MFIs who do not provide reports and data to RMDC. Progress of SFLC and other SHGs and MFIs are not included.

28 | State of Microfinance in Nepal
b. Loan performance
The cumulative loan disbursement and loan recovery amounts were Rs. 2,880 million and Rs. 2,204 million respectively in July 1999, which reached Rs. 41,508 million and Rs. 35,061 million respectively in July 2008. The repayment rate ranged between 94.70%, the lowest in 2004 and 98.19%, the highest in 2000. In 2008, the repayment rate stood at 97.17%. The loan outstanding was Rs. 676 million in 1999 and has reached Rs. 6,446 million in 2008 - an increase by 9.5 fold. The average outstanding loan per member was recorded to be Rs. 5,004 in July 1999 and Rs. 9,834 in July 2008. (see Table 5 on performance indicators). The trend on loan disbursed, recovered and outstanding loan trend of MFIs is depicted in Chart No. 2 below.
Chart 2: Trend of Loan Disbursed, Recovered and Outstanding Amounts Amounts in Rs. ‘000
c. Loan Overdue
Loan overdue out of the total outstanding was Rs. 14 million in 1999 while it reached Rs. 265 million in 2008. The arrear rate was lowest 2.22% in 1999 and the highest 7.45% in 2004 (See Table 5). The trend of increase in overdue is depicted in Chart No. 3 below.
Institute of Microfinance (InM)| 29
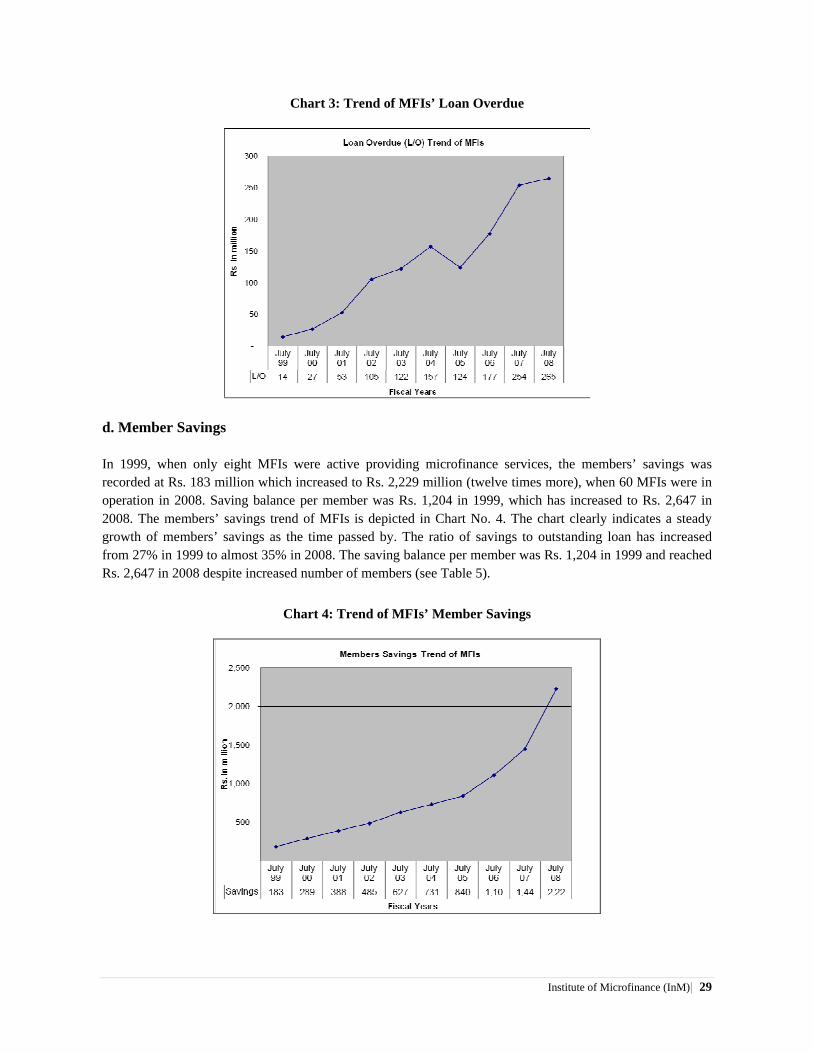
Chart 3: Trend of MFIs’ Loan Overdue
d. Member Savings
In 1999, when only eight MFIs were active providing microfinance services, the members’ savings was recorded at Rs. 183 million which increased to Rs. 2,229 million (twelve times more), when 60 MFIs were in operation in 2008. Saving balance per member was Rs. 1,204 in 1999, which has increased to Rs. 2,647 in 2008. The members’ savings trend of MFIs is depicted in Chart No. 4. The chart clearly indicates a steady growth of members’ savings as the time passed by. The ratio of savings to outstanding loan has increased from 27% in 1999 to almost 35% in 2008. The saving balance per member was Rs. 1,204 in 1999 and reached Rs. 2,647 in 2008 despite increased number of members (see Table 5).
Chart 4: Trend of MFIs’ Member Savings
30 | State of Microfinance in Nepal
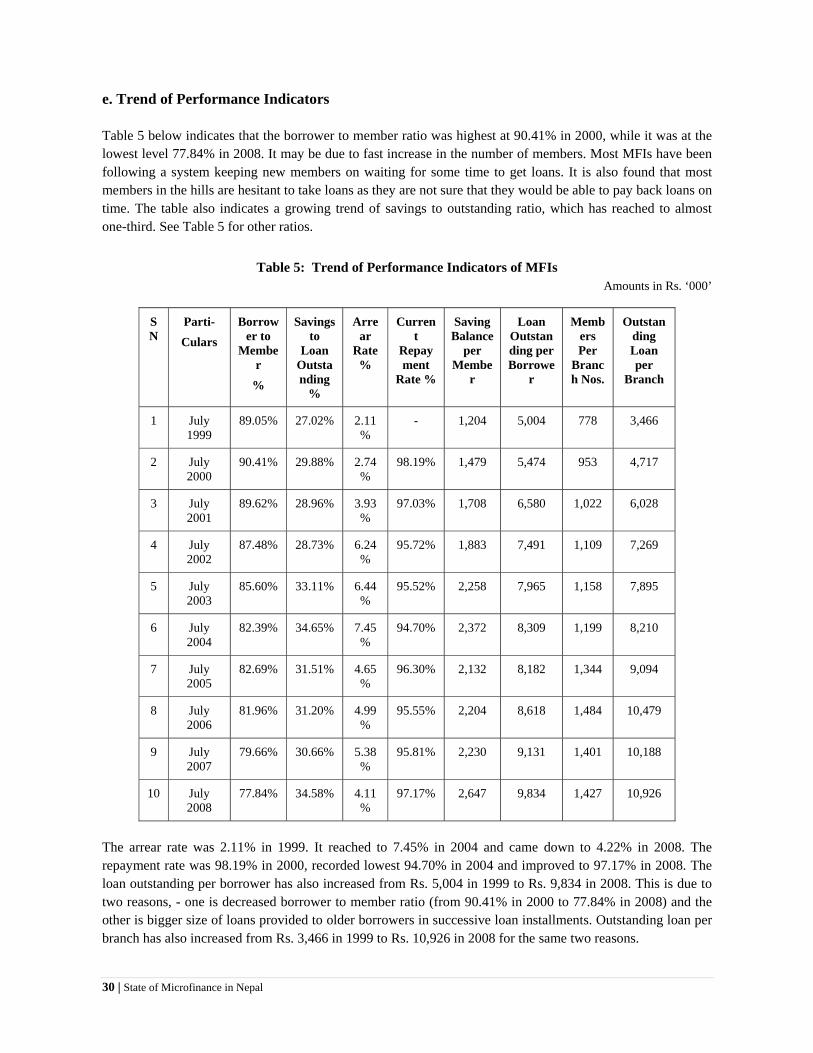
e. Trend of Performance Indicators
Table 5 below indicates that the borrower to member ratio was highest at 90.41% in 2000, while it was at the lowest level 77.84% in 2008. It may be due to fast increase in the number of members. Most MFIs have been following a system keeping new members on waiting for some time to get loans. It is also found that most members in the hills are hesitant to take loans as they are not sure that they would be able to pay back loans on time. The table also indicates a growing trend of savings to outstanding ratio, which has reached to almost one-third. See Table 5 for other ratios.
Table 5: Trend of Performance Indicators of MFIs Amounts in Rs. ‘000’
SN
Parti- Culars
Borrower to
Member
%
Savings to
Loan Outstanding
%
Arrear
Rate %
Current
Repayment
Rate %
Saving Balance
per Membe
r
Loan Outstanding per Borrowe
r
Members Per
Branch Nos.
Outstanding Loan per
Branch
1 July 1999
89.05% 27.02% 2.11%
- 1,204 5,004 778 3,466
2 July 2000
90.41% 29.88% 2.74%
98.19% 1,479 5,474 953 4,717
3 July 2001
89.62% 28.96% 3.93%
97.03% 1,708 6,580 1,022 6,028
4 July 2002
87.48% 28.73% 6.24%
95.72% 1,883 7,491 1,109 7,269
5 July 2003
85.60% 33.11% 6.44%
95.52% 2,258 7,965 1,158 7,895
6 July 2004
82.39% 34.65% 7.45%
94.70% 2,372 8,309 1,199 8,210
7 July 2005
82.69% 31.51% 4.65%
96.30% 2,132 8,182 1,344 9,094
8 July 2006
81.96% 31.20% 4.99%
95.55% 2,204 8,618 1,484 10,479
9 July 2007
79.66% 30.66% 5.38%
95.81% 2,230 9,131 1,401 10,188
10 July 2008
77.84% 34.58% 4.11%
97.17% 2,647 9,834 1,427 10,926
The arrear rate was 2.11% in 1999. It reached to 7.45% in 2004 and came down to 4.22% in 2008. The repayment rate was 98.19% in 2000, recorded lowest 94.70% in 2004 and improved to 97.17% in 2008. The loan outstanding per borrower has also increased from Rs. 5,004 in 1999 to Rs. 9,834 in 2008. This is due to two reasons, - one is decreased borrower to member ratio (from 90.41% in 2000 to 77.84% in 2008) and the other is bigger size of loans provided to older borrowers in successive loan installments. Outstanding loan per branch has also increased from Rs. 3,466 in 1999 to Rs. 10,926 in 2008 for the same two reasons.

Institute of Microfinance (InM)| 31
4.2 Comparative Performance of the Four Categories of MFIs
Based on available information, sixty MFIs are classified into four categories, namely Grameen Bikas Banks (GBBs) –‘A’ category, PMFBs – ‘B’ category, FI-NGOs – ‘C’ category and Cooperatives – ‘D’ category. These categories of MFIs are compared with respect to (1) number of borrowers, (2) loan disbursed, (3) loan recovered, (4) loan overdue, and (5) members’ savings. Categories, A, B and C started operations well before 1999. The Cooperatives with the support from RMDC and RSRF fund together with other fund sources started their microfinance services from 2002 only.
a. Number of borrowers
In 1999, GBBs had 95,393 borrowers, while those of PMFBs, and FI-NGOs had 15,382 and 24,293 borrowers, respectively. In 2007, the latter two categories (B & C) surpassed category ‘A’ with respect to the number of borrowers. While the number of borrowers remained 155,850 for GBBs in that year, the figure for PMFBs increased to 162,948 and for FI-NGOs to 161,413.
Thereafter, the number of borrowers under GBBs started sliding downward; PMFBs continued a climb up reaching 245,546 borrowers in 2008 as against 149,058 for GBBs. The number of borrowers under FI-NGOs has also reached 192,153 and the number of borrowers under cooperatives reached 68,779 in 2008. The steep uprising curve of PMFBs indicates that they have been performing better in the outreach. Chart No. 5 and Table 6 illustrate the phenomenon of changes in number of borrowers for each category of MFIs.
Chart 5: Comparison of Number of Borrowers among Four Types of MFIs

32 | State of Microfinance in Nepal
Table 6: Trend of Number of Borrowers
b. Loan disbursement
The cumulative disbursement figures for GBBs and PMFBs increased by 2 fold (from Rs. 2,379 million to Rs. 7,115 million) and 9 fold (from Rs. 229 million to Rs. 2,222 million) respectively from 1999 to 2002. Cooperatives just started providing microfinance services with Rs. 2 million in 2002. However, the disbursement figure for FI-NGOs sharply decreased in this period from Rs. 272 million in 1999 to Rs. 59 million (4.9 fold decrease) in 2002. This was due to the transfer of loans to the newly initiated PMFBs of their own. From 2002 to 2006, growths on loans disbursed by all four categories of MFIs are observed to be moderate, but from 2007 PMFBs started a steep climb, while other three categories remained moderate in growth. The final figures of loans disbursement for the four categories of MFIs in 2008 are Rs. 18,608 million, Rs. 15,093 million, Rs. 5,732 million and Rs. 2,075 million respectively for GBBs, PMFBs, FI-NGOs, and Cooperatives. The loan disbursement comparison is depicted in Chart No. 6 and Table 7 given below:
Chart 6: Trend of Loan Disbursement Amounts in ‘000
MFIs Numbers of borrowers in 10 yrs Jul-99 Jul-00 Jul-01 Jul-02 Jul-03 Jul-04 Jul-05 Jul-06 Jul-07 Jul-08
GBBs 95,393 119,732 137,495 149,549 153,453 146,277 152,435 157,990 155,850 149,058 PMFBs 15,382 26,618 30,559 66,809 67,841 78,040 110,833 146,402 162,948 245,546 FINGOs 24,293 30,285 35,317 8,186 15,275 26,886 55,019 91,785 161,413 192,153 Coops - - - 579 1,327 2,719 7,387 16,014 37,496 68,779

Institute of Microfinance (InM)| 33
Table 7: Trend of Loan Disbursement MFIs Jul-99 Jul-00 Jul-01 Jul-02 Jul-03
GBBs 2,379,595 3,668,299 5,137,276 7,115,481 8,976,425 PMFBs 228,962 443,925 737,904 2,221,728 3,078,463 FINGOs 271,862 496,523 820,277 59,139 148,669 Coops - - - 2,714 9,474 MFIs Jul-04 Jul-05 Jul-06 Jul-07 Jul-08
GBBs 10,839,590 12,578,212 14,215,537 16,447,065 18,608,432 PMFBs 4,026,638 5,405,361 7,398,331 9,847,664 15,093,077 FINGOs 344,030 944,432 1,846,713 3,733,168 5,732,173 Coops 27,157 85,339 250,023 674,206 2,074,822
c. Loan recovery
The figures on cumulative loan recovery for all the four categories of MFIs follow similar pattern as of disbursement. The curves depicting the growth of recovery of loans of the four categories of MFIs from 1999 to 2002 and then to 2008 are very clear. The recovery amounts for these four categories of MFIs stood at Rs. 16,558 million, Rs. 12,683 million Rs. 4,281 million and Rs. 1,540 million respectively for GBBs, PMFBs, FI-NGOs and Cooperatives in 2008. Chart 7 and Table 8 depicting loan recovery comparison is presented below.
Chart 7: Trend of Loan Recovery

34 | State of Microfinance in Nepal
Table 8: Trend of Loan Recovery Amounts in Rs. ‘000
MFIs Jul-99 Jul-00 Jul-01 Jul-02 Jul-03 GBBs 1,840,609 2,944,585 4,159,754 5,904,699 7,655,156 PMFBs 162,987 323,575 563,045 1,772,239 2,563,915 FINGOs 20,993 373,645 634,459 34,397 93,542 Coops - - - 1,400 5,552 MFIs Jul-04 Jul-05 Jul-06 Jul-07 Jul-08
GBBs 9,481,182 11,112,195 12,561,285 14,595,252 16,557,707 PMFBs 3,400,007 4,522,340 6,133,716 8,318,979 12,683,006 FINGOs 229,910 661,481 1,307,401 2,632,363 4,281,283 Coops 16,460 52,708 155,790 428,238 1,539,972
d. Outstanding Loans
Outstanding loan amount of GBBs together was always higher than those of PMFBs until 2007 but this scenario had changed in 2008. In this year outstanding amount of GBBs was recorded Rs. 2,051 million and that of PMFBs Rs. 2,410 million. This indicates that PMFBs progress in disbursement of loans has surpassed that of GBBs. FI-NGOs have increased outstanding amount from Rs. 71 million in 1999 to Rs. 2,410 million in 2008, and Cooperatives from Rs. 1 million in 2002 to Rs. 534 million in 2008. The quality of the outstanding loans is shown by the comparison of overdue loans and overdue rates of MFIs in the next section. The comparison of outstanding amounts of the four categories of MFIs is presented in Chart No. 8 and Table 9 below.
Chart 8: Trend of Loan Outstanding

Institute of Microfinance (InM)| 35
Table 9: Trend of Loan Outstanding
Amounts in ‘000
Trend of Loan Outstanding MFIs Jul-99 Jul-00 Jul-01 Jul-02 Jul-03 Jul-04 Jul-05 Jul-06 Jul-07 Jul-08
GBBs 538,986
723,714
977,522
1,210,782
1,321,269
1,358,408
1,466,018
1,654,252
1,851,813
2,050,725
PMFBs 65,975
120,350
174,859 449,489 514,548 626,631 883,021
1,264,615
1,528,685
2,410,071
FINGOs 70,869
122,878
185,818 24,742 55,128 114,121 282,950 539,311
1,100,805
1,450,890
Coops - - - 1,314 3,922 10,697 32,631 94,234 245,968 534,850
e. Loan Overdue
The overdue amount for GBBs nearly doubled each year from 1999 till 2002 and a steady growth till 2004 at Rs. 135 million which reduced to Rs. 94 million in 2005. Again, the curve reached the peak at Rs. 201 million in 2007 and a gentle decline to Rs. 191 million in 2008. As compared to GBBs, increase in overdue amounts and its slope (rate) are found gentle and much less in case of other PMFBs. It started with Rs. 464 thousand in 1999 and has reached Rs. 58 million in 2008. For FI-NGOs, the overdue amount was Rs. 261 thousand in 1999 and Rs. 10 million in 2008. The overdue amounts started appearing in cooperatives only from 2005 with Rs. 22 thousand to Rs. 6 million in 2008. The loan overdue is presented in Chart No. 9 and Table 10 below. It indicates that GBBs portfolio quality is deteriorating faster.
Chart 9: Trend of Overdue Loans
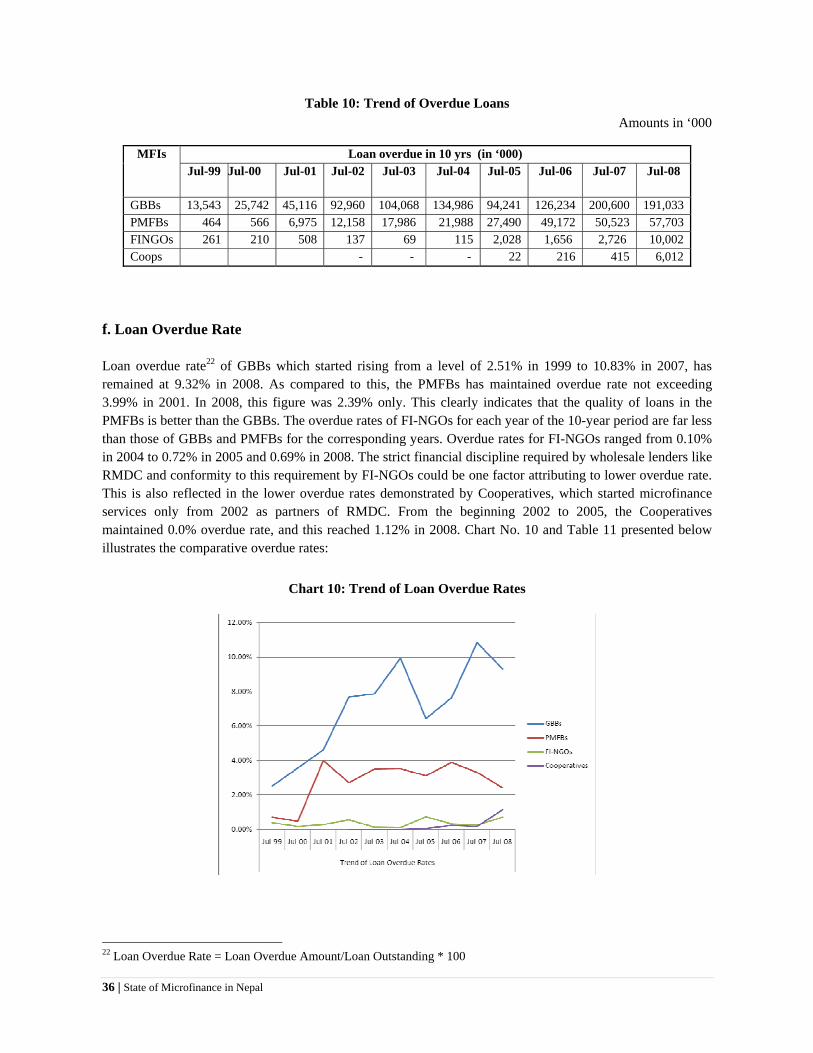
36 | State of Microfinance in Nepal
Table 10: Trend of Overdue Loans Amounts in ‘000
MFIs
Loan overdue in 10 yrs (in ‘000) Jul-99 Jul-00 Jul-01 Jul-02 Jul-03 Jul-04 Jul-05 Jul-06 Jul-07 Jul-08
GBBs 13,543 25,742 45,116 92,960 104,068 134,986 94,241 126,234 200,600 191,033 PMFBs 464 566 6,975 12,158 17,986 21,988 27,490 49,172 50,523 57,703 FINGOs 261 210 508 137 69 115 2,028 1,656 2,726 10,002 Coops - - - 22 216 415 6,012
f. Loan Overdue Rate
Loan overdue rate22 of GBBs which started rising from a level of 2.51% in 1999 to 10.83% in 2007, has remained at 9.32% in 2008. As compared to this, the PMFBs has maintained overdue rate not exceeding 3.99% in 2001. In 2008, this figure was 2.39% only. This clearly indicates that the quality of loans in the PMFBs is better than the GBBs. The overdue rates of FI-NGOs for each year of the 10-year period are far less than those of GBBs and PMFBs for the corresponding years. Overdue rates for FI-NGOs ranged from 0.10% in 2004 to 0.72% in 2005 and 0.69% in 2008. The strict financial discipline required by wholesale lenders like RMDC and conformity to this requirement by FI-NGOs could be one factor attributing to lower overdue rate. This is also reflected in the lower overdue rates demonstrated by Cooperatives, which started microfinance services only from 2002 as partners of RMDC. From the beginning 2002 to 2005, the Cooperatives maintained 0.0% overdue rate, and this reached 1.12% in 2008. Chart No. 10 and Table 11 presented below illustrates the comparative overdue rates:
Chart 10: Trend of Loan Overdue Rates
22 Loan Overdue Rate = Loan Overdue Amount/Loan Outstanding * 100

Institute of Microfinance (InM)| 37
Table 11: Trend of Loan Overdue Rates MFIs Loan Overdue Rate in 10 yrs (%)
Jul-99 Jul-00 Jul-01 Jul-02 Jul-03 Jul-04 Jul-05 Jul-06 Jul-07 Jul-08
GBBs 2.51% 3.56% 4.62% 7.68% 7.88% 9.94% 6.43% 7.63% 10.83% 9.32%
PMFBs 0.70% 0.47% 3.99% 2.70% 3.50% 3.51% 3.11% 3.89% 3.31% 2.39%
FINGOs 0.37% 0.17% 0.27% 0.55% 0.13% 0.10% 0.72% 0.31% 0.25% 0.69%
Coops - - - 0.00% 0.00% 0.00% 0.07% 0.23% 0.17% 1.12%
g. Members’ Savings
Members’ Savings of GBBs is higher than all other categories of MFIs from 1999 till 2006. This savings was steadily increasing in case of PMFBs and closed the gap in 2006 with GBBs savings at Rs. 515 million and PMFBs at Rs. 418 million and in 2008, the PMFBs surpassed GBBs savings with wide margin. The members’ savings stood at Rs. 583 million for GBBs and Rs. 907 million for PMFBs, Rs.523 million for FI-NGOs Rs. 215 million for Cooperatives in 2008. All the curves in Chart No. 11 and data in Table 12 indicate that GBBs performance remained highest till 2006 which has been overtaken by PMFBs and the FI-NGOs thereafter. Cooperatives also have been picking up gradually since 2002.
Chart 11: Trend of Member Savings

38 | State of Microfinance in Nepal
Table 12: Trend of Member Savings Amounts in ‘000
MFIs Member Savings in 10 yrs Jul-99 Jul-00 Jul-01 Jul-02 Jul-03 Jul-04 Jul-05 Jul-06 Jul-07 Jul-08
GBBs 44,196 213,042 279,444 327,390 438,207 473,674 439,870 477,823 514,847 583,028 PMFBs 16,233 36,015 52,925 149,432 171,409 215,660 295,588 418,064 529,478 907,221 FINGOs 22,208 39,877 55,206 7,164 15,543 36,519 91,461 181,227 331,355 523,480 Coops - - - 573 2,245 5,220 12,818 31,123 73,494 215,513
4.3 Top Twenty MFIs
Based on available outreach information of MFIs, a list of top twenty MFIs is drawn and presented below:
List of Top 20 FMIs in Nepal Based on Number of Borrowers (As of mid-July 2008)
S.N Name of MFIs No. of Borrowers
No. of members S.N Name of MFIs No. of
Borrowers No. of
members 1 Nirdhan 68,203 96,732 11 CSD, Kathmandu 24,501 36,899 2 Chhimek 65,531 78,339 12 Sahara Nepal 24,217 30,355 3 SB Bank 59,332 79,884 13 DEPROSC Dev. Bank 23,568 30,829 4 E-GBB 54,236 56,134 14 MW-GBB 14,071 20,296 5 DEPROSC Nepal 38,214 43,972 15 MCDC Saptari 12,364 13,015 6 C- GBB 36,648 39,361 16 NESDO, Parbat 9,329 12,445 7 W-GBB 35,148 39,051 17 Women Coop. Society 9,168 13,477 8 FORWARD Sunsari 32,008 41,736 18 FW-GBB 8,955 12,165 9 NLBBL (Nerude) 28,789 32,120 19 Karnali SCO, Jhapa 7,197 8,677 10 Jeevan Bikas Samaj 27,162 32,568 20 CWDEC Saptari 7,021 9,397
The ranking of MFIs was based on the number of clients served as of mid-July 2008. Based on the available data on borrowers served, the top 20 MFIs cover 89.4% of the total borrowers (655,536) of sixty major MFIs.
Nirdhan Utthan Bank Ltd has been listed first both in terms of borrowers and members followed by the Chhimek Bikas Bank Ltd and Swabalamban Bikas Bank Ltd as second and third. They together have accounted 193,066 of borrowers of the top twenty MFIs. The GBBs which used to be the pioneer with the very sound equity capital in the beginning have gradually slided down. The FINGOs such as FORWARD and Jeevan Bikas Samaj, CSD and Cooperatives such as Sahara Nepal also have been picking up their speed fast. The top ranked MFI has 96732 members and 68203 borrowers and the bottom one in the top twenty lists CWDEC, Saptari has 9397 members and 9021 borrowers.
The total number of borrowers covered by the top twenty MFIs is 585,732, which is 89.4% of the total borrowers of sixty MFIs. The GBBs have covered 25% of the total borrowers of top twenty MFIs, while the share of the PMFBs is 42%, the FI-NGOs 26% and the Cooperatives 7%.
The top twenty MFIs accounted for 96% of the total disbursement. 96% of the total recovery, 93% of the outstanding loans and 99% overdue loan of the sixty major MFIs (as of July 2008). However, the overdue rates for GBBs seem much higher than other MFIs. The average overdue rate of GBBs is recorded 9.3%, PMFBs 2.4%, for FI-NGOs 0.2% and Cooperatives 1.3%. Among GBBs, the FW-GBB toppled all other MFIs with over 26.7% overdue rate. Out of the total overdue amount of Rs. 265 million, of the top twenty MFIs, the

Institute of Microfinance (InM)| 39
GBBs’ shared about 73%, PMFBs 22%, FI-NGOs’ 3% and Cooperatives’ 2%. The GBBs’ share of borrowers is 25% of the total of the top twenty MFIs, while their share of overdue loans is 72%. This strongly indicates a need for improvements in GBBs’ operations and management (see Table 13).
Table 13: Category-wise Status of Outreach, Loan Performance and Members Savings of Top Twenty MFIs
Amounts in Rs. “000”
SN Categories of MFI No. of Borrowers
Loan disbursed
Loan Outstanding
Loan recovered
Overdue Loan
Member Savings
Overdue rate
GBBs 1 E-GBB, Biratnagar 54,236 7,144,259 799,232 6,345,027 22,359 189,199 2.8% 2 C-GBB, Janakpur 36,648 3,566,983 371,777 3,195,206 38,671 132,869 10.4% 3 W-GBB, Butwal 35,148 4,905,166 506,259 4,398,907 58,712 127,583 11.6% 4 MW-GBB, Nepalgunj 14,071 1,700,514 220,420 1,480,094 30,419 91,563 13.8% 5 FW-GBB, Dhangadi 8,955 1,291,509 153,036 1,138,473 40,873 41,813 26.7% Total (A) 149,058 18,608,432 2,050,725 16,557,707 191,033 583,028 9.3% PMFBs 6 NUBL, Bhairahawa 68,203 5,271,413 835,963 4,435,450 30,518 245,020 3.7% 7 CBBL, Hetauda 65,531 2,812,456 564,749 2,247,707 3,056 263,032 0.5% 8 SLBL, Janakpur 59,332 4,561,143 482,780 4,078,363 16,099 256,202 3.3% 9 NLBBL, Biratnagar 28,789 977,220 192,167 785,053 413 68,124 0.2% 10 DDBL, Chitwan 23,568 1,469,144 333,610 1,135,534 7,553 73,874 2.3% Total (B) 245,423 15,091,376 2,409,269 12,682,107 57,639 906,252 2.4% FINGOs
11 DEPROSC Nepal, KTM
38,214 1,576,959 399,661 1,177,297 1,087 98,849 0.3%
12 FORWARD, Sunsari 32,008 830,521 235,851 594,670 897 73,314 0.4% 13 JBS, Morang 27,162 592,063 178,571 413,492 - 61,486 0.0% 14 CSD, Kathmandu 24,571 1,049,746 193,457 856,289 614 108,378 0.3% 15 MCDC, Saptari 12,364 259,800 64,871 194,928 2,458 20,393 3.8% 16 NESDO, Parbat 9,329 180,997 60,866 120,131 84 23,734 0.1%
17 CWDEC, Saptari 7,021 224,816 42,989 181,827 3,599 18,768 8.4%
Total (C) 150,669 4,714,902 1,176,266 3,538,634 8,739 404,922 0.2% Cooperatives 18 Sahara Nepal SCO,
Jhapa 24,217 650,985 193,694 457,291 - 63,043 0.0%
19 WCSL, Kathamndu 9,168 547,434 87,022 460,413 4,377 49,404 5.0% 20 Karnali SCO, Jhapa 7,197 158,299 50,031 108,268 - 16,220 0.0% Total (D) 40,582 1,356,718 330,747 1,025,972 4,377 128,667 1.3% Top 20 MFIs’ Total (A+B+C+D) 585,732 39,771,429 5,967,007 33,804,422 261,789 2,022,870 4.4% Grand Total of 60 MFIs 655,536 41,508,504 6,446,536 35,061,968 264,750 2,229,241 4.1% % coverage of top 20 MFIs 89.4% 95.8% 92.6% 96.4% 98.9% 90.7% -

40 | State of Microfinance in Nepal
The figures in the above table also suggest that GBBs in general and FW-GBB in particular needs to pay serious attention to loan recovery and making quality loans to the targeted clients only. The late comers PMFBs have also topped the GBBs in terms of savings mobilization from the members. Out of the total members’ savings of Rs. 2,229 million the PMFBs share is 40.6%, while that of GBBs’ is 26% only. This indicates that PMFBs position is much sounder than that of GBBs.
The top 20 MFIs are also facing problems of overlapping clients as they all are more concentrated in densely populated areas. Enrollment of clients in more than one MFI has been a very common practice in many areas. This factor has now started affecting outreach, disbursement, repayment, overdue and outstanding amounts of all concerned MFIs. More new MFIs are coming into the market and looking for rapid expansion of their lending activities without proper screening of clients. The MFIs are more profit oriented now than before. In the short-run, the income may seem higher than their expenses, and may help them attain operational self sufficiency (OSS) and financial self sufficiency (FSS). However in the long run, the clients go out of capacity, get over indebted, lose financial discipline and cause repayment default.
The detailed comparison of top 20 MFIs with respect to outreach, loan performance and member savings is provided in Table 13. It shows that Nirdhan has the highest number of branches (53), the highest number of members (96,734) and the highest number of borrowers (68,203). The SBBL, which stands 3rd in number of borrowers (59,332), has the highest number of dropped out members (55,829). WGBB, DEPROSC Bank, MWGBB and FWGBB have shown no dropped out members. However, it cannot be true. By nature, every MFI does have drop out in their members. The cumulative loan disbursement is highest (Rs. 7,144.26 million) in case of EGBB and is lowest (Rs. 158.30 million) in case of Karnali SCO, Jhapa. With regard to the loan outstanding, the highest amount (Rs. 835.96 million) is observed in case of Nirdhan and the lowest amount (Rs. 42.99 million) in case of CWDEC – the last in the list. Loan recovery (cumulative) is found highest (Rs. 6,345.03 million) in case of EGBB and the lowest (Rs. 108.27 million) in case of CWDEC. Similarly, the highest member savings amount (Rs. 263.03 million) is observed in case of Chhimek Bikas Bank Ltd (CBBL) and the lowest amount (Rs. 16.22 million) in case of Karnali SCO, Jhapa. The overdue rate is found highest (26.7%) in FWGBB and lowest (0.0%) in Jeevan Bikas Samaj (JBS), Sahara Nepal SCO, and Karnali SCO, Jhapa. The double digit overdue rates are seen in CGBB (10.4%), WGBB (11.6%), MWGBB (13.8%), and FWGBB (26.7%).
4.4 Financial Performance and Sustainability
Microfinance institutions have emerged in large numbers in Nepal in the past two decades. But the question of their sustainability is looming in the different corners of the financial sector. In the past, the government had initiated some microfinance projects with community development services such as SFDP, PCRW, MCPW, etc. These programs are either restructured such as formation of SFCL in case of SFDP and promoted to local cooperatives in case of PCRW or gradually died down after the termination of the concerned projects. Unlike the above-mentioned types of projects, MFIs have started with the key objective to provide microfinance services to the targeted poor in a sustainable manner without subsidy or grant supports fully relying on interest income.
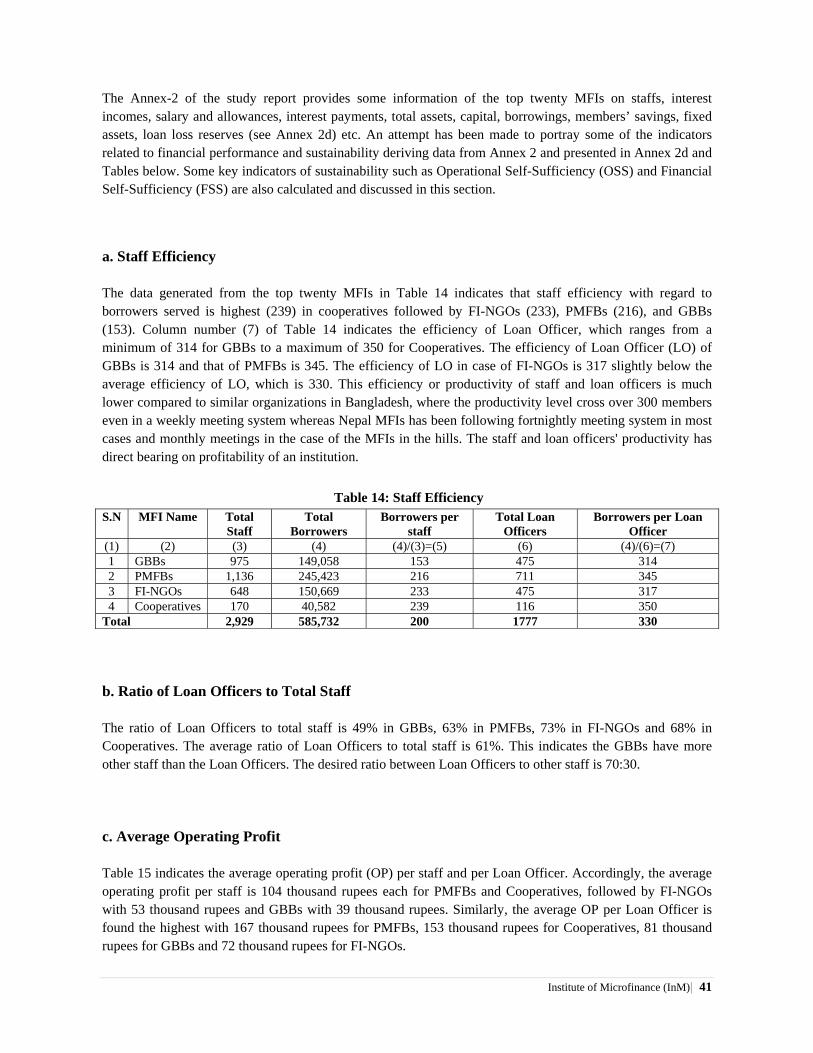
Institute of Microfinance (InM)| 41
The Annex-2 of the study report provides some information of the top twenty MFIs on staffs, interest incomes, salary and allowances, interest payments, total assets, capital, borrowings, members’ savings, fixed assets, loan loss reserves (see Annex 2d) etc. An attempt has been made to portray some of the indicators related to financial performance and sustainability deriving data from Annex 2 and presented in Annex 2d and Tables below. Some key indicators of sustainability such as Operational Self-Sufficiency (OSS) and Financial Self-Sufficiency (FSS) are also calculated and discussed in this section.
a. Staff Efficiency
The data generated from the top twenty MFIs in Table 14 indicates that staff efficiency with regard to borrowers served is highest (239) in cooperatives followed by FI-NGOs (233), PMFBs (216), and GBBs (153). Column number (7) of Table 14 indicates the efficiency of Loan Officer, which ranges from a minimum of 314 for GBBs to a maximum of 350 for Cooperatives. The efficiency of Loan Officer (LO) of GBBs is 314 and that of PMFBs is 345. The efficiency of LO in case of FI-NGOs is 317 slightly below the average efficiency of LO, which is 330. This efficiency or productivity of staff and loan officers is much lower compared to similar organizations in Bangladesh, where the productivity level cross over 300 members even in a weekly meeting system whereas Nepal MFIs has been following fortnightly meeting system in most cases and monthly meetings in the case of the MFIs in the hills. The staff and loan officers' productivity has direct bearing on profitability of an institution.
Table 14: Staff Efficiency S.N MFI Name Total
Staff Total
Borrowers Borrowers per
staff Total Loan
Officers Borrowers per Loan
Officer (1) (2) (3) (4) (4)/(3)=(5) (6) (4)/(6)=(7) 1 GBBs 975 149,058 153 475 314 2 PMFBs 1,136 245,423 216 711 345 3 FI-NGOs 648 150,669 233 475 317 4 Cooperatives 170 40,582 239 116 350 Total 2,929 585,732 200 1777 330
b. Ratio of Loan Officers to Total Staff
The ratio of Loan Officers to total staff is 49% in GBBs, 63% in PMFBs, 73% in FI-NGOs and 68% in Cooperatives. The average ratio of Loan Officers to total staff is 61%. This indicates the GBBs have more other staff than the Loan Officers. The desired ratio between Loan Officers to other staff is 70:30.
c. Average Operating Profit
Table 15 indicates the average operating profit (OP) per staff and per Loan Officer. Accordingly, the average operating profit per staff is 104 thousand rupees each for PMFBs and Cooperatives, followed by FI-NGOs with 53 thousand rupees and GBBs with 39 thousand rupees. Similarly, the average OP per Loan Officer is found the highest with 167 thousand rupees for PMFBs, 153 thousand rupees for Cooperatives, 81 thousand rupees for GBBs and 72 thousand rupees for FI-NGOs.
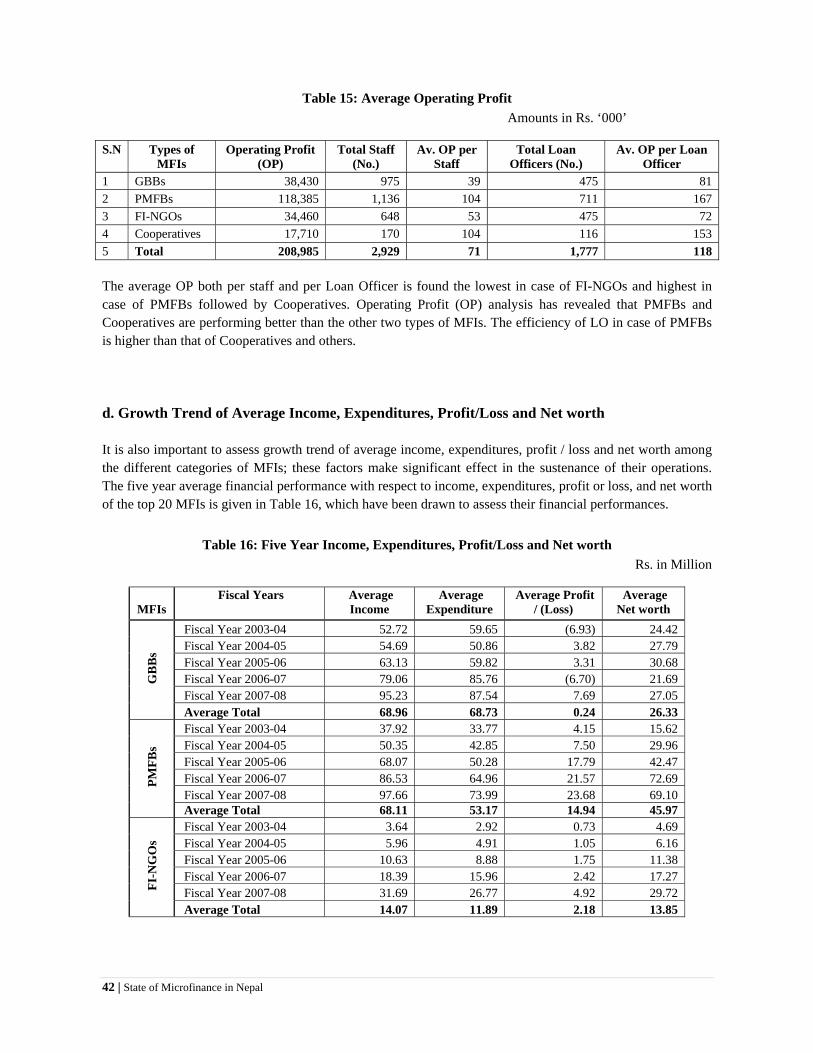
42 | State of Microfinance in Nepal
Table 15: Average Operating Profit Amounts in Rs. ‘000’
S.N Types of MFIs
Operating Profit (OP)
Total Staff (No.)
Av. OP per Staff
Total Loan Officers (No.)
Av. OP per Loan Officer
1 GBBs 38,430 975 39 475 81 2 PMFBs 118,385 1,136 104 711 167 3 FI-NGOs 34,460 648 53 475 72 4 Cooperatives 17,710 170 104 116 153 5 Total 208,985 2,929 71 1,777 118
The average OP both per staff and per Loan Officer is found the lowest in case of FI-NGOs and highest in case of PMFBs followed by Cooperatives. Operating Profit (OP) analysis has revealed that PMFBs and Cooperatives are performing better than the other two types of MFIs. The efficiency of LO in case of PMFBs is higher than that of Cooperatives and others.
d. Growth Trend of Average Income, Expenditures, Profit/Loss and Net worth
It is also important to assess growth trend of average income, expenditures, profit / loss and net worth among the different categories of MFIs; these factors make significant effect in the sustenance of their operations. The five year average financial performance with respect to income, expenditures, profit or loss, and net worth of the top 20 MFIs is given in Table 16, which have been drawn to assess their financial performances.
Table 16: Five Year Income, Expenditures, Profit/Loss and Net worth Rs. in Million
MFIs
Fiscal Years Average Income
Average Expenditure
Average Profit / (Loss)
Average Net worth
GB
Bs
Fiscal Year 2003-04 52.72 59.65 (6.93) 24.42 Fiscal Year 2004-05 54.69 50.86 3.82 27.79 Fiscal Year 2005-06 63.13 59.82 3.31 30.68 Fiscal Year 2006-07 79.06 85.76 (6.70) 21.69 Fiscal Year 2007-08 95.23 87.54 7.69 27.05 Average Total 68.96 68.73 0.24 26.33
PM
FBs
Fiscal Year 2003-04 37.92 33.77 4.15 15.62 Fiscal Year 2004-05 50.35 42.85 7.50 29.96 Fiscal Year 2005-06 68.07 50.28 17.79 42.47 Fiscal Year 2006-07 86.53 64.96 21.57 72.69 Fiscal Year 2007-08 97.66 73.99 23.68 69.10 Average Total 68.11 53.17 14.94 45.97
FI-
NG
Os
Fiscal Year 2003-04 3.64 2.92 0.73 4.69 Fiscal Year 2004-05 5.96 4.91 1.05 6.16 Fiscal Year 2005-06 10.63 8.88 1.75 11.38 Fiscal Year 2006-07 18.39 15.96 2.42 17.27 Fiscal Year 2007-08 31.69 26.77 4.92 29.72 Average Total 14.07 11.89 2.18 13.85
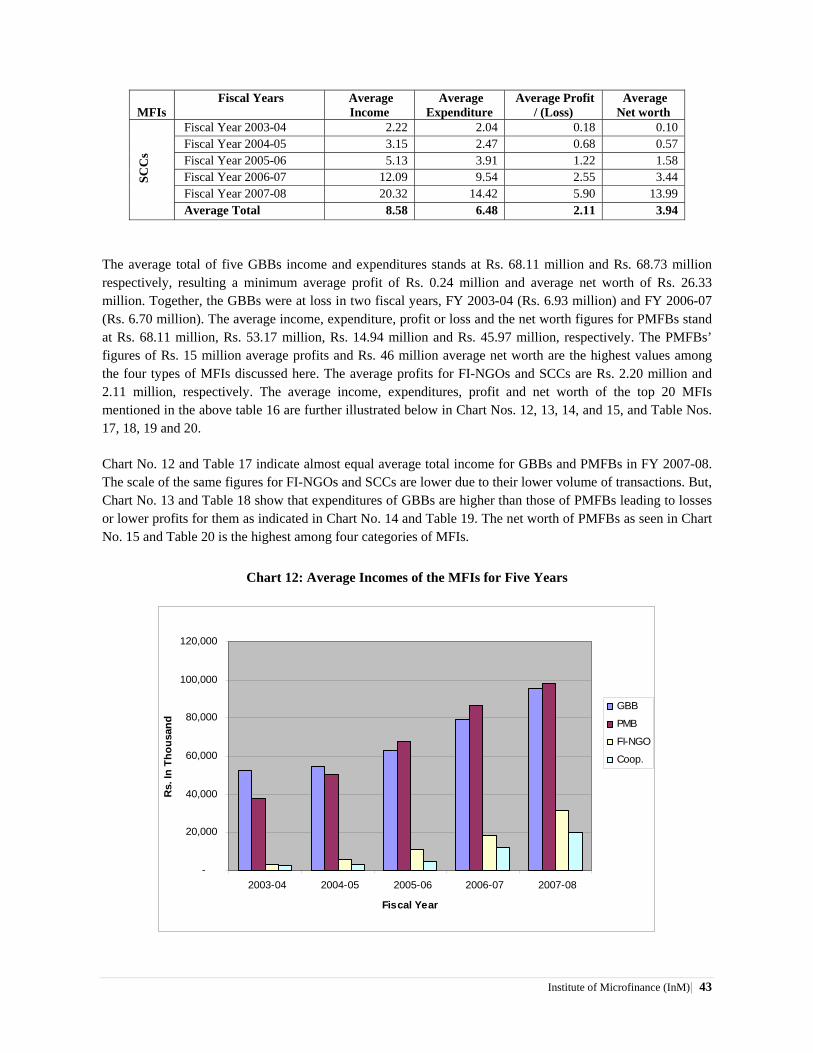
Institute of Microfinance (InM)| 43
MFIs
Fiscal Years Average Income
Average Expenditure
Average Profit / (Loss)
Average Net worth
SC
Cs
Fiscal Year 2003-04 2.22 2.04 0.18 0.10 Fiscal Year 2004-05 3.15 2.47 0.68 0.57 Fiscal Year 2005-06 5.13 3.91 1.22 1.58 Fiscal Year 2006-07 12.09 9.54 2.55 3.44 Fiscal Year 2007-08 20.32 14.42 5.90 13.99 Average Total 8.58 6.48 2.11 3.94
The average total of five GBBs income and expenditures stands at Rs. 68.11 million and Rs. 68.73 million respectively, resulting a minimum average profit of Rs. 0.24 million and average net worth of Rs. 26.33 million. Together, the GBBs were at loss in two fiscal years, FY 2003-04 (Rs. 6.93 million) and FY 2006-07 (Rs. 6.70 million). The average income, expenditure, profit or loss and the net worth figures for PMFBs stand at Rs. 68.11 million, Rs. 53.17 million, Rs. 14.94 million and Rs. 45.97 million, respectively. The PMFBs’ figures of Rs. 15 million average profits and Rs. 46 million average net worth are the highest values among the four types of MFIs discussed here. The average profits for FI-NGOs and SCCs are Rs. 2.20 million and 2.11 million, respectively. The average income, expenditures, profit and net worth of the top 20 MFIs mentioned in the above table 16 are further illustrated below in Chart Nos. 12, 13, 14, and 15, and Table Nos. 17, 18, 19 and 20.
Chart No. 12 and Table 17 indicate almost equal average total income for GBBs and PMFBs in FY 2007-08. The scale of the same figures for FI-NGOs and SCCs are lower due to their lower volume of transactions. But, Chart No. 13 and Table 18 show that expenditures of GBBs are higher than those of PMFBs leading to losses or lower profits for them as indicated in Chart No. 14 and Table 19. The net worth of PMFBs as seen in Chart No. 15 and Table 20 is the highest among four categories of MFIs.
Chart 12: Average Incomes of the MFIs for Five Years
-
20,000
40,000
60,000
80,000
100,000
120,000
2003-04 2004-05 2005-06 2006-07 2007-08
Fiscal Year
Rs.
In T
hous
and
GBB
PMB
FI-NGO
Coop.

44 | State of Microfinance in Nepal
Table 17: Average Income of MFIs Rs. in Million
Average Income GBBs PMFBs FI-NGOs Cooperatives 2003-04 52,718 37,921 3,643 2,224 2004-05 54,686 50,350 5,964 3,149 2005-06 63,127 68,075 10,633 5,126 2006-07 79,059 86,527 18,389 12,089 2007-08 95,230 97,663 31,695 20,323
Chart 13: Average Expenditures of the MFIs for Five Years
-
10,000
20,000
30,000
40,000
50,000
60,000
70,000
80,000
90,000
100,000
2003-04 2004-05 2005-06 2006-07 2007-08
Fiscal Year
Rs.
In T
hous
and
GBB
PMB
FI-NGO
Coop.
Table 18: Average Expenditure of MFIs Rs. in Million
Average Expenditure GBBs PMFBs FI-NGOs Cooperatives 2003-04 59,647 33,770 2,917 2,044 2004-05 50,863 42,846 4,912 2,470 2005-06 59,818 50,283 8,879 3,906 2006-07 85,758 64,959 15,968 9,542 2007-08 87,544 73,986 26,772 14,419
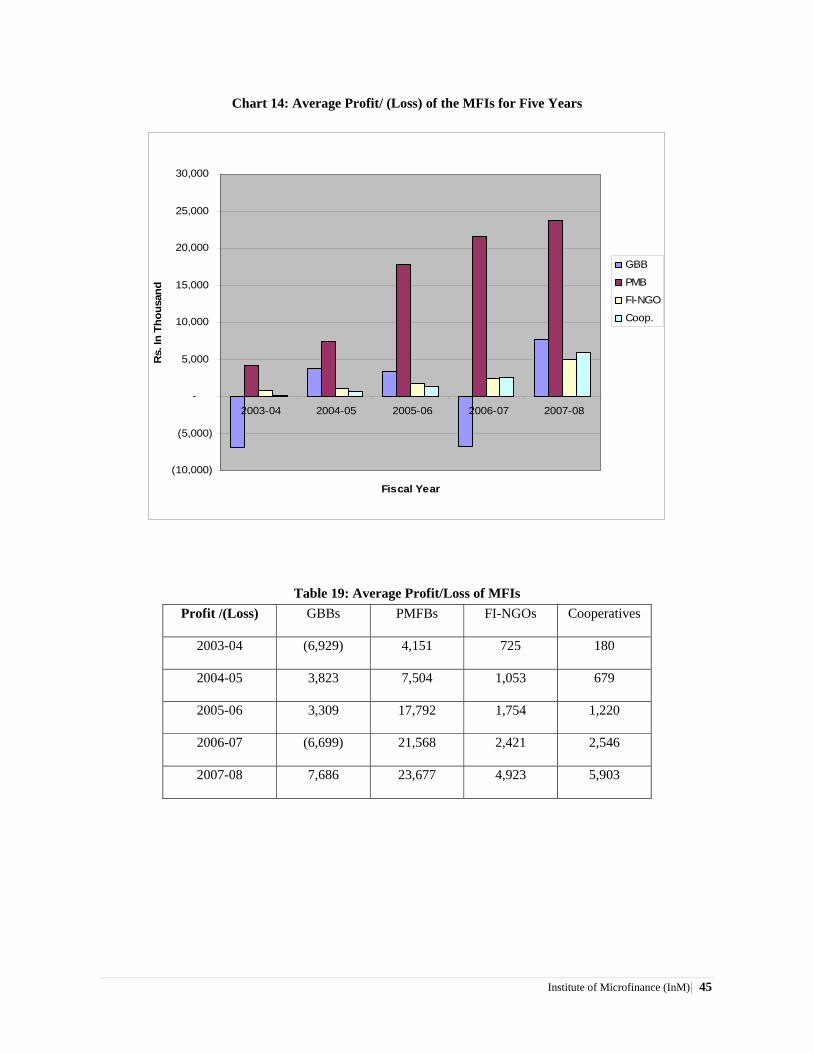
Institute of Microfinance (InM)| 45
Chart 14: Average Profit/ (Loss) of the MFIs for Five Years
(10,000)
(5,000)
-
5,000
10,000
15,000
20,000
25,000
30,000
2003-04 2004-05 2005-06 2006-07 2007-08
Fiscal Year
Rs.
In T
hous
and
GBB
PMB
FI-NGO
Coop.
Table 19: Average Profit/Loss of MFIs Profit /(Loss) GBBs PMFBs FI-NGOs Cooperatives
2003-04 (6,929) 4,151 725 180
2004-05 3,823 7,504 1,053 679
2005-06 3,309 17,792 1,754 1,220
2006-07 (6,699) 21,568 2,421 2,546
2007-08 7,686 23,677 4,923 5,903

46 | State of Microfinance in Nepal
Chart 15: Average Net worth of the MFIs for Five Years
-
10,000
20,000
30,000
40,000
50,000
60,000
70,000
80,000
2003-04 2004-05 2005-06 2006-07 2007-08
Fiscal Year
Rs.
In T
hous
and
GBB
PMB
FI-NGO
Coop.
Table 20: Average Net worth of MFIs
Networth GBBs PMFB FI-NGOs Cooperatives
2003-04 24,424 15,617 4,692 102
2004-05 27,792 29,957 6,163 573
2005-06 30,683 42,474 11,380 1,583
2006-07 21,691 72,692 17,273 3,436
2007-08 27,050 69,096 29,717 13,993

Institute of Microfinance (InM)| 47
e. Analyses of Different Ratios (see Annex 2d)
Ratios such as Savings to Loan Outstanding (SLO), Outstanding Loan to Total Assets (OLTA), Yield on Portfolio (YOP), Return on Equity (ROE), Return on Assets (ROA) and Borrowing to Capital (BC) also provide some clues on whether the MFIs could sustain their financial service operations or not.
Savings to Loan Outstanding (SLO): The top twenty MFIs have the capacity to bear 34% of their loan outstanding from their savings alone. This is true for FI-NGOs (34%) as well. The PMFIs have more capacity (38%) to bear the outstanding loan from their savings, but the GBBs together have low capacity (28%) to bear their outstanding loan from savings. FWGBB has 27% capacity to bear outstanding loans from their savings. The desired ratio of savings to loan outstanding is over 33% - (1/3rd) of the outstanding loan portfolio. It is assumed that the higher the value of ratio between savings to outstanding loan, the better the sustainability position of the MFI. It shows that MFIs are less dependent on wholesale lenders and donors for microfinance operation. Among the top twenty MFIs, EGBB has the lowest SLO (24%) and the Women Cooperative Society Ltd (WCSL), Kathmandu has the highest SLO ratio of 57%.
Outstanding Loan to Total Assets (OLTA): It is desirable to have OLTA ratio in the range of 70-80%. The overall value of this ratio for all twenty major MFIs is 61%, which is short of 9% to the minimum desired level (70%). FI-NGOs have 71%, PMFBs have 65%, SCCs have 61% and GBBs have only 52% OLTA values. The ratios of OLTA for the EGBB and WGBB are 95% and 76%, respectively. But, the values of OLTA ratios for MWGBB, FWGBB and CGBB are 21%, 30% and 42%, respectively. These three GBBs do not have adequate loan outstanding amounts to earn interest income to support their operation expenditures. However, MWGBB, FWGBB and CGBB have maintained Rs. 779 million, Rs. 352 million and Rs. 472 million, respectively in their fixed deposit accounts. In fact, these GBBs are parking their available fund instead of lending it out to the borrowers. It indicates that they are dependent on non-operating incomes which are not sustainable source of income.
Yield on Portfolio (YOP): This ratio is derived by dividing interest income from microfinance loans by average outstanding loan (opening outstanding loan + closing outstanding loan divided by two). It is better to have value of this ratio close to the normal rate of interest charged by the MFI to its loans. The YOP value of FWGBB is the lowest (9%), which is short of 11% to equate with its actual interest rate (20%). This leads the FWGBB towards losses. This is also 7% below the GBB total ratio of 16% and 11% below the average value of PMFIs (20%). It can be easily understood that the quality of loan portfolio is very poor, which has badly affected the income of FWGBB.
Return on Equity (ROE): The ROE ratio should be near to the market interest rate on savings. In order to derive this ratio, profit is divided by the average equity (opening equity + closing equity divided by 2). The ROE ratio for GBBs is 7.88% and it is -1.75% for the FWGBB. For PMFBs, this ratio is 9.07%, for FI-NGOs total, it is 5.22% and for SCCs, it is 16.94% - the highest among the four types of MFIs. This indicates SCCs are in better position than all other three types of MFIs as its ROE value is higher than the market interest rate

48 | State of Microfinance in Nepal
on savings. This ratio is negative (-1.55%) for DEPROSC Nepal, which shows its loss in microfinance operation as it charges rewrite rate of lowest rate of interest among MFIs.
Return on Assets (ROA): The ROA is the value derived by dividing profit by the average value of the assets. This value should be positive. The higher the value of this ratio the better the condition for sustained operation of microfinance services by the MFI. This value for SCCs is the highest i.e. 1.10% followed by PMFIs 0.93%, FI-NGOs 0.59% and GBBs 0.25%. Thus, SCCs, PMFIs and FI-NGOs have better chance for continued MF operations. The ROA, however, is found negative for two MFIs, FWGBB (-0.20%) and DEPROSC Nepal (-0.19%), which is undesirable.
Borrowings to Capital (BC): It is desirable to have borrowings up to 5 times of the net worth. The major twenty MFIs have borrowed 9 times their total net worth. The GBBs have borrowed more than 22 times of their net worth, the PMFIs over 6 times, SCCs over 5 times and FI-NGOs have borrowed little less than 5 times of their net worth. This again indicates that FI-NGOs, SCCs and PMFIs are in good shape with regard to their borrowings than GBBs. The data on BC ratio indicates that GBBs are highly dependent on wholesale lenders for their lending, and wholesalers are at high risk to lend to GBBs.
Loan Loss Reserve to Non-performing Loan (LLR to NPL ratio): The lower ratios are observed for CWDEC, Saptari (FI-NGO), FWGBB and WGBB, which are 58%, 91% and 94%, respectively. In all other cases, this ratio is over 100%. This indicates that MFIs in Nepal are provisioning sufficient funds to compensate the non-performing loans (overdue loans). The GBBs’ average loan loss to non-performing loan is 102%; it is 144% in case of PMFBs, 293% in FI-NGOs and 372% in cooperatives. Similarly, loan loss reserve to loan outstanding ratio is 9.53% in case of GBBs, 3.44% in PMFBs, 2.18% in FI-NGOs and 4.92% in cooperatives.
f. Operating Self-Sufficiency (OSS) and Financial Self-Sufficiency (FSS)
The OP analysis, different ratio analyses and the analysis of profit/loss and net worth are not enough to exactly identify which type of MFI is more viable and sustainable. Therefore, an analysis is carried out also for the Operational Self-Sufficiency (OSS) and Financial Self-Sufficiency (FSS). The key sustainability indicators, OSS and FSS should be above 100%, if an MFI is to sustain its operations. The sustainability indicators of the four types of MFIs presented in Table 21 clearly show how weak the GBBs still are as compared to other categories of MFIs despite efforts made for improvement. The FSS and OSS of the top twenty-microfinance institutions as of mid-July 2008 are calculated and presented in Annex 2(d) and category-wise indicators are given in Table 21.
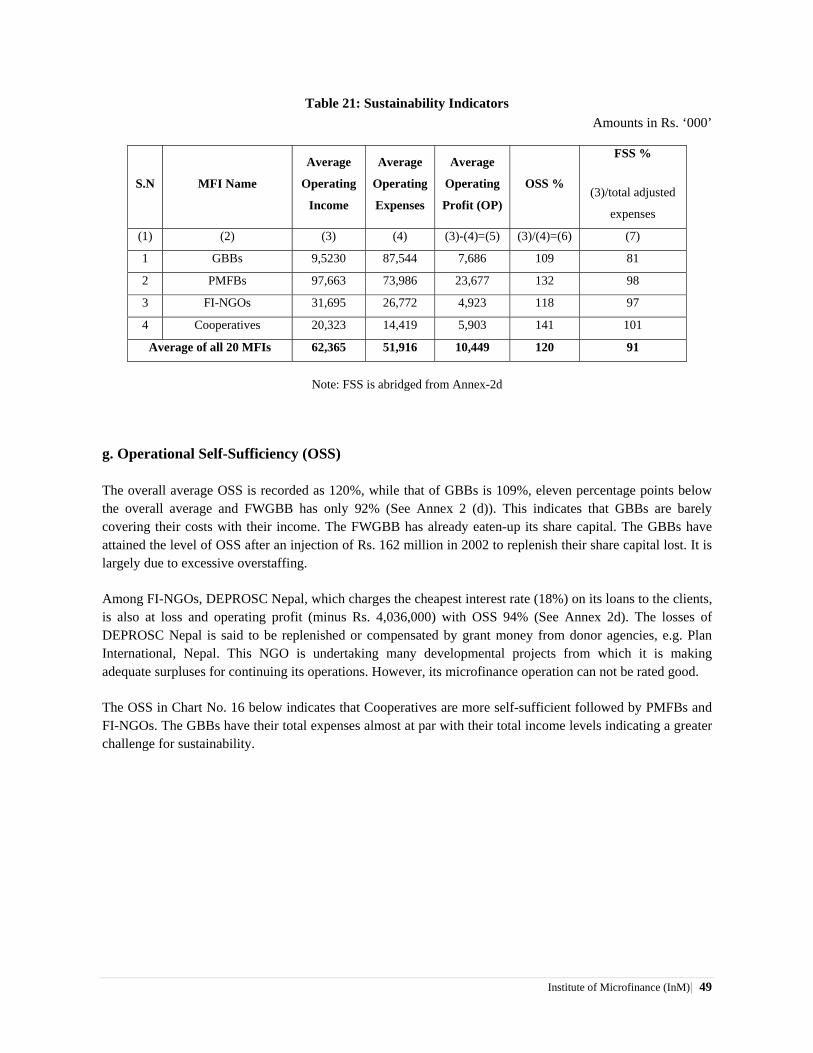
Institute of Microfinance (InM)| 49
Table 21: Sustainability Indicators Amounts in Rs. ‘000’
S.N MFI Name
Average
Operating
Income
Average
Operating
Expenses
Average
Operating
Profit (OP)
OSS %
FSS %
(3)/total adjusted
expenses
(1) (2) (3) (4) (3)-(4)=(5) (3)/(4)=(6) (7)
1 GBBs 9,5230 87,544 7,686 109 81
2 PMFBs 97,663 73,986 23,677 132 98
3 FI-NGOs 31,695 26,772 4,923 118 97
4 Cooperatives 20,323 14,419 5,903 141 101
Average of all 20 MFIs 62,365 51,916 10,449 120 91
Note: FSS is abridged from Annex-2d
g. Operational Self-Sufficiency (OSS)
The overall average OSS is recorded as 120%, while that of GBBs is 109%, eleven percentage points below the overall average and FWGBB has only 92% (See Annex 2 (d)). This indicates that GBBs are barely covering their costs with their income. The FWGBB has already eaten-up its share capital. The GBBs have attained the level of OSS after an injection of Rs. 162 million in 2002 to replenish their share capital lost. It is largely due to excessive overstaffing.
Among FI-NGOs, DEPROSC Nepal, which charges the cheapest interest rate (18%) on its loans to the clients, is also at loss and operating profit (minus Rs. 4,036,000) with OSS 94% (See Annex 2d). The losses of DEPROSC Nepal is said to be replenished or compensated by grant money from donor agencies, e.g. Plan International, Nepal. This NGO is undertaking many developmental projects from which it is making adequate surpluses for continuing its operations. However, its microfinance operation can not be rated good.
The OSS in Chart No. 16 below indicates that Cooperatives are more self-sufficient followed by PMFBs and FI-NGOs. The GBBs have their total expenses almost at par with their total income levels indicating a greater challenge for sustainability.

50 | State of Microfinance in Nepal
Chart 16: Average Operational Self-sufficiency (OSS)
Nam
e of
th
e M
FI
Types of MFIs Average OSS GBBs (A) 109% PMFBs (B) 132% FI-NGOs © 118% Cooperatives (D) 141% Total (A+B+C+D) 120%
The OSS of Cooperatives is found the highest (141%) with 21 percentage points more than the average of all twenty MFIs (120%) indicating its high degree of sustainability. In case of SHGs, many of them gradually die down some time after the end of the projects. However, the SHGs that are converted into Cooperatives are found operating with their own resources as they are mobilizing members' share capital and savings.
h. Financial Self-Sufficiency (FSS)
Chart No. 17 has also depicted the comparision of OSS and FSS. For GBBs, the OSS is 109% but below the overall OSS value of 120%, and the FSS value is only 81%, which is 9 percentage point below the overall average FSS (90%). Cooperatives have 104% FSS followed by the PMFBs 97% and FI-NGOs 94%, all three are above the overall average FSS of 90% (For details see Annex 2 (d) on FSS). For long term sustainability of operation, MFIs should obtain over 100% FSS.
The value of OSS is above 100% for all categories of MFIs, while the value of FSS ranges from a minimum of 81% in case of GBBs to 104% in case of Cooperatives. Only GBBs fall below the average value, however, PMFBs and FI-NGOs are also in short of 3-6 percentage points to attain 100% marks. But they seem to have improved their FSS year after year through increased volume of transaction. In the calculation of FSS the study has used market interest of 10% and inflation adjustment of 7%. Even a little variation in the market interest rate or inflation adjustment could make considerable variation in the FSS values.
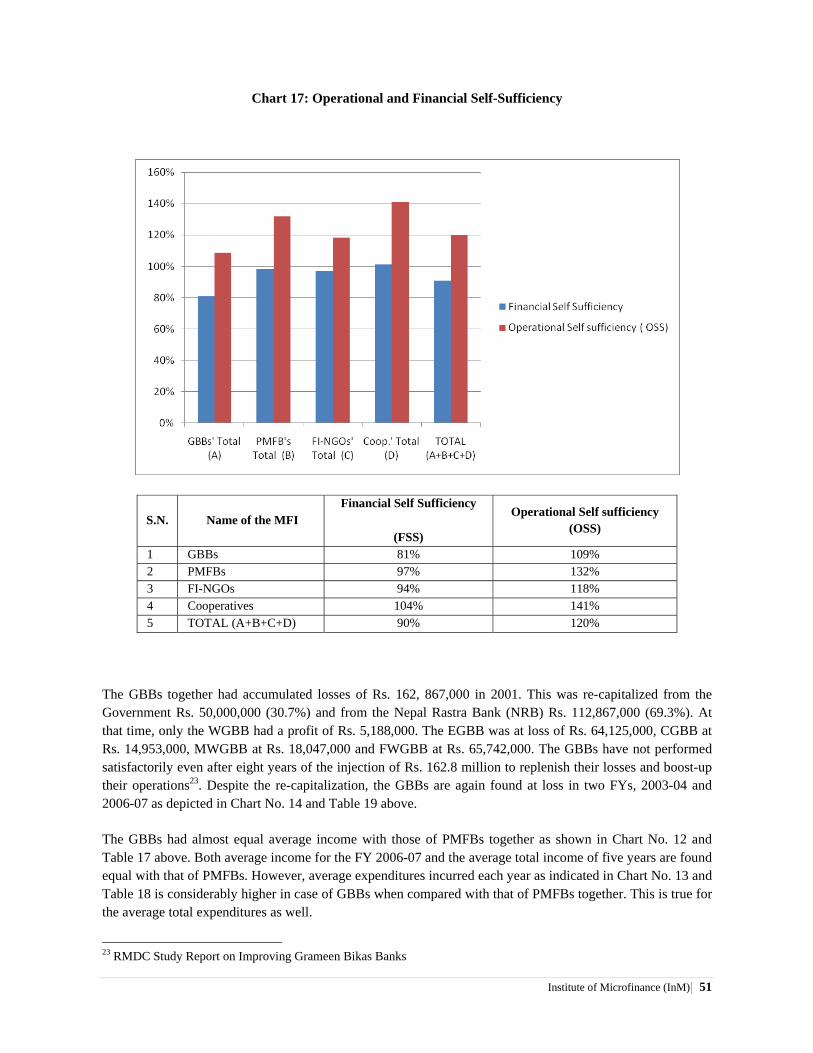
Institute of Microfinance (InM)| 51
Chart 17: Operational and Financial Self-Sufficiency
S.N. Name of the MFI Financial Self Sufficiency
(FSS)
Operational Self sufficiency (OSS)
1 GBBs 81% 109% 2 PMFBs 97% 132% 3 FI-NGOs 94% 118% 4 Cooperatives 104% 141% 5 TOTAL (A+B+C+D) 90% 120%
The GBBs together had accumulated losses of Rs. 162, 867,000 in 2001. This was re-capitalized from the Government Rs. 50,000,000 (30.7%) and from the Nepal Rastra Bank (NRB) Rs. 112,867,000 (69.3%). At that time, only the WGBB had a profit of Rs. 5,188,000. The EGBB was at loss of Rs. 64,125,000, CGBB at Rs. 14,953,000, MWGBB at Rs. 18,047,000 and FWGBB at Rs. 65,742,000. The GBBs have not performed satisfactorily even after eight years of the injection of Rs. 162.8 million to replenish their losses and boost-up their operations23. Despite the re-capitalization, the GBBs are again found at loss in two FYs, 2003-04 and 2006-07 as depicted in Chart No. 14 and Table 19 above.
The GBBs had almost equal average income with those of PMFBs together as shown in Chart No. 12 and Table 17 above. Both average income for the FY 2006-07 and the average total income of five years are found equal with that of PMFBs. However, average expenditures incurred each year as indicated in Chart No. 13 and Table 18 is considerably higher in case of GBBs when compared with that of PMFBs together. This is true for the average total expenditures as well.
23 RMDC Study Report on Improving Grameen Bikas Banks
52 | State of Microfinance in Nepal
It is, therefore, suggested that GBBs reduce its staff number and rationalize it to have the desired ratio of Loan Officers (field staff) to other staff (support staff), such that the efficiency of staff is improved. The redundant staff must be removed with some compensation arrangements. The retention of such extra staff will continue to increase expenses, which will pull down the profitability of GBBs. It is also time for GBBs to review interest charged on loans extended to their clients as it has direct impact on their profitability. As of now, GBBs charge 20% interest on loans to their clients, while PMFBs charge 20-25% interest on loans to their clients. Chart No. 14 and Table 19 has clearly indicated that the performance of PMFBs with regard to profit is the highest among all four types of MFIs. The GBBs together is making much lower amounts of profits or even running losses at two times as compared to PMFBs together. The other two categories of MFIs, FI-NGOs and Cooperatives, are also at profit each year, although less in amounts as their volumes of transactions are much lower than PMFBs and GBBs. Growth of net worth is also found the highest in case of PMFBs, each year and average total of five years. It is said that these PMFBs have maintained the best management information system in their institutions allowing their management to track down any shortfalls rectified in time, whereas, GBBs, lack good MIS system and the number of support staff and staff at head office is excessively higher. Therefore, it is also suggested that GBBs develop and improve management information system (MIS) to be able to furnish important data on their operations to their management, such that corrective actions could be taken timely and help to make the operations sustainable.
Table 13 in the preceding section has also indicated an average of 9.3% overdue loans for GBBs as against 2.4% for PMFBs. The FWGBB has over 26% overdue rate and the MWGBB has 13.8. Hence, it is important that GBBs downsize their overdue loans through identifying the exact causes of overdue and initiate concrete action plans for recollection of loans. Non-targeting of clients might have also caused the increase in overdue loans. Therefore, it is necessary to identify the targeted clients by using the appropriate tools such as Participator Wealth Ranking (PWR) prior to providing them with microfinance services.
The MFIs in question could be easily made sustainable if they rationalize their staff numbers, increase staff productivity and reduce unwanted expenses. These MFIs should also pay attention to non-politicization of their staffs and making them professionally sound. They should also charge appropriate rates of interest to their clients such that they earn adequate profit to sustain their operations. Some MFIs which have been charging rates below the cost of operation are found at loss. However, excepting two MFIs the others have attained the minimum required OSS level. They have been improving their profitability and moving towards attaining FSS in few years time.

Institute of Microfinance (InM)| 53
Chapter V: Wholesale Lending Institutions
5.1 Rural Self-Reliance Fund (RSRF)
In March 1991, the government decided to create a "Rural Self-reliance Fund" (RSRF) for providing wholesale credit to qualified Saving and Credit Cooperatives (SCCs) and NGOs, which in turn would provide necessary micro credit services to the poor and the destitute living in backward village for enabling them to generate employment opportunities and uplift economic conditions. The RSRF received seed money of Rs. 20 million from the government. The government made additional contribution of Rs. 70 million during 2005-07 and NRB added Rs. 253.4 million from its profit to lend to small farmer tea growers in the Eastern Nepal.
The RSRF is mobilized as per the decisions of the RSRF Steering Committee headed by the Deputy Governor of the Nepal Rastra Bank. The SCCs and NGOs, which meet the specified requirements, have been provided with loans to disburse to the target people for agriculture, horticulture and livestock purposes and micro enterprises, self-employment and income earning activities, renewable energy and irrigation purposes. The SCCs and NGOs that fulfill the set criteria are provided with wholesale funds at 8% per annum. They are given interest rebate of 6% if the interest and principal amounts are paid within the prescribed schedule.
Box No. 1
Eligibility Criteria for Borrowing from RSRF
(a) The applicant organization should be registered under existing Nepalese law that is, cooperative society under the Cooperative Act, 1992 and non-governmental organizations under the Society Registration Act, 1979. The FI-NGOs should also have business license from the NRB.
(b) The organization should have been mobilizing savings and providing credit from and to at least 70 percent of its own members prior to one year after the registration of the organization.
(c) The organization should be situated in rural areas and under poverty mapping of National Planning Commission where there is no bank and FIs and where the majority of the population includes Dalits and depressed caste and tribes.
(d) An individual or family to borrow from the organization need not have more than 15 Ropanis of land in mountain region or 1 Bigha of land in Terai region with no regular income, cannot feed himself or the family has no outstanding loan from other bank and FIs for income-generating activity and. Dalits, deprived sector women, members of self-reliant group of the deprived sector would be the target group to receive credit from the Fund.
(e) The Fund shall provide credit to viable organization according to its credit manual. (f) The interest rate of the Fund is eight percent per annum to the FIs with the provision of a return of 75 percent on
timely payment by the FIs to the Fund.

54 | State of Microfinance in Nepal
The qualified institution can provide loans to its clients not exceeding Rs. 40,000 in the first time, Rs. 50,000 in the second, and Rs. 60,000 in the third. The client can also receive an additional loan of Rs.60, 000 if the client's loan repayment record is found good. The partner cooperatives and NGOs need to finance 20 % of the project cost through their own source and use only 80% cost from the RSRF24. The fund, as such, has no specific model. The borrowing organization can on-lend the funds as per its own policy and procedure. They generally lend at 12% per annum to their clients. RSRF provides loan amount upto Rs. 1.5 million to a borrowing MFI in the first round which should not be more than 20 times of its primary share. In the second round, RSRF provides Rs. 2 million to a borrowing MFI not exceeding 15 times of its primary share. And in third round, based on the performance of the MFI, RSRF provides Rs. 2.5 million which should not exceed 15 times of its primary share. The MFIs which has repaid all three installments of RSRF loans would get re-financed fund upto Rs. 3 million.
The progress made as of July 2008 under RSRF funding is given in table 5 below.25 The total loan disbursement of RSRF stands at Rs. 193 million (Rs. 21 million for NGOs and Rs. 172 million for cooperatives). This has been given to 334 institutions in 50 districts.
The total loans recovered from 267 institutions (47 NGOs and 220 cooperatives) have reached Rs. 102 million principal amount (Rs. 17 million from NGOs and Rs. 85 million from cooperatives) and Rs. 13 million interest amount (Rs. 2 million from NGOs and Rs. 11 million from cooperatives).
Outstanding loans that remained in 43 districts stands at Rs. 91 million (Rs. 3.8 million with NGOs and Rs. 87 million with cooperatives). The overall overdue loan is Rs. 10 million which is 9% of the loans to be recovered. The recovery rate is 91% (FI-NGOs 87% and Cooperatives 91.8%).
24 RSRF Directives – 2060 with revision 2065 BS. 25 Microfinance Division, NRB, Kathmandu
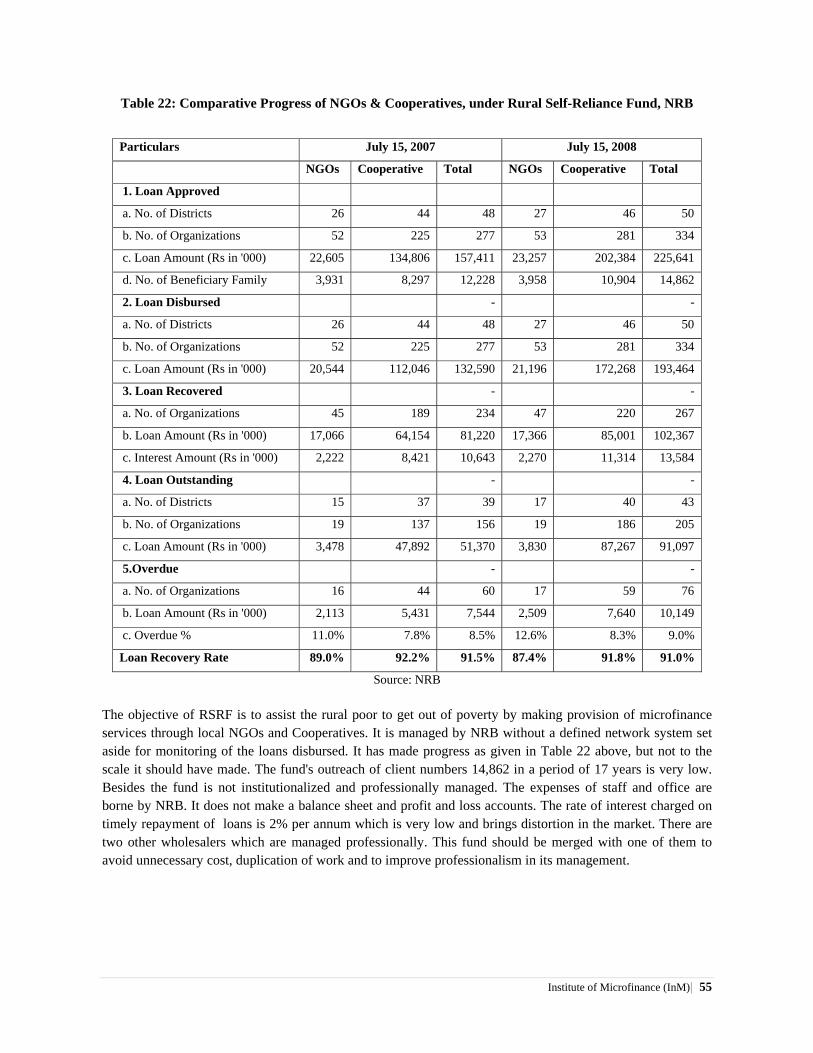
Institute of Microfinance (InM)| 55
Table 22: Comparative Progress of NGOs & Cooperatives, under Rural Self-Reliance Fund, NRB
Source: NRB
The objective of RSRF is to assist the rural poor to get out of poverty by making provision of microfinance services through local NGOs and Cooperatives. It is managed by NRB without a defined network system set aside for monitoring of the loans disbursed. It has made progress as given in Table 22 above, but not to the scale it should have made. The fund's outreach of client numbers 14,862 in a period of 17 years is very low. Besides the fund is not institutionalized and professionally managed. The expenses of staff and office are borne by NRB. It does not make a balance sheet and profit and loss accounts. The rate of interest charged on timely repayment of loans is 2% per annum which is very low and brings distortion in the market. There are two other wholesalers which are managed professionally. This fund should be merged with one of them to avoid unnecessary cost, duplication of work and to improve professionalism in its management.
Particulars July 15, 2007 July 15, 2008
NGOs Cooperative Total NGOs Cooperative Total
1. Loan Approved
a. No. of Districts 26 44 48 27 46 50
b. No. of Organizations 52 225 277 53 281 334
c. Loan Amount (Rs in '000) 22,605 134,806 157,411 23,257 202,384 225,641
d. No. of Beneficiary Family 3,931 8,297 12,228 3,958 10,904 14,862
2. Loan Disbursed - -
a. No. of Districts 26 44 48 27 46 50
b. No. of Organizations 52 225 277 53 281 334
c. Loan Amount (Rs in '000) 20,544 112,046 132,590 21,196 172,268 193,464
3. Loan Recovered - -
a. No. of Organizations 45 189 234 47 220 267
b. Loan Amount (Rs in '000) 17,066 64,154 81,220 17,366 85,001 102,367
c. Interest Amount (Rs in '000) 2,222 8,421 10,643 2,270 11,314 13,584
4. Loan Outstanding - -
a. No. of Districts 15 37 39 17 40 43
b. No. of Organizations 19 137 156 19 186 205
c. Loan Amount (Rs in '000) 3,478 47,892 51,370 3,830 87,267 91,097
5.Overdue - -
a. No. of Organizations 16 44 60 17 59 76
b. Loan Amount (Rs in '000) 2,113 5,431 7,544 2,509 7,640 10,149
c. Overdue % 11.0% 7.8% 8.5% 12.6% 8.3% 9.0%
Loan Recovery Rate 89.0% 92.2% 91.5% 87.4% 91.8% 91.0%

56 | State of Microfinance in Nepal
5.2 Rural Microfinance Development Centre Ltd. (RMDC)
RMDC is the major wholesale lending organization in microfinance sector in the country. It was established in 1998 with the authorized and paid up capital of Rs. 80 million. Later the authorized capital was raised to Rs. 640 million and the issued and paid up capital to Rs. 320 million. Its promoters and share holders are NRB, 13 CBs, five GBBs, the Deposit Insurance and Credit Guarantee Corporation (DICGC) and Nirdhan NGO. The 13 CBs and NRB hold 90.1% and 6.6% of the total paid-up capital, respectively. The key objective of RMDC is to help improve socio-economic condition of the majority of the rural poor, the landless and the asset-less women by increasing their access to financial services for productive undertakings that generates income and employments. It has been offering wholesale funds to MFIs to on-lend to the ultimate borrowers for undertaking productive activities. RMDC also provides supports for strengthening the institutional capacity of the partner organizations and extends financial and technical supports for upgrading skills and confidence of the ultimate beneficiaries in undertaking income generation activities. All types of institutions, which are legally entitled to undertake microfinance operations, such as Microfinance Development Banks (MFDBs), FI-NGOs, SCCs, and SFCLs are eligible for borrowing from it. It has partnered with 79 MFIs, which are covering 52 out of 75 districts as of 2009.
As of mid July 2009, RMDC had 79 POs for which it has approved Rs. 4,032 million loans and had disbursed Rs. 3,314 million. It has also recovered Rs. 1,814 million from the POs and has an outstanding of Rs. 1,500 million by the same period. RMDC has been able to maintain 100% recovery rate from its inception to date. There was no default of loans and interest as yet. It has also been making profit from the very first year. The year-wise cumulative loan portfolio status is provided in Table 23 below.
Table 23: RMDC’s Cumulative Loan Portfolio Status with Partner Organizations Amount in Rs. "000"
No. of POs Fiscal Year Approved Disbursed Recovered Outstanding
2 1999-00 40,000 40,000 - 40,000
8 2000-01 72,100 41,900 26,667 15,233
17 2001-02 204,760 107,845 50,571 57,274
24 2002-03 317,125 244,895 123,989 120,906
32 2003-04 444,480 363,710 230,243 133,467
36 2004-05 827,245 684,365 358,530 325,835
45 2005-06 1,185,080 982,602 481,748 500,854
58 2006-07 2,328,755 1,943,667 808,623 1,135,044
69 2007-08 3,129,015 2,468,687 1,214,263 1,254,423
73 2008-09 4,032,245 3,313,866 1,813,775 1,500,091
Some of the principal performance indicators of RMDC are also presented in Table 6b below. Accordingly, it has maintained 100% repayment rate, increasing ROE, ROA, and OSS. The NRB prescribed loan loss reserve ratio is only 1% on good loans, however, the RMDC has maintained 4% loan loss reserve for the last three years as indicated in Table 24 below. RMDC has 14.5% Return on Equity, 2.1% return on assets, 1.4% on operating efficiency, and 226% on OSS as of 2008-09.

Institute of Microfinance (InM)| 57
Table 24: Principal Performance Indicators of RMDC Particulars F.Y. 2006-07 F.Y. 2007-08 F.Y. 2008-09
Return on Equity 7.2% 13.2% 14.5%
Return on Total Asset 0.9% 1.9% 2.1%
Yield on Loan Portfolio 4.9% 5.1% 5.2%
Operating Efficiency 1.2% 1.2% 1.4%
Repayment Rate 100.0% 100.0% 100.0%
Operational Self Sufficiency 139.9% 231.4% 226.5%
Non Performing Assets 0.0% 0.0% 0.0%
Loan Loss Reserve Ratio 4.0% 4.0% 4.0%
RMDC has 79 partner organizations, which have outreach of 805326 member families. The total number of borrowers has reached 601228 as of 2008/09. The cumulative loan disbursement of its partners has reached Rs. 37708 million and recovery Rs. 31530 million with the outstanding balance of Rs. 6,178 million. The total member of savings also reached Rs. 2,384 million which is 38% of the outstanding loan amount. For details of the year-wise figures refer to Table 25 below:
Table 25: Outreach, Loan Performance and Members Savings of Partner Organizations Rs in "000"
S.N. Particulars Numbers
of
members
Numbers
of
borrowers
Loan
disbursed
(Cumulative)
Loan
Recovered
(Cumulative)
Loan
outstanding
Members
savings
1 1999-00 65,319 55,987 932,882 692,277 240,605 75,266
2 2000-01 77,311 65,667 1,547,188 1,189,573 357,615 107,166
3 2001-02 165,328 147,992 4,647,275 3,677,525 969,749 247,163
4 2002-03 179,514 155,255 6,299,357 5,202,476 1,096,881 339,453
5 2003-04 211,142 172,644 8,255,336 7,040,460 1,214,876 404,493
6 2004-05 279,935 231,998 10,968,287 9,294,216 1,674,071 545,494
7 2005-06 368,814 304,030 14,500,970 12,173,029 2,327,941 765,082
8 2006-07 503,497 390,146 19,635,804 16,467,908 3,167,896 1,064,086
9 2007-08 667,818 510,929 27,533,540 23,065,579 4,467,961 1,680,530
10 2008-09 805,326 601,238 37,708,892 31,530,095 6,178,797 2,384,206
RMDC is also focusing on capacity building of partner MFIs as well as ultimate beneficiaries. It is developing the potential NGOs and cooperatives into capable MFIs.
It's institutional development programs aim at achieving the following broad objectives:
Developing itself as the lead institution to deliver micro credit facilities to MFIs, Making its partner organizations financially viable and sustainable, Creating more MFIs sufficient to serve the un-served masses of the poor, and

58 | State of Microfinance in Nepal
Helping to create conducive policy and legal environment through organizing seminars, workshops and dialogues of key stakeholders.
By the end of the fiscal year 2008-09, RMDC has provided induction training on microfinance’s best practices to 196 institutions; majority of them are NGOs and cooperatives. In total, 11,874 staffs of MFIs and 424,203 beneficiaries have been provided with various capacity building training and exposure visits. In Nepal, there is no other institution besides RMDC, which provides need based practical training on best practices of microfinance services to both MFIs and their clients. The POs have covered 52 districts by the end of fiscal year 2008/09. The year-wise details of training are given below in Table 26.
Table 26: RMDC’s Progress in Outreach and Capacity Building Training
RMDC has a separate division for supervising its partner organizations (POs). The division prepares an annual plan for the supervision of POs. It plans to supervise each active PO at least once in an interval of a period of six months. It also makes surprise check of its POs. As a result of adhering to the set criteria for lending and having a good supervision system, RMDC has been able to demonstrate the best performance among the wholesale lending institutions in Nepal. The Asian Development Bank (ADB) has given it “Exemplary Performance Award” for four times since its inception.
Box No. 2
Eligibility Criteria of RMDC
Institutions willing to borrow credit from RMDC should fulfill the following requirements. An organization should
(a) Have registered under an appropriate act and received a license for microfinance operation; (b) Have minimum of one year experience in operating microfinance activities; (c) Have savings balance at least 5% of the loan outstanding in the 1st year, 10% in the 2nd year, 15% in the 3rd year, and
20% in the 4th year and onward; (d) Have attained minimum 90% loan recovery rate; (e) Have committed and dynamic executive committee; (f) Have active and professional management; (g) Have appropriate management information system; (h) Have an appropriate business plan; (i) Have adopted modern accounting system; (j) Have appropriate policies and procedures for implementing and monitoring its credit program; (k) Have at least 50 active borrowers;
Fiscal Year Districts Covered No. of POs MFIs Trained MFIs Staff Trained
MFIs Clients Trained
1999-00 14 2 - 231 - 2000-01 19 8 52 1,740 46,479 2001-02 34 17 62 3,223 82,838 2002-03 35 24 100 4,243 124,800 2003-04 39 32 112 5,469 165,138 2004-05 39 36 130 6,915 209,644 2005-06 40 45 138 8,042 281,315 2006-07 47 58 160 10,140 364,378 2007-08 51 69 196 10,814 384,419 2008-09 52 79 202 11,874 424,203

Institute of Microfinance (InM)| 59
(l) Have at least 25% female borrowers; (m) Have minimum financial resources of Rs. 250,000; (n) Have minimum net-worth of Rs. 100,000; (o) Have geared towards self-sufficiency as per the last three years’ financial position; and (p) Have audited its account in time.
RMDC is in its halfway towards attaining its goal of reaching to 1.5 million poor families by 2015 through 150 POs with quality microfinance services. With the speed of progress the POs are catching up, it is quite possible to attain the goal. RMDC’s 79 partner MFIs have a total of 805326 members. However, RMDC is aware of a challenging problem of client overlapping, which has started to appear with some POs in some districts. It needs to devise a mechanism to cope with this problem. It has been encouraging its POs for outreaching to the poorest households located in the remote corners of the country.
Box No. 3 ADB's Observations on RMDC
1. RMDC is a unique institution that focuses on capacity building to create operationally and financially self-sufficient
microfinance institutions, in addition to the establishment and expansion of credit lines.16 As a result, many of RMDC's implementing agencies are among the most economically viable microfinance institutions and those few are considered creditworthy by commercial banks. The expansion of financial transactions with such implementing agencies on a selective basis enabled RMDC to maintain 100% on-time loan repayment, even amidst a decade long conflict and political turmoil. This has been attributable to RMDC attaining operational and financial self-sufficiency in its operations.
2. RMDC’s transparent lending policies and procedures, and the diverse nature of technical support were effective in
establishing the following for its partner implementing agencies: good governance and professional management, appropriate operating systems and procedures, skilled and disciplined human resources, effective monitoring and supervision systems, audit and internal control systems, and effective management information systems.
3. The staff recruitment process and human resource management are important for successful operations. RMDC has a
distinctive working culture. Their staffs are well-educated, dedicated and committed in their job, and well-prepared and updated. They frequently conduct field visits to implementing agencies and are well acquainted with ground realities.
4. The concept of bare foot bankers is innovative. The provision of technical support by the bare foot bankers and other
facilitators from strong implementing agencies to new and weak implementing agencies (especially the financial non-governmental organizations) has been quite effective in building the capacities of the new and weak implementing agencies.
5. Tailor-made and pre-defined capacity-building packages are seldom effective. RMDC did not follow a pre-
established structure nor did it offer standard courses, but instead designed courses based on the training needs of the implementing agencies’ staff. RMDC assessed the demands of partner implementing agencies at the beginning of each year and complemented them with suggestions from its staff members who possess extensive knowledge of all partners. RMDC was successful in meeting all training needs through the training of trainers.
Source: ADB Project Completion Report on Rural Microfinance Project 2008
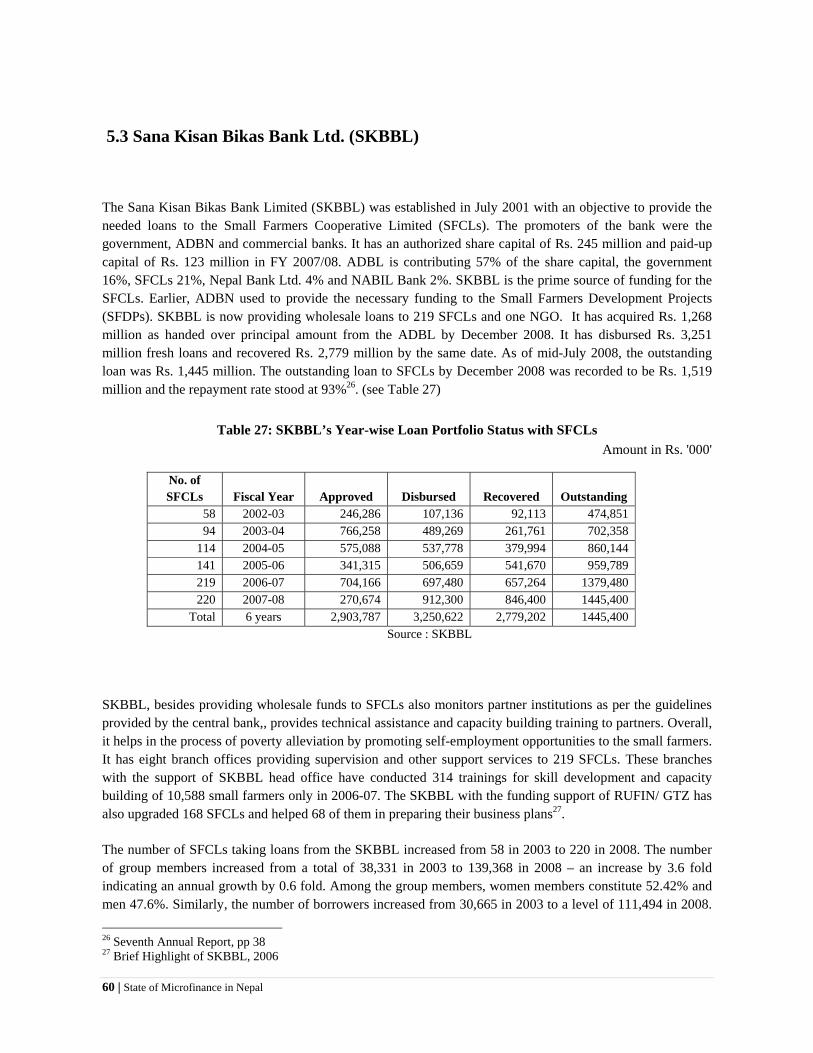
60 | State of Microfinance in Nepal
5.3 Sana Kisan Bikas Bank Ltd. (SKBBL)
The Sana Kisan Bikas Bank Limited (SKBBL) was established in July 2001 with an objective to provide the needed loans to the Small Farmers Cooperative Limited (SFCLs). The promoters of the bank were the government, ADBN and commercial banks. It has an authorized share capital of Rs. 245 million and paid-up capital of Rs. 123 million in FY 2007/08. ADBL is contributing 57% of the share capital, the government 16%, SFCLs 21%, Nepal Bank Ltd. 4% and NABIL Bank 2%. SKBBL is the prime source of funding for the SFCLs. Earlier, ADBN used to provide the necessary funding to the Small Farmers Development Projects (SFDPs). SKBBL is now providing wholesale loans to 219 SFCLs and one NGO. It has acquired Rs. 1,268 million as handed over principal amount from the ADBL by December 2008. It has disbursed Rs. 3,251 million fresh loans and recovered Rs. 2,779 million by the same date. As of mid-July 2008, the outstanding loan was Rs. 1,445 million. The outstanding loan to SFCLs by December 2008 was recorded to be Rs. 1,519 million and the repayment rate stood at 93%26. (see Table 27)
Table 27: SKBBL’s Year-wise Loan Portfolio Status with SFCLs Amount in Rs. '000'
No. of SFCLs Fiscal Year Approved Disbursed Recovered Outstanding
58 2002-03 246,286 107,136 92,113 474,851 94 2003-04 766,258 489,269 261,761 702,358
114 2004-05 575,088 537,778 379,994 860,144 141 2005-06 341,315 506,659 541,670 959,789 219 2006-07 704,166 697,480 657,264 1379,480 220 2007-08 270,674 912,300 846,400 1445,400
Total 6 years 2,903,787 3,250,622 2,779,202 1445,400 Source : SKBBL
SKBBL, besides providing wholesale funds to SFCLs also monitors partner institutions as per the guidelines provided by the central bank,, provides technical assistance and capacity building training to partners. Overall, it helps in the process of poverty alleviation by promoting self-employment opportunities to the small farmers. It has eight branch offices providing supervision and other support services to 219 SFCLs. These branches with the support of SKBBL head office have conducted 314 trainings for skill development and capacity building of 10,588 small farmers only in 2006-07. The SKBBL with the funding support of RUFIN/ GTZ has also upgraded 168 SFCLs and helped 68 of them in preparing their business plans27.
The number of SFCLs taking loans from the SKBBL increased from 58 in 2003 to 220 in 2008. The number of group members increased from a total of 38,331 in 2003 to 139,368 in 2008 – an increase by 3.6 fold indicating an annual growth by 0.6 fold. Among the group members, women members constitute 52.42% and men 47.6%. Similarly, the number of borrowers increased from 30,665 in 2003 to a level of 111,494 in 2008.
26 Seventh Annual Report, pp 38 27 Brief Highlight of SKBBL, 2006
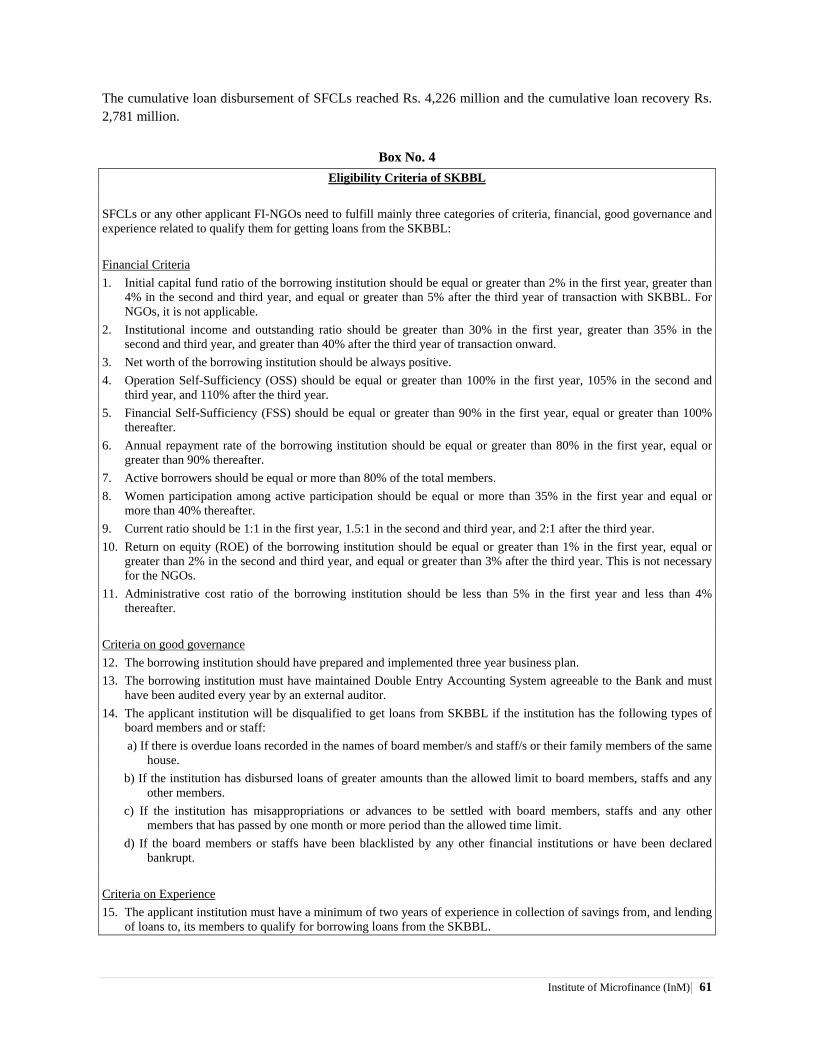
Institute of Microfinance (InM)| 61
The cumulative loan disbursement of SFCLs reached Rs. 4,226 million and the cumulative loan recovery Rs. 2,781 million.
Box No. 4 Eligibility Criteria of SKBBL
SFCLs or any other applicant FI-NGOs need to fulfill mainly three categories of criteria, financial, good governance and experience related to qualify them for getting loans from the SKBBL: Financial Criteria 1. Initial capital fund ratio of the borrowing institution should be equal or greater than 2% in the first year, greater than
4% in the second and third year, and equal or greater than 5% after the third year of transaction with SKBBL. For NGOs, it is not applicable.
2. Institutional income and outstanding ratio should be greater than 30% in the first year, greater than 35% in the second and third year, and greater than 40% after the third year of transaction onward.
3. Net worth of the borrowing institution should be always positive. 4. Operation Self-Sufficiency (OSS) should be equal or greater than 100% in the first year, 105% in the second and
third year, and 110% after the third year. 5. Financial Self-Sufficiency (FSS) should be equal or greater than 90% in the first year, equal or greater than 100%
thereafter. 6. Annual repayment rate of the borrowing institution should be equal or greater than 80% in the first year, equal or
greater than 90% thereafter. 7. Active borrowers should be equal or more than 80% of the total members. 8. Women participation among active participation should be equal or more than 35% in the first year and equal or
more than 40% thereafter. 9. Current ratio should be 1:1 in the first year, 1.5:1 in the second and third year, and 2:1 after the third year. 10. Return on equity (ROE) of the borrowing institution should be equal or greater than 1% in the first year, equal or
greater than 2% in the second and third year, and equal or greater than 3% after the third year. This is not necessary for the NGOs.
11. Administrative cost ratio of the borrowing institution should be less than 5% in the first year and less than 4% thereafter.
Criteria on good governance 12. The borrowing institution should have prepared and implemented three year business plan. 13. The borrowing institution must have maintained Double Entry Accounting System agreeable to the Bank and must
have been audited every year by an external auditor. 14. The applicant institution will be disqualified to get loans from SKBBL if the institution has the following types of
board members and or staff: a) If there is overdue loans recorded in the names of board member/s and staff/s or their family members of the same
house. b) If the institution has disbursed loans of greater amounts than the allowed limit to board members, staffs and any
other members. c) If the institution has misappropriations or advances to be settled with board members, staffs and any other
members that has passed by one month or more period than the allowed time limit. d) If the board members or staffs have been blacklisted by any other financial institutions or have been declared
bankrupt. Criteria on Experience 15. The applicant institution must have a minimum of two years of experience in collection of savings from, and lending
of loans to, its members to qualify for borrowing loans from the SKBBL.

62 | State of Microfinance in Nepal
On mid-July 2008, the outstanding loan remained at Rs. 1,443 million and the overdue amount at Rs. 88 million, which is 6% of the outstanding amount. Member savings also increased from Rs. 151.63 million in 2003 to Rs. 916.18 million in 2008 – 63.38% of the outstanding amount. This indicates that SFCLs if run properly could meet their fund requirement for lending through their own internal savings mobilization. For details see Table 28 below.
Table28: Outreach and Loan Performance of SFCLs Amounts in “000”
Year No of SFCL
No. of Members
No. of Borrowers
Loan Disbursed
Loan Outstanding
Loan Recovered
Loan Overdue
Member savings
R.R %
2003 58 38331 30665 566965 474852 92113 0 151634 73 2004 94 58273 46618 489269 702358 261761 20439 215188 82 2005 114 71007 56806 537778 860144 379994 49178 297324 81 2006 141 85730 68584 641315 959789 541670 53167 433033 85 2007 219 129851 103881 1076955 1379480 657264 53306 727187 85 2008 220 139368 111494 912332 1443425 848387 87688 916183 85 Cum. loan disbursed and recovered 4224614 - 2781189 -
Note: R.R = Repayment Rate
Last year (2008/09), the government announced waiver of loans to the small farmers up to Rs. 30,000. The overdue loans which amounted about 10% of outstanding in December 2008 came down to 0% after the government replenished the waived loans in July 2009. But, this has created a serious problem in the clients’ psychology. They would wait for such waiver from the government in the future as well. It would pose a great difficulty to collect the loans in the future. Therefore, the SKBBL is to devise and enforce a mechanism that would put down the aspirations of the ultimate clients for loan waiver.
Statistics as of July 2008, the total expenditures of SKBBL recorded Rs. 163 million, total assets valued at Rs. 1,735 million, total capital Rs. 238 million, total member savings Rs. 42 million, and total borrowings Rs. 1,231 million.
The return on equity is positive for the last three years and is found increasing from a level of 0.4% in 2005-06 to 3.0% in 2007-08. Similarly, return on asset is also positive and increasing though the value is small in figures indicating positive but less profits in last three years. The SKBBL charges 9% interest to the SFCLs but the yield on loan portfolio for the three years is below the interest charged indicating the existence of huge sums of overdue loans. However, Table 29 indicates a trend of improvement in Yield on Loan Portfolio (YLP) coming closer to the interest rate charged by it. Operating efficiency is also positive and is greater than one. The repayment rate for the three years as shown in the table has taken a zigzag route, first improving and then deteriorating from 89.2% to 92.5% and down to 91.6%. The value of operational self-sufficiency is positive and improving from a level of 100.8% in 2005-06 to 107% in 2007-08.
The non-performing loan as indicated in the table below is also taking a zigzag route, first declined from 6.8% to 4% and again increased to 5.4% in the FY 2007-08. It indicates the increase in overdue loans for which the bank has provisioned loan loss reserve of 3.3% in the FY 2005-06, 3.9% in FY 2006-07 and 5.3% in FY 2007-08 almost equal to the non-performing loan 5.3% (see Table 29).
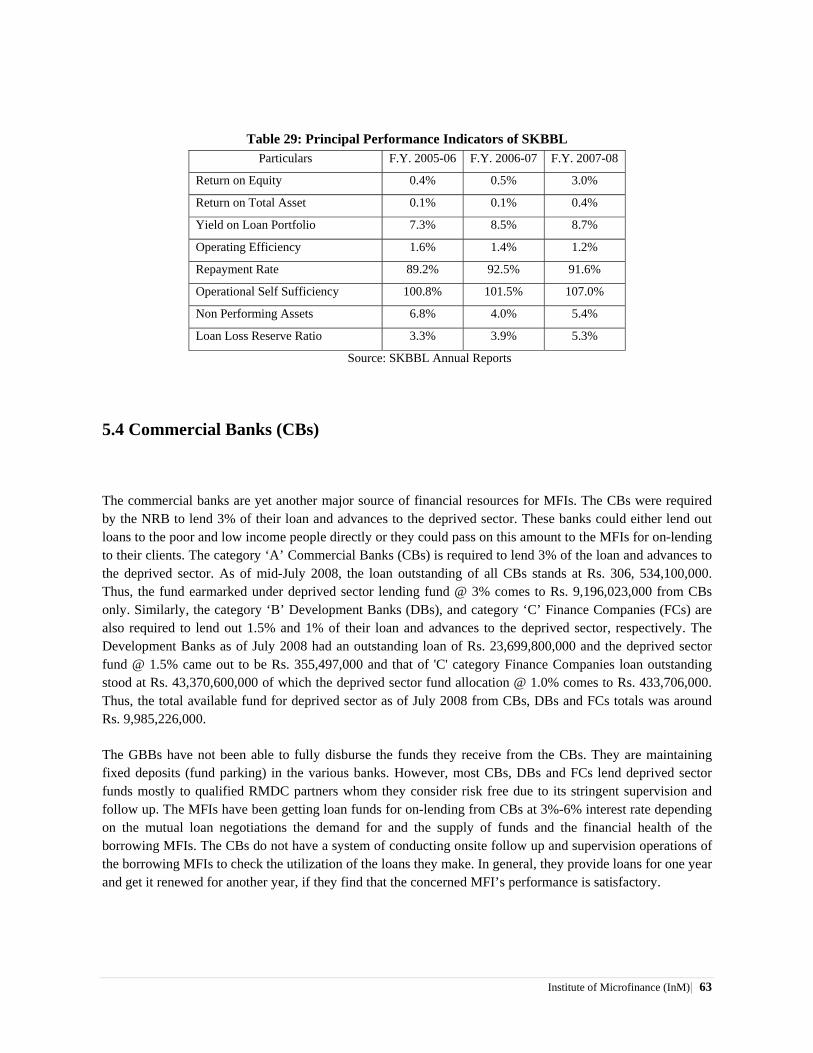
Institute of Microfinance (InM)| 63
Table 29: Principal Performance Indicators of SKBBL Particulars F.Y. 2005-06 F.Y. 2006-07 F.Y. 2007-08
Return on Equity 0.4% 0.5% 3.0%
Return on Total Asset 0.1% 0.1% 0.4%
Yield on Loan Portfolio 7.3% 8.5% 8.7%
Operating Efficiency 1.6% 1.4% 1.2%
Repayment Rate 89.2% 92.5% 91.6%
Operational Self Sufficiency 100.8% 101.5% 107.0%
Non Performing Assets 6.8% 4.0% 5.4%
Loan Loss Reserve Ratio 3.3% 3.9% 5.3%
Source: SKBBL Annual Reports
5.4 Commercial Banks (CBs)
The commercial banks are yet another major source of financial resources for MFIs. The CBs were required by the NRB to lend 3% of their loan and advances to the deprived sector. These banks could either lend out loans to the poor and low income people directly or they could pass on this amount to the MFIs for on-lending to their clients. The category ‘A’ Commercial Banks (CBs) is required to lend 3% of the loan and advances to the deprived sector. As of mid-July 2008, the loan outstanding of all CBs stands at Rs. 306, 534,100,000. Thus, the fund earmarked under deprived sector lending fund @ 3% comes to Rs. 9,196,023,000 from CBs only. Similarly, the category ‘B’ Development Banks (DBs), and category ‘C’ Finance Companies (FCs) are also required to lend out 1.5% and 1% of their loan and advances to the deprived sector, respectively. The Development Banks as of July 2008 had an outstanding loan of Rs. 23,699,800,000 and the deprived sector fund @ 1.5% came out to be Rs. 355,497,000 and that of 'C' category Finance Companies loan outstanding stood at Rs. 43,370,600,000 of which the deprived sector fund allocation @ 1.0% comes to Rs. 433,706,000. Thus, the total available fund for deprived sector as of July 2008 from CBs, DBs and FCs totals was around Rs. 9,985,226,000.
The GBBs have not been able to fully disburse the funds they receive from the CBs. They are maintaining fixed deposits (fund parking) in the various banks. However, most CBs, DBs and FCs lend deprived sector funds mostly to qualified RMDC partners whom they consider risk free due to its stringent supervision and follow up. The MFIs have been getting loan funds for on-lending from CBs at 3%-6% interest rate depending on the mutual loan negotiations the demand for and the supply of funds and the financial health of the borrowing MFIs. The CBs do not have a system of conducting onsite follow up and supervision operations of the borrowing MFIs to check the utilization of the loans they make. In general, they provide loans for one year and get it renewed for another year, if they find that the concerned MFI’s performance is satisfactory.
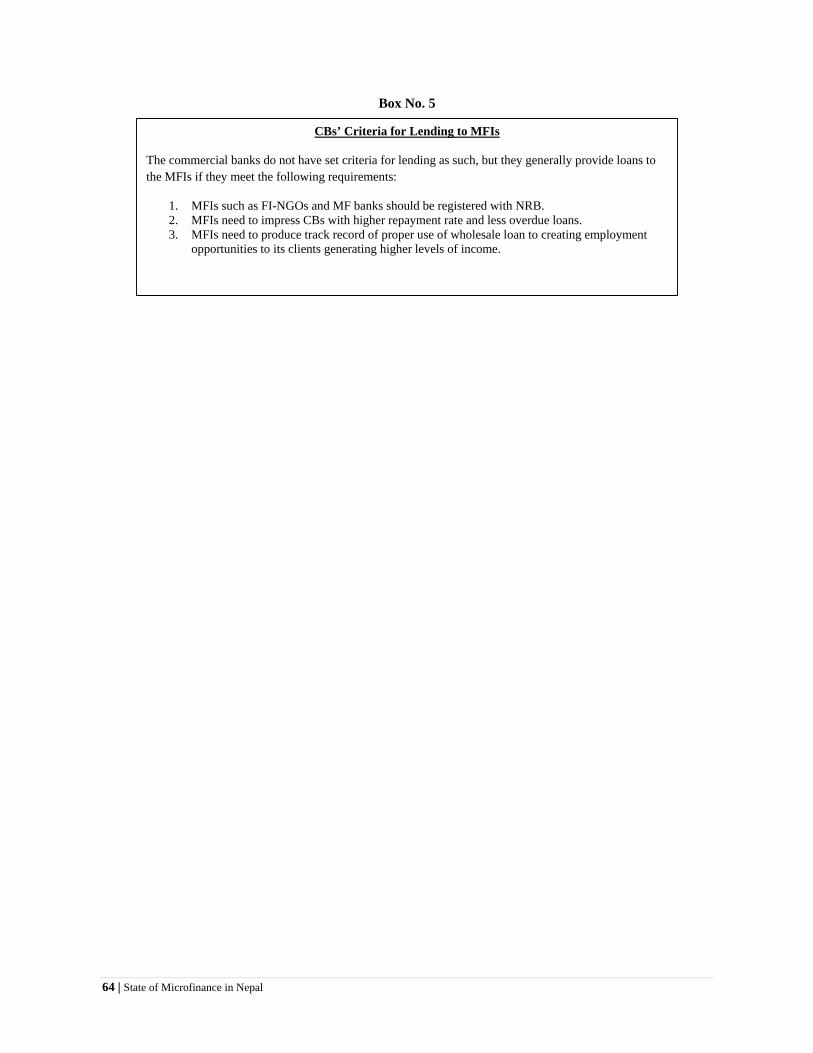
64 | State of Microfinance in Nepal
Box No. 5
CBs’ Criteria for Lending to MFIs
The commercial banks do not have set criteria for lending as such, but they generally provide loans to the MFIs if they meet the following requirements:
1. MFIs such as FI-NGOs and MF banks should be registered with NRB. 2. MFIs need to impress CBs with higher repayment rate and less overdue loans. 3. MFIs need to produce track record of proper use of wholesale loan to creating employment
opportunities to its clients generating higher levels of income.
Institute of Microfinance (InM)| 65
Chapter VI: Interest Rate Policy and Practice
6.1 Interest Rate Policy
Interest rate is a determining factor for the success or sustainability of the microfinance operation. In the early years of the banking operations, interest rates were controlled by the central bank. However, for last two decades the banks and the financial institutions have been given freedom to set interest rates on their own.
The Cooperative Society Act 1992 allows cooperatives to fix and apply their own interest rates on the loans extended to their members and the deposits collected from the members. Similarly, Financial Intermediaries Act 1998 allows the FIs to fix interests rates on loans and deposits on their own. The NRB Directives, 2003 also provide freedom to Microfinance Development Banks (MFDBs) to fix and apply interest rates of their own on loans to, and saving deposits from, their members. However, the NRB Act 2002, in case of the Rural Self-Reliance Fund (RSRF), has specified the interest rates for its borrower cooperatives and NGOs, which is far below the market rates. This has to some extent distorted the market interest rates.
6.2 Common Practices
The FI-NGOs and the microfinance banks licensed by the NRB, can accept saving deposits from their members. The reputed NGO-MFIs can borrow loans at cheap rates (5% - 7%) from the commercial banks under deprived sector lending program. However, these funds are becoming scarcer these days due to the central bank's recent policy decision of considering the fund deposited in the Youth Self-Employment Fund (YSEF) also as deprived sector lending.
In general, the MFIs are free to charge any rate of interest on loans to their clients. The regulation does not cap the ceiling. In other words, interest rate is deregulated by the NRB. Some FI-NGOs are charging as low as 18% per annum (Deprosc), while others are charging interest between 20 to 25% per annum. The government owned GBBs are charging 20% interest rate per annum on the loans to their clients. Four out of five GBBs have now been privatized. The private microfinance development banks are charging interest on loans to their clients at a range between 20%-25% per annum. Considering the cost of transactions, some private microfinance banks (Nirdhan and Chhimek) have started financial transactions at their branch offices for reducing the cost of loan administration.
The rate of interest charged by the Nepalese MFIs is lower compared to the rates charged by the MFI in India, Bangladesh, the Philippines, and Indonesia etc. The MFIs in Nepal have been providing interest rates on saving deposits of their members ranged from 5% to 8% per annum. Interest is capitalized in every 6 months (January and July) during bi-annual closing of their transactions. Some MFIs have introduced other savings schemes like pension fund, child education, etc. and have given interest up to 10% per annum.

66 | State of Microfinance in Nepal
In case of SHGs, groups themselves set the interest rates on loans to their member borrowers. It is normally 2% per month i.e. 24% per annum. In isolated cases, the SHGs also charge 3% interest per month i.e. 36% per annum. The source of funds for lending in case of SHGs is mainly member savings. In Village Bank model, the members who have savings in the bank do not get interest on their deposits. But the VB distributes the profit at the end of every four months, when the banks make their balance sheets nil by collecting all loans with due interest and paying out all deposits with interest.
6.3 Method of Charging Interest
Initially most of the MFIs charged interest on flat basis. Now, most of them have changed the practice and are charging on declining balance basis. Interest charged on declining basis has kept the clients satisfied. Some MFIs have adopted flat rate system to maintain equal monthly installments (EMI) and simplification of interest calculation. This is an amortization method, whereby the clients will pay equal amount in each installment from the beginning to the end. However, there is not much difference in interest amount collection in the two methods.
6.4 Interest Rate Charged by Wholesale Lenders
There are mainly three wholesale lending institutions in microfinance sector. They are Rural Self-Reliance Fund (RSRF), Rural Microfinance Development Centre (RMDC), Sana Kisan Bikas Bank (SKBBL) and the commercial banks.
RSRF operated by NRB has been providing loans to only Cooperatives & FI-NGOs. It also lends to the tea estates. The rate of interest charged by this Fund is 8% per annum. The Fund, however, returns 6% of the collected interest to the respective MFIs for meeting their operating expenses if they pay their loans on time. Hence the effective rate is only 2% per annum. This has distorted the market rate to some extent. The sources of funds for this Fund are grants received from the government and the NRB.
RMDC provides wholesale loans to its partner organizations at 6% interest per annum for general loans and at 5% per annum for livestock loans under Community Livestock Development Project (CLDP). There is a big margin for its POs in the interest earning. The POs charge between 20% - 25%, while RMDC charges them only with 6%. RMDC does not accept saving deposits from POs or the general public. Its funding sources come from ADB loans, some government grants and share capital reserves and retained earnings. It pays 2% interest to the government for ADB loans. In times of need, it can also borrow loans from the commercial banks
SKBBL provides loans to mainly Small Farmers Cooperatives (SFCLs). It can also provide loans to other MFIs such as FI-NGOs. It charges an interest rate of 9.5% per annum, while for its clients, SFCLs charge an interest rate of 13% per annum to the ultimate borrowers. The SKBBL uses its share capital the loan from the Agriculture Development Bank Limited and the commercial banks for financing its clients SFCLs.

Institute of Microfinance (InM)| 67
The commercial banks charge 3-6% interest per annum on wholesale loans to MFIs depending on the urgency of their disbursement to meet the 3% deprived sector lending requirement. They have to make their requirement met each quarter of the fiscal year; else they have to pay penalty to the central bank at the rate of the highest rate of interest they charge on their loans to individual borrowers. They extend loans to MFIs generally for one year and further extension or renewal is made for another one year after expiry of each loan.
6.5 Interest Rate vis-à-vis Borrowing Cost
In some corners of bureaucracy and elites circles, it is often raised that the interest rate on loans to the poor are charged higher by MFIs than on the loans to the rich by commercial banks. However, the fact is that the loans from the banks are not easily available to them. The poor cannot provide required collateral for loans. Besides, even in cases, where collateral is offered, the formalities of the banks are too exhaustive and cumbersome for the poor to fulfill and also quite expensive when other costs such as transportation, days of labor loss, food cost, document cost, commission, fees and other miscellaneous cost are calculated and added to interest as total cost of borrowing. Although the rate of interest as such looks slightly lower, the total cost of borrowing from a commercial bank comes out significantly high for the micro borrowers. As the MFIs provide loans at their doorsteps with minimum formalities, they do not need to incur any other cost other than interest. Hence, it is quite cheaper for the poor to borrow from MFIs at slightly higher interest rate than the banks. The microfinance borrowers feel comfortable with the rate of interest charged by the MFIs. Since their loans are small, interest cost is not figured out much in their total cost of business operation. Low rate of interest will cause losses to MFIs, which will push them out of their business and will ultimately deprive the poor from financial services.

68 | State of Microfinance in Nepal
Chapter VII: Impact Assessment
7.1 Study Report of the 'Centre for Policy Studies and Rural Development'
A very few researches have been undertaken in the past for measuring the impact of microfinance in Nepal. In 2004, National Planning Commission (NPC) had funded a study to assess the impact of micro-credit program on poverty reduction. The study was designed to assess the access of the poor to the institutional credit, to examine the effectiveness of the credit in helping to graduate the poor from absolute income poverty, to evaluate the social indicators of benefits from the microfinance services, to assess effectiveness of the program in gender development and empowerment, and to review the sustainability of MFIs in general. The Centre for Policy Studies and Rural Development, Kathmandu conducted the study. The study was based on both primary and secondary data, and focused on measuring impact on outreach of microfinance programs and their coverage of the poor, social and economic changes noticed among beneficiaries, gender empowerment, and sustainability of microfinance institutions. The study covered six districts – three hills and three Terai, and covered both the private and the government supported microfinance institutions. Altogether, 479 client samples were examined for collecting primary data.
The study estimated the outreach of microfinance covering 35.25% of the poor. However, the outreach was not confined to the poorest of the poor, as they constitute only 68.6% of the total microfinance borrowers. It is interesting to note that 84.1% of the sample reported that they could make profit from the first loan and receive profits at decreasing rates from the succeeding loans. A small proportion of sampled households (24.4%) also felt improvement in their social and economic conditions after their participation in the microfinance programs.
A change in principal occupation among the sampled households was also noticed particularly from agriculture to petty trading. Dependence on agriculture reduced from 56% to 48%, while dependence on petty trading increased from 11.1% to 32.2%. The respondents witnessed some positive changes in their possession of assets like better-roofed houses, radio, television, bicycles, hand-pumps, etc. They also noticed improvement in their food self-sufficiency status after enrolling in the microfinance programs. The frequency of consumption of nutritious food items, such as fruits, eggs, meat and fish has also increased.
Due to the program efforts, the literacy rate among the members of microfinance programs has risen from 52% to 89.8%. The proportion of the respondents knowing about HIV/AIDS and its transmission mode has also been found increased and many of them were made aware by the microfinance programs about their health care facilities.
With the program, the gender division of works is also getting less value and the men also started performing activities which were considered to be the responsibility of only women, such as cooking, washing utensils, taking care of babies, etc. The percentage of women reporting the increased control over income has also increased from 13.3% to 19.1%. However, this study has indicated that microfinance programs have not been effective in contributing to the reduction of poverty level as MFIs have not been able to extend their outreach to the ultra poor and the poor in the hills.
Institute of Microfinance (InM)| 69
7.2 Study Report of 'SAP-INAFI Nepal'
SAP-INAFI Nepal also had conducted a similar study “Impact of Microfinance Services on Poverty Reduction in Nepal” in 2006. Again, the study was focused on outreach of microfinance, access, use and contribution of microfinance, micro-enterprise development, managing risks and vulnerabilities, empowerment of women, and poverty reduction. The study used ‘before and after’ and ‘with and without’ approaches to measure the impact.
The study reported that microfinance has a positive impact on poverty reduction, as it provided easy access to financial services for the poor to undertake income generation activities. Such programs have also enabled the poor to better address vulnerability and take further risks, as they are made economically more empowered through successive loans and skill enhancing trainings. The study found 56% of respondents able to increase their income levels. The study also found that 66% of microfinance funds are used for productive purposes while 36% are used for consumption purposes. Microfinance has also reduced the dependence of the poor on village moneylenders.
7.3 Study Report by RMDC
RMDC has also initiated an impact study of microfinance program on the socio-economic dimensions of the clients of its partner organizations in order to see whether the objective of improving socio-economic conditions of the ultimate clients has been attained or is being attained. The study has focused on impacts of microfinance services on (i) loan transactions from various sources, (ii) income-source-wise investment, income and savings, (iii) living and non-living assets, (iv) food self-sufficiency and nutritious food consumption, (v) clothing and housing type, (vi) health care measures and education of children, and (vii) participation in social and political events, and empowerment of women. The study sample included 192 respondents of the 200 sample of ultimate beneficiaries from eight microfinance institutions that include: Swabalamban Laghubitta Bikas Bank Ltd., NRDSC, Manushi, Nepal Mahila Utthan Kendra, Jeevan Bikas Samaj, FORWARD, Mahila Sahayogi Sahakari, and Centre for Self help Development.
It has revealed positive improvements in investment, income received, and savings made through activities undertaken with the increased funding support in successive years. Assets, both living and non-living, were found to have increased both in terms of quantity and value. Food self-sufficiency situation did improve remarkably when compared to situation before participation in the MF program. Number of daily food intake and frequency of nutritious food intake per month were also found greatly impacted by the program. There is also remarkable improvement in housing, health care, and education of children. Improvements were also observed in participation in social and political events and found significant positive changes in the empowerment of women members on the whole. The impact on various aspects has been presented as follows.

70 | State of Microfinance in Nepal
a. Loans
After three or more years of participation in the microfinance program, the reliability on moneylenders and relatives have decreased by 69% and 65%, respectively due to the availability of the needed loans from MFIs. Correspondingly, loan repayment necessity met by moneylenders and relatives also has decreased by 85% and 47%, respectively. Loans from the MFIs have increased by 1413%. It may be due to three reasons, (1) the clients’ capacity has increased to demand more loans than MF program could provide in successive years, (2) the increased earning capacity and added assets have improved the credibility of the client.
b. Income and Savings
For the participating households, family income from crops has increased by 83%, from livestock by 388%, services by 246% and cottage industries by 645%, trade by 207% and others by 511%. There is also a remarkable increase in the total household level investment, received income and savings of the respondent women. Accordingly, there is noticed an increase of investment by Rs. 80,540 (219%) from Rs. 36,789 to Rs. 117,329, an increase of received income by Rs. 128,655 (250%) from Rs. 51,434 to Rs. 180,089, and an increase of savings by Rs. 53,896 (286%) from Rs. 18,844 to Rs. 72,740. Savings deposit in banks increases by Rs. 9,110, at MFI by Rs. 8,860 and at home by Rs. 6,130.
c. Living & non-living assets
Impact on holding of living and non-living assets has also remarkably increased after three or more years of participation in the MF program. It is noticed that, the numbers of holding goats, buffaloes, cows, pigs, ducks and chicken have increased by 161%, 78%, 120%, 388%, 126% and 146%, respectively. Increase in the value of these livestock also follows the same pattern. The value of non-living assets like radio, TV, utensils, gold ornaments and furniture has increased by 248%, 304%, 717%, 252% and 296%, respectively.
d. Housing and land
The number of thatched houses has reduced by 65%, tile houses increased by 10%, corrugated houses increased by 153% and RCC roofed houses increased by 292% after participation in MF for three or more years. Land holding size has also increased by 61% and value by 86% as compared to situations before participation in the MF program. However, land value increase may not reflect the real impact. With the passage of time; inflation and development activities near the land also does contribute to the increase in land value.

Institute of Microfinance (InM)| 71
e. Food self sufficiency, nutritious food and clothing
Increases in income and assets would not be sufficient to measure changes in living standard if required changes in consumption of nutritious food intake, clothing, health and sanitation, and education of children are not correspondingly taking place. Food self sufficiency for 12 months through own production and income has improved from a level of 31% households before participation in the MF program to 85% households after participation for 3 or more years. The deficit months are financed through hard earned wages, kind and cash, working in others’ houses or field, and through loans. Daily food intake has increased from an average of 2.3 times before participation to 2.71 times per day after 3 or more years of participation in the MF program. Similarly, consumption of meat (times), milk (liters), eggs (number), fruits (kg) and other nutritious food (kg) per month also has increased by 109%, 105%, 164%, 216%, and 165%, respectively.
f. Health care measures
There are significant changes observed in the use of safe drinking water, sanitary toilets, use of vaccines and medicines such as DPT, Polio, Vitamin A, and a number of visits to doctor in a year. Before, only 29% of respondents used safe water but now 67% of them use safe water. With regard to use of sanitary toilets also, the figure for users has increased from 25% before participation in the MF program to 69% after 3 or more years of participation. Administration of DPT, Polio and Vitamin A to the children below 5 years has also almost doubled now as compared to the past. However, there are only gradual changes with regard to addiction to drugs. Smoking cigarette reduced from 39% to 27%, chewing tobacco from 36% to 27% and drinking alcohol from 27% to 20% only.
g. Women Empowerment
The MF program also helped to empower women primarily through economic improvements and gradually through involving them in social and political activities. The study has made an attempt to quantify improvements in their participation in social, political and empowerment activities. Under social activities, changes were observed with respect to their participation in community works, feeling of untouchables, respect from family and society, and access to institutions. Under political activities changes were observed with respect to membership in political organization, participation in awareness campaigns, delivering public speeches and feeling of leadership development. Changes were observed in topics like access to resources, improvement in speaking ability, decision making at household level and overall empowerment.
h. Social changes
There has been a big change in participation in community works, feeling of untouchables reduced from 74% yes to 21% yes, respect from family and society has increased from 36% to 96% and access to institutions from 9% to 78%. There is a negligible improvement in political representation (2%) as the study period coincides with the conflict period without any elections taking place. Participation in awareness campaigns and in public meeting has increased significantly. Feeling of leadership development has improved from 8% to 88%. With regard to empowerment and access to resources they seem to have improved 21% to 79%,

72 | State of Microfinance in Nepal
speaking ability from 9% to 94%, decision making from 32% to 91%, from before participation in MF program to 3 or more years after participation.
This kind of impact studies need to be conducted from time to time to draw lessons for improvement of microfinance operations. It is desirable to have large samples covering all representative districts to come up with comprehensive outcomes. It is also suggested to segregate data analysis for Terai, hills and remote high mountains, such that way forward strategies for different geophysical and social dimensions are generated for effective implementation of microfinance programs without missing the downtrodden in the target groups.
Thus, on the whole, the impact of microfinance is observed as shown in the box provided below:
Box No. 6
Impacts of Microfinance on the Client
• Empowered the women socially and economically. • Enhanced confidence level of the women. • Enhanced leadership capability of the women. • Enhanced dignity of the women and their family. • Created self-employment opportunities for the poor and the women. • Increased household income and assets of the poor families. • Improved entrepreneurship and occupational skills of the women and their family members. • Increased school enrollment of the children of the poor families. • Improved food security of the poor families. • Improved health conditions of the children and the women. • Increased social development activities among the poor.
7.4 Case Stories
a. Case-1: Microfinance leads Sharmila out of poverty trap
Nakale Tamang, the husband of Sharmila Tamang was a wage earner and had been supporting his family with much difficulty. Nakale was frustrated with his weak economic conditions. He had dreamt to bring up his family of six members including two sons and two daughters with adequate nutritious food, good clothing and good education in Goldhunga, Kathmandu. Sharmila and Nakale, together with their children were living in a small hut. Sharmila had no other source of income except her husband’s wage income.
One day she learnt that Manushi – a microfinance institution has been operating microcredit program at Goldhunga VDC, Kathmandu. Many friends of Sharmila also have been taking loans from the program. After a few weeks, she also joined the microfinance program by forming a group along with a few others and became one of the beneficiaries. She got an opportunity to participate in the pre-group training. In the beginning, she was scared of taking loans, but on the advices of her husband she asked for a loan of Rs. 10,000 in the month of January 2003. With the loan money she opened a small teashop near her home. She also started selling fresh vegetable in the morning and selling snacks and tea during the daytime. She also
Institute of Microfinance (InM)| 73
added new items such as noodles and biscuits in her shop. Sharmila and her husband started working together in the shop, and stopped working as day laborers. They could save some money after meeting the family expenses and repayment of loan installments. Earlier, they had a problem of making their ends meet. Sometimes, they had to go to bed without adequate food. Now, they do not have to worry about this. They now send their children to the school and feel proud in the society. The villagers saw a big change in Sharmila’s life after she joined microfinance program. She used her first, second and third loans and paid back all loans in time. Now, she has taken her fourth loan of Rs. 25,000 and has added wide range of new food items in her shop and also has been operating small restaurant serving meals in the morning and evening hours.
The microfinance program has brought a great change in her life. Now, her neighbors treat her better. She said that with the added income generated from her teashop and small restaurant, she has renovated her house, and also been able to meet expenses of her daughter’s marriage. Likewise, her husband has purchased a new motorbike with the increased income. Her days of poverty and hardships have gone and she looks forward to a prosperous and happy family life.
b. Case-2: Micro Credit Made Priya Rajbanshi a Successful Entrepreneur
Confident and hard working woman Mrs. Priya Rajbanshi was born in India and married to a man at Dadarbairiya, Morang, Nepal. She lost her father at the early age and her mother brought up three sisters and a brother with her wage earning. It was too difficult for her mother to support them and therefore, Priya left her study at fifth grade and started working as a wage earner. She is skilled to make tika from stone and could earn Rs. 50-60 per day. Due to the lack of resource and means to start her own business, she joined a factory and worked there. She fell in love with the foreigner working in the factory named Mr. Promod Rajbanshi and married with him. Since the man she married was a poor guy her life became more difficult. The earning of her husband from the factory was not enough to have two meals a day. Hence, she started a small teashop in the village. However, the income from village teashop was not satisfactory, and thus, she had taken a loan from a moneylender and opened a tea and snacks shop in Biratnagar. Unfortunately, her husband became sick and she had to shut down the shop and had to take more loans for treatment. Priya had to undergo the saddest time in her life. She had to take care of the sick husband on the one hand and look after two children on the other. During festivities, she had to endure a pain for not being able to wear new clothes and provide good food and clothes to her children. About that time, she learnt about Jeevan Bikas Samaj’s microfinance program at Dadarbairiya. In the beginning, it was very difficult for her to be recognized by her neighbors as a member of the group; however, they later sympathetically accepted her as a member.
In the month of June 2005, Priya got the first loan of Rs. 5,000 from Jeevan Bikas Samaj and opened a tea and snacks shop at Dadarbairiya Chowk (crossing) and the couple started working hard in the shop. During winter months, they sell hot tea and bhakka – a hot food item made of rice. With the income, Priya could repay her loans amounting Rs. 30,000 from moneylender and Rs. 5,000 from Jeevan Bikas in time. Besides, she could also buy 2.19 gram gold and a TV set. Her compatriots who were hesitant to accept her membership now are surprised to see her progress. She was able to earn sufficient money to clear loans within a year and built some assets as well. They have now chosen her as their Centre Chief. With her second loan from Jeevan Bikas Samaj of Rs. 10,000 she purchased furniture for her shop and the capital of her shop has increased to Rs. 20,000. With her third loan of Rs. 15,000 she has added more furniture and other equipments needed to expand her business. Now, all her family members are happy. Her husband Promod Rajbanshi with tears of joy states “If we were not supported by Jeevan Bikas Samaj, our lives would have not been improved”. They

74 | State of Microfinance in Nepal
express heartfelt gratitude to Jeevan Bikas Samaj for its financial support that enabled them to become an entrepreneur.
c. Case-3: Microcredit Helped Suhagdevi Dhobi to Live a Life of Dignity
Suhagdevi Dhobi, a laborious woman, aged 45 belongs to a very poor family living in Bengadabar VDC Ward No. 6 of Dhanusha district. Her family did not have any land nor did they have a house to stay in. They were living in others’ cattle shed and were engaged in selling their labor for daily wage. About seven years ago, Suhagdevi heard from the women attending pre-group training that SB Bank was operating microfinance program in their area. She was not sure whether she could join the group and get loans. She first approached the Centre No. 12 with an objective to become a member of the group just for group savings. After the group accepted her as a member, she saw that other members were also poor like her and had taken loans for various purposes and had been repaying loans through their earnings. This had encouraged her and she was successful to convince other group members to recommend a loan for her as well.
In the year 2000 she obtained a loan amounting Rs. 3,000 to buy four goats. She repaid the loan installments easily with wages earned by her family members. She took 2nd loan of Rs. 10,000 and sold goats worth Rs. 4,000 and purchased 0.033 hector of land. This loan was also repaid with wage earnings of the three family members. Again, she took her third loan of Rs. 13,000 and constructed a house made of tiles and bamboo. She and her family started living in their own house with dignity. Suhagdevi then took 4th loan and purchased a cart of Rs. 5,000 for her husband and kept the rest of money as savings. Her son also learned centering work and started earning Rs. 100 daily with free food. Her husband also earned Rs. 100 everyday from the cart. With the fifth loan and their family savings, she brought another 0.037 hector land. With seven loans amounting to Rs. 100,000, her family has turned from landless to a family with a piece land, a house, a buffalo, a cart, and other possessions. She proudly feels that her family got well recognized in the society with the support she received from SB Bank.
Her family was very poor and was uneducated. SB Bank created awareness in her about the need of education to children and encouraged her to send children to primary school. With SB Bank support, she now can speak in front of other people. It also taught her to cultivate and earn more from farming. She never forgets the support received from SB Bank which helped her to transform from a landless to a family with assets like house, land and other living and non-living belongings and have dignity in the society.
d. Case-4: PAF is like the God for the Destitute
Man Bahadur Bogati lives in Dashrathe Tole, Ward No. 9, Bhawani VDC, Dailekh district in the mid-western development region. He has a wife and a son. He has only 0.05 ha of un-irrigated upland, which produces about 50 kg of grains per year giving his family enough to eat for less than a month. He had been surviving somehow with the help of two skills that he possessed – 1] collecting firewood from the forest and selling it in the market, and 2] a little bit of knowledge of palmistry (fortune telling) that he claims to know. The former is the obvious mainstay of his livelihood because he has been doing this almost every day. The second profession is considered dubious and only a few people visit him for this skill. The reason is this – the fortuneteller must suggest means to avert the possible danger or omen in the future. When Man Bahadur himself has not been able to progress in his life, how can his advice be meaningful for others? Moreover, his

Institute of Microfinance (InM)| 75
wife has psychiatric problems, which he has not been able to solve with his second skill. Nevertheless, he has been using these skills to gather 2 kg of rice per day and some cash to run his house with occasional failures when he is not feeling well.
Man Bahadur easily qualified for PAF support because of his extreme poverty and food insecurity. This was the first meaningful external support in his life. He became a member of the community organization and asked for a Rs. 8,000 loan from the revolving fund for goat keeping and another Rs. 1,000 for local poultry rearing. From this loan, he bought five adult female goats and seven local chickens. Since rearing local goats and chickens was not a new profession for him, there was no need for training. Only the scale was much bigger this time due to the availability of the loan. In the past, he had raised a maximum of two goats and three chickens and the outputs were disposed of quickly for meeting the household expenditures. Now he is taking good care of his new assets himself by curtailing the time for firewood collection. Within nine months the number of goats and chicken reached nine and 12 respectively besides two male goats and 10 chickens sold. He would keep the female goats to increase the herd and sell the male goats.
Life has become a little more comfortable with enough income to feed the family throughout the year. From mobilization and awareness, he also learnt that it would be more profitable to grow potatoes in his small piece of land than to grow low yielding traditional cereal crops, maize and millets. He paid part of the old loan and borrowed another Rs. 1,500 to grow potatoes. In a single season, he discovered that potato growing was monetarily eight times more rewarding than the cereal crops that he used to grow. The potato production itself now provided enough income for about six months of food security. This new knowledge has helped him to plan for extending potato cultivation in the rented land until he will be able to buy his own new land. He has been foreseeing new vistas of opportunities in life. He also learnt that the two new enterprises that he has adopted are in-fact complementary. Goat manure and chicken droppings were extremely useful for potato farming while the income from potatoes could finance the cash cost of goat and chicken rearing besides some by-products used as feed.
He uttered a gratifying note that PAF support has converted him from a low level firewood-selling job to that of a respectful profession, which is easier and more rewarding. According to him, PAF is truly the god for the destitute.

76 | State of Microfinance in Nepal
Chapter VIII: Policy, Legal and Regulatory Framework
8.1 Microfinance Policy
The history of microfinance in Nepal is over three decades old. However, there was not any stated policy of the government on microfinance prior to the announcement of the microfinance policy by the Ministry of Finance of the Government of Nepal in 2008.
The demand for microfinance services by the poor and the destitute is ever increasing in the country. In light of the tremendous achievements made by the countries such as Bangladesh, India, the Philippines, Indonesia, Pakistan and other developing countries in the reduction of poverty through massive flow of financial services down to the poorest segment of the rural and the semi urban communities, the government of Nepal, on the advice of the Nepal Rastra Bank promulgated “National Microfinance Policy, 2008” in order to do away with the problems related to organizational and legal issues with a view to smoothly providing microfinance services in the rural areas, increasing the access of the destitute class to such services, creating a healthy and competitive atmosphere among MFIs, and encouraging the private sector to get involved in the task of providing such services on a sustainable basis, Microfinance Policy, 2008 was introduced as a new mechanism to boost up microfinance industry. It aims to improve the smooth flow of funds to the poorest segment of the rural populace by creating national fund for microfinance. It also has envisaged establishing a regulatory and supervisory body for regulating and supervising the MFIs in the country as such that they discharge their services effectively and efficiently. The highlights of the policy are as follows:
1. Enhance the supply of microfinance services to the rural and urban poor to suit to their geographical, social and economic diversity.
2. Improve the smooth flow of microfinance services with or without collateral (group guarantee) to the poor and the destitute by establishing a standard procedure for identifying the target groups.
3. The government will provide necessary help to the microfinance institutions for social mobilization, capacity development, organizational development, re-structuring, and also will encourage wholesale micro credit providers both from public as well as private sectors.
4. The government will also integrate microfinance with various poverty alleviation programs and projects and implement these in a coordinated manner.
5. The government will coordinate its activities with the institutions responsible for micro-enterprise development and assist the targeted poor people for their enterprise development.
6. The government will establish relations with microfinance service providing institutions (MFIs) such as Community Organizations (COs), and Savings and Credit Groups (SCGs), by making a legal provision to easily recognize these MFIs.
7. The government will also motivate destitute class to mobilize their savings in order to improve their access to microfinance services.
8. The government will make the necessary institutional and legal arrangements, and create a separate institution under the direct control of NRB to make the microfinance service providers (MFIs) self-

Institute of Microfinance (InM)| 77
regulatory for timely operation, monitoring, supervision, and evaluation such that they can provide microfinance services to the poor in a sustained manner.
9. In order to mobilize resources for long term easy access of the poor to microfinance services a “National Microfinance Development Fund” will be established. Assistance for microfinance from foreign and national donors will be mobilized through this fund.
10. Conduct a survey to exactly know the existing number of cooperatives and microfinance institutions, extension of services and access to services.
11. Organize trainings to improve the capacity of people engaged in microfinance sector.
12. Adopt the policy of relaxation in permitting saving deposits to the MFIs based on the services they provide and their share capital status, and
13. Adopt the flexible tax policy on income of the MFIs and tax on interest earnings of the poor.
14. Most of the initiatives and actions envisaged under the policy are yet to be observed. NRB, the central bank has been working on a draft to bring out a microfinance act and also to create a regulatory body to regulate and supervise the MFIs in Nepal.
8.2 Regulatory Authorities and Regulated Institutions
a. Nepal Rastra Bank (NRB)
The Nepal Rastra Bank is the regulatory body for all types of banks and financial institutions licensed by it and classified as Class 'A', Class 'B', Class 'C' and Class 'D' banks under the Bank and Financial Institution Act 2006 and the Financial Intermediary NGOs registered under the Financial Intermediary Act 1998. In addition to these, some cooperatives which have been given limited banking licenses also come under its control and supervision.
b. The Department of Cooperatives (DoC)
The Department of Cooperatives under the Ministry Agriculture and Cooperatives is the regulatory body for the Cooperatives societies including Saving and Credit Cooperatives registered under Cooperative Act 1992.
8.3 Laws and Regulations
a. Nepal Rastra Bank Act, 2002 b. Bank and Financial Institutions Act, 2006 c. Cooperative Societies Act, 1992, d. Financial Intermediaries Act, 1998, e. NRB Directives for Microfinance Institutions, 2003,

78 | State of Microfinance in Nepal
a. Nepal Rastra Bank Act, 2002
This Act defines the role of NRB in formulating effective policies, developing secure, healthy and efficient payment system, regulating, supervising and inspecting banking and financial institutions and promoting and striving for a credible banking and financial system. It prohibits NRB to buy share of CBs or financial institutions. NRB, however, plays a developmental role through a special fund, the Rural Self-Reliance Fund (RSRF), which operates with an interest rate below market rates. NRB's financing role through RSRF undermines the steady development of other apex institutions in rural and microfinance sectors. The justification for continued operation of RSRF is based on the need for serving weak institutions that cannot meet the eligibility criteria of other wholesale lending institutions.
b. Bank and Financial Institutions Act, 2006
This umbrella Act, “Bank and Financial Institutions Act” (BFIA) came into force in 2006 and it replaced the Bank and Financial Institutions Ordinance (BFIO) of 2004. All the commercial banks, development banks, finance companies, microfinance development banks are regulated under this umbrella act as Class A, Class B, Class C and Class D institutions, respectively. A small Microfinance Development Bank (MFDB) can be established with a paid up capital of Rs. 10 million to operate in three districts outside Kathmandu valley. For operating in 4-10 districts outside Kathmandu, the MFDB has to have paid up capital of Rs. 20 million and for a national level MFDB the paid up capital must be at least Rs. 100 million. MFDB can increase the number of districts if it could increase paid up capital. For an adjoining additional district, it requires to increase paid up capital by Rs. 2.5 million. The promoters can retain 70% of the share capital and they must float the remaining 30% share to the general public. An MFDB operating in 10 districts with a capital of Rs. 20 million can operate in other five districts in the hills without any additional capital. This umbrella Act has a provision for even a foreign bank or financial institution, in joint collaboration with a Nepalese organization or citizen or through its subsidiary organization having its full share, can provide microfinance services in the country with the permission from NRB and the Government of Nepal. Under this act, NRB has the responsibility to supervise, warn the Board of Directors and even take over management in case some wrong things happen to a bank and also initiate actions for liquidation if required by circumstances.
c. Cooperative Societies Act, 1992
The Cooperative Societies Act was introduced in Nepal in 1992. Under this Act, cooperatives can be formed with 25 persons as its members. These autonomous institutions are entitled to formulate their own bylaws or operational procedures through their General Assembly (GA) meetings. Each cooperative will have a Board of Directors and an Accounts Committee (AC) consisting of members duly elected by the members through General Assembly using one-man one vote principle. The term of Board members and members of Account Committee (AC) is also determined by the GA but not exceeding 5 years. The Board appoints a management team or prescribes other body that carries out the day-to-day activities of a cooperative. The AC is responsible for internal audit and accountable to General Assembly for accounting and financial operations. Under the act, the Department of

Institute of Microfinance (InM)| 79
Cooperatives is fully authorized to register, supervise, appoint auditor, take necessary actions for improvements and reforms and liquidate all types of cooperative societies.
d. Financial Intermediaries Act, 1998
In 1998, NRB introduced the Financial Intermediaries Act in order to regulate the financial intermediary NGOs carrying out microfinance activities. This was claimed to be a significant step in boosting up NGOs to undertake microfinance activities for the poor. However, this Act did not permit FINGOs to accept savings deposits from their clients, which is considered to be a vital aspect for sustainable operation of microfinance services. Consequently in 2001, this act was amended allowing FINGOs also to accept saving deposits from their members. According to this Act, an NGO intending to carry out microfinance activities is required to obtain license from NRB. The FINGOs need to maintain a minimum of Rs. 100,000 as their capital to get license. After receiving license from NRB, they can apply for funds from the wholesale lending institutions, such as RSRF, RMDC and Commercial Banks. The FINGOs are required to renew their license every two years. The NRB is responsible for supervision of the FINGOs to ensure that they are performing well to the interest of the target groups and the institutions that provide them financial support.
e. Nepal Rastra Bank (NRB) Directives related to Microfinance Institutions
NRB issued ‘Directives’ for the microfinance institutions with the objective of promoting healthy, organized, transparent and standard operation of microfinance banks. The main features of the ‘Directives’ are summarized under the following headings:
Minimum capital adequacy requirement:
• 4% primary capital (paid up capital, share premium, general reserve, retained earning loss) • 8% primary and supplementary capital (loan loss provision, asset revaluation reserve and
other reserve)
Fund mobilization:
• It can mobilize fund up to 30 times of core capital through group savings, borrowing and debentures.
Compulsory reserve and liquid assets:
• It is required to maintain compulsory minimum reserve of 0.5% of total borrowed fund from NRB or from any other Class A Commercial Bank.
• It is also required to maintain liquid assets of 2.5% of individual, group and special saving of members. The liquid assets are defined as cash reserve at hand, investment in government bonds, investment in NRB bonds and deposit in commercial banks.
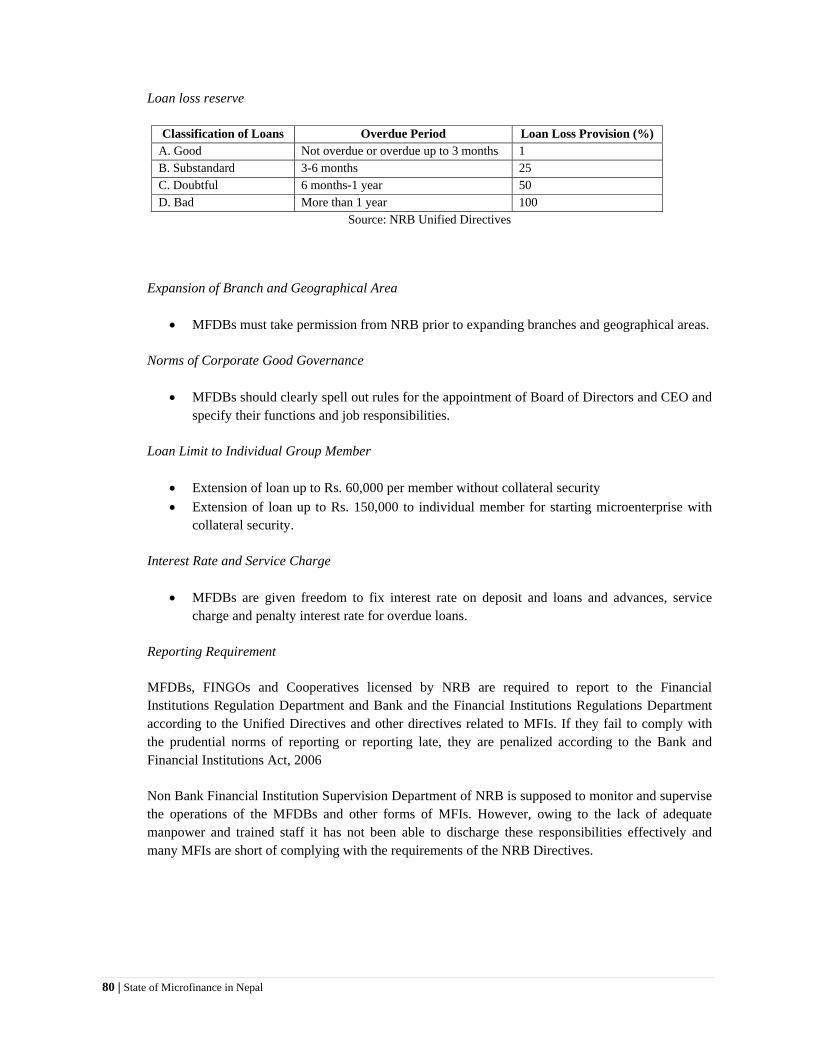
80 | State of Microfinance in Nepal
Loan loss reserve
Classification of Loans Overdue Period Loan Loss Provision (%) A. Good Not overdue or overdue up to 3 months 1 B. Substandard 3-6 months 25 C. Doubtful 6 months-1 year 50 D. Bad More than 1 year 100
Source: NRB Unified Directives
Expansion of Branch and Geographical Area
• MFDBs must take permission from NRB prior to expanding branches and geographical areas.
Norms of Corporate Good Governance
• MFDBs should clearly spell out rules for the appointment of Board of Directors and CEO and specify their functions and job responsibilities.
Loan Limit to Individual Group Member
• Extension of loan up to Rs. 60,000 per member without collateral security • Extension of loan up to Rs. 150,000 to individual member for starting microenterprise with
collateral security.
Interest Rate and Service Charge
• MFDBs are given freedom to fix interest rate on deposit and loans and advances, service charge and penalty interest rate for overdue loans.
Reporting Requirement
MFDBs, FINGOs and Cooperatives licensed by NRB are required to report to the Financial Institutions Regulation Department and Bank and the Financial Institutions Regulations Department according to the Unified Directives and other directives related to MFIs. If they fail to comply with the prudential norms of reporting or reporting late, they are penalized according to the Bank and Financial Institutions Act, 2006
Non Bank Financial Institution Supervision Department of NRB is supposed to monitor and supervise the operations of the MFDBs and other forms of MFIs. However, owing to the lack of adequate manpower and trained staff it has not been able to discharge these responsibilities effectively and many MFIs are short of complying with the requirements of the NRB Directives.

Institute of Microfinance (InM)| 81
f. Financial Intermediaries Regulation 1999
After the promulgation of Financial Intermediary Act 1998, the Nepal Rastra Bank introduced Financial Intermediary Regulation in 1999, which was amended in 2003. The regulation has specified the documents to be submitted by an NGO to the NRB for obtaining a FI license along with Rs. 25 as license fee. As per the regulation, it has to be renewed every two years by paying Rs.100 as renewal fee. The FI-NGO has to classify outstanding and overdue loans in four categories such as good, sub-standard, doubtful and bad, and create a reserve for loan loss provision. There is no need to make provisions for good loans (0-3 months) however for the other categories, the rate of loan loss provision should be 10% for substandard loans (3-6 months), 50% for doubtful (6 months to 1 Year) and 100% for bad loans (above one year) at the end of the fiscal year. The regulation has restricted the FI-NGOs from purchasing shares and debentures without NRB permission taking loan by board members and their family members and purchasing fixed or movable property for commercial purpose.
8.4 Implementation of Laws and Regulations of Financial Intermediaries
a. Cost of regulation
Regulation of the microfinance services is a very important task. Establishing a separate institution to regulate, monitor and supervise the MFIs is a dire need for improving the institutional performance of MFIs. This involves a lot of cost as well. For the above reason, the MFIs also need to bear considerable costs for registration and renewal of their institution. In Nepal, any bank or a financial company should get registered at the Company Registrar's Office of GoN first, before obtaining operational license from the central bank. To this effect, a bank or a company, if it is a public limited company with an authorized capital upto 10 million shall pay a fee of Rs. 15,000, with an authorized capital above Rs. 10 million upto Rs. 100 million shall pay a fee of Rs. 40,000, with an authorized capital above Rs. 100 million upto Rs. 200 million shall pay a fee of Rs. 70,000, and so on. It is presented in Table 30. However, they are not required to pay any fee to NRB.
Table 30: Paid up Share Capitals and Registration Fees SN Paid Up Share Capital (Rs.) Registration Fee (Rs.)
1 10,000,000 15,000 2 10,000,001-100,000,000 40,000 3 100,000,001-200,000,000 70,000 4 200,000,001-300,000,000 100,000 5 300,000,001-400,000,000 130,000 6 400,000,001-500,000,000 160,000 7 500,000,000 and above @ Rs.3,000 per Rs.10 million share capital
The FI-NGOs also get registered at the Chief District Office (CDO), GoN first and then at NRB. The CDO office charge Rs. 1,000 as registration fee and Rs. 500 as renewal fee every year. At NRB, they
82 | State of Microfinance in Nepal
require to pay a small amount of Rs. 25 for registration and Rs. 100 for renewal at the interval of two years. The cooperatives (SCCs) do not require paying fee for registration and renewal. There is no need for Class "D" banks to pay any fee to NRB for a license and neither are they required to pay any annual fee. Besides, NRB does not charge any fee for its supervision to both MFDBs and FINGOs. However, NRB has a requirement of maintaining liquidity of 0.5% of the total borrowings in the form of deposits at its banking office by the Class "D" banks, on which it does not pay any interest. The current supervision of NRB to MFIs both in terms of quality and quantity is not upto the standard. To this effect NRB should improve its supervisory system through the development of professional skills and capacities among its concerned staff and charge annual fee to MFIs for its supervision.
b. Effectiveness of Self-regulation and Regulatory Authority Supervision
Self-regulation is required for maintaining self-discipline in financial transactions. Self-discipline in financial transactions saves a lot of costs, makes the transactions more effective and target oriented. Self-regulation devoid of commitment and clear vision on how to proceed, however, could be disastrous. Wrong judgment and misinterpretations of prudential rules and regulations and frequent manipulation in financial transactions could mislead the organizations to the verge of complete failure, if organizations are left for self regulation only.
Cooperatives could be one good example of self-regulated microfinance institutions in Nepal. The Department of Cooperatives, under the Ministry of Agriculture and Cooperatives, requires cooperatives to follow some general principles of cooperatives, however, it has allowed grass roots' level cooperatives to make and follow their own bylaws, rules and regulations. Many cooperatives with well-informed and professional executive members could lead their institution effectively and come up with good results though adoption of strict self regulation norms. However, in the absence of proper cooperative education among the executive and general members, it is likely to make serious violations of financial norms and rules contradicting the guidelines provided by the Department of Cooperatives (DOC). There are examples of saving and credit cooperatives, which have been accepting deposits from general public or non members against the norms fixed by the Cooperative Act 1992 and most of the principles of cooperative, have been thwarted. There is a large number of SCCs, which do not maintain proper records and accounting, lack internal control mechanism, and the funds being misused by the board officials. There are many cases where the top officials had fled with member/public deposit money. The DOC could not properly monitor such cooperatives, as there is a lack of effective monitoring and supervision system and also lack adequate trained staff for supervising thousand of cooperatives on time.
Similarly, NRB also finds it very difficult to make adequate supervision of MFIs. It is solely responsible for supervising MFDBs, FINGOs and Cooperatives with limited banking licenses and Cooperatives which are the borrowers of RSRF. NRB supervises these institutions only once in every three year, which is quite inadequate to keep these institutions on right track in their operations and financial management. In the case of RMDC partner MFIs, they are being constantly followed up and supervised by it and they seem to be operationally and financially better managed than other MFIs.

Institute of Microfinance (InM)| 83
The government needs to develop separate regulatory bodies for FI-NGOs and cooperatives, and follow a strict supervision mechanism. Else, many unwanted problems might crop up in their operation causing risk to public deposits. The SCCs take huge sums of public deposits, for which there is no institution really responsible for monitoring and supervision to enforce prudential norms.
The networks of MFIs such as Microfinance Bankers' Association of Nepal (MBAN), a network of the practitioners such as GBBs and PMFBs, Microfinance Institutions Association of Nepal (MIFAN), a network of FINGOs, Nepalese Federation of Saving & Credit Cooperative Union Ltd. (NEFSCUN), a network of saving & credit cooperatives, the Centre for Microfinance (CMF), an institution involved in the research and training of microfinance, could be instrumental in developing standards and norms for their MFI members and in constantly following up to ensure the compliance by the concerned. They also can play advocacy role for bringing conducive policy environment for microfinance in Nepal.

84 | State of Microfinance in Nepal
Chapter IX: Competition in Micro Credit Market and the Issue of Overlapping
9.1 Nature and impact of competition in the micro credit market
Healthy competition is desirable in any market. It enhances quality and efficiency in services. In the financial market also competition among financial institutions brings down the interest rate on loans and improves credit availability. But cut-throat competition is not desirable. It spoils the clients’ attitude and undermines credit discipline. Undue competition develops chances of overlapping and duplication of clients and loans. Likewise, loans get concentrated in areas close to market places only. It also raises chances for clients racketing, whereas staffs also find easy ways to meet the given target. It also promotes over indebtedness causing misuse of loan funds making it difficult to understand the clients’ exact situations. This also helps clever clients to play one MFI against the other ultimately resulting in rampant default in loan repayments.
Target setting of outreach for the staff could bring/has brought a situation of unhealthy competition among MFIs trying to work in more accessible areas. This consumes much of their attention and resources and the poor in the remote corners are left out from the microfinance services. This also leads to misunderstandings between MFIs with regard to the selection of operating areas and target people. In the bid to show off good performance and attract more clients, the MFIs most often forget the social values, ethics and regulatory requirements, which in turn might bring more problems for their sustainable operation. In the process, the MFIs would not try for deepening their services to the downtrodden and ultra poor but concentrate most of their efforts and resources in providing microfinance services to less needy or non-targeted people in the densely populated close by market areas.
Micro Credit Rating International Ltd. (M-CRIL) has studied Swabalamban Bikas (SB) Bank in 2006 and has reported it has tight competition in three out of ten operational districts (namely, Sunsari, Bara and Parsa districts under nine of its branch offices). In Sunsari district, it faces competition mainly from EGBB. In Bara and Parsa districts, the Bank faces competition mainly from other PMFBs such as Nirdhan Utthan Bank, Chhimek Bikas Bank and DEPROSC Bikas Bank. In four districts, the Bank faces moderate competition from some NGOs and from some of the PMFBs and in three districts (namely, Makwanpur, Udayapur and Mahottari); the degree of competition is slightly low.
SB Bank has good strategies for management of competition. The Bank tries to avoid duplication of clientele and shares information with other MFIs in its operational area. If a client is found to be a member of any other MFI(s), she is given the choice to continue with the membership of SB Bank and leave the other MFI(s) or is asked to leave SB Bank. The Bank regularly reviews the products offered by other microfinance providers and their own through its monthly meetings of Area Managers at the Head Office28. The Bank has also high rates of dropouts. As of July 2008, 55,829 members dropped out and total members that remained were 79,884. Therefore, the dropout rate was 41%. Overlapping and competition might be some of the reasons for high drop outs. 28 Source: M-CRIL’s study report on Micro-Finance Rating - Risk Assessment, Swabalamban Bikas Bank Ltd (SB Bank), Janakpur, Dhanusha, Nepal
Institute of Microfinance (InM)| 85
9.2. Impact of overlapping of clients
As a result of competition among MFIs, there are high chances of overlapping. Same client could be a member of more than one MFI. Some subtle and clever borrowers may repay loans of one MFI out of the loans taken from another MFI to maintain timely repayment and finally the borrower may be over indebted and go out of capacity to repay outstanding loans in the two or more institutions. This will contribute negatively to both MFIs on meeting their objective of poverty reduction and that of clients in encouraging misuse of funds. This will not only deprive the chances of ultra poor in getting microfinance services but will also develop sour relation between the MFIs involved in duplication.
RMDC has made a study on overlapping of MFIs in Vyasnagar, Tanahun district in Western Development Region of Nepal. The result of Vyasnagar study indicates that same borrowers have got memberships and loans from up to five MFIs. Total registered members were found to be 514, loan numbers had reached more than four thousand and the overlapping has reached 11 hundred-loan cases. The average sizes of loans taken by the clients with overlaps have been noticed to be two to six times larger than those of non-overlap clients following the norms and standards of microfinance services. Out of 514 overlapped members, 385 (75%) had taken loans from two MFIs with average loan disbursement of Rs. 31, 338 and average loan balance of Rs. 17, 994. Nine persons (2%) had taken loans from five MFIs with average loan amount of Rs. 111,889 and average outstanding loan balance of Rs. 58, 517. The average loan balance of members with only one MFI connection stands at about Rs. 9,000 to Rs. 10,000. In an interaction with the study team of RMDC the clients revealed many reasons for overlapping. The principal reasons are indicated as follows:
1. Loan needs of a member is not adequately catered to by one MFI or recommended by the concerned group of clients,
2. Active members are tried to be attracted by different MFI groups, 3. Members having more economic enterprises are recommended for loans by the groups even if they
knew that the member has also loan with other MFIs, 4. Some clever persons join groups of more MFIs and try to receive loans from as many MFIs as possible
and default loan repayment. 5. MFIs do not want to go to the remote areas due to higher cost of lending and also due to various other
reasons such as less developed infrastructure, less economic activities, difficulties in monitoring and follow-ups, and staffs' non-interest to serve in distant areas.
Overlaps should also be seen positively if it is due to the reason one and two until the member could manage enterprises effectively and efficiently so that profits from the proceedings exceed the costs. Based on the pace of capacity development of a member - she needs more loans for productive investments than a particular MFI lends or a group recommends. If the needed loans are not made available her business is inhibited. Therefore, her success in getting membership in more groups supported by different MFIs should be taken positively. The groups and the MFIs also would like to see inclusion of such active members in their programs. Such members can also positively contribute to different groups/MFIs with her rich experience and active participation in operating various enterprises.
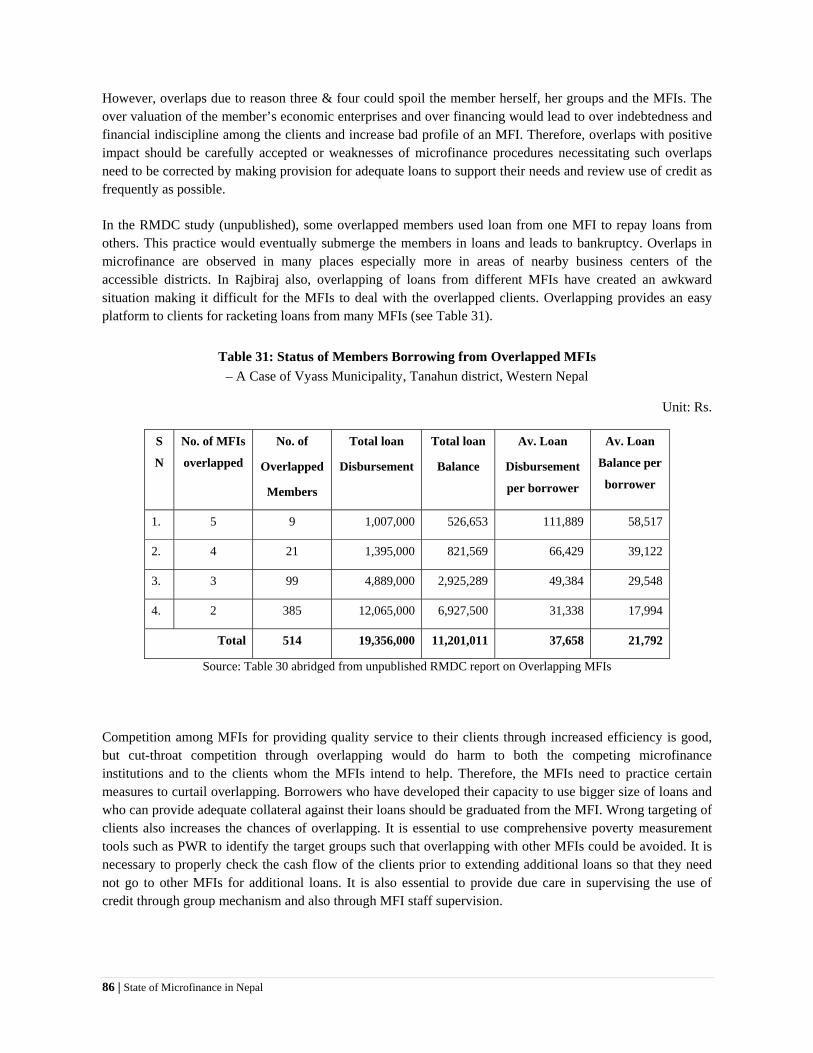
86 | State of Microfinance in Nepal
However, overlaps due to reason three & four could spoil the member herself, her groups and the MFIs. The over valuation of the member’s economic enterprises and over financing would lead to over indebtedness and financial indiscipline among the clients and increase bad profile of an MFI. Therefore, overlaps with positive impact should be carefully accepted or weaknesses of microfinance procedures necessitating such overlaps need to be corrected by making provision for adequate loans to support their needs and review use of credit as frequently as possible.
In the RMDC study (unpublished), some overlapped members used loan from one MFI to repay loans from others. This practice would eventually submerge the members in loans and leads to bankruptcy. Overlaps in microfinance are observed in many places especially more in areas of nearby business centers of the accessible districts. In Rajbiraj also, overlapping of loans from different MFIs have created an awkward situation making it difficult for the MFIs to deal with the overlapped clients. Overlapping provides an easy platform to clients for racketing loans from many MFIs (see Table 31).
Table 31: Status of Members Borrowing from Overlapped MFIs – A Case of Vyass Municipality, Tanahun district, Western Nepal
Unit: Rs.
S
N
No. of MFIs
overlapped
No. of
Overlapped
Members
Total loan
Disbursement
Total loan
Balance
Av. Loan
Disbursement
per borrower
Av. Loan
Balance per
borrower
1. 5 9 1,007,000 526,653 111,889 58,517
2. 4 21 1,395,000 821,569 66,429 39,122
3. 3 99 4,889,000 2,925,289 49,384 29,548
4. 2 385 12,065,000 6,927,500 31,338 17,994
Total 514 19,356,000 11,201,011 37,658 21,792
Source: Table 30 abridged from unpublished RMDC report on Overlapping MFIs
Competition among MFIs for providing quality service to their clients through increased efficiency is good, but cut-throat competition through overlapping would do harm to both the competing microfinance institutions and to the clients whom the MFIs intend to help. Therefore, the MFIs need to practice certain measures to curtail overlapping. Borrowers who have developed their capacity to use bigger size of loans and who can provide adequate collateral against their loans should be graduated from the MFI. Wrong targeting of clients also increases the chances of overlapping. It is essential to use comprehensive poverty measurement tools such as PWR to identify the target groups such that overlapping with other MFIs could be avoided. It is necessary to properly check the cash flow of the clients prior to extending additional loans so that they need not go to other MFIs for additional loans. It is also essential to provide due care in supervising the use of credit through group mechanism and also through MFI staff supervision.

Institute of Microfinance (InM)| 87
Box No. 7
Lessons Learnt
1. Poor people are bankable and creditworthy. 2. Micro loans make big differences to the poor. 3. A group is a cost effective vehicle of micro loan delivery. 4. Micro loans should be collateral free 5. Micro loans and savings services should go hand in hand. 6. Women are the effective channel of microfinance operation. 7. Microfinance is an effective instrument of women's economic and social empowerment. 8. Microfinance institutions can be viable and sustainable with appropriate rate of interest on their loan. 9. Microfinance is a professional business not an amateur's task. 10. Institutional development of MFI's is prerequisite for the growth and expansion of microfinance services. 11. Microfinance services should not be operated by government agencies and along with subsidy programs. 12. Private sector MFI's are more efficient and effective than government MFI's.
88 | State of Microfinance in Nepal
Chapter X: Challenges of the Microfinance Industry
10.1 Problems and Challenges
Microfinance is now globally recognized as an effective tool for reducing poverty. It has shown positive results in many countries; however, microfinance services have not yet deepened down to reach the neediest poor. There are still huge masses of people deprived of financial service in Nepal as in a number of other developing countries. At the same time, there are a number of challenges facing the microfinance Industry in Nepal. They are discussed below:
1. There are many microfinance institutions (MFIs) that cropped up in recent years. Most of them are concentrated in areas which have easy proximities to market and also have high density of population. They have not been able to build up right approach to outreach the neediest downtrodden masses. Often they have the tendency to serve less poor and less vulnerable groups. The institutions do not have right culture and mindset to serve the poorer first.
2. Most MFIs do not feel comfortable to launch services to the deprived groups of the far flung areas in the country. As a result, the poorest of the poor and the vulnerable groups of hills and mountains have not been benefited from the services of MFIs. MFIs think that they cannot penetrate the remote areas due to higher costs involved in loan administration. They have the prejudice that they cannot operate in remote areas, without subsidy or grant support for operating cost from the government or donors until they attain operational self sufficiency.
3. Lack of market for products and very limited economic activities due to low density of population have posed problem to the financial institutions to expand their operations in the remote hills and mountains. Likewise, low level use of suitable agriculture technology is another problem in promoting microfinance in the geographically remote areas. Lack of alternatives to subsistence farming is also hindering microfinance services in these areas. Moreover, market for the agricultural products is constrained due to high transportation cost.
4. In South Asian countries, especially in Nepal and India, ethno-caste feudal social structures are prevalent. The superiority feeling of higher caste and the inferiority complex among lower caste are mostly blamed for economic deprivation of the latter. Inferiority feeling among the untouchables and superiority complex carved in the mindset of the so-called upper class against the social stigma/lowly status of the untouchables pose a great challenge to MF sector for penetrating services to socially intimidated groups such as Dalits. They too carry on a feeling of inferiority and believe that the microfinance services are not

Institute of Microfinance (InM)| 89
suited to their needs. Most often the implementers of microfinance programs belong to the upper class that inherently possesses the feeling of disdain against the lowly status of lower caste even though they are not supposed to have it. The reflection of this disdain in their behavior discourages Dalits to believe that the microfinance program is for them.
5. An increase in inequality between the incomes of the rural poor and the urban rich also hinders the poverty reduction and growth prospects. Funds are more attracted in the areas where return to capital is higher and/or cost of lending is lower. This creates budget insufficiency among MFIs to reach the ultimate poor living in the remote corners, which are left out. The poor in the market areas where the loan funds could be turned over in quick successions easily absorb the limited funds.
6. Even though the Maoist insurgency is over, insecurity still prevails all over Nepal especially in the Eastern Terai due to the political instability and the activities of a few political groups, and terrorists’ outfits. The criminal groups operating in Nepal-India border areas are also taking benefits of this volatile situation and looting money from the financial institutions time and again. There have been constant threats and intimidation to the MFI staff working in the Terai districts. Continuous bundh, strikes and chakka jams also have paralyzed the business prospects of the microfinance clients and the movement of MFIs’ staff to their target groups.
7. There is also a lack of professionalism among some of the MFIs. They lack a matching pool of knowledge and skills required for running MFI programs as a business. They see microfinance as social program that are bound to incur losses and need to be subsidized by the government or donors. They often charge very low rate of interest on their loans that cause them losses. Most MFIs do not have business plans and lack strategies to achieve sustainability in their operations. Further, there is also a serious shortage of institutions that can provide capacity building training to the MFIs. Hence, developing professionally managed capable MFIs is also a challenge to this sector.
8. Over indebtedness of clients caused by overlapping of programs or overcrowding of MFIs in a few easily accessible areas with well developed market is yet another challenge to this sector. MFIs’ tendencies to snatch away each other’s clients have caused misuse of loans and financial indiscipline among borrowers. There was also noticed some racketing by vested interest groups by taking advantage of undue competition among MFIs.
9. Increasing overdue loans of the MFIs requiring them to making sufficient funds provisions for bad and doubtful loans have caused high cost of operation and decreased profitability. Poor targeting of clients, inadequate training to staff and improper and weak supervision and follow up system of MFIs have led to increasing default by clients threatening the conviction that the poor are bankable.

90 | State of Microfinance in Nepal
10. The populist slogan of the government to waive the microfinance loans taken by small farmers also has posed a grave challenge to the microfinance institutions. It has spoiled the credit discipline of the clients and has raised the morale of defaulters. The clients feel that similar waivers will be made by the government in future as well. This ultimately discourages MFIs to disburse loans to the needy poor.
11. Most MFIs have been running in profit and have achieved operational self sufficiency. They are geared up towards attaining financial self sufficiency as well. But they have been heavily dependent on external sources such as RMDC and commercial banks for financial resources to meet the loan demands of their clients. They receive wholesale loan from commercial banks (CBs) under deprived sector allocation. However, in case the deprived sector is phased out, they may not receive loans from them at lower rate. Hence, it is a challenge for them to identify and tap financial recourses that would be regularly available to meet their needs.
12. Many NGOs, INGOs, and government agencies have formed groups for different activities. Although, they portray that the groups are made of poor people, most often in practice, groups are made of mostly non poor people and the leadership of such groups are taken by local elites. They become active and perform well for sometime till the project is on-going. Most of the groups die down or become inactive after phasing out of the project. Thus the entire resources and the efforts go down the drain. It is a great challenge to link the groups to the other programs and continue the activities since the groups are formed for different purposes which may not exactly match to the program of the respective organizations.
10.2 Recommendations
In order to lessen the problems and overcome the challenges, the study makes the following recommendations for the consideration of the policy makers, the practitioners and the other stakeholders.
1. For reaching the poorest of the poor it is necessary to expand services to far flung remote areas and deepen the services down to them. The fund cost in Nepal is cheapest in Asia, which is only 5-6% as compared to India and Bangladesh where the fund cost of MFI is around 11%. MFIs in Nepal with this margin can still have some profit in providing microfinance services to the poor. MFIs specially the larger ones who have attained OSS should change their mindset and gear up their programs towards far flung remote districts. However, they have to devise low cost model such as using mobile team to disburse and collect loans, monthly repayments etc. MFIs need to go to the deprived areas as their potential market and take necessary steps to design models suitable to address the needs of the people therein and reduce cost of operation to the possible extent and realize profit within a certain timeframe.

Institute of Microfinance (InM)| 91
2. Appropriate technologies should be introduced to get advantage of the local potential such that the poor can get sizable profits and return out of their loan proceeds. Technology that provides comparative advantage of the remote areas should be made available for harnessing benefits from high value but low volume crops such as herbs, vegetable seeds. Hence, researches and investigations have to be made for financing high value low volume crops suitable for harnessing local potentials and credit programs should be linked up with technology diffusion.
3. With the growth of MFIs, it is needed to have matching number of institutions that can provide capacity building training to the MFIs. The government should come up with programs providing capacity building of the new MFIs such that they could develop professionalism and provide quality microfinance services to the poor. It should also encourage institutions like RMDC to continue their MFI-capacity building activities with provision of the required funds to support such activities.
4. It is also essential to maintain peace and security in the country in order to provide security to the MFIs, which would be stationed at remote locations for providing microfinance services to the poor.
5. The ‘will’ to carry out MF services alone is not sufficient if the MFIs do not have expert hands at work. The staffs must have professional knowledge and skills to provide quality services to the poor. The MFIs have courage to carry out their duties but many of them lack a matching pool of knowledge and skills required for expanding and expediting their MF programs. Therefore, it is suggested to give more focus on developing professional skills to the staffs of MFIs.
6. The government should also exempt tax on income made by MFIs serving the downtrodden masses of the remote corners of the country. It should also wave taxes on the interest earnings of the poor from their savings deposits in the MFIs to encourage them for keeping more savings.
7. The MFIs should be given legal authority to collect savings deposits from the clients as well as non clients in the remote districts to cultivate savings habits among the local people and also to raise internally financial resources generated by MFIs. The larger MFIs should be allowed by NRB to raise deposits from the non members to a certain limit. However, they should not be allowed to operate banking counters as the commercial banks.
8. In order to avoid staff corruption and racketing, MFI top management should be vigilant and watchful of staff behavior and relationships with clients and other vested interest groups. To this effect, they need to avoid duplication and overlapping of loans with other MFIs. They have to come up with
92 | State of Microfinance in Nepal
required products and sizes of loans to address the needs of their clients. They also should pay attention to improving follow ups and checking of branches and clients.
9. The Nepal Rastra Bank should allow expansion of area coverage to the licensed FINGOs and the new MFIs to operate in districts which have thin coverage of microfinance and restrict new operation of MFIs in the overcrowded urban centers and Terai districts.
10. MFIs operating from within the locality have been found more effective to address the problems of the ethnicity. For example, FORWARD and Jeevan Bikas Samaj both from Sunsari and Morang districts have been found successful in tackling the problems of the poor such as Rishavdevs, Tharus, Musahar, Chamar etc. communities very effectively. Many success stories among the target groups have been noticed in that community through microfinance services. Therefore, it is suggested that more local institutions be encouraged to undertake microfinance services in different parts of the country.
11. Credit programs should be linked with the technical service agencies from the very beginning of the program. Community Livestock Development Project (CDLP) can be an example in this regard. The project is run jointly by the Department of Livestock (DoL) of GoN and RMDC. The DoL takes care of the technical side of livestock development RMDC is looking after credit services through its partner MFIs. RMDC will continue to provide wholesale credit to the MFIs, such that the beneficiaries get services uninterrupted despite the phase out of the project.
12. The seed money provided by the government through different development programs, such as PAF, PCRW, etc should be channeled through MFIs such that the program impacts are sustained for longer period. MFIs would continue to provide funds to the registered cooperatives formed out of the project groups even after the termination of the projects.
Institute of Microfinance (InM)| 93
References
1. Unicef/UNDP, “A Qualitative Analysis of Production Credit for Rural Women (PCRW) and the Federation Process”, June 2003, Kathmandu.
2. Francesca Majorano, “An Evaluation of the Rural Microfinance Development Center as a Wholesale Lending Institution in Nepal” Nepal Resident Mission Working Paper Series No. 8, February 2007, Asian Development Bank
3. Annual Progress Report of 2008 (20065 BS), 12th General Assembly Report of Sahara Nepal Saving & Credit Cooperative Society Ltd.
4. Annual Progress Report of FY 2000/2001, July 2002, Women Development Program, Department of Women Development (DWD), Lalitpur
5. Annual Progress Report of the Department of Cooperative, Ministry of Agriculture and Cooperatives, Kathmandu, Nepal
6. Annual Report of 2007/08, Jeevan Bikas Samaj, Morang
7. Annual Report of 2007/08, RMDC Kathmandu
8. Salehuddin Ahmed and M.A, Hakim “Attacking Poverty with Microcredit”, Palli Karma-Shayak Foundation (PKSF), the University Press Limited.
9. Information Exchange, Inc. “Benchmarking Nepal's Microfinance Banks 2006” – A report from the Microfinance February 2008
10. Poverty Alleviation Fund, “Brief Introduction of Poverty Alleviation Fund, 2004”
11. PLAN Nepal Business Development Services for Sustainable Microfinance
12. Case Studies PAF 2008.
13. MoLD, Community Development Fund – Operational Guidelines, 2007.
14. Pokharel, Ram Krishna, “Community Managed Revolving Fund – New departure in expanding the outreach of Microfinance services in Nepal”, Decentralized Local Governance Support Program (DLGSP).
15. Women Development Division /UNIFEM/UNDP, “Data Base of Production Credit for Rural Women (PCRW)”, Program of Central Development Region, August, 1996.
16. Rabindra Kumar Shakya, “Development of Microfinance Industry in Nepal – Trends and Prospects "Reprinted from Mirmire, Vol. No. 34, No. 236, April/May 2005
17. DLGSP Draft Annual Report 2008 and Manual on SHG operation
18. Government of Nepal, “Economic Survey Fiscal Year 2007/08”, MOF, July 2008.
19. FAO Program Document on SFDP, 1974 The program was first implemented in Vietnam, S. Korea, Laos, Thailand, Indonesia, SriLanka and India
20. Asian Development Bank, Gender and Development, Giving Credit to Women Grameen Model: Problems and Prospects by Ram Chandra Joshi
21. Center for Policy Studies and Rural Development, Kathmandu, “Impact Evaluation of Microfinance Programs on Poverty Reduction”, June 2004. Submitted to Central Monitoring and Evaluation Division National Planning Secretariat Singha Durbar, Kathmandu.
22. RMDC, Impact of Microfinance Services on the Clients of RMDC's Partner Organizations, March 2008, RMDC
23. Jeevika – PAF Newsletter, Nov./Dec. 2008
24. MoLD/NPC/UNDP, “LGP Brief Introduction, Local Self-Governance Program
94 | State of Microfinance in Nepal
25. MoLD, HMGN, Local Development Fund – Model Bylaws (draft), July 2002 Local Governance and Community Development Program (LGCDP) – Program Document, 11 July 2008, LGCDP Program Coordination Unit.
26. SFDP and RUFIN, GTZ, Nepal, “MANTRAS (Management and governance, Assets & liability management, Networking & linkages, Trends of membership & group dynamics, Records and procedures, Accounting & internal control mechanism and Sustainability)”
27. M-CRIL’s study report on Micro-Finance Rating - Risk Assessment, Swabalamban Bikas Bank Ltd (SB Bank), Janakpur, Dhanusha, Nepal
28. Gunaranjan, Head Insurance Business, BASIX, “Micro Insurance for Protecting Livelihoods”
29. RMDC, “Microfinance Industry Report”, November 2008. – BWTP
30. Microfinance Information Exchange (MIX) Asia 100 – Ranking of Microfinance Institutions 2007, ADB
31. Juan Buchenau, Migrant Savings and Alternative Investment by
32. National Living Standard Survey 2004
33. National Microfinance Policy Guidelines 2008
34. Nepal microfinance country profile – Stakeholder Workshop, February 27, 2004, Sharing Microfinance Resources and Knowledge in South Asia
35. Nepal Rastra Bank, Quarterly Economic Bulletin Vol. 42, Number 3, Mid-April 2008
36. Nepal Rural Credit Review Final Report Vol. I & II, ADB/M and NRB/K, Nepal Rastra Bank, December 1994.
37. NRB News Year 2 Issue III July/August 2008
38. Suman Basnet and Prem Sagar Subedi, “Opportunities in Micro financing of Renewable Energy Services” Winrock International Nepal
39. PAF Annual Report 2007-2008
40. PAF In Brief as of 15 July 2008 provided by PAF, CEO, Mr. Jhank Prasad Shrestha
41. Papers Presented in Microfinance Summit Nepal – February 2008
42. Tulasi Prasad Upreti, Policy and Regulatory Issues in Microfinance by Center for Microfinance (CMF).
43. RMDC, Progress Report of Grameen Banks and Replicating Banks as of mid July 2008 Microfinance compiled
44. RMDC, “Proposal for Improving the Viability and Sustainability of the Grameen Bikas Banks”, September, 2001.
45. Prabin Kumar Dahal, “Reaching Groups of Remote Areas with Microfinance Services – A case study of the Self-Reliant Group (SRG) Model” NUBL
46. BK, Man Bahadur, Deputy Country Representative, Child Welfare Scheme UK and Member National Cooperative Development Board “Reaching Poorest of the Poor: Building Inclusive Microfinance”
47. Yadav, Ram Prakash, Vice Chairman Poverty Alleviation Fund, “Relation between Literacy & Poverty” Series 1, July 2008, Poverty Outlook
48. SKBBL Central Office, “Replication of Small Farmers Institutional Development Program Implementation Manual” 2007, Kathmandu
49. RSRF Directives – 2060 with revision 2065 BS
50. Rural Self Reliance Fund – Loan Directives 2004 with Amendments of 2008, Microfinance Division, Nepal Rastra Bank, Central Office, Kathmandu
51. Kadel, Min Raj, Chairperson, Nepal Federation of Savings and Credit Cooperative Unions Limited (NEFSCUN), “Savings and Credit Cooperative Model” Kathmandu, Nepal
52. SKBBL, Seventh Annual Report, 2008
53. SFCL Model – Problems and Prospects – a paper presented in Microfinance Summit 2008

Institute of Microfinance (InM)| 95
54. Karki, Upendra Bahadur, General Manager, Sana Kisan Bikas Bank Ltd. (SKBBL) SFCL Model – Problems and Prospects
55. SKBBL Annual Report, 2008
56. Thapa, G.B, “State of Microfinance – Breadth and Depth”
57. NRB, Central Office, “Study on Remittance Received from India”, July 2008 (Based on Survey Conducted in Delhi)
58. ADBN and SKBBL, “Study Report on Quality Standard of Loans transacted among ADBN, SKBBL and SFCLs” April 2007.
59. DLGSP, Success Stories (Nepali version)
60. Dhakal, Nara Hari and Neupane, Sharad, “Towards Expanding the Frontier of Microfinance Services in Nepal” UNDP Nepal
61. Karduck, Stefan & Seibel, Hans Dieter, “Transaction Costs of Self-Help Groups – A Study of NABARD's SHG Banking Program in India” 2004