the state of microfinance investment 2012 - microrate€¦ · the state of microfinance investment...
TRANSCRIPT
MicroRate’s 7th Annual Survey and Analysis of MIVs
The State of Microfinance Investment 2012
A service of MicroRate
2
About MicroRate
MicroRate is the first microfinance rating agency dedicated to evaluating performance and risk in microfinance institu-
tions (MFIs) and microfinance investment vehicles (MIVs). As the most respected organization of its kind, Micro-
Rate has conducted over 650 ratings of 200+ MFIs throughout Latin America, Africa, Europe, and Central Asia. Mi-
croRate is a leading social rater and has also become the largest MIV evaluator in the industry.
About Luminis
Luminis is a web-based, analytical service of MicroRate that enables investors to search, compare, evaluate, and moni-
tor microfinance funds. The Luminis methodology framework evaluates fund performance, risk, social, and manage-
ment (PRSM) dimensions. Luminis answers investors’ demand for greater transparency and objective evaluation on
microfinance funds by providing fund data, trends, and analysis through its in-depth PRSM profiles and fund reports.
Thanks to all the contributors who made this industry research report possible:
Daniel Rozas
Sebastian von Stauffenberg
Damian von Stauffenberg
Stephen Brown
Rebecca Spradlin
Antonio Vargas
Copyright © 2012 MicroRate Incorporated (“MicroRate”). All rights reserved.
This report may be reproduced provided that credit is given to “MicroRate.”
Disclaimer: Please note this report was compiled primarily on information provided by the MIVs listed in Appendix I. The information
is provided for informational purposes only and without any obligation, whether contractual or otherwise. No warranty or representation is
made as to the correctness, completeness and accuracy of the information given. Data from previous years’ Surveys may differ from infor-
mation presented here as new information was collected. The views and interpretations expressed herein are those of MicroRate, and do not
necessarily represent the views of those involved with this report.
THE STATE OF MICROFINANCE INVESTMENT 2012
MicroRate’s 7th
Annual Survey and Analysis of MIVs
3
Foreword
This marks the 7th consecutive year that MicroRate has conducted its survey of microfinance investment vehicles
(MIVs), which play a key role in connecting private and public capital with microfinance institutions (MFIs) around
the world. Despite the ups and downs of the microfinance market, these market matchmakers have consistently con-
tinued to play this important role and we look forward to providing continued coverage of their activities in the years
to come.
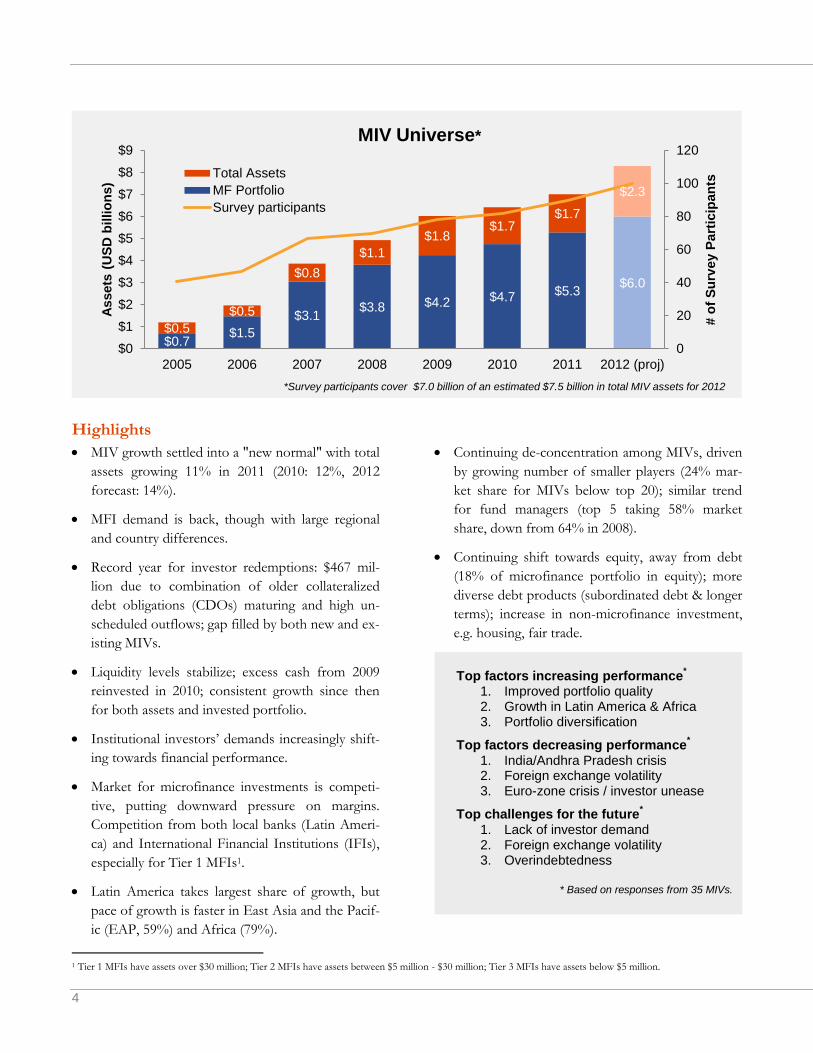
This year's survey includes responses of 86 MIVs, out of a total 102 contacted. This report covers over 93% of MIVs’
total assets, $7.0 billion out of an estimated $7.5 billion in total global assets under management. We would like to
thank each and every survey participant for their time and contributions.
In particular, we would like to thank those MIV managers and staff who took the time to speak with us directly, shar-
ing their insights on the key issues affecting their work during 2011-2012, as well as expectations for the future. Their
feedback provides depth and context to the survey statistics, and we would like to recognize each of them:
Hugo Couderé, Alterfin
Brian Cox, MFX Solutions
Gil Crawford, MicroVest
Loïc De Cannière, Incofin
Mark van Doesburgh, Triple Jump
Martin Heimes, responsAbility
Asad Mahmood, Deutsche Bank
Geert Peetermans, Incofin
Frank Streppel, Triodos
Arman Vardanyan, Absolute Portfolio Mana-
gement
Kaspar Wansleben, Luxembourg Microfinance
and Development Fund
Sylvia Wisniwski, Finance in Motion
Maria Teresa Zappia, BlueOrchard Finance
MicroRate would like to give special recognition to the following sponsors of this year’s report. Thank you for your
support in increasing the awareness and transparency of our industry.
4
Highlights
MIV growth settled into a "new normal" with total
assets growing 11% in 2011 (2010: 12%, 2012
forecast: 14%).
MFI demand is back, though with large regional
and country differences.
Record year for investor redemptions: $467 mil-
lion due to combination of older collateralized
debt obligations (CDOs) maturing and high un-
scheduled outflows; gap filled by both new and ex-
isting MIVs.
Liquidity levels stabilize; excess cash from 2009
reinvested in 2010; consistent growth since then
for both assets and invested portfolio.
Institutional investors’ demands increasingly shift-
ing towards financial performance.
Market for microfinance investments is competi-
tive, putting downward pressure on margins.
Competition from both local banks (Latin Ameri-
ca) and International Financial Institutions (IFIs),
especially for Tier 1 MFIs1.
Latin America takes largest share of growth, but
pace of growth is faster in East Asia and the Pacif-
ic (EAP, 59%) and Africa (79%).
Continuing de-concentration among MIVs, driven
by growing number of smaller players (24% mar-
ket share for MIVs below top 20); similar trend
for fund managers (top 5 taking 58% market
share, down from 64% in 2008).
Continuing shift towards equity, away from debt
(18% of microfinance portfolio in equity); more
diverse debt products (subordinated debt & longer
terms); increase in non-microfinance investment,
e.g. housing, fair trade.
1 Tier 1 MFIs have assets over $30 million; Tier 2 MFIs have assets between $5 million - $30 million; Tier 3 MFIs have assets below $5 million.
$0.7 $1.5
$3.1 $3.8 $4.2 $4.7 $5.3
$6.0
$0.5
$0.5
$0.8
$1.1
$1.8 $1.7
$1.7
$2.3
0
20
40
60
80
100
120
$0
$1
$2
$3
$4
$5
$6
$7
$8
$9
2005 2006 2007 2008 2009 2010 2011 2012 (proj)
# o
f S
urv
ey P
art
icip
an
ts
Assets
(U
SD
billio
ns)
MIV Universe*
Total Assets
MF Portfolio
Survey participants
*Survey participants cover $7.0 billion of an estimated $7.5 billion in total MIV assets for 2012
Top factors increasing performance*
1. Improved portfolio quality 2. Growth in Latin America & Africa 3. Portfolio diversification
Top factors decreasing performance*
1. India/Andhra Pradesh crisis 2. Foreign exchange volatility 3. Euro-zone crisis / investor unease
Top challenges for the future*
1. Lack of investor demand 2. Foreign exchange volatility 3. Overindebtedness
* Based on responses from 35 MIVs.
THE STATE OF MICROFINANCE INVESTMENT 2012
MicroRate’s 7th
Annual Survey and Analysis of MIVs
5
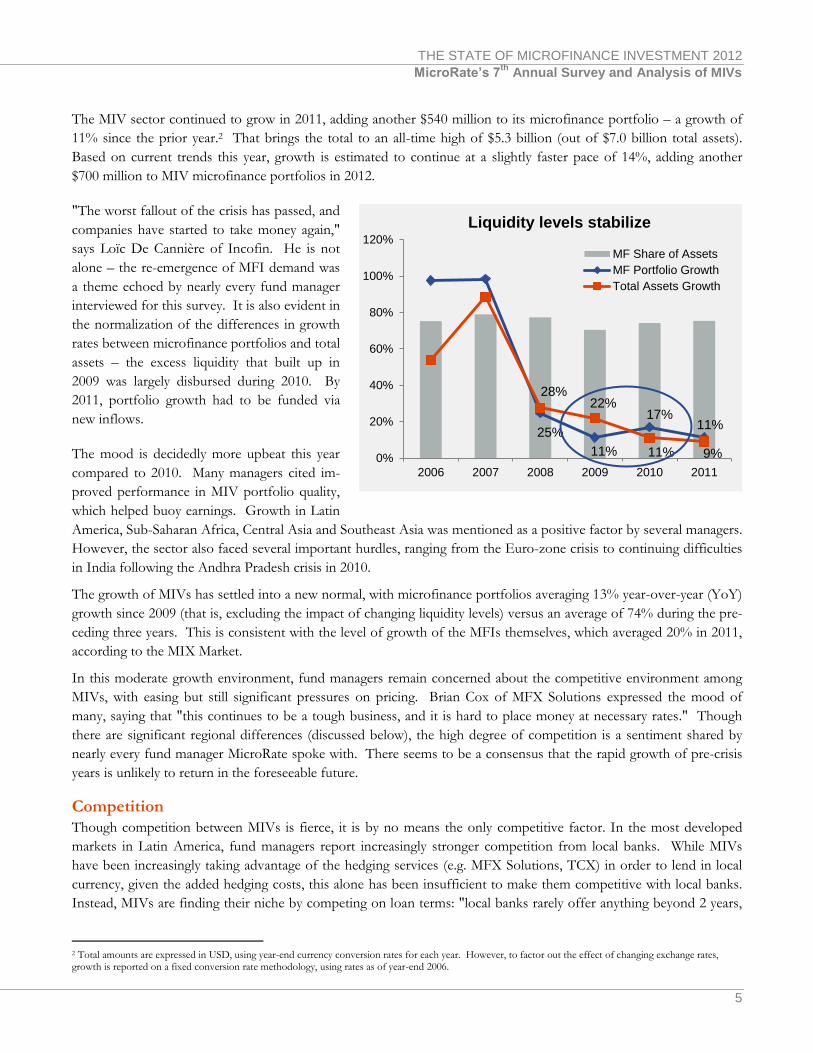
The MIV sector continued to grow in 2011, adding another $540 million to its microfinance portfolio – a growth of
11% since the prior year.2 That brings the total to an all-time high of $5.3 billion (out of $7.0 billion total assets).
Based on current trends this year, growth is estimated to continue at a slightly faster pace of 14%, adding another
$700 million to MIV microfinance portfolios in 2012.
"The worst fallout of the crisis has passed, and
companies have started to take money again,"
says Loïc De Cannière of Incofin. He is not
alone – the re-emergence of MFI demand was
a theme echoed by nearly every fund manager
interviewed for this survey. It is also evident in
the normalization of the differences in growth
rates between microfinance portfolios and total
assets – the excess liquidity that built up in
2009 was largely disbursed during 2010. By
2011, portfolio growth had to be funded via
new inflows.
The mood is decidedly more upbeat this year
compared to 2010. Many managers cited im-
proved performance in MIV portfolio quality,
which helped buoy earnings. Growth in Latin
America, Sub-Saharan Africa, Central Asia and Southeast Asia was mentioned as a positive factor by several managers.
However, the sector also faced several important hurdles, ranging from the Euro-zone crisis to continuing difficulties
in India following the Andhra Pradesh crisis in 2010.
The growth of MIVs has settled into a new normal, with microfinance portfolios averaging 13% year-over-year (YoY)
growth since 2009 (that is, excluding the impact of changing liquidity levels) versus an average of 74% during the pre-
ceding three years. This is consistent with the level of growth of the MFIs themselves, which averaged 20% in 2011,
according to the MIX Market.
In this moderate growth environment, fund managers remain concerned about the competitive environment among
MIVs, with easing but still significant pressures on pricing. Brian Cox of MFX Solutions expressed the mood of
many, saying that "this continues to be a tough business, and it is hard to place money at necessary rates." Though
there are significant regional differences (discussed below), the high degree of competition is a sentiment shared by
nearly every fund manager MicroRate spoke with. There seems to be a consensus that the rapid growth of pre-crisis
years is unlikely to return in the foreseeable future.
Competition
Though competition between MIVs is fierce, it is by no means the only competitive factor. In the most developed
markets in Latin America, fund managers report increasingly stronger competition from local banks. While MIVs
have been increasingly taking advantage of the hedging services (e.g. MFX Solutions, TCX) in order to lend in local
currency, given the added hedging costs, this alone has been insufficient to make them competitive with local banks.
Instead, MIVs are finding their niche by competing on loan terms: "local banks rarely offer anything beyond 2 years,
2 Total amounts are expressed in USD, using year-end currency conversion rates for each year. However, to factor out the effect of changing exchange rates, growth is reported on a fixed conversion rate methodology, using rates as of year-end 2006.
25%
11%
17% 11%
28% 22%
11% 9% 0%
20%
40%
60%
80%
100%
120%
2006 2007 2008 2009 2010 2011
Liquidity levels stabilize
MF Share of Assets
MF Portfolio Growth
Total Assets Growth
6
so MIVs have a chance to offer loans with a 3- or 4-year tenor," says Mark van Doesburgh of Triple Jump. Mean-
while, BlueOrchard Finance's Maria Teresa Zappia mentions that "MFIs are starting to ask for subordinate debt,
which is an opportunity for MIVs to step in."
While competition from Latin American banks reflects the sector's growing maturity, MIVs are also dealing with sub-
stantial competitive pressure coming from the IFIs that have been nurturing MFIs for over a decade. Despite grow-
ing competition from both local and foreign private sources, "IFIs are still crowding out MIVs at the top of the mar-
ket, and are even more concentrated in Tier 1 MFIs," according to one fund manager.
Concurrent with crowding on the supply side, the market is also dealing with more limited absorptive capacity on the
demand side. MFIs may have resumed growth, but many fund managers continue to voice concerns about market
saturation and overindebtedness. While there is growing confidence about the continuing development of local infra-
structure, especially credit bureaus, the picture remains muddled in several important microfinance markets.
One manager is concerned about excessive optimism in post-crisis markets like Bosnia, where "money is coming back
too quickly." Others see growing risk of overindebtedness in Georgia and Cambodia. And yet, this concern is far
from unanimous – another manager explicitly mentioned continuing investment opportunities in Cambodia as a con-
tributor to future growth.
Regional differences
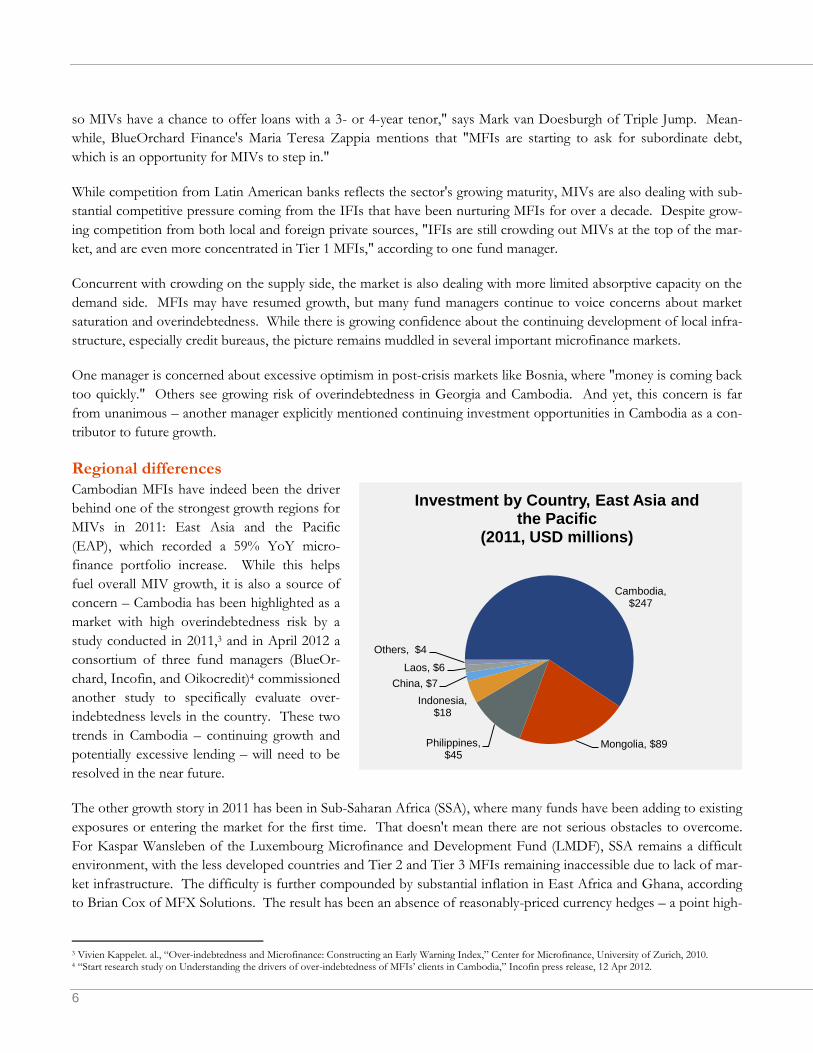
Cambodian MFIs have indeed been the driver
behind one of the strongest growth regions for
MIVs in 2011: East Asia and the Pacific
(EAP), which recorded a 59% YoY micro-
finance portfolio increase. While this helps
fuel overall MIV growth, it is also a source of
concern – Cambodia has been highlighted as a
market with high overindebtedness risk by a
study conducted in 2011,3 and in April 2012 a
consortium of three fund managers (BlueOr-
chard, Incofin, and Oikocredit)4 commissioned
another study to specifically evaluate over-
indebtedness levels in the country. These two
trends in Cambodia – continuing growth and
potentially excessive lending – will need to be
resolved in the near future.
The other growth story in 2011 has been in Sub-Saharan Africa (SSA), where many funds have been adding to existing
exposures or entering the market for the first time. That doesn't mean there are not serious obstacles to overcome.
For Kaspar Wansleben of the Luxembourg Microfinance and Development Fund (LMDF), SSA remains a difficult
environment, with the less developed countries and Tier 2 and Tier 3 MFIs remaining inaccessible due to lack of mar-
ket infrastructure. The difficulty is further compounded by substantial inflation in East Africa and Ghana, according
to Brian Cox of MFX Solutions. The result has been an absence of reasonably-priced currency hedges – a point high-
3 Vivien Kappelet. al., “Over-indebtedness and Microfinance: Constructing an Early Warning Index,” Center for Microfinance, University of Zurich, 2010. 4 “Start research study on Understanding the drivers of over-indebtedness of MFIs’ clients in Cambodia,” Incofin press release, 12 Apr 2012.
Cambodia, $247
Mongolia, $89 Philippines, $45
Indonesia, $18
China, $7
Laos, $6
Others, $4
Investment by Country, East Asia and the Pacific
(2011, USD millions)
THE STATE OF MICROFINANCE INVESTMENT 2012
MicroRate’s 7th
Annual Survey and Analysis of MIVs
7
lighted by several funds. However, despite the obstacles, MIV investment in SSA in 2011 recorded the largest in-
crease of any region (79%), surpassing the South Asia portfolio for the first time since 2006.
South Asia, despite continuing uncertainty in the Indian market, has also seen solid growth (35%), with some funds
taking advantage of the gap left by local banks that still shun the sector following the crisis in Andhra Pradesh. The
upside of the difficult market situation in India has been the higher pricing driven by "local liquidity scarcity, increases
in local reference rates, higher hedging costs, as well as higher credit risk," according to Martin Heimes of re-
sponsAbility. However, Mark van Doesburgh of Triple Jump was less sanguine about investing in the country, citing
the difficulty of making a profit given regulatory uncertainty and local currency volatility.
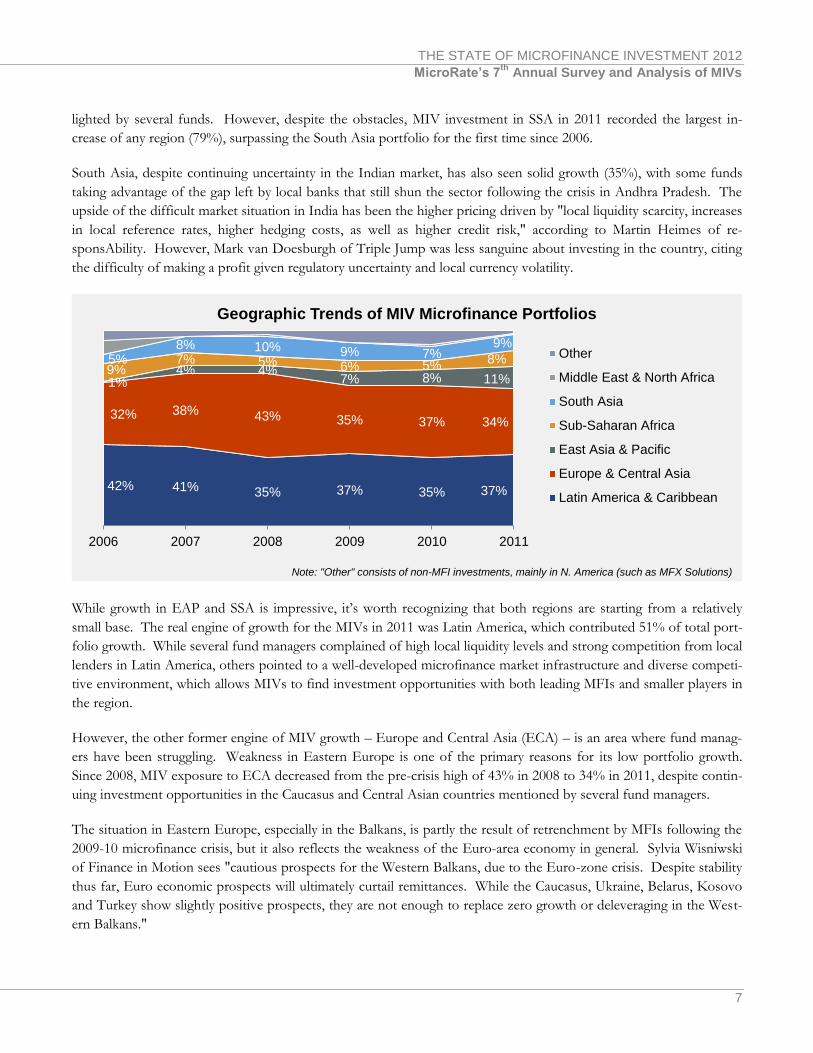
While growth in EAP and SSA is impressive, it’s worth recognizing that both regions are starting from a relatively
small base. The real engine of growth for the MIVs in 2011 was Latin America, which contributed 51% of total port-
folio growth. While several fund managers complained of high local liquidity levels and strong competition from local
lenders in Latin America, others pointed to a well-developed microfinance market infrastructure and diverse competi-
tive environment, which allows MIVs to find investment opportunities with both leading MFIs and smaller players in
the region.
However, the other former engine of MIV growth – Europe and Central Asia (ECA) – is an area where fund manag-
ers have been struggling. Weakness in Eastern Europe is one of the primary reasons for its low portfolio growth.
Since 2008, MIV exposure to ECA decreased from the pre-crisis high of 43% in 2008 to 34% in 2011, despite contin-
uing investment opportunities in the Caucasus and Central Asian countries mentioned by several fund managers.
The situation in Eastern Europe, especially in the Balkans, is partly the result of retrenchment by MFIs following the
2009-10 microfinance crisis, but it also reflects the weakness of the Euro-area economy in general. Sylvia Wisniwski
of Finance in Motion sees "cautious prospects for the Western Balkans, due to the Euro-zone crisis. Despite stability
thus far, Euro economic prospects will ultimately curtail remittances. While the Caucasus, Ukraine, Belarus, Kosovo
and Turkey show slightly positive prospects, they are not enough to replace zero growth or deleveraging in the West-
ern Balkans."
42% 41% 35% 37% 35% 37%
32% 38% 43% 35% 37% 34%
1% 4% 4%
7% 8% 11% 9%
7% 5% 6% 5% 8% 5%
8% 10% 9% 7% 9%
2006 2007 2008 2009 2010 2011
Geographic Trends of MIV Microfinance Portfolios
Other
Middle East & North Africa
South Asia
Sub-Saharan Africa
East Asia & Pacific
Europe & Central Asia
Latin America & Caribbean
Note: "Other" consists of non-MFI investments, mainly in N. America (such as MFX Solutions)
8
Countries in the Middle East and North Africa continue to play no significant role in MIV microfinance portfolios
(0.4%).
Investments and redemptions
The biggest story for the MIVs in 2011 was on the investment side. Total redemptions set an industry record of $467
million, and the resulting microfinance portfolio liquidations over the course of 2011 constituted $432 million, or 9%
of total MIV microfinance portfolio outstanding as of year-end 2010. Six closed-end funds with a combined micro-
finance portfolio of $188 million as of year-end 2010 matured in 2011. Most of these investments were held by three
fixed-term collateralized debt obligations (CDO) founded back in 2006-07, when the sector was experiencing its first
surge in investor interest.
Besides these scheduled redemptions, 2011 saw $245 million redeemed from open-ended funds, in large part as a di-
rect result of the volatility in the broader financial sector. According to Arman Vardanyan of Absolute Portfolio Man-
agement, institutional investors such as pension funds have been dealing with changes in internal regulations and
guidelines with respect to alternative investments, which in some cases led to unscheduled redemptions. One fund
saw an outflow of $163 million during 2011 (with an additional $57 million redeemed during the first half of 2012).
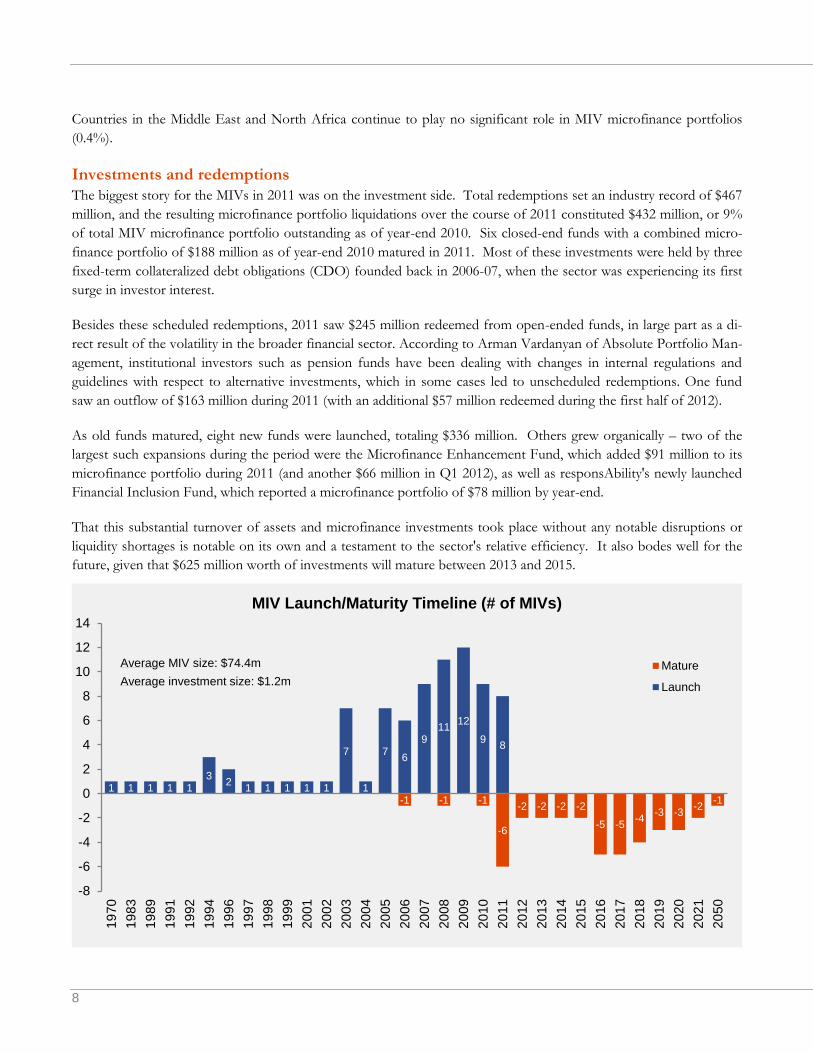
As old funds matured, eight new funds were launched, totaling $336 million. Others grew organically – two of the
largest such expansions during the period were the Microfinance Enhancement Fund, which added $91 million to its
microfinance portfolio during 2011 (and another $66 million in Q1 2012), as well as responsAbility's newly launched
Financial Inclusion Fund, which reported a microfinance portfolio of $78 million by year-end.
That this substantial turnover of assets and microfinance investments took place without any notable disruptions or
liquidity shortages is notable on its own and a testament to the sector's relative efficiency. It also bodes well for the
future, given that $625 million worth of investments will mature between 2013 and 2015.
1 1 1 1 1 3
2 1 1 1 1 1
7
1
7 6
9 11
12
9 8
-1 -1 -1
-6
-2 -2 -2 -2
-5 -5 -4
-3 -3 -2
-1
-8
-6
-4
-2
0
2
4
6
8
10
12
14
19
70
19
83
19
89
19
91
19
92
19
94
19
96
19
97
19
98
19
99
20
01
20
02
20
03
20
04
20
05
20
06
20
07
20
08
20
09
20
10
20
11
20
12
20
13
20
14
20
15
20
16
20
17
20
18
20
19
20
20
20
21
20
50
MIV Launch/Maturity Timeline (# of MIVs)
Mature
Launch
Average MIV size: $74.4m
Average investment size: $1.2m
THE STATE OF MICROFINANCE INVESTMENT 2012
MicroRate’s 7th
Annual Survey and Analysis of MIVs
9
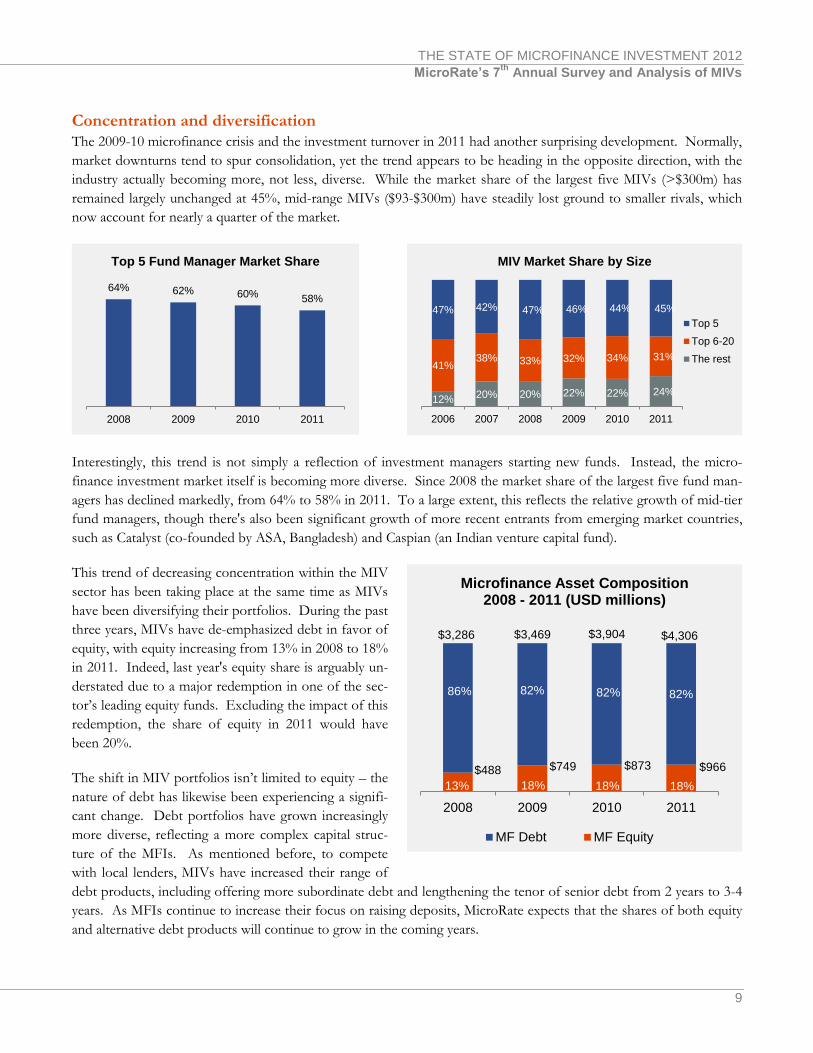
Concentration and diversification
The 2009-10 microfinance crisis and the investment turnover in 2011 had another surprising development. Normally,
market downturns tend to spur consolidation, yet the trend appears to be heading in the opposite direction, with the
industry actually becoming more, not less, diverse. While the market share of the largest five MIVs (>$300m) has
remained largely unchanged at 45%, mid-range MIVs ($93-$300m) have steadily lost ground to smaller rivals, which
now account for nearly a quarter of the market.
Interestingly, this trend is not simply a reflection of investment managers starting new funds. Instead, the micro-
finance investment market itself is becoming more diverse. Since 2008 the market share of the largest five fund man-
agers has declined markedly, from 64% to 58% in 2011. To a large extent, this reflects the relative growth of mid-tier
fund managers, though there's also been significant growth of more recent entrants from emerging market countries,
such as Catalyst (co-founded by ASA, Bangladesh) and Caspian (an Indian venture capital fund).
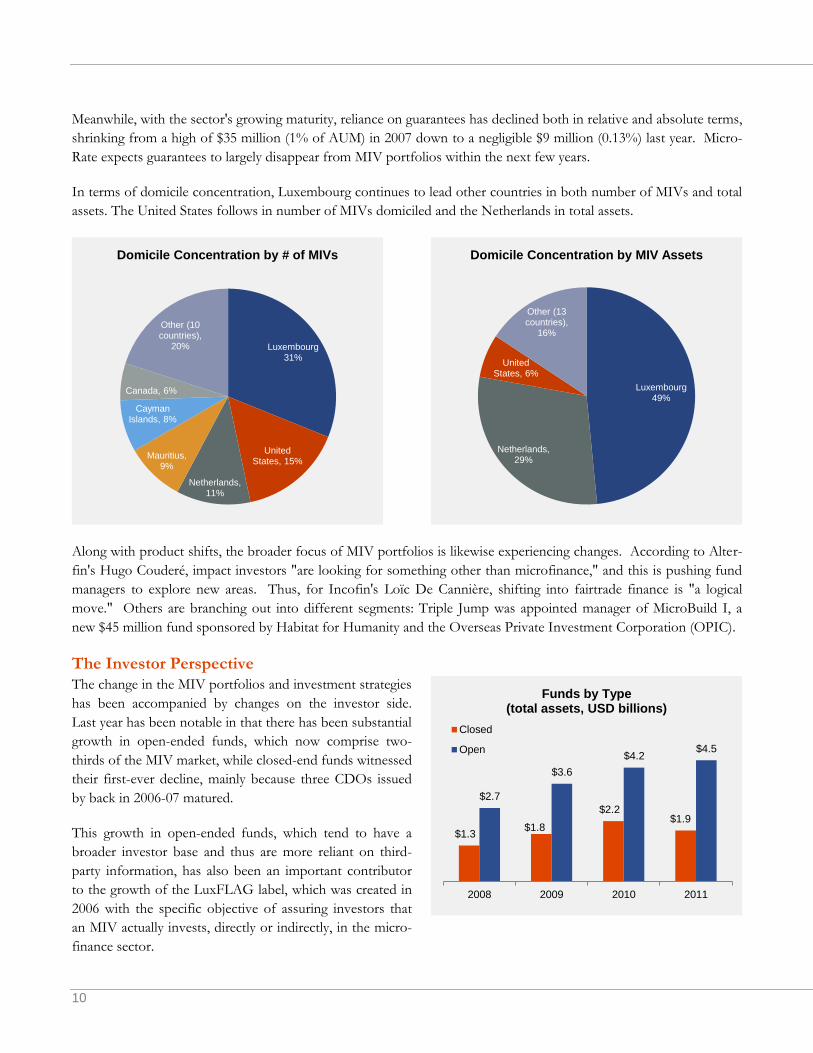
This trend of decreasing concentration within the MIV
sector has been taking place at the same time as MIVs
have been diversifying their portfolios. During the past
three years, MIVs have de-emphasized debt in favor of
equity, with equity increasing from 13% in 2008 to 18%
in 2011. Indeed, last year's equity share is arguably un-
derstated due to a major redemption in one of the sec-
tor’s leading equity funds. Excluding the impact of this
redemption, the share of equity in 2011 would have
been 20%.
The shift in MIV portfolios isn’t limited to equity – the
nature of debt has likewise been experiencing a signifi-
cant change. Debt portfolios have grown increasingly
more diverse, reflecting a more complex capital struc-
ture of the MFIs. As mentioned before, to compete
with local lenders, MIVs have increased their range of
debt products, including offering more subordinate debt and lengthening the tenor of senior debt from 2 years to 3-4
years. As MFIs continue to increase their focus on raising deposits, MicroRate expects that the shares of both equity
and alternative debt products will continue to grow in the coming years.
64% 62% 60% 58%
2008 2009 2010 2011
Top 5 Fund Manager Market Share
12% 20% 20% 22% 22% 24%
41% 38% 33% 32% 34% 31%
47% 42% 47% 46% 44% 45%
2006 2007 2008 2009 2010 2011
MIV Market Share by Size
Top 5
Top 6-20
The rest
$488 $749 $873 $966
$3,286 $3,469 $3,904 $4,306
13% 18% 18% 18%
86% 82% 82% 82%
2008 2009 2010 2011
Microfinance Asset Composition 2008 - 2011 (USD millions)
MF Debt MF Equity
10
Meanwhile, with the sector's growing maturity, reliance on guarantees has declined both in relative and absolute terms,
shrinking from a high of $35 million (1% of AUM) in 2007 down to a negligible $9 million (0.13%) last year. Micro-
Rate expects guarantees to largely disappear from MIV portfolios within the next few years.
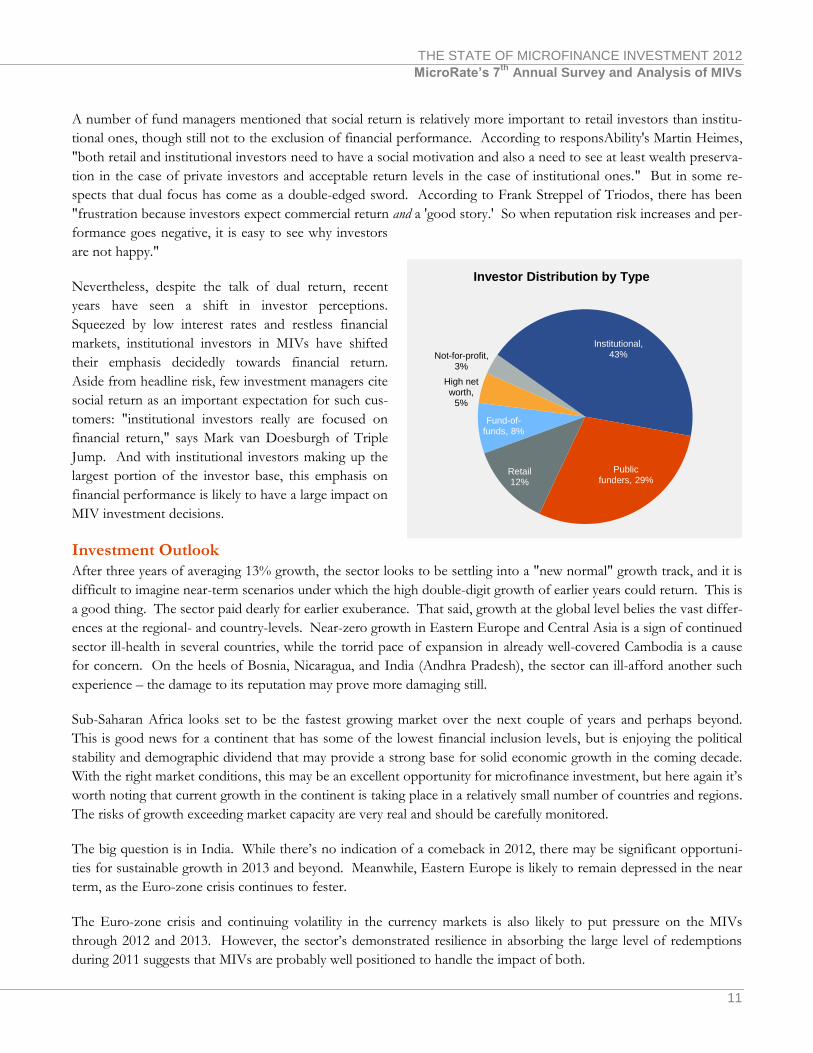
In terms of domicile concentration, Luxembourg continues to lead other countries in both number of MIVs and total
assets. The United States follows in number of MIVs domiciled and the Netherlands in total assets.
Along with product shifts, the broader focus of MIV portfolios is likewise experiencing changes. According to Alter-
fin's Hugo Couderé, impact investors "are looking for something other than microfinance," and this is pushing fund
managers to explore new areas. Thus, for Incofin's Loïc De Cannière, shifting into fairtrade finance is "a logical
move." Others are branching out into different segments: Triple Jump was appointed manager of MicroBuild I, a
new $45 million fund sponsored by Habitat for Humanity and the Overseas Private Investment Corporation (OPIC).
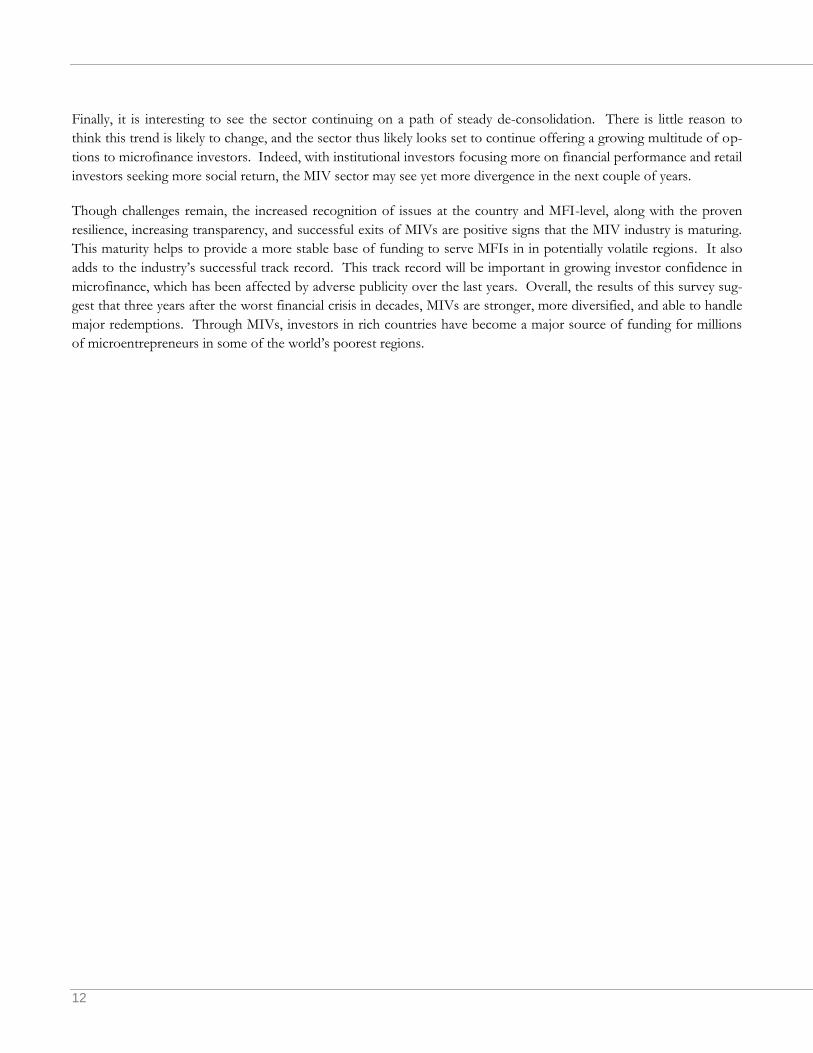
The Investor Perspective
The change in the MIV portfolios and investment strategies
has been accompanied by changes on the investor side.
Last year has been notable in that there has been substantial
growth in open-ended funds, which now comprise two-
thirds of the MIV market, while closed-end funds witnessed
their first-ever decline, mainly because three CDOs issued
by back in 2006-07 matured.
This growth in open-ended funds, which tend to have a
broader investor base and thus are more reliant on third-
party information, has also been an important contributor
to the growth of the LuxFLAG label, which was created in
2006 with the specific objective of assuring investors that
an MIV actually invests, directly or indirectly, in the micro-
finance sector.
Luxembourg 31%
United States, 15%
Netherlands, 11%
Mauritius, 9%
Cayman Islands, 8%
Canada, 6%
Other (10 countries),
20%
Domicile Concentration by # of MIVs
Luxembourg 49%
Netherlands, 29%
United States, 6%
Other (13 countries),
16%
Domicile Concentration by MIV Assets
$1.3 $1.8
$2.2 $1.9
$2.7
$3.6
$4.2 $4.5
2008 2009 2010 2011
Funds by Type (total assets, USD billions)
Closed
Open
THE STATE OF MICROFINANCE INVESTMENT 2012
MicroRate’s 7th
Annual Survey and Analysis of MIVs
11
A number of fund managers mentioned that social return is relatively more important to retail investors than institu-
tional ones, though still not to the exclusion of financial performance. According to responsAbility's Martin Heimes,
"both retail and institutional investors need to have a social motivation and also a need to see at least wealth preserva-
tion in the case of private investors and acceptable return levels in the case of institutional ones." But in some re-
spects that dual focus has come as a double-edged sword. According to Frank Streppel of Triodos, there has been
"frustration because investors expect commercial return and a 'good story.' So when reputation risk increases and per-
formance goes negative, it is easy to see why investors
are not happy."
Nevertheless, despite the talk of dual return, recent
years have seen a shift in investor perceptions.
Squeezed by low interest rates and restless financial
markets, institutional investors in MIVs have shifted
their emphasis decidedly towards financial return.
Aside from headline risk, few investment managers cite
social return as an important expectation for such cus-
tomers: "institutional investors really are focused on
financial return," says Mark van Doesburgh of Triple
Jump. And with institutional investors making up the
largest portion of the investor base, this emphasis on
financial performance is likely to have a large impact on
MIV investment decisions.
Investment Outlook
After three years of averaging 13% growth, the sector looks to be settling into a "new normal" growth track, and it is
difficult to imagine near-term scenarios under which the high double-digit growth of earlier years could return. This is
a good thing. The sector paid dearly for earlier exuberance. That said, growth at the global level belies the vast differ-
ences at the regional- and country-levels. Near-zero growth in Eastern Europe and Central Asia is a sign of continued
sector ill-health in several countries, while the torrid pace of expansion in already well-covered Cambodia is a cause
for concern. On the heels of Bosnia, Nicaragua, and India (Andhra Pradesh), the sector can ill-afford another such
experience – the damage to its reputation may prove more damaging still.
Sub-Saharan Africa looks set to be the fastest growing market over the next couple of years and perhaps beyond.
This is good news for a continent that has some of the lowest financial inclusion levels, but is enjoying the political
stability and demographic dividend that may provide a strong base for solid economic growth in the coming decade.
With the right market conditions, this may be an excellent opportunity for microfinance investment, but here again it’s
worth noting that current growth in the continent is taking place in a relatively small number of countries and regions.
The risks of growth exceeding market capacity are very real and should be carefully monitored.
The big question is in India. While there’s no indication of a comeback in 2012, there may be significant opportuni-
ties for sustainable growth in 2013 and beyond. Meanwhile, Eastern Europe is likely to remain depressed in the near
term, as the Euro-zone crisis continues to fester.
The Euro-zone crisis and continuing volatility in the currency markets is also likely to put pressure on the MIVs
through 2012 and 2013. However, the sector’s demonstrated resilience in absorbing the large level of redemptions
during 2011 suggests that MIVs are probably well positioned to handle the impact of both.
Fund-of-funds, 8%
High net worth,
5%
Not-for-profit, 3%
Institutional, 43%
Public funders, 29%
Retail 12%
Investor Distribution by Type
12
Finally, it is interesting to see the sector continuing on a path of steady de-consolidation. There is little reason to
think this trend is likely to change, and the sector thus likely looks set to continue offering a growing multitude of op-
tions to microfinance investors. Indeed, with institutional investors focusing more on financial performance and retail
investors seeking more social return, the MIV sector may see yet more divergence in the next couple of years.
Though challenges remain, the increased recognition of issues at the country and MFI-level, along with the proven
resilience, increasing transparency, and successful exits of MIVs are positive signs that the MIV industry is maturing.
This maturity helps to provide a more stable base of funding to serve MFIs in in potentially volatile regions. It also
adds to the industry’s successful track record. This track record will be important in growing investor confidence in
microfinance, which has been affected by adverse publicity over the last years. Overall, the results of this survey sug-
gest that three years after the worst financial crisis in decades, MIVs are stronger, more diversified, and able to handle
major redemptions. Through MIVs, investors in rich countries have become a major source of funding for millions
of microentrepreneurs in some of the world’s poorest regions.

THE STATE OF MICROFINANCE INVESTMENT 2012
MicroRate’s 7th
Annual Survey and Analysis of MIVs
13
14
APPENDIX I: GLOBAL MIV LIST AS OF DECEMBER 2011
MIV Survey Participants 1. AavishkaarGoodwell India Microfinance Devel-
opment Company
2. AavishkaarGoodwell India Microfinance Devel-
opment Company II Limited
3. Access Africa Fund, LLC
4. AccessBank Bond I
5. ACCION Gateway Fund LLC
6. ACCION International Global Bridge Fund
7. ACCION Investments in Microfinance, SPC
8. Advans SA, SICAR
9. Africap Microfinance Investment Company Ltd.
10. Alterfin
11. ASN-Novib Microcredit Fund
12. Azure Global Microfinance Fund SICAV- SIF
13. Balkan Financial Sector Equity Fund
14. Bellwether Microfinance Fund Private Limited
15. BlueOrchard Loans for Development 2007
16. BlueOrchard Microfinance Fund (formerly Dexia
Micro-Credit Fund: BlueOrchard Debt Sub-Fund)
17. Capital For Communities Fund
18. Catalyst Microfinance Investors
19. ConsorzioEtimos S.C.
20. Creation Investments Social Ventures Fund I
21. Deutsche Bank Microcredit Development Fund
22. Dual Return Fund - Vision Microfinance
23. Dual Return Fund - Vision Microfinance Local
Currency
24. Dutch Microfinance Fund
25. DWM Microfinance Equity Fund I
26. DWM Microfinance Fund
27. DWM Microfinance Fund-J
28. Elevar Equity II, LP
29. EMF Microfinance Fund AGmvK
30. ESPA VINIS Microfinance
31. Etimos Fund Global Microfinance Debt
32. FEFISOL
33. FINCA Microfinance Fund B.V.
34. FONIDI, s.e.c.
35. Gawa Microfinance Fund I
36. Global Partnerships Microfinance Fund 2008,
LLC
37. Global Partnerships Social Investment Fund 2010,
LLC
38. Goodwell West Africa Microfinance Development
Company
39. Gray Ghost Microfinance Fund
40. Hivos-Triodos Fund Foundation
41. IC Fund Sicav-Sif Asian Women Microfinance
Sub-Fund
42. Impulse Microfinance Investment Fund
43. Incofincvso
44. India Financial Inclusion Fund
45. Invest in Visions Microfinance Fund
46. Investisseur et Partenaire pour le Développment
47. KCD-Mikrofinanz-Fonds (FIS) I Global
48. KCD-Mikrofinanz-Fonds (FIS) II Lateinamerika
49. LOCFUND L.P.
50. Lok Capital LLC
51. Luxembourg Microfinance and Development
Fund - Social Venture Capital Sub-Fund
52. MicroCredit Enterprises
53. Microfinance Growth Fund
54. Microfinance Enhancement Facility SA
55. MicroVentures Investments SA, SICAR
56. MicroVest II-A, LP
57. MicroVest Short Duration Fund, LP
58. MicroVest+Plus, LP
59. Minlam Microfinance Offshore Master Fund, LP
60. MV MicrofinPvt Ltd
61. MVH SpA (former MicroVentures SPA)
62. NMI Global Fund, KS
63. Oikocredit Ecumenical Development Co-
operative Society U.A.
64. Partners for the Common Good
65. Próspero Microfinanzas Fund, LP
66. responsAbility Global Microfinance Fund
67. responsAbility SICAV (Lux) Financial Inclusion
Fund
68. responsAbility SICAV (Lux) Microfinance Lead-
ers
69. responsAbility SICAV (Lux) Mikrofinanz-Fonds
70. Rural Impulse Fund II
71. Rural Impulse Fund, SA
72. Sarona Frontier Markets Fund 1 LP
THE STATE OF MICROFINANCE INVESTMENT 2012
MicroRate’s 7th
Annual Survey and Analysis of MIVs
15
MIV Survey Participants (continued)
73. Sarona Risk Capital Fund 1 LP
74. Sarona Risk Capital Fund MEDA
75. ShoreCap International
76. SNS Institutional Microfinance Fund
77. SNS Institutional Microfinance Fund II
78. Societe Cooperative Fonds International de Gar-
antie
79. SolidaritéInternationale Pour le Développement et
L'Investissement
80. StichtingTriodos-Doen
81. The European Fund for Southeast Europe
SICAV-SIF
82. Triodos Fair Share Fund
83. Triodos SICAV II-Triodos Microfinance Fund
84. Unitus Equity Fund LP
85. VG Microfinance-Invest Nr. 1 GmbH
86. Wallberg Global Microfinance FCP II
MIVs that did not submit information
1. CreSudSpA
2. Coopest S.A.
3. Envest Microfinance Cooperative
4. Finethic Microfinance Fund Sicar
5. Global Microfinance Equity Fund
6. Global Microfinance Facility
7. Latin American Challenge Investment Fund
8. Microfinance Loan Obligation Compartment LC
9. Microfinance Loan Obligations (MFLO 3) Com-
partment Sub Debt
10. Microfinance Loan Obligations SA Compartment
Opportunity Eastern Europe 2005-1
11. NMI Frontier Fund, KS
12. Regional MSME Investment Fund for Sub-
Saharan Africa (REGMIFA)
13. Selectum SICAV SIF-BL Microfinance Fund
14. Solidus Investment fund
15. Fonds Desjardins pour la Finance inclusive, Socié-
té en commandite
16. BlueOrchard Private Equity Fund, S.C.A.,
SICAV-FIS
16
About Citi Microfinance
Working across Citi’s businesses, product groups and geographies, Citi Microfinance serves more than 100 micro-
finance institutions (MFIs), networks and investors as clients and partners in over 40 countries with products and ser-
vices spanning the financial spectrum – from financing, access to capital markets, transaction services and hedging
foreign exchange risk, to credit, savings, remittances and insurance products - to expand access to financial services
for the underserved. www.citi.com/citi/microfinance
About European Investment Bank
The European Investment Bank Group has a long-standing track record in microfinance, supporting leading micro-
finance institutions, fund providers and stakeholders, helping them to address specific market failures and promoting
financing solutions to micro, small and medium-sized enterprises, as well as to low-income groups.
Since 2003, the EIB Group has committed EUR 881m to microfinance activities, in nearly 50 countries, inside the
European Union, in EU Neighbouring and Candidate countries, and outside the European Union, where the Bank is
active across the sub-Saharan African, Caribbean and Pacific regions as well as in the Mediterranean partner countries.
www.eib.org/products/microfinance/index.htm
About the Grand-Duchy of Luxembourg
The Grand-Duchy of Luxembourg was among the first countries in the EU to recognize the importance and the value
of microfinance as a means to fight poverty.
Luxembourg now has an established position as a leading financial center, as growing numbers of international inves-
tors recognize its various advantages. Indeed, the Luxembourg Government has implemented major legal and tax re-
forms with the aim of permitting flexibility to meet the needs of international investors within a strong regulatory
framework. Luxembourg has become today Europe’s number one investment fund center and the world’s leading hub
for global fund distribution.
Luxembourg is a leading center for the domiciliation of MIVs. Approximately one-third of all MIVs, representing
49% of total MIV assets, are domiciled in Luxembourg. Six of the world’s ten largest MIVs are based in Luxembourg.
About LuxFLAG
The Luxembourg Fund Labelling Agency (LuxFLAG) is an independent, non-profit-making association created in
Luxembourg in July 2006 by seven founding partners who are the Charter Members. LuxFLAG supports the financ-
ing of sustainable development by providing clarity for investors through awarding International Labels.
The Agency aims to promote the raising of capital for Microfinance and Environment related sectors by awarding a
recognizable label to eligible Microfinance Investment Vehicles (MIVs) and Environment-related Investment Vehicles
(EIVs). Its objective is to reassure investors that the MIV/EIV actually invests, directly or indirectly, in the micro-
finance/environment sector. The MIV/EIV may be domiciled in any jurisdiction that is subject to a level of national
supervision equivalent to that available in European Union countries. www.luxflag.org
THE STATE OF MICROFINANCE INVESTMENT 2012
MicroRate’s 7th
Annual Survey and Analysis of MIVs
17
The Next Step
In response to investor interest in assessing the financial and social performance of responsible investment op-
tions, MicroRate has launched Luminis to provide investors with objective, comparable data and analysis on MIVs.
The Luminis analytical and reporting methodology focuses on the four key dimensions of microfinance funds:
performance, risk, social, and management (PRSM). Luminis offers PRSM profiles and in-depth fund reports via
its web platform, www.luminismicrofinance.com.
… for Investors
MIVs provide investors with a unique opportunity to diversify their portfolio. These investments have historically
provided low correlation and stable returns while providing a socially-beneficial service to the end borrowers.
However, in the past it has been difficult for investors to identify which funds meet their particular investment
criteria. By providing a tool to analyze and compare funds, Luminis allows investors to make objective, well-
informed microfinance investment decisions to achieve their desired financial and social returns.
Learn more about MIVs through the Luminis fund reports and PRSM profiles by logging onto
www.luminismicrofinance.com or contacting Luminis.
… for MIVs
MIVs have the opportunity to join the Luminis List of funds featured for their industry-leading commitment to
transparency. By participating in the Luminis evaluation process you can ensure that investors have complete data
and analysis on your fund. To join the Luminis List, contact us to request a data intake form. Submit your infor-
mation and participate in a follow up call to review your information and discuss your fund’s approach and per-
spective. Review the final fund report for factual accuracy before it is made available for purchase on Luminis. If
your fund has recently gone through an MFX evaluation you may use that previously submitted information for
this process.
Visit www.luminismicrofinance.com or to learn more about subscribing to Luminis or to join the Luminis List,
contact Rebecca Spradlin ([email protected]) or +1.703.243.5340 x12.
A service of MicroRate
The State of Microfinance Investment 2012: MicroRate’s 7th Annual Survey and Analysis on MIVs was
made possible by the generous support of:
To download The State of Microfinance Investment 2012 visit: www.microrate.com
or email: [email protected]
A service of MicroRate