state board sbac oct 5
DESCRIPTION
Delaware State Board of Education Smarter Balanced Assessment Workshop Presentation October 5th, 2015TRANSCRIPT

Smarter Balanced Assessment
Data, Tools, and Resources
We have new state test scores, what does that mean?

5 years ago, new ELA and Math standards were adopted…
2
Every single student in our system will graduate
college and career ready, with the freedom to choose
his or her life’s course
Dramatically improved classroom instruction
Rigorous
standards,
curriculum, and
assessments
Deep support for
the lowest-
achieving schools
Effective teachers
and leaders
Sophisticated data
systems and
practices
Support from the DDOE → LEAs → schools → individual classrooms
Collaboration between educators, communities, and all Delawareans

Proficient vs. Prepared
Addressing Delaware’s Honesty Gap
“We know that the test is going to be more difficult, so we think it’s important
for Delaware, and for that matter all states that are in the middle of this
transition, to ensure that when scores drop, educators and families know that
it’s not because students are performing worse but because we’re being honest
with them.”
-Governor Jack Markell May 14, 2015
3

Smarter Balanced: New Tests, New Baseline
• Smarter Balanced is a harder, more rigorous assessment than any prior state test.
• With a greater emphasis on deeper learning, we have raised the bar and are testing new skills, based on what students will need to know and be able to do to be successful in their futures.
• We expected fewer students than in the past would initially clear this higher bar.
• That doesn’t mean students know less or are doing worse than in previous years.
• Last spring’s test established a new baseline to measure student performance and growth moving forward.
• State ELA Proficiency 51.9% State Math Proficiency 38.8%
4

SMARTER RESOURCES AND COMMUNICATIONS

What Do Score Reports Look Like?
8
The “Scale
Score” is
the
student’s
score on
the test.
Scores can
be between
2000 and
3000, the
range
varies by
grade.
The
Achievement
Level shows if
the student met
the standard
(Level 3 and
above). This
also shows how
the student
score compares
to school,
district and
state
Here is
information
on student
strengths
and areas of
growth
within the
subject

Toolkit for Districts & Schools
• Videos (SBE YouTube Channel)
• One page Summary Documents
• Sample Score Reports
• Educator Trainings
• FAQ Documents
• Templates for parents and educators
• Online tools and Resources (DelExcels.org and others)
9

Two Handouts – also on SBE site
10

DelExcels.org
11

Be A Learning Hero
12

Great Kids
13

What does it mean?
A look into the 1st year of Smarter Balanced Assessment scores

15
Statewide English Language Arts
Projected vs Actual Proficiency
38%41%
44%41%
38%41% 41%
54% 54% 55%
48% 50% 49%52%
0%
10%
20%
30%
40%
50%
60%
70%
80%
90%
100%
Grade 3 Grade 4 Grade 5 Grade 6 Grade 7 Grade 8 Grade 11
Projected Actual DENote: “Projected” is based on the national field test conducted in Spring 2014. “Actual DE” are the results from Delaware students on
the 2015 Smarter assessment.
Statewide Overall Proficiency:
51.9%

16
Statewide Mathematics
Projected vs Actual Proficiency
39% 37%33% 33% 33% 32% 33%
53%
47%
38%34%
37% 35%
23%
0%
10%
20%
30%
40%
50%
60%
70%
80%
90%
100%
Grade 3 Grade 4 Grade 5 Grade 6 Grade 7 Grade 8 Grade 11
Projected Actual DE
Note: “Projected” is based on the national field test conducted in Spring 2014. “Actual DE” are the results from Delaware students on
the 2015 Smarter assessment.
Statewide Overall Proficiency:
38.8%

17
Claims Data
How did Delaware Compare?

19
Delaware’s SBAC scores for 3rd grade literacy among
best in the nation
0
10
20
30
40
50
60
CA WV HI OR ID ME SD WA VT CT DE MO
CA
WV
HI
OR
ID
ME
SD
WA
VT
CT
DE

20
By 8th grade ELA falls to the second tier
0
10
20
30
40
50
60
70
WV CA HI ME SD DE ID VT CT WA OR MO
WV
CA
HI
ME
SD
DE
ID
VT
CT
WA
OR
MO

21
0
10
20
30
40
50
60
CA WV ME OR CT HI ID SD MO VT DE WA
CA
WV
ME
OR
CT
HI
ID
SD
MO
VT
DE
WA
Delaware: Among the best 3rd grade Math SBAC scores

22
By 8th grade, Math proficiency is in the lower half
0
5
10
15
20
25
30
35
40
45
50
WV MO CA ME DE ID CT SD HI VT OR WA
WV
MO
CA
ME
DE
ID
CT
SD
HI
VT
OR
WA

Table TalkWhat trends do you see and what local policy
levers would you look at to address those
trends
Let’s look deeper within DE data

0.0%
10.0%
20.0%
30.0%
40.0%
50.0%
60.0%
70.0%
80.0%
50% 55% 60% 65% 70%
Per
cent P
rofi
cien
t
Percent Low Income
Proficiency in ELA in 50% to 70% Low income schools

Poverty is not an excuse…it is not destiny
• Towne Point Elementary
• South Dover Elementary
• John M. Clayton Elementary
• Benjamin Banneker Elementary
26
Schools with 50% or higher Low Income and high ELA proficiency
• Long Neck Elementary
• Booker T. Washington Elementary
• Lake Forest South
• Lake Forest East

0.0%
10.0%
20.0%
30.0%
40.0%
50.0%
60.0%
70.0%
50% 55% 60% 65% 70%
Per
cent P
rofi
cien
t
Percent Low Income
Proficiency in Math in 50% to 70% Low Income schools
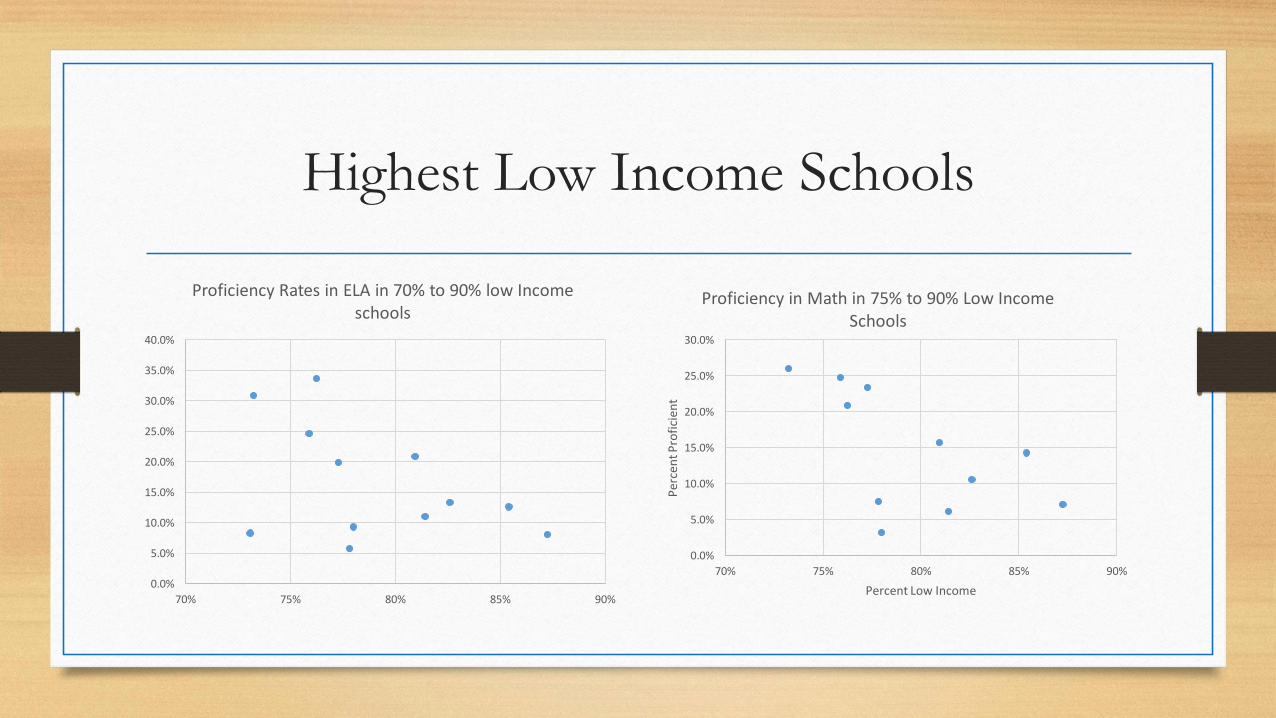
Highest Low Income Schools
0.0%
5.0%
10.0%
15.0%
20.0%
25.0%
30.0%
70% 75% 80% 85% 90%
Per
cen
t P
rofi
cien
t
Percent Low Income
Proficiency in Math in 75% to 90% Low Income Schools
0.0%
5.0%
10.0%
15.0%
20.0%
25.0%
30.0%
35.0%
40.0%
70% 75% 80% 85% 90%
Proficiency Rates in ELA in 70% to 90% low Income schools

Notable Data Points
• Lewis Dual Language and Thomas Edison Charter School – both more than
73% low income – doubling the percent proficient compared to similar schools
• Schools with more than 60% low income are outperforming the State Average
• Georgetown Elementary, South Dover Elementary, and John M. Clayton Elementary

Schools using multiple resources and initiatives
to “beat the odds”
• North Dover Elementary (50% Low-income, high staff retention, school climate,
and aligned professional learning) – Above State Average in ELA (67.5%) & Math
(55.2%)
• Kuumba Charter School – 58% Low-income, Focus on the reflective practitioner, and
curriculum connecting math and the arts – Above State Average in Math
• Prior Focus and Partnership Zone schools utilizing school-wide supports to show
significant gains: Lewis Dual Language, Booker T. Washington Elementary, and
Benjamin Banneker Elementary
30
Types of data to review
• Multiple measures, disaggregated data
• Growth
• College and Career Readiness measures
• Data from other metrics
• Shift the conversation from one purely about proficiency and discuss performance based on multiple measures of growth and achievement

32

33
What is the state doing to support Literacy?Professional Learning for educators:
• Common Ground for the Common Core 3.0: Deepening
Literacy Practices Across the Content Areas
• Learning Leader Network: Principal Support for Literacy
• eLearning Courses: Focus on Writing/Focus on Reading
Teacher Leadership and Resource Development:
• Reading/Writing Project and Resources: Unit Development
and Rubrics
Other Initiatives:
• Digital Library
• Literacy Coalition/Diamond State Reading
Association Partnership
• Literacy Cadre Steering Committee: Writing
Progressions
• Innovation Grants for professional learning
– Districts can focus on ELA
North Dover Elementary, Dover, DE
Seaford High School, Seaford, DE

34
Professional Learning for educators:
• Learning Leader Network: Principal Support for Math
• Teaching and Learning Cadre: 3-Part Math Series
• Math-in-CTE: SREB/DOE partnership
Teacher Leadership and Resource Development:
• Dream Team: Focus on Math for 2015-16
What is the state doing to support
Mathematics?
Other Initiatives:
• CCSS Site Visits to all districts
• Foundations of College Math
• Math and Science Partnership (MSP) grants
for 2016
• Innovation Grants for professional learning
– Districts can focus on Mathematics
New Castle Elementary, New Castle, DE
Stubbs Elementary, Wilmington, DE

Local Policy Levers
• Curriculum and Text Book Selection
• Staffing and Leadership
• Professional Development
• School Calendar and Schedule
• Extended School Day and Year Programs
• Wrap - Around Services
• Community Partnerships

What are others doing that is
making an impact?
District Leaders Panel Presentation