star formation and gas inflows in the oh megamaser galaxy
TRANSCRIPT

MNRAS 479, 3966–3977 (2018) doi:10.1093/mnras/sty1606Advance Access publication 2018 June 18
Star formation and gas inflows in the OH megamaser galaxyIRAS03056+2034
C. Hekatelyne,1‹ Rogemar A. Riffel,1‹ Dinalva Sales,2 Andrew Robinson,3
Thaisa Storchi-Bergmann,4‹ Preeti Kharb,5 Jack Gallimore,6 Stefi Baum7,8 andChristopher O’Dea7,9
1Departamento de Fısica, CCNE, Universidade Federal de Santa Maria, Santa Maria 97105-900, RS, Brazil2Instituto de Matematica, Estatıstica e Fısica, Universidade Federal do Rio Grande, Rio Grande 96203-900, Brazil3School of Physics and Astronomy, Rochester Institute of Technology, 84 Lomb Memorial Drive, Rochester, NY 14623, USA4Departamento de Astronomia, Universidade Federal do Rio Grande do Sul. 9500 Bento Goncalves, Porto Alegre 91501-970, Brazil5National Centre for Radio Astrophysics, Tata Institute of Fundamental Research, S. P. Pune University Campus, Post Bag 3, Ganeshkhind, Pune 411 007,India6Department of Physics, Bucknell University, Lewisburg, PA 17837, USA7Department of Physics and Astronomy, University of Manitoba, Winnipeg, MB, R3T 2N2, Canada8Center for Imaging Science, Rochester Institute of Technology, 84 Lomb Memorial Dr., Rochester, NY 14623, USA9School of Physics & Astronomy, Rochester Institute of Technology, 84 Lomb Memorial Dr., Rochester, NY 14623, USA
Accepted 2018 June 11. Received 2018 June 8; in original form 2018 April 20
ABSTRACTWe have obtained observations of the OH megamaser galaxy IRAS03056+2034 using theGemini Multi-Object Spectrograph (GMOS) Integral Field Unit (IFU), Very Large Array(VLA), and Hubble Space Telescope (HST). The HST data reveals spiral arms containingknots of emission associated with star-forming regions. The GMOS-IFU data cover the spectralrange of 4500–7500 Å at a velocity resolution of 90 km s−1 and spatial resolution of 506 pc.The emission-line flux distributions reveal a ring of star-forming regions with radius of 786 pccentred at the nucleus of the galaxy, with an ionized gas mass of 2.1 × 10⁵ M�, an ionizingphoton luminosity of log Q[H+] = 53.3, and a star formation rate of 1.4 M� yr−1. Theemission-line ratios and radio emission suggest that the gas at the nuclear region is excitedby both starburst activity and an active galactic nucleus. The gas velocity fields are partiallyreproduced by rotation in the galactic plane, but show, in addition, excess redshifts to the eastof the nucleus, consistent with gas inflows towards the nucleus, with velocity of ∼45 km s−1
and a mass inflow rate of ∼2.2 × 10⁻³ M� yr−1.
Key words: galaxies: individual: IRAS03056+2034 – galaxies: kinematics and dynamics –galaxies: nuclei.
1 IN T RO D U C T I O N
OH megamasers (hereafter OHMs) are powerful extragalac-tic masers in which emission occurs predominantly in the1667/1665 MHz lines with typical luminosities of about 103 L�.The isotropic luminosity of OHMs is 108 times greater than theluminosity of the OH masers in the Milk Way. The megamaserscan be explained on the basis of amplification of the nuclear radiocontinuum by foreground molecular material with inverted levelpopulations arising from some pumping source (e.g. Baan, Salzer& LeWinter 1998; Lo 2005).
� E-mail: [email protected] (CH); [email protected] (RAR);[email protected] (TS-B)
In general, OHMs have been observed in (ultra) luminous infraredgalaxies [(U)LIRGs] with infrared luminosities of LIR >= 1011 L�.These merging systems fulfill all the requirements for producingOHM emission. The merger interaction concentrates molecular gasin the galactic nuclei, creates strong dust emission from the starburst(SB) and active galactic nucleus (AGN) activity, and produces radiocontinuum emission from the AGN or SB (e.g. Henkel, Guesten &Baan 1987; Darling & Giovanelli 2000).
It is not well understood if the mechanism of ionization in thesystems that host OHM is dominated by star formation or AGN ac-tivity, in the sense that the hosts of OHM emission usually presentfeatures of both phenomena in their spectra. A possible explanationfor these features is that they originate in a central AGN, con-taminated by emission of circumnuclear star-forming regions, as
C© 2018 The Author(s)Published by Oxford University Press on behalf of the Royal Astronomical Society
Dow
nloaded from https://academ
ic.oup.com/m
nras/article-abstract/479/3/3966/5039672 by Universidade Federal do R
io Grande do Sul user on 07 N
ovember 2018

The OH megamaser galaxy IRAS03056 3967
the angular resolution of the observations usually corresponds toa few kiloparsecs at the galaxies. Alternatively, the OHM galax-ies could represent a transition stage between a starburst and theemergence of an AGN, as suggested by Darling & Giovanelli(2006).
In an effort to investigate the nature of the ionization inOHM galaxies, we have been performing a multiwavelengthstudy of a sample of these galaxies (Sales et al. 2015; Hekate-lyne et al. 2018). In this paper, we present Gemini Multi-ObjectSpectrograph (GMOS) Integral Field Unit (IFU) observations,Very Large Array (VLA) continuum data, and Hubble SpaceTelescope (HST) narrow and broad-band images of the galaxyIRAS03056+2034, which is an LIRG that hosts OHM emis-sion. This target is part of a sample including another 14 OHMgalaxies, for which we have the same combination of HST andVLA data. The targets selected for IFU observations were chosenbased on the morphology revealed by the HST images. This pa-per is part of a series based on multiwavelength observations withthe aim of studying the gas kinematics and excitation of OHMgalaxies.
In a previous paper (Hekatelyne et al. 2018), we mapped theeastern nucleus of the OHM galaxy IRASF23199+0123 using HST,VLA, and GMOS data. We were able to conclude that the objectis an interacting pair with a tail connecting the two galaxies anddetected two OH maser sources associated with the eastern member.Moreover, we discovered a Seyfert 1 nucleus in the eastern memberof the pair, via detection of an unresolved broad double-peakedcomponent in the Hα emission line. In addition, the masing sourceswere observed in the vicinity of a region of enhanced velocitydispersion and higher line ratios, suggesting that they are associatedwith shocks driven by AGN outflows. These results suggest that theOH megamaser emission in IRASF23199+0123 is associated withAGN activity. Sales et al. (2015) presented a multiwavelength studyof the OH megamaser galaxy IRAS16399–0937 using HST, VLA,2MASS, Herschel, and Spitzer data. This galaxy has two nucleiseparated by 3.4 kpc and its infrared spectrum is dominated bystrong polycyclic aromatic hydrocarbon, but the northern nucleusshows in addition deep silicate and molecular absorption features.The analysis of the spectral energy distribution reveals that thenorthern nucleus contains an AGN with bolometric luminosity of1044 erg s−1.
IRAS03056+2034 (hereafter IRAS03056) is a spiral galaxy(SB(rs)B; Vaucouleurs et al. 1991) that presents strong OHMemission. This detection was obtained with the Nancay radiotelescope in 1990, indicating FIR luminosity of 15 × 1010 L�(Bottinelli et al. 1990). Baan et al. (1998) used spectroscopicdata obtained with the 200 inch Hale telescope at the Palo-mar Observatory in order to determine the optical classifica-tions of 42 OHM galaxies, based on line ratios, and classifiedIRAS03056 as a starburst galaxy. We adopt the distance of 116Mpc as derived by Theureau et al. (2007) from the Tully–Fisherrelation.
We have obtained GMOS-IFU data covering the central regionof IRAS03056 in order to map the distribution and kinematics ofthe emitting gas and investigate the origin of the line emission inthe central region of this object. This paper is organized as follows.The observations and the data reduction procedure are described inSection 2. The emission-line flux distributions, emission-line ratio,and kinematics maps obtained from GMOS data, as well as theHST and VLA images, are presented in Section 3. These results arediscussed in Section 4 and then in Section 5 we present the finalremarks.
2 O B S E RVAT I O N S A N D DATA R E D U C T I O N
2.1 HST images
The HST images of IRAS03056 were obtained with the AdvancedCamera for Surveys (ACS). The acquired images consist of contin-uum and emission-line imaging of a sample of 15 OHM galaxies(Program id 11604; PI: D.J. Axon). The observations were donewith the wide-field channel (WFC) using broad- (F814W), narrow-(FR656N), and medium-band (FR914M) filters. The total integra-tion times were 600 s for the broad-band filter, 200 s for the medium-band filter, and 600 s for the narrow-band filter, which contains theHα and [NII] lines.
The images were processed using IRAF packages (Tody 1986,1993). First of all, the cosmic rays were removed from the imagesusing the LACOS IM task (van Dokkum 2001). In order to build acontinuum-free Hα + [NII] image of IRAS03056, we estimated thecount rate for foreground stars considering the medium- and narrow-band images. This procedure allowed us to define a mean scalingfactor that was applied to the medium-band image. It provided usa scaled image that was subtracted from the narrow-band image(Sales et al., in preparation).
Finally, the continuum-free image was inspected to certify thatthe residuals at the positions of the foreground stars are negligible.This procedure results in typical uncertainties of 5–10 per cent influx (see Hoopes, Walterbos & Rand 1999; Rossa & Dettmar 2000,2003).
2.2 VLA radio continuum data
We reduced archival VLA A-array data at 1.425 GHz from theproject AB660. These data were acquired on 1992 December 14.The data were reduced following standard procedures in AIPS. Thefinal image of IRAS03056 was created after a couple of phase-onlyand phase+amplitude self-calibrations, using the AIPS tasks CALIB
andIMAGR iteratively. The r.m.s. noise in the image is ∼7 × 10⁻⁵
Jy beam−1. The restoring beam is 1.49 × 1.38 arcsec at a positionangle (PA) = −35◦. The peak intensity of the compact radio coreseen in the image is ∼11 mJy beam−1. An image at 4.86 GHz fromthe project AB660 at a resolution of 0.38 × 0.34 arcsec (beamPA = −34.5◦) was also available in the NRAO image archive. Apoint source of peak intensity ∼1.7 mJy beam−1 is visible in thisimage; the r.m.s. noise is ∼8.7 × 10⁻⁵ Jy beam−1.
2.3 GMOS-IFU data
Optical spectroscopic data for IRAS03056 was obtained at the Gem-ini North telescope, using the GMOS-IFU (Allington-Smith et al.2002; Hook et al. 2004). The observations were performed in 2013October, November, and December (Gemini project GN-2013B-Q-97 – PI: D. Sales). The observations were carried out using the B600grating in combination with the G5307 filter, with the major axis ofthe IFU oriented along PA = 120◦, approximately along the majoraxis of the galaxy.
The total integration time was 12000 s divided into 10 individualexposures of 1200 s each. The one slit mode of GMOS-IFU wasused, resulting in a total angular coverage of 5.0 × 3.5 arcsec, anda spectral range that includes the H α, [N II]λ6583, [S II]λ6717, Hβ,[O III]λ5007, and [O I]λ6300 emission lines.
In order to process the data, we followed the standard steps forspectroscopic data reduction using GEMINI package routines of
MNRAS 479, 3966–3977 (2018)
Dow
nloaded from https://academ
ic.oup.com/m
nras/article-abstract/479/3/3966/5039672 by Universidade Federal do R
io Grande do Sul user on 07 N
ovember 2018

3968 C. Hekatelyne et al.
Figure 1. Large-scale i-band image of IRAS03056 obtained with HST.
IRAF (Lena 2014). The basic steps of the data reduction comprisebias level subtraction, flatfielding, trimming, and wavelength cali-bration. We used the CuAr arc lamps as reference in order to applythe wavelength calibration to the data and subtracted the sky emis-sion contamination. In order to apply the flux calibration, we useda sensitivity function that was generated from a spectrum of theBD+28 4211 photometric standard star, observed on the same nightas the galaxy exposures.
After flux calibration, we created data cubes for each exposureat a sampling of 0.1 × 0.1 arcsec. These data cubes were mediancombined using the IRAF GEMCOMBINE task resulting in the final datacube for the object. In the mosaicking process, we used as a ref-erence the peak of the continuum emission and used the AVSIGCLIP
algorithm to remove bad pixels.The adopted GMOS configuration resulted in a spectral resolu-
tion of 1.8 Å, as obtained from the full width at half-maximum(FWHM) of the CuAr arc lamp lines used to perform the wave-length calibration, corresponding to 90 km s−1. The angular reso-lution is 0.9 arcsec, as measured from the FWHM of field starsin the acquisition image. This corresponds to 506 pc at thegalaxy.
As the final cube presented unwanted noise, we performed aspatial filtering using the IDL routine bandpass−filter.pro,1 whichallows the choice of the cut-off frequency (ν) and the order of thefilter n. The filtering process does not change the angular resolutionof the data and all measurements presented in the forthcomingsections were done using the filtered cube.
3 R ESULTS
3.1 Large-scale structure and merger stage
IRAS03056+2034 has been spectroscopically classified as a star-burst (Baan et al. 1998) with infrared and OH maser luminositiesof LIR = 1.6 × 10¹¹ L� and log LOH = 1.3 L� (Baan et al. 2008;Kandalian 1996).
Fig. 1 shows the large-scale i-band image of IRAS03056 obtainedwith HST. This image shows a barred spiral galaxy with two sym-metric arms. Two smaller companion galaxies at projected distances
1The routine is available at https://www.harrisgeospatial.com/docs/bandpass -filter.html
MNRAS 479, 3966–3977 (2018)
Dow
nloaded from https://academ
ic.oup.com/m
nras/article-abstract/479/3/3966/5039672 by Universidade Federal do R
io Grande do Sul user on 07 N
ovember 2018

The OH megamaser galaxy IRAS03056 3969
Dec
linat
ion
(J2
000)
Right Ascension (J2000)03 08 31.2 31.0 30.8 30.6 30.4 30.2
20 46 28
26
24
22
20
18
16
14
Figure 2. VLA radio continuum image of IRAS03056 at 20 cm. Thecontour levels are in percentage of the the peak intensity (=10.9 mJybeam−1) and increase in steps of two, with the lowest contour levels being±2.8 per cent.
of roughly 31 kpc and 34.1 kpc from the nucleus of IRAS03056 areseen to the north and to the south-east, respectively.
Haan et al. (2011) studied a sample of 73 nearby (0.01 < z <
0.05) LIRGs and classified the objects into six different mergerstages, based on H-band HST images. Using their classificationscheme, IRAS03056 is classified as type 1 (separated galaxies) andthis group constitutes only 8.3 per cent of their sample.
Our large-scale images exhibit a scenario that, in general,IRAS03056 is a fairly typical example of an LIRG that has lowinfrared luminosity (LIR = 1.6 × 10¹¹ L�) with a wide nuclear pro-jected separation between the nuclear components, however pre-senting composite (starburst + AGN) spectra (see figure 12 andtable 6 of Yuan, Kewley & Sanders 2010). In terms of star for-mation and molecular gas content, it is also important to note thatIRAS03056 is widely similar to (U)LIRGs lying at the high end ofthe linear relation between the surface density of dense moleculargas (as traced by HCN) and the surface density of star formationrate (SFR) with a positive correlation coefficient (see figure 5 andtable 2 of Liu, Gao & Greve 2015).
The two OHM galaxies previously studied by our group (Saleset al. 2015; Hekatelyne et al. 2018) show a more advanced mergerstage than IRAS03056, presenting ‘close binary’ nuclei. In addition,the previously studied galaxies are slightly more luminous (log LIR
≈ 11.5–11.6 L�) than IRAS03056.
3.2 VLA and HST images
Fig. 2 shows the 20 cm continuum image of IRAS03056 obtainedwith VLA. A compact radio source is detected at the nucleus of thegalaxy and no extended emission is seen. We created a (1.425 – 4.86)GHz spectral index image of IRAS03056 and found that the corehas a steep spectral index of −1.02 ± 0.09; this is consistent withoptically thin synchrotron emission that could arise in an AGN jet(Pacholczyk 1970). Moreover, we estimated the brightness temper-ature (TB) of the 1.4 GHz radio core by using the total flux density(=11.7 mJy) and the beam-deconvolved size of the core (=0.51 x0.24 arcsec), as derived from the AIPS Gaussian-fitting task JMFIT,and the TB relation for an unresolved component from Ulvestad,
Antonucci & Barvainis (2005). This turned out to be = 1.8× 10⁵
K, supporting an AGN-related origin (e.g. Berton et al. 2018).The HST images of IRAS03056 are presented in Fig. 3. The left-
hand panels present the broad-band continuum (F814W) image (toppanel) and the narrow-band [N II]+H α image (bottom panel) of theinner 20 × 20 arcsec2 of IRAS03056. The green boxes representthe field of view (FoV) of the GMOS-IFU data. The right-handpanels shows a zoom of the central region of the HST images,corresponding to the GMOS FoV. The HST images were rotated tothe same orientation of the GMOS-IFU data.
The HST continuum image shows the most elongated emissionalong PA ∼ 100/280◦ and presents a structure that seems to beassociated with a spiral arm seen to the north-east of the nucleus.Moreover, the zoomed image (top right panel) shows a strip ofemission that extends from 1 arcsec north to 1 arcsec south of thenucleus.
The H α+[N II] flux distribution is similar to that in the continuumbut shows more clearly the presence of spiral arms, one to the westand another to the south-east of the nucleus. At the central region(bottom right panel), unresolved knots of emission are seen in boththe H α+[N II] and the i-band images, one at 1.5 arcsec north andanother at 1.5 arcsec east of the nucleus.
3.3 Emission-line flux distributions
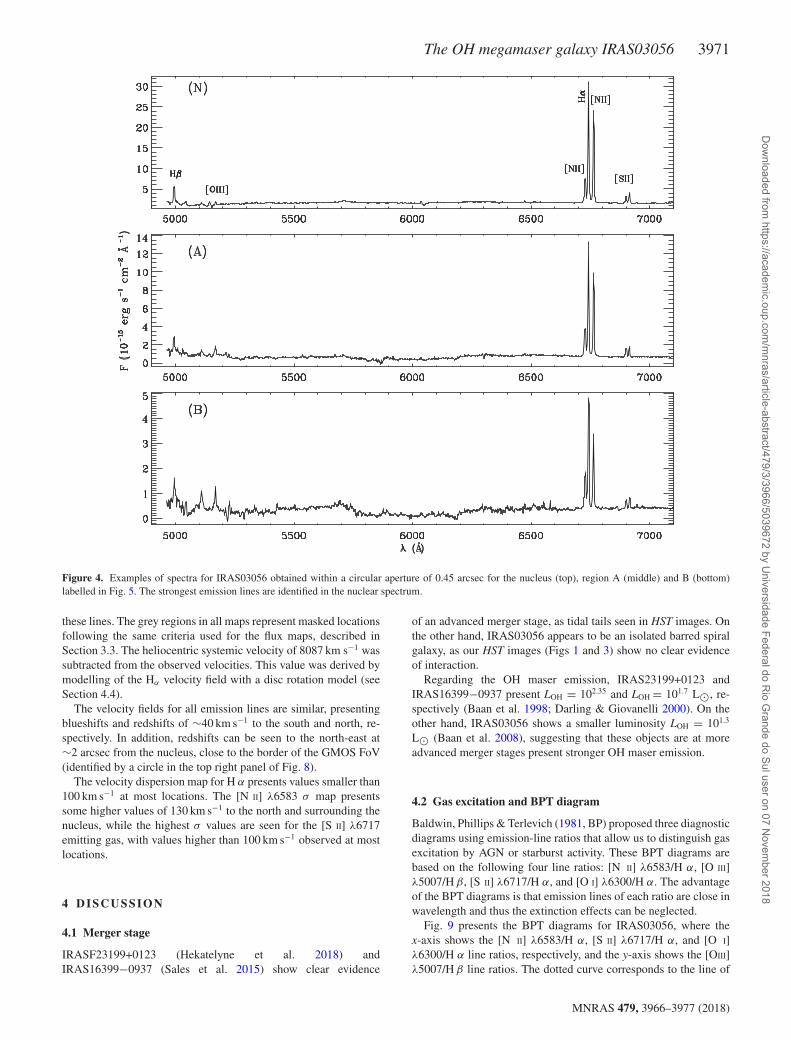
Fig. 4 shows examples of IRAS03056 spectra obtained from theGMOS-IFU data cube for the three locations indicated as blue cir-cles in the top-middle panel of Fig. 5 and labelled as N (nucleus),A (1.5 arcsec east), and B (1.0 arcsec south-west). These spectrawere obtained by integrating the fluxes within circular apertures of0.45 arcsec radius. The strongest emission lines are identified in thenuclear spectrum.
Aiming to map emission-line flux distributions, line-of-sight ve-locity (VLOS), and velocity dispersion (σ ) of the emitting gas, wehave fitted the emission-line profiles of H α, [N II] λ6548,6583, H β,[S II] λ6717, [O I] λ6300 and [O III] λ5007 by Gaussian curves.The fitting procedure was performed using modified versions ofthe line-PROfile FITting (PROFIT) routine (Riffel 2010). This rou-tine performs the modelling of the observed emission-line profileusing the MPFITFUN routine (Markwardt 2009), via a non-linear least-squares fit. The outputs of the routine are the emission-line flux, thecentroid velocity, the velocity dispersion, and their correspondinguncertainties for each emission line.
The fitting process for the [N II] λ6548,6583+H α complex wasperformed simultaneously, considering one Gaussian per line. Dur-ing the fit, we kept tied the kinematics (VLOS and σ ) of the [N II] andfixed the [N II] λ6583/[N II] λ6548 intensity ratio to its theoreticalvalue (3, Osterbrock 1989). The underlying continuum was fitted bya linear equation, constrained by the adjacent continuum regions.
Fig. 5 presents the flux distributions for H α, [N II] λ6583,[S II] λ6717, Hβ, [O III] λ5007, and [O I] λ6300 emission lines.The colour bars show the flux in logarithmic units of erg s−1 cm2
and the grey regions represent masked locations where the signal-to-noise ratio was not high enough to obtain good fits of the emission-line profiles. These locations present flux uncertainty larger than30 per cent. The central crosses mark the location of the nucleus,defined as the position of the peak of continuum emission. H α,[N II] λ6583, and [S II] λ6717 emission-lines flux distributions aresimilar, presenting extended emission over the whole GMOS FoV.One can notice the presence of unresolved knots of emission sur-rounding the nucleus at ∼1 arcsec from it.
MNRAS 479, 3966–3977 (2018)
Dow
nloaded from https://academ
ic.oup.com/m
nras/article-abstract/479/3/3966/5039672 by Universidade Federal do R
io Grande do Sul user on 07 N
ovember 2018

3970 C. Hekatelyne et al.
Figure 3. HST images of IRAS03056. Top panels: left – large-scale image (ACS/HST F814W – i-band); right – zoom of i-band image for the region observedwith GMOS-IFU. Bottom panels: left – large-scale continuum-free H α+[N II] image; right – zoom at the region observed with GMOS-IFU. The green boxesshow the GMOS-IFU FoV (3.5 × 5.5 arcsec) and the colour bars show the fluxes in arbitrary units.
The bottom panels of Fig. 5 show the flux distribution maps forH β, [O III] λ5007, and [O I] λ6300, which are generally detectedonly within a smaller region around the nucleus. As for H α, theH β flux map shows some unresolved knots of emission ∼1 arcsecaway from the nucleus and faint extended emission is seen to up to2 arcsec from it. The [O III] λ5007 emission is detected only veryclose to the nucleus, at distances smaller than 1 arcsec. The [O I]λ6300 emission is also mostly concentrated within ∼1 arcsec of thenucleus.
3.4 Line-ratio maps
The [N II] λ6583/H α, [S II] λ6717/H α, [O I] λ6300/H α, and [OIII] λ5007/H β emission-line flux ratios can be used to investigatethe origin of the line emission. The lines of each ratio above areclose in wavelength and thus the effects of dust extinction can beneglected. Fig. 6 presents the flux ratio maps for [N II] λ6583/H α,[S II] λ6717/H α, [O I] λ6300/H α, and [O III] λ5007/H β.
The [N II] λ6583/H α ratio map is remarkably uniform, present-ing small values of roughly 0.75, except for the regions located tothe north and north-west of the nucleus, close to the borders of theGMOS FoV. The [S II] λ6717/H α map shows constant values of
∼0.2 surrounding the nucleus at ∼1 arcsec, approximately coinci-dent with the ring of enhanced H α emission seen in Fig. 5. Somesmaller values are seen within the ring and values of up to 0.5 areseen at larger distances from the nucleus. The [O I] λ6300/H α ratiomap presents constant values of 0.02 within the inner 1 arcsec. The[O III] λ5007/H β ratio typically has values close to 0.2, but a fewknots show higher values, reaching ∼0.5.
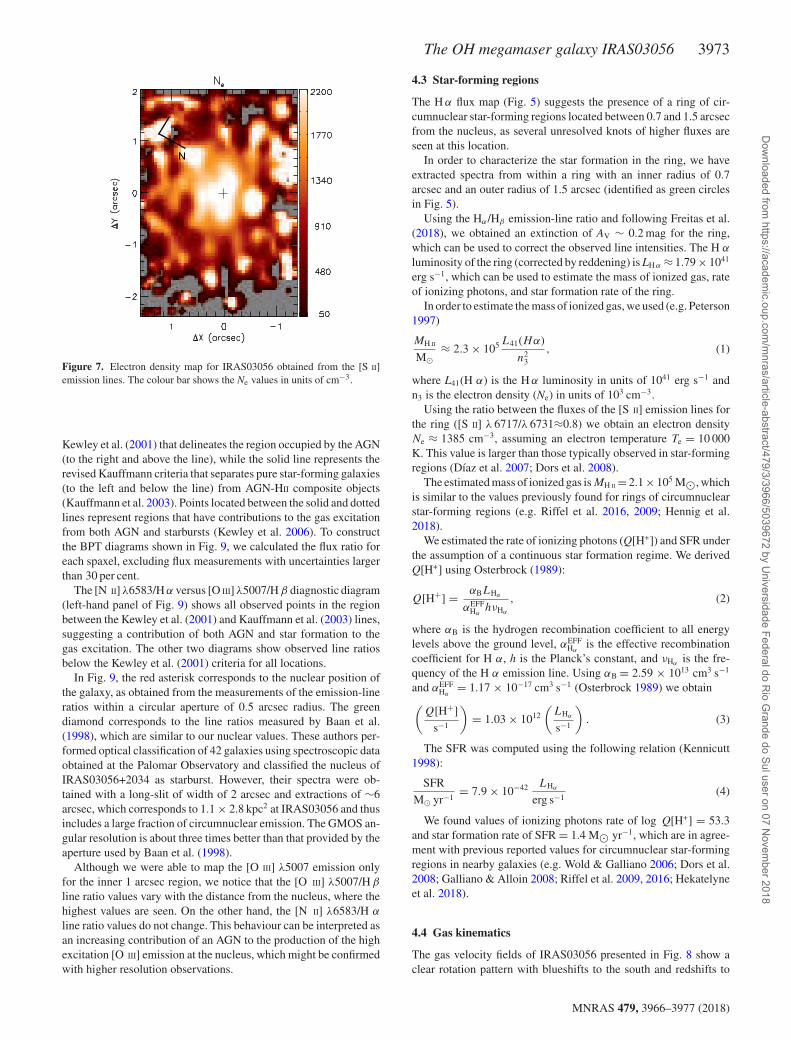
Fig. 7 shows the electron density Ne map, measured from the[S II] λ 6717/λ 6731 line ratio, assuming an electron temperature of10000 K for the ionized gas as input for the temden routine in theSTSDAS.IRAF package. The Ne map shows values ranging from 100to 2200 cm−1, with the highest ones observed at the nucleus and inunresolved structures in its surroundings.
3.5 Gas velocity fields and velocity dispersion maps
Fig. 8 presents the line-of-sight velocity fields (top panels) and thevelocity dispersion maps (bottom panels) for the H α, [N II] λ6583,and [S II] λ6717 emission lines. As the H β, [O III] λ5007, and [O I]λ6300 emission is seen only closer to the nucleus, and the measuredkinematics is similar to that seen in the other lines showing moreextended emission, we do not show the corresponding maps for
MNRAS 479, 3966–3977 (2018)
Dow
nloaded from https://academ
ic.oup.com/m
nras/article-abstract/479/3/3966/5039672 by Universidade Federal do R
io Grande do Sul user on 07 N
ovember 2018
The OH megamaser galaxy IRAS03056 3971
Figure 4. Examples of spectra for IRAS03056 obtained within a circular aperture of 0.45 arcsec for the nucleus (top), region A (middle) and B (bottom)labelled in Fig. 5. The strongest emission lines are identified in the nuclear spectrum.
these lines. The grey regions in all maps represent masked locationsfollowing the same criteria used for the flux maps, described inSection 3.3. The heliocentric systemic velocity of 8087 km s−1 wassubtracted from the observed velocities. This value was derived bymodelling of the Hα velocity field with a disc rotation model (seeSection 4.4).
The velocity fields for all emission lines are similar, presentingblueshifts and redshifts of ∼40 km s−1 to the south and north, re-spectively. In addition, redshifts can be seen to the north-east at∼2 arcsec from the nucleus, close to the border of the GMOS FoV(identified by a circle in the top right panel of Fig. 8).
The velocity dispersion map for H α presents values smaller than100 km s−1 at most locations. The [N II] λ6583 σ map presentssome higher values of 130 km s−1 to the north and surrounding thenucleus, while the highest σ values are seen for the [S II] λ6717emitting gas, with values higher than 100 km s−1 observed at mostlocations.
4 D ISCUSSION
4.1 Merger stage
IRASF23199+0123 (Hekatelyne et al. 2018) andIRAS16399−0937 (Sales et al. 2015) show clear evidence
of an advanced merger stage, as tidal tails seen in HST images. Onthe other hand, IRAS03056 appears to be an isolated barred spiralgalaxy, as our HST images (Figs 1 and 3) show no clear evidenceof interaction.
Regarding the OH maser emission, IRAS23199+0123 andIRAS16399−0937 present LOH = 102.35 and LOH = 101.7 L�, re-spectively (Baan et al. 1998; Darling & Giovanelli 2000). On theother hand, IRAS03056 shows a smaller luminosity LOH = 101.3
L� (Baan et al. 2008), suggesting that these objects are at moreadvanced merger stages present stronger OH maser emission.
4.2 Gas excitation and BPT diagram
Baldwin, Phillips & Terlevich (1981, BP) proposed three diagnosticdiagrams using emission-line ratios that allow us to distinguish gasexcitation by AGN or starburst activity. These BPT diagrams arebased on the following four line ratios: [N II] λ6583/H α, [O III]λ5007/H β, [S II] λ6717/H α, and [O I] λ6300/H α. The advantageof the BPT diagrams is that emission lines of each ratio are close inwavelength and thus the extinction effects can be neglected.
Fig. 9 presents the BPT diagrams for IRAS03056, where thex-axis shows the [N II] λ6583/H α, [S II] λ6717/H α, and [O I]λ6300/H α line ratios, respectively, and the y-axis shows the [OIII]λ5007/H β line ratios. The dotted curve corresponds to the line of
MNRAS 479, 3966–3977 (2018)
Dow
nloaded from https://academ
ic.oup.com/m
nras/article-abstract/479/3/3966/5039672 by Universidade Federal do R
io Grande do Sul user on 07 N
ovember 2018

3972 C. Hekatelyne et al.
Figure 5. Top panels: flux maps for H α (left), [N II] λ6583 (centre), and [S II] λ6717 (left) emission lines of IRAS03056. The green circle delimits a ringwhere we have extracted spectra in order to characterize the star formation. The blue circles labelled as N, A, and B represent the circular regions where weextracted the spectra shown in Fig. 4. Bottom panels: flux maps for H β (left), [O III] λ5007 (centre), and [O I] λ6300 (right). The central crosses in all mapsmark the position of the nucleus and grey regions represent masked locations, where the signal to noise was not high enough to obtain reliable fits of theemission-line profiles or locations with no line detection. The colour bars show the fluxes in logarithmic units of erg s−1 cm−2 per fiber and the grey regionsrepresent masked locations where the signal-to-noise ratio was not high enough to obtain good fits of the emission-line profiles. These locations present fluxuncertainty larger than 30 per cent.
Figure 6. Emission-line ratio maps for IRAS03056. From left to right: [N II] λ6583/H α, [S II] λ6717/H α, [O I] λ6300/H α, and [O III] λ5007/H β flux-ratiomaps. Grey regions correspond to locations where the signal-to-noise ratio was not high enough to measure one or both lines of each ratio map.
MNRAS 479, 3966–3977 (2018)
Dow
nloaded from https://academ
ic.oup.com/m
nras/article-abstract/479/3/3966/5039672 by Universidade Federal do R
io Grande do Sul user on 07 N
ovember 2018
The OH megamaser galaxy IRAS03056 3973
Figure 7. Electron density map for IRAS03056 obtained from the [S II]emission lines. The colour bar shows the Ne values in units of cm−3.
Kewley et al. (2001) that delineates the region occupied by the AGN(to the right and above the line), while the solid line represents therevised Kauffmann criteria that separates pure star-forming galaxies(to the left and below the line) from AGN-HII composite objects(Kauffmann et al. 2003). Points located between the solid and dottedlines represent regions that have contributions to the gas excitationfrom both AGN and starbursts (Kewley et al. 2006). To constructthe BPT diagrams shown in Fig. 9, we calculated the flux ratio foreach spaxel, excluding flux measurements with uncertainties largerthan 30 per cent.
The [N II] λ6583/H α versus [O III] λ5007/H β diagnostic diagram(left-hand panel of Fig. 9) shows all observed points in the regionbetween the Kewley et al. (2001) and Kauffmann et al. (2003) lines,suggesting a contribution of both AGN and star formation to thegas excitation. The other two diagrams show observed line ratiosbelow the Kewley et al. (2001) criteria for all locations.
In Fig. 9, the red asterisk corresponds to the nuclear position ofthe galaxy, as obtained from the measurements of the emission-lineratios within a circular aperture of 0.5 arcsec radius. The greendiamond corresponds to the line ratios measured by Baan et al.(1998), which are similar to our nuclear values. These authors per-formed optical classification of 42 galaxies using spectroscopic dataobtained at the Palomar Observatory and classified the nucleus ofIRAS03056+2034 as starburst. However, their spectra were ob-tained with a long-slit of width of 2 arcsec and extractions of ∼6arcsec, which corresponds to 1.1 × 2.8 kpc2 at IRAS03056 and thusincludes a large fraction of circumnuclear emission. The GMOS an-gular resolution is about three times better than that provided by theaperture used by Baan et al. (1998).
Although we were able to map the [O III] λ5007 emission onlyfor the inner 1 arcsec region, we notice that the [O III] λ5007/H β
line ratio values vary with the distance from the nucleus, where thehighest values are seen. On the other hand, the [N II] λ6583/H α
line ratio values do not change. This behaviour can be interpreted asan increasing contribution of an AGN to the production of the highexcitation [O III] emission at the nucleus, which might be confirmedwith higher resolution observations.
4.3 Star-forming regions
The H α flux map (Fig. 5) suggests the presence of a ring of cir-cumnuclear star-forming regions located between 0.7 and 1.5 arcsecfrom the nucleus, as several unresolved knots of higher fluxes areseen at this location.
In order to characterize the star formation in the ring, we haveextracted spectra from within a ring with an inner radius of 0.7arcsec and an outer radius of 1.5 arcsec (identified as green circlesin Fig. 5).
Using the Hα /Hβ emission-line ratio and following Freitas et al.(2018), we obtained an extinction of AV ∼ 0.2 mag for the ring,which can be used to correct the observed line intensities. The H α
luminosity of the ring (corrected by reddening) is LH α ≈ 1.79 × 1041
erg s−1, which can be used to estimate the mass of ionized gas, rateof ionizing photons, and star formation rate of the ring.
In order to estimate the mass of ionized gas, we used (e.g. Peterson1997)
MH II
M�≈ 2.3 × 10⁵ L41(Hα)
n23
, (1)
where L41(H α) is the H α luminosity in units of 1041 erg s−1 andn3 is the electron density (Ne) in units of 103 cm−3.
Using the ratio between the fluxes of the [S II] emission lines forthe ring ([S II] λ 6717/λ 6731≈0.8) we obtain an electron densityNe ≈ 1385 cm−3, assuming an electron temperature Te = 10 000K. This value is larger than those typically observed in star-formingregions (Dıaz et al. 2007; Dors et al. 2008).
The estimated mass of ionized gas is MH II = 2.1 × 10⁵ M�, whichis similar to the values previously found for rings of circumnuclearstar-forming regions (e.g. Riffel et al. 2016, 2009; Hennig et al.2018).
We estimated the rate of ionizing photons (Q[H+]) and SFR underthe assumption of a continuous star formation regime. We derivedQ[H+] using Osterbrock (1989):
Q[H+] = αBLHα
αEFFHα
hνHα
, (2)
where αB is the hydrogen recombination coefficient to all energylevels above the ground level, αEFF
Hαis the effective recombination
coefficient for H α, h is the Planck’s constant, and νHαis the fre-
quency of the H α emission line. Using αB = 2.59 × 1013 cm3 s−1
and αEFFHα
= 1.17 × 10⁻¹⁷ cm3 s−1 (Osterbrock 1989) we obtain(
Q[H+]
s−1
)= 1.03 × 10¹²
(LHα
s−1
). (3)
The SFR was computed using the following relation (Kennicutt1998):
SFR
M� yr−1= 7.9 × 10−42 LHα
erg s−1(4)
We found values of ionizing photons rate of log Q[H+] = 53.3and star formation rate of SFR = 1.4 M� yr−1, which are in agree-ment with previous reported values for circumnuclear star-formingregions in nearby galaxies (e.g. Wold & Galliano 2006; Dors et al.2008; Galliano & Alloin 2008; Riffel et al. 2009, 2016; Hekatelyneet al. 2018).
4.4 Gas kinematics
The gas velocity fields of IRAS03056 presented in Fig. 8 show aclear rotation pattern with blueshifts to the south and redshifts to
MNRAS 479, 3966–3977 (2018)
Dow
nloaded from https://academ
ic.oup.com/m
nras/article-abstract/479/3/3966/5039672 by Universidade Federal do R
io Grande do Sul user on 07 N
ovember 2018

3974 C. Hekatelyne et al.
Figure 8. Top panels: line-of-sight velocity fields for the H α (left), [N II] λ6583 (centre), and [S II] λ6717 (right) emitting gas. The colour bars show thevelocities in units of km s−1, after the subtraction of the systemic velocity of the galaxy. Bottom panels: velocity dispersion maps for the H α (left), [N II]λ6583 (centre), and [S II] λ6717 (right) emission-lines, corrected for the instrumental broadening. The colour bars show the σ values in units of km s−1. Thecentral cross in all panels marks the position of the nucleus. The circle in the top right panel identifies the region where the inflows are detected.
Figure 9. Left-hand panel: [N II] λ6583/H α versus [O III] λ5007/Hβ diagnostic diagram of IRAS03056. The dotted and dashed lines represent the Kewley andKauffmann criteria, respectively. Central panel: [S II]/Hα versus [O III] λ5007/Hβ diagnostic diagram. Right-hand panel: [O III]/Hα versus [O III] λ5007/Hβ
diagnostic diagram. The red asterisks correspond to the nucleus and the green diamond corresponds to Baan et al. (1998) measurements.
the north of the nucleus. In order to model these kinematics, weused a simple rotation model (van der Kruit & Allen 1978; Bertolaet al. 1991), under the assumption that the gas moves in circularorbits in the plane of the galaxy, subjected to a central gravitationalpotential. In this model, the rotation velocity field is given by
Vmod(R, ψ) = vs+AR cos(ψ − ψ0) sin(i)cosp(i)
{R2[sin2(ψ − ψ0) + cos2(i) cos2(ψ − ψ0)] + c02 cos2(i)} p
2, (5)
where R and ψ are the coordinates of each spaxel in the plane ofthe sky, vs is the systemic velocity of the galaxy, A is the velocityamplitude, ψ0 is the major axis position angle, i is the disc in-clination in relation to the plane of the sky (i = 0 for a face-ondisc), p is a model-fitting parameter (for p = 1 the rotation curve atlarge radii is asymptotically flat while for p = 3/2 the system hasa finite mass), and c0 is a concentration parameter, defined as theradius where the rotation curve reaches 70 per cent of the velocityamplitude.
MNRAS 479, 3966–3977 (2018)
Dow
nloaded from https://academ
ic.oup.com/m
nras/article-abstract/479/3/3966/5039672 by Universidade Federal do R
io Grande do Sul user on 07 N
ovember 2018

The OH megamaser galaxy IRAS03056 3975
Figure 10. Observed H α velocity field (left), rotating disc model (middle), and residual map (right) obtained as the difference between the observed velocitiesand the model. The central cross marks the position of the nucleus, the white regions are masked locations where we were not able to fit the emission lineprofiles, and the dotted lines represent the orientation of the line of nodes.
The fit of this model provides information about the physical pa-rameters of the system, such as the systemic velocity and orientationof the kinematic major axis. Moreover, the residual map (differencebetween the observed velocities and the model) allows us to detectdeviations from pure rotation and identify non-circular motions.
We have chosen the velocity field of the Hα emission line toperform the fit, as this is the brightest line at most locations. Weused the IDL2 routine MPFITFUN (Markwardt 2009) in order to fitthe observed velocity field with equation (5). During the fit, weexcluded the redshifted region to the east of the nucleus, whichclearly does not follow the rotation pattern.
The resulting best-fitting model is shown in the central panelof Fig. 10 and its parameters are A = 40.5 ± 5 km s−1,vs = 8 087 ± 20 km s−1 (corrected to the heliocentric rest frame),0=156 ± 2◦, c0=1.′′9 ± 0.′′4, i = 54◦ ± 3◦. The obtained sys-temic velocity is about 140 km s−1 smaller than that quoted in theNASA/IPAC Extragalactic Database (NED).3 The 0 value is con-sistent with the orientation of the apparent major axis of IRAS03056as seen in the HST i-band image (Fig. 3), and is displaced by about20◦ from the value quoted in NED (135◦) as obtained from 2MASSKS photometry (Skrutskie et al. 2006). The disc inclination is con-sistent with the value shown in NED, obtained from the 2MASSphotometry.
Fig. 10 also presents the observed Hα velocity field in the left-hand panel and residual map in the right-hand panel. The velocityfield presents redshifts to the north and blueshifts to the south, whichare well described by the rotating-disc model, as indicated by theresidual map, which shows values at most locations that are within−10 km s−1 and +10 km s−1, except for a region to the east of thenucleus (close to the border of the GMOS FoV, identified as a circlein Fig. 8), whose kinematics is not reproduced by our model. Atthe same location, the HST H α +[N II] narrow-band image (Fig. 3)shows a strip of enhanced emission, which may be due to a patchyspiral arm.
Considering the observed velocity fields of Fig. 8 and the ori-entation of the spiral arms seen in the bottom left panel of Fig. 3,we conclude that the north-east is the near side of the galaxy disc,
2http://www.harrisgeospatial.com/ProductsandSolutions/GeospatialProducts/IDL.aspx3http://ned.ipac.caltech.edu
while the south-west is the far side of the galaxy, under the as-sumption that the spiral arms seen in IRAS03056 are trailing. Thisassumption is supported by the fact that the vast majority of galax-ies present spiral arms of the trailing type (e.g. Binney & Tremaine2008). Thus, the excess of redshifts seen to the east of the nucleuscan be interpreted as being due to gas-streaming motions along anuclear spiral arm, under the assumption that the gas is located atthe plane of the galaxy. Similar gas inflows along nuclear spiralarms have been previously observed in nearby active galaxies (e.g.Riffel et al. 2008; Muller Sanchez et al. 2009; van de Ven & Fathi2010; Fathi et al. 2013; Riffel, Storchi-Bergmann & Winge 2013;Schnorr-Muller et al. 2014; Luo et al. 2016; Busch et al. 2017).
We can use these residual velocities observed along the nuclearspiral arm to estimate the mass inflow rate. Assuming that the gasis streaming towards the centre, we estimate the mass inflow rate as
Min = Nevπr2mpf , (6)
where Ne is the electron density, v is the inflowing velocity, mp isthe proton mass, πr2 is the area through which the gas is flowing,and f is the filling factor. One can estimate the filling factor using
LHα ∼ f N2e JHα(T )V , (7)
where JH α(V) = 3.534 × 10⁻²⁵ erg cm−3 s−1 (Osterbrock 1989)and LHα
is the Hα luminosity emitted by a region with volume V.We assume that the volume of the inflowing gas region can be
approximated by that of a cylinder with radius r and height h. Thuswe obtain
M = mpvLHα
JHα(T )Neh
. (8)
In order to obtain LH α and Ne, we measured the integrated fluxof H α and the [S II] line ratio within the redshifted region seenin the residual map. The resulting H α flux is FHα ≈ 1.87 ×10⁻¹⁴ erg s−1 cm−2, which corresponds to LHα ≈ 0.3 × 1041 erg s−1
assuming the distance of 116 Mpc for IRAS03056. The mean[S II] λ 6717/λ 6731 ratio for the redshifted region is ∼0.88. Us-ing the temden IRAF task and adopting an electron temperature ofTe= 10000K, we estimate Ne = 988 ± 100 cm−3.
To estimate the mass inflow rate, we assume h = 1 kpc (1.8arcsec), as the distance between the nucleus of the galaxy and theredshifted region (centre of the circle in Fig. 10), as measureddirectly from our maps. The mean inflow velocity is v = 45 km s−1,
MNRAS 479, 3966–3977 (2018)
Dow
nloaded from https://academ
ic.oup.com/m
nras/article-abstract/479/3/3966/5039672 by Universidade Federal do R
io Grande do Sul user on 07 N
ovember 2018

3976 C. Hekatelyne et al.
measured from the residual map and corrected for the inclinationof the disc (i = 54◦, as derived from the rotation model). Theresulting mass inflow rate obtained from equation (8) is M ≈ 2.2 ×10⁻³ M� yr−1. The determination of the uncertainty in M is not aneasy task. Considering the derived uncertainties for i and Ne, weobtain an uncertainty of 3.4 × 10⁻⁴ M� yr−1. The M value derivedfor IRAS03056 is consistent with those of previous estimates ofmass inflow rates in ionized gas for nearby Seyfert galaxies (e.g.Storchi-Bergmann et al. 2007; Muller Sanchez et al. 2009; vande Ven & Fathi 2010; Schnorr-Muller et al. 2011, 2014, 2017a,b;Riffel, Storchi-Bergmann & Riffel 2014).
As speculation, we can estimate the dynamical time (�tin) it takesfor the inflowing gas to move from 1 kpc (the adopted distance) tothe nucleus. Assuming that the inflow has a constant velocity (v =45 km s−1), we obtain �tin ≈ 2 × 10⁷ yr, which is consistent withtypical AGN lifetimes (e.g. Hopkins & Hernquist 2006).
5 C O N C L U S I O N S
We have analysed Gemini GMOS-IFU, VLA, and HST data ofthe galaxy IRAS03056+2034, which is known to host a sourceof OH megamaser emission. The GMOS observations cover theinner 1.7 × 2.5 kpc2 at a spatial resolution of 506 pc and velocityresolution of 90 km s−1. Our main conclusions are
(i) The HST images reveal flocculent spiral arms, evidencingseveral knots of emission along them. Comparing the GMOS-IFUflux distributions with the [N II]+Hα HST image, we associate theseknots with star-forming regions located within a ring with an innerradius of 337 pc and an outer radius of 786 pc.
(ii) The 6 and 20 cm VLA image shows compact radio emissionat the nucleus of IRAS03056. No extended emission is observed.
(iii) Considering the Hα flux of the ring of circumnuclear star-forming regions, we derived that it has a mass of ionized gas of2.1 × 105 M�, ionized photons rate of log Q[H+] = 53.3, and starformation rate of 1.4 M� yr−1.
(iv) Based on emission-line ratios, we conclude that the nucleusof IRAS03056 shows line ratios consistent with the presence ofboth an AGN and starburst activity.
(v) The electron density derived from the [S II] λ6719/λ6731lines reaches values of up to 2200 cm−3 in the nucleus of the galaxy.
(vi) The gas velocity fields show a rotation pattern with the southside of the disc approaching and the north side receding. The ob-served projected velocity amplitude is ∼40 km s−1 and the kine-matic major axis is oriented along 0 = 156◦. The gas kinematicsis well reproduced by a rotating-disc model, assuming circular or-bits in the galaxy plane.
(vii) Besides the rotating-disc component, the gas kinematicsalso reveal an excess of redshifts seen at 1.8 arcsec east of thenucleus with a velocity of 45 km s−1. This component, which ispossibly associated with a patchy nuclear spiral arm seen in theHST image, is located at the far side of the galaxy, and can beinterpreted as inflows towards the nucleus. In this case, we estimatean ionized gas mass inflow rate of 2.2 × 10⁻³ M� yr−1, which issimilar to the inflow rate observed in nearby Seyfert galaxies.
AC K N OW L E D G E M E N T S
We thank the referee for his/her suggestions that improved the pa-per. This work is based on observations obtained at the GeminiObservatory, which is operated by the Association of Universitiesfor Research in Astronomy, Inc., under a cooperative agreement
with the NSF on behalf of the Gemini partnership: the NationalScience Foundation (United States), the Science and TechnologyFacilities Council (United Kingdom), the National Research Coun-cil (Canada), CONICYT (Chile), the Australian Research Council(Australia), Ministerio da Ciencia e Tecnologia (Brazil), and south-east CYT (Argentina). Support for programme HST-SNAP 11604was provided by NASA through a grant from the Space TelescopeScience Institute, which is operated by the Association of Universi-ties for Research in Astronomy, Inc., under NASA contract NAS 5-26555. This research has made use of the NASA/IPAC ExtragalacticDatabase (NED), which is operated by the Jet Propulsion Labora-tory, California Institute of Technology, under contract with theNational Aeronautics and Space Administration. We acknowledgethe usage of the HyperLeda database (http://leda.univ-lyon1.fr). CHthanks CAPES for financial support. RAR and DAS acknowledgesupport from CNPq and FAPERGS.
REFERENCES
Allington-Smith J. et al., 2002, PASP, 114, 892Baan W. A., Salzer J. J., LeWinter R. D., 1998, ApJ, 509, 633Baan W. A., Henkel C., Loenen A. F., Baudry A., Wiklind T., 2008, A&A,
477, 747Baldwin J. A., Phillips M. M., Terlevich R., 1981, PASP, 93, 5Bertola F., Bettoni D., Danziger J., Sadler E., Sparke L., de Zeeuw T., 1991,
ApJ, 373, 369Berton M. et al., 2018, A&A, 614, 36,Binney J., Tremaine S., 2008, Galactic Dynamics, 2nd edn. Princeton Univ.
Press, Princeton, NJBottinelli L., Gouguenheim L., Fouque P., Paturel G., 1990, A&A, 391, 488Busch G., Eckart A., Valencia-S. M., Fazeli N., Scharwachter J., Combes
F., Garcıa-Burillo S., 2017, A&A, 598, 55Darling J., Giovanelli R., 2000, AJ, 119, 3003Darling J., Giovanelli R., 2002, ApJ, 572, 810Darling J., Giovanelli R., 2006, ApJ, 132, 2596de Vaucouleurs G., de Vaucouleurs A., Corwin H. G., , Jr, Buta R. J., Paturel
G., Fouque P., 1991, Third reference catalogue of bright galaxies, version3.9. Springer, New York
Dıaz A. I., Terlevich E., Castellanos M., Hagele G. F., 2007, MNRAS, 382,251
Dors O. L., Storchi-Bergmann T., Riffel R. A., Schmidt A. A., 2008, A&A,482, 59
Fathi K. et al., 2013, ApJ, 770, 27Freitas I. C. et al., 2018, MNRAS, 476, 2760Galliano E., Alloin D., 2008, A&A, 487, 519Haan S. et al., 2011, ApJS, 197, 27Hekatelyne C. et al., 2018, MNRAS, 474, 5319Henkel C., Guesten R., Baan W. A., 1987, A&A, 185, 14Hennig M. G., , Riffel R. A., Dors O. L., Riffel R., Storchi-Bergmann T.,
Colina L., 2018, MNRAS, 477, 1086Hook I., Jorgensen I., Allington-Smith J. R., Davies R. L., Metcalfe N.,
Murowinski R. G., Crampton D., 2004, PASP, 116, 425Hoopes C. G., Walterbos R. A. M., Rand R. J., 1999, ApJ, 522, 669Hopkins P. F., Hernquist L., 2006, ApJS, 166, 1Kandalian R. A., 1996, Astrophys., 39, 237Kauffmann G. et al., 2003, MNRAS, 346, 1055Kennicutt R. C., 1998, ARA&A, 36, 189Kewley L. J., Dopita M. A., Sutherland R. S., Heisler C. A., Trevena J.,
2001, ApJ, 556, 121Kewley L. J., Groves B., Kauffmann G., Heckman T., 2016, MNRAS, 372,
961Lena D., 2014, ApJ, 806, 84Liu L., Gao Y., Greve T. R., 2015, ApJ, 805, 31Lo K. Y., 2005, ARA&A, 43, 625Luo R., Hao L., Blanc G. A., Jogee S., van den Bosch R. C. E., Weinzirl T.,
2016, ApJ, 823, 85
MNRAS 479, 3966–3977 (2018)
Dow
nloaded from https://academ
ic.oup.com/m
nras/article-abstract/479/3/3966/5039672 by Universidade Federal do R
io Grande do Sul user on 07 N
ovember 2018

The OH megamaser galaxy IRAS03056 3977
Markwardt C. B., 2009, in Bohlender D. A., Durand D., Dowler P., eds, ASPConf. Ser. Vol. 411, Astronomical Data Analysis Software and SystemsXVIII. Astron. Soc. Pac., San Francisco, p. 251
Osterbrock D. E., 1989, Astrophysics of Gaseous Nebulae and Active Galac-tic Nuclei. Univ. Science Books, California
Pacholczyk A. G., 1970, Radio Astrophysics. Freeman, San FranciscoPeterson B. M., 1997, An Introduction to Active Galactic Nuclei. Cambridge
Univ. Press, CambridgeRiffel R. A., 2010, Ap&SS, 327, 239Riffel R. A., Storchi-Bergmann T., Winge C., McGregor P. J., Beck T.,
Schmitt H., 2008, MNRAS, 385, 1129Riffel R. A., Storchi-Bergmann T., Dors O. L., Winge C., 2009, MNRAS,
393, 783Riffel R. A., Storchi-Bergmann T., Winge C., 2013, MNRAS, 430, 2249Riffel R. A., Storchi-Bergmann T., Riffel R., 2014, MNRAS, 451, 3587Riffel R. A. et al., 2016, MNRAS, 461, 4192Rossa J., Dettmar R.-J., 2000, A&A, 359, 433Rossa J., Dettmar R.-J., 2003, A&A, 406, 505Sales D. A. et al., 2015, ApJ, 799, 25Sanchez F. M., Davies R. I., Genzel R., Tacconi L. J., Eisenhauer F., Hicks
E. K. S., Friedrich S., Sternberg A., 2009, ApJ, 691, 749Schnorr Muller A., Storchi-Bergmann T., Riffel R. A., Ferrari F., Steiner J.
E., Axon D. J., Robinson A., 2011, MNRAS, 413, 149Schnorr Muller A., Storchi-Bergmann T., Ferrari F., Nagas N. M., 2014,
MNRAS, 438, 3332
Schnorr Muller A., Storchi-Bergmann T., Ferrari F., Nagar N. M., 2017a,MNRAS, 466, 4370
Schnorr Muller A., Storchi-Bergmann T., Ferrari F., Nagar N. M., RobinsonA., Lena D., 2017b, MNRAS, 466, 4370
Skrutskie M. F. et al., 2006, AJ, 131, 1163Storchi-Bergmann T., Dors O. L., Jr, Riffel R. A., Fathi K., Axon D. J.,
Robinson A., Marconi A., Ostlin G., 2007, ApJ, 670, 959Theureau G., Hanski M. O., Coudreau N., Hallet N., Martin J.-M., 2007,
A&A, 465, 71Tody D., 1986, in Crawford D. L., ed., Proc. SPIE Conf. Ser. Vol. 627,
Instrumentation in astronomy VI. SPIE, Bellingham, p. 733Tody D., 1993, in Hanisch R. J., Brissenden R. J. V., Barnes J., eds, ASP
Conf. Ser. Vol. 32, IRAF in the Nineties in Astronomical Data AnalysisSoftware and Systems II. Astron. Soc. Pac., San Francisco, p. 173
Ulvestad J. S., Antonucci R. R. J., Barvainis R., 2005, ApJ, 621, 123van de Ven G., Fathi K., 2010, ApJ, 723, 767van der Kruit P. C., Allen R. J., 1978, ARA&A, 16, 103van Dokkum P. G., 2001, PASP, 113, 1420Wold M., Galliano E., 2006, MNRAS, 369, 47Yuan T.-T., Kewley L. J., Sanders D. B., 2010, ApJ, 709, 884
This paper has been typeset from a TEX/LATEX file prepared by the author.
MNRAS 479, 3966–3977 (2018)
Dow
nloaded from https://academ
ic.oup.com/m
nras/article-abstract/479/3/3966/5039672 by Universidade Federal do R
io Grande do Sul user on 07 N
ovember 2018